1
POLITECNICO DI MILANO
SCUOLA DI INGEGNERIA INDUSTRIALE E DELL’INFORMAZIONE
CORSO DI LAUREA MAGISTRALE IN INGEGNERIA BIOMEDICAASSESSMENT OF PULMONARY REHABILITATION BY COMBINATION OF
INERTIAL SENSORS AND PULSE-OXIMETRY
Relatore: Prof. Andrea Aliverti
Correlatore: Christopher Golby, Ph.D
Tesi di Laurea Magistrale di:
Raffaele di Francia matr. 818086
Martina Paccini matr. 816898
3
Table of Contents
Index of Figures ... 6 Summary ... 17 Sommario ... 22 1. Introduction ... 271.1 Digital Health and Wearable Sensors ... 27
1.2 Existing technologies in pulmonary rehabilitation ... 33
1.3 Movement Sensors ... 36
1.3.1 Accelerometers ... 37
1.3.2 Gyroscopes ... 43
1.3.3 Magnetometers ... 44
1.3.4 Inertial Measurement Unit (IMU) ... 45
1.4 Physiological sensors ... 47
1.4.1 Pulse-oximeter ... 47
1.5 Monitoring systems in Pulmonary Rehabilitation ... 52
1.5.1 Lung Surgery ... 52
1.5.2 Pulmonary rehabilitation program ... 55
4
Aims ... 61
2 Materials & Methods ... 62
2.1 Data acquisition protocol definition ... 62
2.2 Instrumentation... 65 2.2.1 Pulse-Oximeter ... 65 2.2.2 Accelerometer ... 66 2.2.3 BTS G-WALKTM ... 70 2.3 Methods ... 72 2.3.1 Subjects ... 72
2.3.2 Accelerometer Signal Analysis ... 74
2.3.3 Pre-processing ... 75 2.3.4 Frequency Analysis ... 78 2.3.5 Algorithms ... 80 2.4 Comparison analysis ... 87 3 Results ... 90 3.1 Frequency analysis ... 90
3.1.1 Ball Raise Exercise ... 90
3.1.2 Marching Exercise ... 94
3.1.3 Step-up Exercise ... 97
5
3.2.1 Ball Raise Exercise ... 99
3.2.2 Marching Exercise ... 102
3.2.3 Step Up Exercise ... 104
3.2.4 Comparison and Statistical Analysis ... 107
3.3 Comparison analysis ... 112
3.3.1 Signal alignment ... 112
3.3.2 Qualitative analysis ... 115
3.3.3 Quantitative analysis ... 117
4. Discussions ... 124
5. Conclusions and Future Work ... 133
6
Index of Figures
Figure 1.1: general scheme of a smart sensor. ... 27
Figure 1.2: illustration of a remote health monitoring system based on wearable sensors and mobile technologies. Information is gathered from sensors and transmitted to the caregivers via mobile device. The information is then interpreted in order to provide different services. ... 28
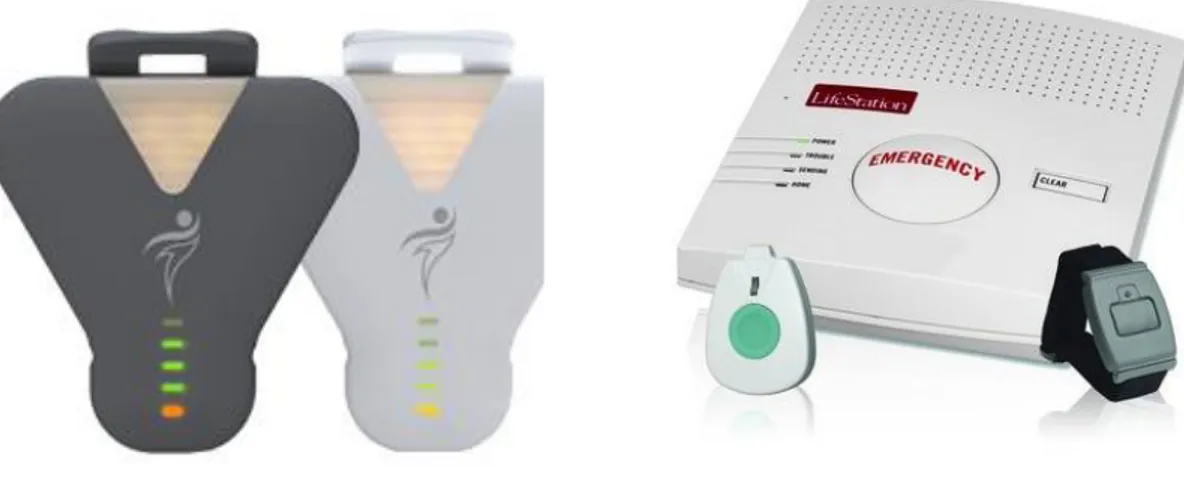
Figure 1.3: commercial systems using accelerometers and barometric sensors to detect falls and provide alarms. Wellcore (left) and MyHalo (right)... 30
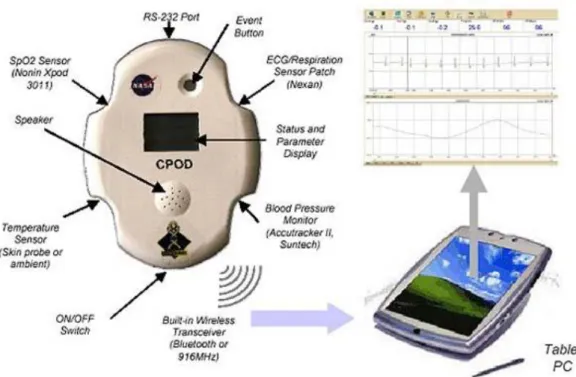
Figure 1.4: LifeGuardTM(NASA) system allows the user to monitor several health signals and to visualize them via mobile device ... 31
Figure 1.5: Sensed wristband developed within AMON project. it measures the basic signals (blood pressure, ECG and oxygen saturation) needed to monitor people with a high cardiovascular risk. ... 32
Figure 1.6: ValedoTM low back pain therapy system, developed by HOCOMA AG, is an example of a home rehabilitation solution. It combines wearable sensors with interactive games, aiming to provide the patient a tool capable to guide him and to give him a feedback and ... 33
Figure 1.7: vivosmartTM +HR (Garmin) ... 34
Figure 1.8: example of portable spirometer... 35
Figure 1.9: results of a spirometer analysis ... 35
7
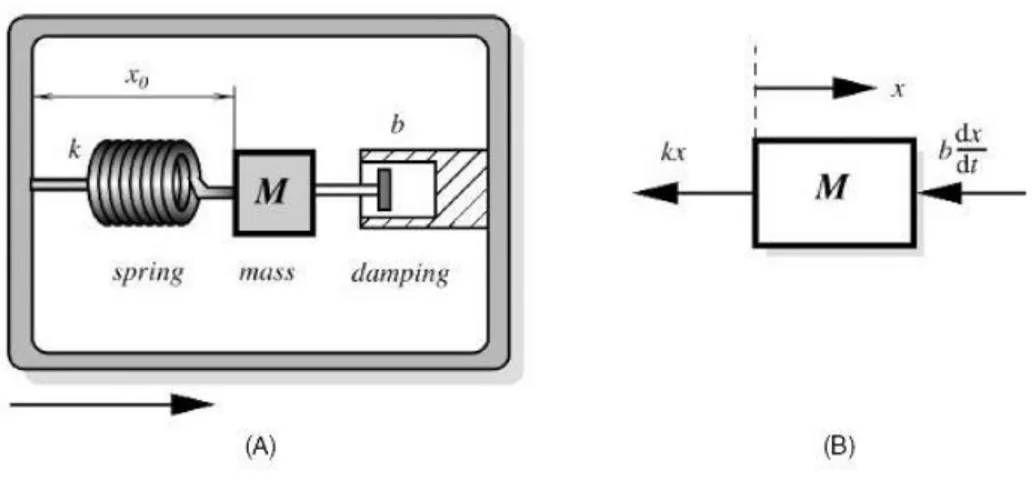
Figure 1.11: general scheme of a mass-spring-damper system modelling an accelerometer
working principle ... 37
Figure 1.12: simplified structure of a MEMS accelerometer ... 40
Figure 1.13: conditioning system of an accelerometer signal ... 42
Figure 1.14: Coriolis force... 44
Figure 1.15: sensor fusion in a IMU (Roetenberg 2006) ... 46
Figure 1.16:hemoglobin dissociation curve ... 47
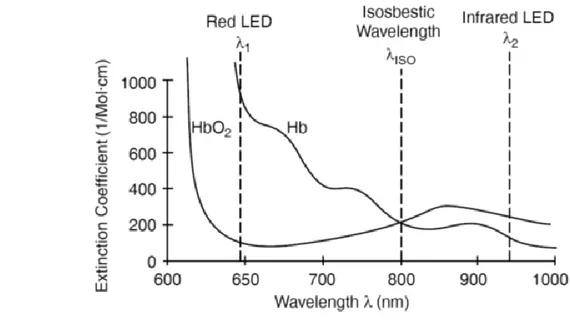
Figure 1.17: Hemoglobin and oxy-hemoglobin absorption spectra ... 48
Figure 1.18: example of transmission pulse oximeter(upper) and reflectance pulse oxymeter(lower) ... 50
Figure 1.19: light absorption in blood and tissue ... 50
Figure 1.20: transmitted AC in infrared and red light ... 51
Figure 1.21: pulse-oximeter calibration curve ... 51
Figure 1.22: relative incidence of the type of lung cancers over smokers and non-smokers. ... 53
Figure 1.23: illustration of the typical incisions in a VATS surgery. ... 54
Figure 1.24: the app interactively teaches the patient about general respiratory physiology (right) and his surgery (left)... 57
8
Figure 1.25: the app advises the patient about possible complications in the rehabilitation
process, due to his comorbidities ... 58
Figure 1.26: the app gives the patient the possibility to choose among a list of exercise, each of them explained via video tutorial ... 58
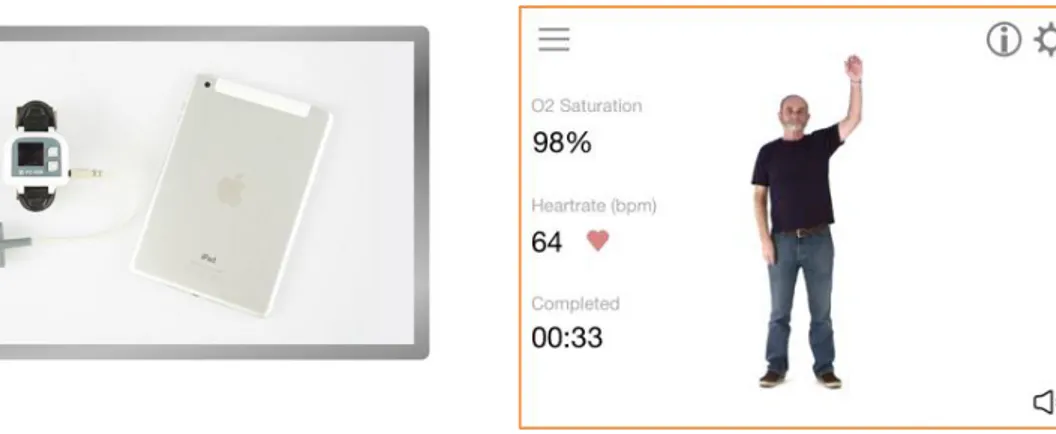
Figure 1.27: the app communicates via Bluetooth® with a pulse-oximeter, which data are displayed on the mobile device. ... 59
Figure 1.28: the app asks the patient to report his perceived breathlessness and the reason of stop exercising. ... 59
Figure 1.29: a session summary appears at the end of each session, reporting information on the length and highlights the physiological data measured by the pulse-oximeter. ... 60
Figure 2.1: data acquisition protocol sequence ... 64
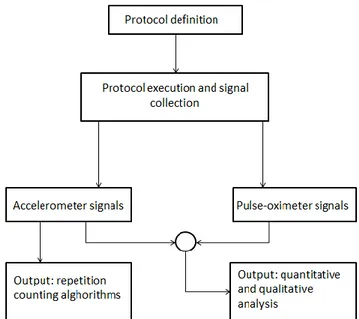
Figure 2.2: methods flow chart ... 64
Figure 2.3: wrist pulse oximeter used for the project ... 65
Figure 2.4: connection of the probe to the wrist unit ... 66
Figure 2.5: Texas instruments wrist watch composed by the Chronos wrist module, the RF access point and the debug interface. ... 67
Figure 2.6: connection of the debugger with the RF access point (13) ... 68
Figure 2.7: emulator’s pin scheme ... 69
Figure 2.8: G-WalkTM (BTS) ... 70
9
Figure 2.10: Low Pass filtered signal with a moving average of 9 samples ... 76
Figure 2.11: the denoised VMU (yellow) is obtained by subtraction of the Drift estimation (orange), computed by the 5th Butterworth order low pass filtered signal, from the original VMU (blue) ... 77
Figure 2.12: frequency analysis on Ball Raise exercise (Wrist Accelerometer) ... 78
Figure 2.13: Frequency analysis on the Marching exercise (BTS G-WalkTM) ... 79
Figure 2.14: frequency analysis on the Step Up exercise (BTS G-WalkTM) ... 79
Figure 2.15: pre-processing logic schema ... 80
Figure 2.16: computation of the time varying treshold ... 80
Figure 2.17: peaks beneath the upper threshold (th1) and above the lower threshold (th2) are removed ... 81
Figure 2.18: peaks under a relative distance are removed ... 82
Figure 2.19: example of exercise related pattern (a) and non exercise pattern (b)... 83
Figure 2.20: difference between signals from the Ball Raise exercise (a) and Marching exercise (b). It is possible to highlight the existence of an axis well related with the movement (z-axis in this case) for Marching exercise ... 84
Figure 2.21: Comparison between uniaxial accelerations. It is noticeable that the less zero crossings the higher SNR and a clearer pattern occur. ... 85
10
Figure 2.23: signal alignment. The constant drop in heart rate (hr) and oxygen saturation (sat) are the replaced signal losses; the constant values in the VMU correspond to the rest phases. ... 88
Figure 2.24: alignment of the signals from healthy subject ... 89
Figure 3.1: axis orientations; z axis is perpendicular to x and y, with direction throughout the paper plane ... 91
Figure 3.2: VMU and its Power Spectrum with the two frequency components (low and high frequency) ... 91
Figure 3.3: x-axis acceleration power spectrum. It is recognizable the low frequency component at 0.35 Hz ... 92
Figure 3.4: y-axis accelration power spectrum. It is recognizable the high frequency component at 0.68 Hz ... 92
Figure 3.5: VMU shows a change of speed at about 55 seconds and in the power spectrum it is possible to spot the different frequencies related to the exercise: the orange spots (low frequency-high frequency) are related to the exercise before 55 seconds, while the ... 93
Figure 3.6: power spectrum for an exercise mirroring the matching between rotational and translational speeds, leading to a single spectral peak... 94
Figure 3.7: power spectrum resulting for subject 8; in this case there is a unique well defined frequency peak. ... 95
Figure 3.8: power spectrum resulting for subject 7; in this case there are different peaks but some are more evident the others ... 96
11
Figure 3.9: power spectrum resulting from subject 10; in this case there are two main peaks clearly evident... 96
Figure 3.10: power spectrum from subject 7; there are different relevant peaks, the one considered is the wider ... 98
Figure 3.11: power spectrum from subject 26; there is just one relevant peak. ... 98
Figure 3.12: VMU signal alignment representation ... 113
Figure 3.13: patient 7 presented an incomplete pulse oximeter session thus the analysis was concentrated on the track regarding Ball Raise and part of the Marching ... 113
Figure 3.14: for subject 5 the track corresponding to Marching is missing thus the exercises present in the VMU signal are Ball Raise and Step Up. Moreover, there are some lacks in the pulse oximeter signals. ... 114
Figure 3.15: patient 4 presented a lack in pulse-oximeter recording in correspondence of the Ball Raise exercise... 114
Figure 3.16: behaviour of heart rate and saturation during exercises. In this case the augment of the heart rate and the decrease of the saturation correspond to what was expected from physiology ... 115
Figure 3.17: behaviour of saturation and heart rate during resting phases. In this case the augment of saturation level and the decrease of heart rate correspond to what is expected from physiology. ... 116
Figure 3.18: different case of behaviour of physiological values: heart rate increase while saturation remains stable ... 116
12
Figure 4.2: Fast Ball Raise Exercise ... 125
Figure 4.3: Step Up: blue: original VMU, orange: filtered VMU ... 126
Figure 4.4: different patterns of the same exercise (Marching) ... 127
Figure 4.5: different patterns of the same exercise (Step Up) ... 128
Figure 4.6: healthy subject pulse-oximetry signal during exercise ... 129
13
Index of Charts
Chart 3.1: reference vs computed repetitions for Ball Raise exercise using the “Double
Threshold” Algorithm ... 99
Chart 3.2: % relative error for “Double Threshold” algorithm. ... 100
Chart 3.3: reference vs computed repetitions for Ball Raise exercise using the “Changing Window” Algorithm ... 101
Chart 3.4: % relative error for “Double Threshold” algorithm. ... 101
Chart 3.5: reference vs computed repetitions for Marching exercise using the “Double Threhsold” Algorithm ... 102
Chart 3.6: % relative error for “Double Threshold” algorithm for Marching exercise. .... 102
Chart 3.7: reference vs computed repetitions for Marching exercise using the “Principal Axis” Algorithm ... 103
Chart 3.8: % relative error for “Principal Axis” algorithm for Marching exercise. ... 104
Chart 3.9: reference vs computed repetitions for Step Up exercise using the “Double Threshold” Algorithm ... 104
Chart 3.10: % relative error for “Double Threshold” algorithm. ... 105
Chart 3.11 ... 105
14
Chart 3.13: comparisons for Ball Raise exercise. DT = Double Threshold, PA = Principal Axis, CW = Changing Window. ... 107
Chart 3.14: comparisons for Marching exercise. DT = Double Threshold, PA = Principal Axis, CW = Changing Window. ... 108
Chart 3.15: comparisons for Step Up exercise. DT = Double Threshold, PA = Principal Axis, CW = Changing Window. ... 108
Chart 3.16: comparisons for Ball Raise exercise. DT = Double Threshold, PA = Principal Axis, CW = Changing Window. ... 109
Chart 3.17: comparisons for Marching exercise. DT = Double Threshold, PA = Principal Axis, CW = Changing Window. ... 110
Chart 3.18: comparisons for Step Up exercise. DT = Double Threshold, PA = Principal Axis, CW = Changing Window. ... 110
Chart 3.19: quantitative analysis of patients’ response to the protocol execution ... 118 Chart 3.20: a) Average heart rate response to the protocol execution b) Average SpO2 response to the protocol execution c) exercise intensity levels of the protocol extracted from wrist acceleration d) exercise intensity levels of the protocol, extracted from waist acceleration. BR: Ball Raise, M: Marching, S: Step Up. ... 120
15
Index of Tables
Table 2.1: G-WalkTM main features (15) ... 71
Table 2.2: subjects data ... 73
Table 3.1: results in terms of relative percentage error ± standard deviation. DT = Double Threshold, PA = Principal Axis, CW = Changing Window. BR = Ball Raise, M= Marching, S= Step Up. ... 109
Table 3.2: results of the comparisons made by ANOVA testing. BR=Ball Raise, M=Marching, S=Step Up ... 111
Table 3.3: 30 seconds’ average values for VMU, Heart Rate and saturation for each patient ... 117
Table 3.4: 30 seconds’ average values for VMU, Heart Rate and saturation for each healthy subject ... 119
Table 3.5: comparisons on patients and healthy subjects between heart rate at rest and during exercise. S= Stepup, B= Ball Raise, M= Marching. ... 121
Table 3.6: comparisons on patients between VMU (wrist)at rest and during exercise. S= Stepup, B= Ball Raise, M= Marching ... 122
Table 3.7: comparisons on healthy subjects between VMU (wrist) at rest and during exercise. S= Stepup, B= Ball Raise, M= Marching ... 122
Table 3.8: comparisons on healthy subjects between VMU (waist) at rest and during exercise. S= Stepup, B= Ball Raise, M= Marching ... 123
17
Summary
Digital Healthcare is, nowadays,the most attractive and explored field from caregivers, at different levels. Indeed, continuous growth of sensor technologies gave the possibility to develop solutions well acceppted from customers/patients and cost effective togheter. Digital Healthcare involves all the technologies capable to provide objective data on different levels of the healthcare system, ranging from the management to the patient care. Many of the solutions, currently in the market, take inspiration from the great success of wearable sensorized devices in the field of daily physical activity and wellbeing monitoring (Bouten 1997) (Medical international Research n.d.). It is the case of devices such as activity monitors or wristbands. Moreover, literature is rich of studies involving the usage of motion sensors, such as accelerometers and gyroscopes, for a great variety of purposes, ranging from falls’ detection to new challenging ideas, such as early prediction of epileptic attack (Beniczky and al. 2013) (Bamberg 2008). On the other hand, motion sensors are largely used in a clinical environment, such as for Gait Analysis (Li 2009). But there is more. Improvements in sensor technologies, in terms of accuracy of the measurement and affordability, made the measurement of physiological vital signals (heart rate and oxygen saturation) possible, even in a non-clinical environment, by means of wrist oximeters. It follows that, along with the portability and usability of smartphones and tablets, these sensors could represent a reliable way for remote monitoring, in the context of the healthcare services. With this point of view, United Kingdom’s National Health System, in particular the NHS Foundation Trust of Heartlands Hospital, settled in Birmingham, launched a new research through the pulmonary rehabilitation. In general, a pulmonary rehabilitation is an outpatient program involving exercise, education and support, aimed to improve respiratory patients’ daily life. As a matter of facts, respiratory patients, because of their disease, lose out a significant reduction of their respiratory function, which can be partially recovered by means of appropriate lifestyle and, overall, of continous physical activty. Moreover, surgery patients, who undergo surgery because of lung cancer, come across an important reduction of their motor function. Therefore, pulmonary rehabilitation represents the most effective for patients to cope with their condition. In particular, the program involves a series of exercises, mirroring patients daily activities, such as walking or climbing stairs, that patients
18
should carry out in two different environments. On one hand supervised sessions are held in hospital classess, where physiotherapist can directly assess patients’ needs and imrovements. On the other hand, it is vital for patients, and for a better outcome of the program, to go through home based physical activity sessions. The main issue with these sessions is the impossibility to guide and monitor the patient. In this context, Rehabilitation for Operated lung Cancer (ROC) was born. ROC project, by Heartlands Hospital, basically aims to shape a patient centered service of pulmonary rehabilitation in terms of patient’s involvement, education, accessibility of the service and quality. In particular, one of the biggest aims of the project is to improve the outcomes coming out from the home based unsupervised sessions. Along with this necessity, a mobile application was developed, in the context of the ROC project. The app is interfaced with a pulse-oximeter. With this tool, one one hand patients can be guided through their sessions by means of video tutorials on the exercises and the resume of their session can be monitored thanks to the measurements of the oximeter. However, a quantitative feedback on the adherence and on the quanitity and quality of physical activity is missing. Thus, the aim of the current project, carried out with the collaboration of the University of Warwick, is to evaluate the feasibility and reliability of providing a quantitative of patient’s physical activity, by adding an accelerometer at the existing tool. Not only, the project aims to merge togheter both information given by the accelerometer and by the pulse-oximeter, in a way that could be useful to physicians to keep track of patients’improvements and needs. The study involved two clusters of volunteer participants. The former consisted of a sample of 27 healthy subject, 17 males and 10 females, aged between 24 and 60 years. The latter included 10 respiratory patients, who undergo surgery for lung cancer. Each participant worn a wrist oximeter and a wrist triaxial accelerometer on the controlateral forearm and was asked to perform a protocol. Specifically, data acquisition protocol was developed, simulating a physical activity sessions, and the movement’s information is provided in terms of repetitions made by the subject. The protocol involved three of a longer list of exercises, designed and thought ad
hoc for patients and mirroring daily life actions, such as walking or climbing stairs. The
protocol was designed in order to obtain an increasing level of difficulty, in terms of physical activity.
19
Exercises were:
1. Ball Raise exercise: it involved the repetitive motion of the upper limbs, in which the subject repeatedly raised a ball;
2. Marching exercise: the subject was asked to march on its place;
3. Step Up exercise: the subject was asked to go up and down from a step.
Each exercise lasted approximately 3 minutes and was followed by a resting phase of additional 3 minutes, so that it was possible to study the temporal response of oxygen saturation and heart rate. The information coming out from the accelerometer was then processed for two purposes: on one hand the signal was used for counting repetitions. On the other hand, averaged values of the acceleration signal were used for multiple comparisons with heart rate and oxygen saturation. Algorithms for counting repetitions/steps were developed with a real time perspective, thus involving simple computations, since the main aim of the project is to evaluate the feasibility of a monitoring system, which has to work in real or quasi real time. Therefore, a proper preprocessing of the signal were made, building simple filters, consisting of moving averages and Low Pass Butterworth filters, with parameters chosen according to an accurate frequency analysis of the signals. The acceleration signal mostly used for processing was the Vecture Magintude Unit, which was found to be the most used processed signal for similar purposes (Bouten 1997) (G. e. Steele 2000):
𝑉𝑀𝑈 = √𝑥2 2 + 𝑦2+ 𝑧2
.
The algorithms developed were three and share common features. Firstly, all of them are fed by successive portions (windows) of signal, mirroring a quas-real time situation. The dimension of the windowing was chosen so that it could embrace each complete movement, ranging from 0.25 to 2.5 Hz for each exercise. Secondly, each algorithm was structured by a series of decision rules based on adaptive thresholding and zerocrossings. While two of the three algorithms process the windowed VMU, the other one is fed by the uni axial windowed acceleration, where the best axis is the one where the less zerocrossings occur.
20
Movement peaks are identified when a crossing occurs over an upper threshold and another occurs under a lower threshold. The threshold is mainly based on the variation of a moving subsample of the windowed signal. Successively, in order to obtain a reliable comparison among VMU, oxygen saturation and heart rate, averaged values of the three signals on the last 30 seconds of each exercise were considered for each patient. Moreover, the baseline values for each patient were obtained by averaging heart rate and oxygen saturation over the 30 seconds before the beginning of the protocol. Therefore, in order to observe an average behaviour of the group of patient during the protocol, averaged values of patients were averaged over exercise. Thus, results were presented for repetition’s counting and multimodal comparison. Results for algorithms were shown in terms of relative percentage error of estimation, and in terms of computed versus reference repetitions, acquired from two observers in the laboratory. Moreover, a statistical analysis was conducted by means of
ANOVA test, in order to highlight differences between algorithms and exercises with respect
to the percentage relative estimation error. For multimodal comparison, charts were obtained, highlighting the patterns of the temporal evolution of the averaged signals for subsequent analysis. Results shown promising findings. On one hand it was possible to obtain, for each exercise, an estimation of the repetitions more or less accurate. The Ball
Raise exercise was found to be the most comfortable signal to process, while the Step Up
exercise gave the worst signals in terms of noisiness, because of the high freedom of the sensed forearm to make non-exercise movement. Marching exercise was highly influenced by the constraint to march on place, often giving back very weak signals when subject executed the exercise with their arms still. Nevertheless, the most of the Marching exercise signals shown a more or less clear pattern. Minimum error in estimation was reached for
Ball Raise exercise (1.015 %). results reached by the analysis of variance suggest a refining
of the algorithms in order to uniform as much as possible the variance of the error of estimation over the sabìme algorithm for each exercise, stated that a significant difference between Ball Raise and the other two exercise exists and it was found even by means of
ANOVA. Results given by the multimodal comparison on patients’ signals showed expected
patterns, where oxygen saturation decreases dramatically and heart rate increases, when exercise difficulty and physical effort incresaes. Such informations could be very valuable for physicians and physiotherapists in order to clarify each patient’s path during a
21
pulmonary reahbilitation program. This preliminary study aims to be the start for further works, where a prototype of a single device, embedding both the oxymeter and the accelerometer, could be created and interfaced with the app, in order to test the algorithms and manage the information to give back.
22
Sommario
Al giorno d’oggi il campo più interessante ed esplorato, a differenti livelli, dalle figure professionali in ambito sanitario, è quello del Digital Healthcare. È inevitabile, infatti, che il continuo sviluppo tecnologico dei sensori permetta di sviluppare soluzioni che siano, al tempo stesso, soddisfacenti per consumatori e pazienti ed economicamente convenienti. Il campo del Digital Healthcare racchiude in sè tutte le tecnologie in grado di fornire dati oggettivi ai diversi livelli del sistema sanitario, dal management fino alla cura diretta del paziente. Molte delle soluzioni attualmente sul mercato, nell’ambito del monitoraggio del benessere, prendono ispirazione dal grande successo dei dispositivi costituiti da sensori indossabili. Un esempio può essere quello dei sistemi di monitoraggio dell’attività giornaliera o degli orologi sensorizzati. Inoltre, la letteratura è ricca di studi riguardanti l’uso di sensori di movimento, come accelerometri e giroscopi, utilizzati per una grande varietà di scopi, dalla rilevazione di cadure a nuove stimolanti idee, come la predizione anticipata di attacchi epilettici. D’altra parte, i sensori di movimento son ampiamente diffusi nell’ambiente clinico come, ad esempio , nell’analisi del cammino. A tutto ciò si devono aggiungere i progressi delle tecnologie dei sensori che, in termini di accuratezza della misura e di accessibilità, rendono possibile la misura di segnali fisiologici vitali (battito cardiaco e saturazione), anche in ambiente non clinico grazie all’utilizzo di pulsossimetri indossabili. Se ne deduce che, insieme alla portabilità e fruibilità di smartphone e tablet, questi sensori possono rappresentare una strategia di monitoraggio in remoto molto affidabile anche nell’ambito dei servizi sanitari. Da questo punto di vista, il Sistema Sanitario del Regno Unito (NHS), ed in particolare l’ NHS Foundation Trust of Heartlands Hospital, con sede a Birmingham, ha lanciato una nuova ricerca nell’ambito della riabilitazione polmonare. In generale, si parla di riabilitazione polmonare riferendosi ad un programma ambulatoriale che comprende esercizi, informaizone e supporto, allo scopo di migliorare la qualità della vita dei pazienti con problemi respiratori. Di fatto i pazienti respiratori, a causa delle loro malattie, sono soggetti ad una rilevante perdita delle funzioni respiratorie, che possono essere parzialmente recuperate attraverso un appropriato stile di vita e, soprattutto, attraverso una costante attività fisica. Inoltre i pazienti che si sono sottoposti ad un intervento a causa di cancro ai polmoni, vanno incontro ad una importante riduzione delle loro funzioni
23
motorie. Quindi, la riabilitazione polmonare rappresenta la via più efficace per far fronte alla loro condizione. In particolare il programma prevede una serie di esercizi, che rispecchino gesti svolti durante le attività della vita quotidiana, come camminare, salire le scale ed altri ancora. I pazienti devono svolgere tali esercizi in due ambienti diversi. Da una parte partecipano a sessioni supervisionate tenute in ospedale, dove i fisioterapisti possono stabilire direttamente le necessità e i miglioramenti dei pazienti. Dall’altra è vitale per il paziente , e per un miglior risultato del programma, svolgere sessioni di attività fisica a casa. Il problema principale di quest’ultimo tipo di sessioni è l’impossibiltà di guidare e monitorare il paziente. In questo contesto è nato il progetto Rehabilitation for Operated lung Cancer (ROC), nell’ospedale Heartlands. Lo scopo è quello di realizzare un servizio di riabilitazione polmonare centrato sul paziente, in termini di coinvolgimento, educazione , accesibilità e qualità del servizio. In particolare, uno dei maggiori obiettivi del progetto è quello di migliorare i risultati delle sessioni non supervisionate casalinghe. Data questa necessità, è stata sviluppata una mobile application nel contesto del ROC project. Tale app si interfaccia con un pulsossimetro. Grazie ad essa il paziente viene guidato nella sua sessione mediante video tutorial riguardanti l’esercizio e il resoconto della sessione può essere monitorato grazie all’ossimetro. Tuttavia, manca all’attuale stato dello sviluppo, un feedback quantitativo sull’aderenza, sulla quantità e sulla qualità dell’attività fisica svolta. Per questo lo scopo del progetto discusso in questa tesi, condotto in collaborazione con l’Università di Warwick, è quello di valutare la fattibilità e l’affidabilità di eventuali informazioni quantitative riguardanti l’attività fisica del paziente, ricavate attraverso l’aggiunta un accelerometro. Il progetto, inoltre, si pone l’obiettivo di unire insieme le informazioni fornite dall’accelerometro e dal pulsossimetro, in modo che possano essere utili ai i medici per tener traccia delle necessità e dei miglioramenti del paziente.
Lo studio ha riguardato due gruppi di partecipanti volontari. Il primo costituito da un campione di 27 soggetti sani, 17 maschi e 10 femmine di etò compresa tra i 24 e i 60 anni. Il secondo costituito da 10 pazienti respiratori, che hanno subito un intervento a seguito di cancro polmonare. Ciascun partecipante ha indossato un accelerometro triassiale su un polso ed un pulsossimetro sul polso controlaterale, durante lo svolgimento di un protocollo. Questo, nello specifico, è stato pensato sviluppato in modo che simulasse una sessione di
24
attività fisica e l’informazione sul movimento è stata fornita in termini di ripetizioni svolte dal soggetto. Tale protocollo comprende tre di una lunga lista di esercizi, studiati e pensati
ad hoc per i pazienti, in modo che rispecchino situazioni della vita quotidiana e in modo che
gli esercizi siano in ordine crescente di difficoltà, in termini di attività fisica. Gli esercizi scelti sono stati:
1. Sollevamento della palla:riguarda un movimento ripetitivo deli arti superiori in cui il soggetto porta una palla prima in avanti e poi in alto;
2. Marcia sul posto;
3. Salita e discesa da un gradino un piede alla volta.
Ciascun esercizio doveva durare approssimativamente 3 minuti, seguito da una fase di riposo di 3 minuti, in modo che fosse possibile studiare la risposta temporale di saturazione dell’ossigeno e battito cardiaco. L’informazione uscente dall’accelrometro è stata successivamente processata per due scopi: da una parte per contare le ripetizioni, dall’altra valori medi del segnale di accelerazione sono stati usati per confronti mutlipli con battito cardiaco e saturazione dell’ossigeno. Gli algoritmi per contare le ripetizioni sono stati sviluppati in una prospettiva real time, quindi riguardanti operazioni semplici, dato che lo scopo principale del lavoro è quello di valutare la fattibilità di un sistema di monitoraggio che lavoei anch’esso in real o quasi-real time. Per questo è stato svolto un opportuno pre-processing del segnale, costruendo un semplice filtro, costituito da una media mobile e un filtro Butterworth passa basso, con parametri scelti in sseguito ad una accurata analisi in frequnza dei segnali. Il segnale di accelerazione usato per il processing è stato il VMU Vecture Magintude Unit, che è risultato essere il più usato per scopi simili.
𝑉𝑀𝑈 = √𝑥2 2 + 𝑦2+ 𝑧2
.
Gli algoritmi sviluppati sono stati tre ed hanno alcune caratteristiche in comune. Per iniziare, tutti quanti prendono in ingresso porzioni successive ( finestre ) di segnale , rispecchiando una situazione quasi real time. La dimensione della finestra è stata scelta in modo che potesse contenere ciascun movimento completo, andando da 0.25 a 2.5 Hz per ogni esercizio. In
25
secondo luogo , ciascun algoritmo è stato strutturato da una serie di regole di decisione basate su una sognlaitura ed uno zero.crossing adattabili. Due di tre algoritmi processano il VMU finestrato, l’altro considera l’accelerazione uniassiale finestrata, dove l’asse migliore è quello in cui avvengono meno attraversamenti dello zero. I picchi dei movimenti sono identificati nrl momrnto in cui avviene la succesisone di un attraversamento sopra una soglia superiore ed un altro sotto una soglia inferiore. La scelta della sogliatura si basa principalmente sulla variazione su un sottocampionamento mobile del segnale finestrato. Successivamente, per ottenere una affidabile comparazione di VMU, saturazione dell’ossigeno e battito cardiaco, sono stati calcolati i valori medi del segnale negli ultimi 30 secondi di ciascun esercizio per ciascun paziente. Inoltre i valori di baseline per ogni paziente sono stati ottenuti mediando battito e saturazione nell’arco di 30 secondi della fase inziale di riposo del protocollo. Quindi per poter apprezzare un comportamento medio del gruppo dei pazienti durante il protocollo, tali valori, calcolati come appena descritto, sono stati mediati su ciascun esercizio specifico. Finita questa fase sono stati presentati i risultati per il conteggio delle ripetizioni e per l’analisi multimodale. I risultati sugli algoritmo sono stati mostrati in termini di percentuale relativa dell’errore di stima ed in termini di ripetizioni contate rispeyyo al numero di ripetizioni di riferimento, acquisite da due osservatori nel laboratorio. Successivamente è stata condotta un’ analisi statistica attrverso un test ANOVA , in modo da sottolineare le differenze tra gli algoritmi e gli esercizi rispetto all’errore relativo percentuale di stima. Per quanto riguarda l’analisi multimodale, sono stati ottenuti dei grafici, sottolineanti i pattern dell’evoluzione temporale dei segnali mediati, per ogni analisi. I risultati mostrano interessanti sviluppi. Da una parte è stato possibile ottenere, per ogni esercizio, una stima delle ripetizioni più o meno accurata. L’esercizio di sollevamento della palla si è rivelato l’esercizio più comodo da processare, mentre lo Step Up è stato l’esercizio peggiore in termini di rumore, a causa dell’alta liberta di movimento dell’avambraccio che ha portato a movimenti di non-esercizio. Il Marching è stato fortemente influenzato dal vincolo della marcia sul posto, che ha protato ad avere segnali molto deboli nel caso in cui il soggetto analizzato mostrasse solo un accenno di movimento delle braccia. Tuttavia la maggior parte dei segnali di Marching mostrano un pattern più o meno chiaro. Il minimo errore di stima è stato raggiunto con l’esercizio di sollevamento della palla (1.015%). I risultati ragginti dall’analisi della varianza suggeriscono una rifinitura degli algoritmi in
26
modo da uniformare il più possibile la varianza dell’errore di stima dello stesso algoritmo per ogni esercizio. Detto ciò, esiste, ed è stata riscontrata dal test ANOVA, una significativa differenza tra l’esercizo di sollevamento della palla e gli altri due. I risultati forniti dalla comparazione mltimodale sui segnali dei pazienti hanno mostrato I pattern attesi, dove la saturazione dell’ossigeno diminuisce drasticamente e il battito caridaco aumenta. Queste informazioni potrebbero esser molto utili a medici e fisioterapisti allo scopo di chiarificare il cammino di ciascun paziente durante la riabilitazione polmonare. Questo studio preliminare si pone lo scopo di essere l’inizio di lavori futuri, dove un prototipo di un singolo dispositivo possa essre creato ed interfacciato con l’applicazione esitente, in modo da testare gli algoritmi e gestire le informazioni da fornire.
27
1. Introduction
1.1 Digital Health and Wearable Sensors
Nowadays, the growth of sensor technologies addressed the market through innovative and smart solutions, aimed to improve user’s life quality. These solutions basically range from the simple physical activity self-management to more complex healthcare systems, capable to monitor patient’s health status, in a non-clinical environment (Patel 2012) (Gulley 2011). Wearable smart sensors represent the way the previous aims are tackled. A smart sensor is a device that provides a high reliable digital or quasi-digital measure of the physical quantity, thanks to the combination of signal conditioning and signal processing stages along with the sensing element, as depicted in figure 1.1.
Figure 1.1: general scheme of a smart sensor.
Therefore, the sensor is somewhat “smart” because of the preliminary signal processing carried out by the relative stage. The conditioning stage usually contains three sub-stages: a conditioning circuit, an amplification circuit and an Analog-to-Digital Converter (ADC). Moreover, along with the possibilities given by the previous sensors, even the increasing development of mobile technologies (e.g. smartphones and tablet) brought companies and
28
health systems to invest money on this new frontier of digital healthcare. Summing up, digital healthcare includes all the technology solutions aimed to, on one hand, self-manage and self-monitor the personal health status and, on the other hand, to improve healthcare services in terms of delivery, cost reduction, quality enhancement and, last but not least, personalized and more precise medicine (Patel 2012) (Gulley 2011). It is remarkable to underline that the research and the available solutions are continuously evolving, leading to challenging and unexpected results. Concerning the improvement of the healthcare services, the main question digital healthcare aims to tackle is “is it possible to build a patient centered medicine in a daily and familiar environment, outside the labs and the hospital?” Therefore, wearable sensors, combined with the mobile technologies, offer the proper answer to the previous question thanks to the remote monitoring systems. The idea behind them is depicted in figure 1.2. Briefly, sensors gather the measurements from the patient (e.g. heart rate, respiratory rate and motion); these measurements, thanks to a mobile device, are processed and delivered at different caregivers, which assist the patient according to the feedback coming out from the sensors.
Figure 1.2: illustration of a remote health monitoring system based on wearable sensors and mobile technologies. Information is gathered from sensors and transmitted to the caregivers via mobile device. The
29
From the scheme in figure 1.2 various requirements come out. Firstly, it is mandatory to develop solutionswhich are simultaneously: as much handy and precise and as less invasive as possible, depending on the complexity of the output being measured. Secondly, it is not uncommon that the data should be provided on a real-time perspective. Consequently, the algorithms used to process the data need to be fast and, in the same time, robust, capable to adapt to the variability, which is very significant in a non-clinical environment. Lastly, it is important to underline that a solution with sensed devices can provide direct and/or indirect (estimated) measurements, which require to be processed for various purposes (e.g. alarms, data integration and explications for clinicians). In general, the measurements provided by a wearable sensor consist of movement and physiological data, such as heart rate, respiratory rate or blood oxygen saturation. A wearable monitoring system can embed multiple sensors in order to provide integrated information and address different purposes, which can be summarized into five macro areas:
1. Early detection of disorders; 2. Safety monitoring;
3. Assessment of treatment efficacy; 4. Health and Wellness monitoring; 5. Home rehabilitation.
Early detection of disorders is an area of growing interest, and, nowadays, research is investigating many different diseases. In the respiratory field, for example, wearable movement sensors, combined with activity monitors, showed significant results in predicting episodes of dyspnea and cough in patients affected by chronic obstructive diseases (Patel 2012) (Moy, Mentzer and Reilly 2003) (Sherril 2005). Moreover, management of patients with dementia involves the usage of wearable sensors applied on the patient and in the bed. Therefore, the analysis of the sleep patterns leads to a precise identification of the grade of the diseases, helping the physician to design an effective cure (Haiying 2010). Furthermore, detecting falls and relaying alarms to caregivers represent an example on how wearable sensors provide a solution in terms of safety monitoring. Indeed, many systems, involving the usage of acceleration and barometric sensors, such as
30
WellcoreTM and MyHaloTM (fig.1.3), are nowadays well accepted and widely used. (Patel 2012) (Wellcore n.d.) (Nyan 2008)
Figure 1.3: commercial systems using accelerometers and barometric sensors to detect falls and provide alarms. Wellcore (left) and MyHalo (right).
Another interesting application of wearable sensors resides in the evaluation of a treatment efficacy. This is particularly true with regard of the treatment of Parkinson’s disease. The monitoring system, which sensing part is composed basically by one or more accelerometer, aims to quantify the severity of dyskinesia in the patient. Briefly, dyskinesia is a motor disorder, rising as a side effect of medication intake. Quantifying its severity helps physicians in prescribing the proper dose of medication. Monitoring systems are then preferred at patient’s diaries, since they provide objective and reliable measurements, because of a demonstrated strong correlation between the accelerometer output and the severity of dyskinesia in patient affected by Parkinson disease. (Patel 2012) The power and the efficacy of sensed monitoring systems are largely demonstrated in the field of health and wellness monitoring. This comes out from the need of national health systems to cope with an increasing aged population, often affected by chronic diseases, which need to be monitored along time. In order to reduce the number of patients walking in a hospital, the recent trend is to find reliable ways to cope with the necessity of monitoring patient’s health
31
status in a remote way. Moreover, an aging population means an increase in the probability for a person to become a patient, because of diseases due to the combined effect of lifestyle and increasing age. Therefore, monitoring systems play now a double role: on one hand, they aim to help physicians in remotely monitoring patient’s health status; on the other hand, the usage of such systems on healthy people, in which the likelihood to develop a chronic disease is high, wants to represent a way of prevention, encouraging people in a healthier lifestyle. That is where mobile technologies (e.g. mobile applications) combine with wearable sensors in order to create an interactive tool for the user. This is the case of LifeGuardTM(NASA) system (figure 1.4). It is an innovative data logger, measuring a variety of parameters: blood pressure, skin temperature, ECG, respiratory rate and blood oxygen saturation. It wirelessly communicates with a mobile device (e.g. tablet), where data are plotted.
Figure 1.4: LifeGuardTM(NASA) system allows the user to monitor several health signals and to visualize
32
Another example is given by AMON project (figure 1.5). It came out with a wrist band monitoring essentially the same parameters of LifeGuardTM(NASA) but designed ad hoc for people with a high risk of cardio-respiratory problems.
Figure 1.5: Sensed wristband developed within AMON project. it measures the basic signals (blood pressure, ECG and oxygen saturation) needed to monitor people with a high cardiovascular risk.
An emerging area of interest for wearable technology is represented by the one of home rehabilitation. Again, even this area requires a high grade of interactivity of the engineered solution. Therefore, along with the already cited wearable sensors (movement and physiological sensors), new technologies in the field of virtual reality (VR) and mobile applications are widely used. The goal of such solutions is to provide the patient of a tool which can guide them toward their rehabilitation path, consisting of a set of properly designed exercises. Indeed, such technologies enhance the engagement and motivation needed to drive neuroplastic changes that underlie motor process maintenance and improvement. ValedoTM system, developed by Hocoma AG, is a system which combines
wearable motion sensors with interactive games, representing a tool for patient with low back pain, through which they can shape their own therapy by fixing goals, receiving feedbacks and keeping track of their progresses (fig.1.6). (Patel 2012)
33
Figure 1.6: ValedoTM low back pain therapy system, developed by HOCOMA AG, is an example of a home
rehabilitation solution. It combines wearable sensors with interactive games, aiming to provide the patient a tool capable to guide him and to give him a feedback and
1.2 Existing technologies in pulmonary rehabilitation
As previously mentioned, nowadays, even pulmonary rehabilitation, like other different kind of recovery processes, has been improved by the usage of always updated technologies. This field of interest covers at least three of the five macro-areas described previously: assessment of treatment efficacy, health and wellness monitoring and home rehabilitation. Indeed, it is possible to apply different devices for different purposes: from monitoring tasks to rehabilitation ones both in the hospital and during daily life. If for a healthy subject a control on the level of physical activity pursued could be useful, it will certainly be crucial for a pulmonary patient. Thus, as regards the need of a monitoring system during exercises session or usual activity there is, available on the market, a wide range of wearable or portable instruments. As said above even for healthy subject is useful a certain level of daily physical
34
activity recording. That’s the reason why, in the last few years, a lot of companies have invested in watch with the ability of counting calories consumed, number of steps and even heart rate and sleep movement level record. This kind of devices can usually communicate with smartphones or PC, making the monitoring purpose more immediate. Here in figure 1.7 is possible to see one of a very large series of devices which are all extremely wearable and light.
Figure 1.7: vivosmartTM +HR (Garmin)
By the way, this kind of products are designed for subjects without pulmonary problem and, for this reason, they calculate the indexes provided on healthy subjects’ baselines. For pulmonary patients, it is necessary to monitor other indexes and variables taking into account the baseline differences which characterize the effect of a hilliness. Depending on the information that is needed, the main devices used in this case are the pulse-oximeters or the spirometers. Both instruments are nowadays portable, in order to be used also at home. Pulse-oximeters, as will be better explained later, bring the information regarding heart rate and saturation level. However, a pulse-oximeter cannot give any information about the amount or level of activity conducted from the subject. A spirometer (figure 1.8), instead, is designed to bring information regarding the pulmonary flow in relation to volume (flow-volume curve) and, also, forced expiratory (flow-volume variation in time. It can provide different indexes like FEV (forced expiratory volume), FEF (forced expiratory flow), FVC (Forced Vital Capacity) or the Tiffenau index (FEV/FEF), by means of which is possible to hypnotize if a patient has an obstructive or restrictive illness (figure 1.9). The problem of the usage of
35
this device during physical activity is that it has to be worn in correspondence of the mouth and it represents an uncomfortable resistance to the airflow for a pulmonary patient.
Figure 1.8: example of portable spirometer
36
An interesting device, which combines the use of a spirometer, a pulse-oximeter and an accelerometer, is called SpirodocTM(MIR) (figure 1.10). This technology is portable and can
communicate via Bluetooth® with a computer where a dedicated software provides the flow/volume curve and the volume/time real time. On the device itself, it is possible to have a preview of the curves previously mentioned. SpirodocTM consents to connect an optical pulse-oximetry probe thus allowing a more complete measurement. It has been designed with an accelerometer, in order to provide information during a six-minute walking test as number of steps, walked distance, period of rest/ walking/recover, O2-Gap, area desaturation/distance, Borg dyspnea and many other optional measurements. The use of this device during sleeping periods can identify dangerous dyspnea with the relative body position. Anyway, it has not been designed to be used during other kind of exercises that usually pulmonary patients have to carry on during their sessions. (Medical international Research n.d.)
Figure 1.10: SpirodocTM(MIR) device with pulse-oximetry probe and spirometer module
1.3 Movement Sensors
Movement sensors represent the core of many monitoring systems. Basically, the motion measurements can be performed by three types of sensors:
Accelerometers; Gyroscopes; Magnetometers.
37
These three devices, embedded in a single device, form the Inertial Measurement Unit (IMU).
1.3.1
Accelerometers
Accelerometers can be used in mainly three different ways: as an instrument to measure velocity and position, to have an information about tilt or orientation with respect to the acceleration of gravity and also as a sensor of vibration or impact.
An accelerometer (figure 1.11) is a sensor composed by an inertial mass connected to a housing box in a way to simulate a mass-spring-damper system. Therefore, the sensor provides the measurement of the displacement of the inertial element with respect to the housing, when it is accelerated by an external force. It is then possible to provide the acceleration to which the sensor is submitted, from the displacement primarily measured.
38
When the box is submitted to acceleration the output will be proportional to the displacement (x) of the mass with respect to the housing. This displacement will be converted in an electric signal by a position transducer.
According to the Newton’ second law 𝐹𝑜𝑟𝑐𝑒 (𝐹) = 𝑀𝑎𝑠𝑠 (𝑀) ∗ 𝑎𝑐𝑐𝑒𝑙𝑒𝑟𝑎𝑡𝑖𝑜𝑛(𝑎) (eq.1), it holds that 𝑀𝑎′ = −𝑘𝑥 − 𝑏𝑑𝑥
𝑑𝑡 (eq.2), where:
M = inertial mass;
a’ = acceleration of M with respect to the earth 𝑎′= 𝑑2𝑥 𝑑𝑡2 −
𝑑2𝑦
𝑑𝑡2 (eq.3), with y =
displacement of the box; x = displacement of M; k = elastic coefficient; b = damping coefficient.
Therefore, it is possible to obtain the equation of motion of the system, by substituting eq.3 in eq.2: 𝑀𝑑2𝑥 𝑑𝑡2 + 𝑏 𝑑𝑥 𝑑𝑡+ 𝑘𝑥 = 𝑀 𝑑2𝑦 𝑑𝑡2 (eq.4).
In order to solve the differential equation, it is possible to apply the Laplace Transform:
𝑀𝑠2𝑋(𝑠) + 𝑏𝑠𝑋(𝑠) + 𝑘𝑋(𝑠) = 𝑀𝐴(𝑠) (eq.5)
Where X(s) and A(s) represent the Laplace Transform of x(t) and 𝑑
2𝑦
𝑑𝑡2 respectively. From
eq.5, we obtain:
𝑋(𝑠) = 𝑀𝐴(𝑠)
39
By introducing the undamped angular frequency ω 0 = √𝑘 𝑀⁄ and the damping ratio ϛ, so that 2ϛω 0 = 𝑏 𝑀⁄
𝑋(𝑠) = 𝐴(𝑠)
𝑠2+ 2ϛω
0𝑠 + 𝜔02
It is possible to obtain the measure of the acceleration with respect to more than one space direction depending on the connection of the inertial mass to the housing, as happens in tri-axial accelerometers. Indeed, one of the most used signals in the literature is the Vector Magnitude Unit (VMU), simply the square root of the sum of the squared uni-axial accelerations:
𝑉𝑀𝑈 = √𝑎𝑥2+ 𝑎𝑦2+ 𝑎𝑧2
MEMS (Micro-Electro Mechanical Systems) accelerometers are a type of accelerometers widely used in the wearable technologies. The term MEMS describes a manufacturing technique, where mechanical elements are manufactured at a scale similar to the microelectronic one. MEMS are though different from typical electronic circuits because they also imitate mechanical parts, allowing the presence of holes, cantilevers, channels and so on. Such technology brings unique advantages even if the production costs can’t be ignored. The use of MEMS allows to miniaturize already existing devices or to build new ones that can interact with the micro-world (Aliverti 2015) (Patel 2012) (An introduction to MEMS. 2002) (Andrejasic 2008). It is also possible to integrate in a silicon MEMS the external component directly with the electronics. Thus, this kind of device is called smart integrated MEMS and already include data acquisition, filtering, data storage, communication, interfacing and networking. MEMs accelerometers work on the principle of capacitive accelerometer, where the conversion from the displacement of the inertial mass information to voltage signal is performed by sensing changes in capacitance. Capacitive sensing depends on the variation of capacitance when the geometry of a capacitor is changing. Neglecting the firing effect near the edge the parallel plate capacitance is:
40
𝐶0 = 𝜀0𝜀𝐴 𝑑 = 𝜀𝐴
𝐴 𝑑
where 𝜀𝐴 =𝜀0 A and A is the area of the electrodes, d the distance between them and ε the permittivity of the material separating them. If one of the parameters varies there will be a measurable change of capacitance, this principle is used in MEMS where the changing parameters are the distance or the Area. Typical MEMS accelerometer is composed of a proof mass which can move and has plates that are connected through to a reference frame using a mechanical suspension system (figure 1.12).
Figure 1.12: simplified structure of a MEMS accelerometer
As shown in figure 1.12, capacitors are composed by the movable plates and the fixed outer plates. The deflection of proof mass is measured using the capacitance difference [4]. Between the movable plate and two stationary outer plates there are two free-space (air) capacitances C1 and C2 which are functions of the corresponding displacements x1 and x2:
𝐶1 = 𝜀𝐴 1
𝑥1 = 𝜀𝐴 1
41 𝐶1 = 𝜀𝐴 1 𝑥2 = 𝜀𝐴 1 𝑑−𝑥 = 𝐶0+ ∆𝐶 (2)
the capacitances C1 and C2 are equal when there is an acceleration equal to zero because 𝑥1 = 𝑥2 . Only in presence of an acceleration there will be a proof mass
displacement x. If x 𝑥 ≠ 0, the capacitance difference is
𝐶1− 𝐶2 = 2∆𝐶 = 2𝜀𝐴 𝑥
𝑑2−𝑥2 (3)
Measuring ∆C, it is possible to obtain the displacement x by solving the nonlinear algebraic equation:
∆𝐶𝑥2+ 𝜀
𝐴𝑥 − ∆𝐶𝑑2 = 0 (4)
This equation can be simplified, indeed for small displacements ∆𝐶𝑥2 is negligible. Thus,
∆𝐶𝑥2 can be omitted. Then, from 𝑥 ≈𝑑2
𝜀𝐴∆𝐶 = 𝑑 ∆𝐶
𝐶𝑜 (5), it holds that the displacement is
approximately proportional to the capacitance difference ∆C (4). As shown in the figure
1.12, a characteristic of MEMS accelerometer is that every sensor has a lot of capacitor sets.
C1 is the overall capacitance composed by all upper capacitor wired parallel and in the same way the capacitance C2 is the obtained with the parallel of all lower ones, otherwise capacitance difference would be negligible to detect. Thus, Equation (5) now does hold true also for all system. The output of interest is the voltage (𝑉𝑥), namely the voltage of the proof
mass. It holds true that:
(𝑉𝑥+ 𝑉0)𝐶1+ (𝑉𝑥− 𝑉0)𝐶2 = 0 (6) 𝑉𝑥= 𝑉0 𝐶2−𝐶1 𝐶2+𝐶1 = 𝑥 𝑑𝑉0 (7)
𝑉𝑥 is a square wave with the right amplitude proportional to the acceleration. By the way, it
is not possible to use this output signal due to the fact that it is weak and noisy. 𝑎1= 0 means that there is no acceleration thus the proof mass doesn’t move, and therefore, 𝑉𝑥=0. 𝑎1 > 0
42
indicate that the sensor is accelerated and thus the voltage output 𝑉𝑥 changes proportional to alternating voltage input 𝑉0 (Equation 7). A buffer following the output channel permits to read 𝑉𝑦 =1×𝑉𝑥 and thus to avoid attenuation. 𝑎1< 0 is present with an inverse acceleration
and so 𝑉𝑥 and 𝑉𝑦 have negative signs. Using a demodulator is then possible to obtain the sign of the acceleration by multiplying the input signal 𝑉𝑦 with the square waves 𝑉0coming from oscillator.the result of the system just explained is the voltage output 𝑉𝑜𝑢𝑡 with the right sign
of acceleration and the right amplitude (figure 1.13).
Figure 1.13: conditioning system of an accelerometer signal
Hook’s law applied to an idea spring state that the spring exhibit a restoring force 𝐹𝑠 proportional to the displacement: 𝐹𝑠 = 𝑘𝑠𝑥 , where 𝑘𝑠 is the spring constant. From Newton’s second law of motion, neglecting the air friction (which is negligibly small): = 𝑚𝑑2𝑥
𝑑𝑡2 =
𝑘𝑠𝑥 . Thus, it is possible to express the acceleration in as a function of displacement: 𝑎 = 𝑘𝑠
𝑚𝑥. Therefore, the acceleration is found to be proportional to voltage output = 𝑘𝑠𝑑 𝑚𝑉0𝑉𝑥 .
Using sets of capacitors turned in perpendicular directions, it is possible to get two axes or even three axes accelerometer. It is important to consider the bandwidth, which is the
43
frequency used to measure changes in acceleration. Since the electronic circuit has to read changes in capacitance faster than the acceleration ones, the frequency of the oscillator must by quite bigger than the bandwidth frequency and it takes a certain number of cycles before the demodulator can calculate the output. (Aliverti 2015)
1.3.2
Gyroscopes
A gyroscope is a device used for the measure of angular velocity. There are several physic principles that can be used to realize them but, between all types of gyroscopes, MEMS are the one on which this project will focus on. As said for the accelerometers, in fact also gyroscopes can be realized with MEMS technology. The reason why the work is focused on this kind of technology is that MEMS gyroscopes, as MEMS accelerometers, have found exciting applications in portable devices. As for the MEMS accelerometer, also the MEMS gyroscopes are made of a mechanic sensing component and an electronic interface integrated with the mechanic sensor. this is made of two different parts: a drive mass oscillating at a resonance frequency and a sense mass which is excited when an angular velocity is applied at the gyroscope due Coriolis’ forces. Thus, the working principle of this kind of sensors rely on the Coriolis’ effect, which explains the onset of an inertial force on an object that is in motion with respect to a rotating reference frame. This force, in fact, appears when Newton’s law is expressed with respect to a rotating reference frame and is proportional to the mass of the object and to the rotation rate. The Coriolis’ force is perpendicular to both the rotation axis and to the velocity of the body in the rotating frame and is also known as an inertial force. MEMS gyroscopes are made of vibrating masses and they use the inertial forces created by the movement of the sensor with respect to a not inertial reference system.
𝐹𝑐𝑜𝑟𝑖𝑜𝑙𝑖𝑠 = −2𝑚𝜔⃗⃗ ×𝑣
F is the force acting on a body of negligible dimensions and mass m which moves at a constant velocity v with respect to a not inertial system (figure 1.14). Where 𝜔⃗⃗ is the angular velocity of the relative reference system with respect to the inertial one. The effect of
44
𝐹𝑐𝑜𝑟𝑖𝑜𝑙𝑖𝑠 is a displacement of the mass in a direction perpendicular to 𝑣 . Sensing a capacitance change is possible to measure the angular velocity which is linearly correlated to the mass displacement.
Figure 1.14: Coriolis force
1.3.3 Magnetometers
A magnetometer is a device capable of measure magnatic fields and their intenisty. In particular this device measure the magnetic flux density in the spatial point where the sensor is placed. The magnetic flux denisty is proportionally related to the magnetic field strength ,that’s why a magnetometer output gives information about the intenisty of the magnetic lines. there are different sources of magnetic fields, from electrical current circulating in fluids, conductors and ionized gases to permenet magnets both natural (magnetite) and industrially made.This kind of measure can be useful in many different contests: from geology, space physics investigation to biomedical applications.
Magnetometers can be divided in two main categories:
Vector magnetometers: the measure is performed in one specific direction in the 3D space. This kind of magnetometer is more common due to the fact that provide also a spatial information
45
Scalar magnetometers: the measure regards only the magnitude of the vector with no interest in the direction.They are used mainly to perform calibration in conjunction with vector magnetometers.
Sclar magnetometers can be ,in turn, be realized in different ways:
- Proton precession magnetometers: which exploits the phenomenon of nuclear magnetic resonance
- Optically pumped magnetometers: used principally in space measurements, they are able to perform measures in a wider range than tho proton precession ones. This magnetometers use as basic principle for the detection of magnetic fields the energy required to transfer atomic electrons from one energy level to another
Vector magnetometers, as the scalar ones, find different way of production:
- Fluxgate magnetometers: using a sensing coil they are able to “gat” the ambient magnetic flux.
- Vector helium magnetometer: the basic principle of this kind of magnetometer is the
same of the optically pumped, with the addition of a Helmotz coil system from which it is possible to derive the spatial information.
Moreover, by combining single axis sensors it is possible to realize a device able to measure the three components of the ambient field, thus a triaxial magnetometers.
A magnetometer can be used to detect earth magnetic fields, if the measure is not compromised by external disturbance. This field always points to magnetic North, thus with this measurement systems it is possible to derive the orientation of the device (Roetenberg 2006).
1.3.4 Inertial Measurement Unit (IMU)
The term Inertial Measurement Unit is used to indicate that devices which are able to detect speed, orientation and gravitational forces thanks to the use of accelerometers, gyroscopes
46
and magnetometers. This kind of devices are widely diffused in different fields of application, among which the biomedical one. Indeed, useful application comprehend gait analysis, surgical navigation, motor disorder monitoring, rehabilitation assessment and so on. In order to realize an IMU it is necessary to arrange the three different devices. This is done by means of the sensor fusion: a technique which permits to integrate the signals from different sensors. On the market are present different kind of IMU. Indeed, They can be composed by a triaxial accelerometer and a triaxial gyroscope only, or embedded also a triaxial magnetometer. The great advantage of this technique is that the measures from a sensor can be used to overcome the order sensors’ limitations. The result is a small-sized and low cost device which can be used in different ways even if with some accuracy problems (drifts).
Figure 1.15: sensor fusion in a IMU (Roetenberg 2006)
Figure 1.15 shows how the sensor fusion is performed. The Kalman filter permits to estimate
the state of the system at the n-th step using the estimates made at the n-1 step. The error model used by the filter estimates the errors made by the three sensors and then weight the data from the measure to obtain an optimal estimate of the system’s state (Roetenberg 2006).
47
1.4 Physiological sensors
1.4.1 Pulse-oximeter
Monitoring blood gases is important both in intensive care and during surgical interventions because it provides information about respiratory or metabolic equilibrium, adequacy of blood oxygenation and CO2 removal. The oxygen in blood is for the 98% bounded to the hemoglobin (Hb) and for the 2% dissolved in plasma. The saturation permits to indicate the percentage of oxygen linked to Hb:
SO2(%) = HbO2
HbO2 + Hb100
Figure 1.16:hemoglobin dissociation curve
In physiological conditions SaO2(saturation in arterial blood) is around 98% and SvO2 (saturation in venous blood) is 75%. In figure 1.16 is showed the hemoglobin dissociation curve which relates the saturation and the partial pressure of O2. Nowadays there are basically two ways to measure blood gases: by analyzing a blood sampling through a gas analyzer or by a continuous monitoring, which could be either
48
in vivo (intravascular) or ex-vivo (extravascular). The pulse-oximeter is a non-invasive device used to measure the oxygen saturation of the blood; this means it measure the level of oxygen linked to hemoglobin. Thus, it permits to understand how much oxygen is transported through the body. The pulse-oximeter exploits the principles of optical oximetry, thus it measures oxygen saturation in the blood by evaluating the difference of absorption spectra of organic compound that carry oxygen, like hemoglobin in blood. In particular, the working principle is based on the fact that hemoglobin and oxygenated hemoglobin have different absorption spectra due to their different molecular configuration, which explains also why venous and arterial bloods have different colors. According to the Beer’s Law of absorption in presence of multiple absorbers, it holds true that the different components linearly contribute to the overall absorption. To obtain the saturation level at least two different excitation wavelengths are needed. Usually, a wavelength in the field of the red light (around 660 nm) and one in the field of infrared (between 805 and 1000 nm) are used. The reference wavelength is called
isobestic (figure 1.17) and it is the one at which both Hb and HbO2 have the same absorption
coefficient.
Figure 1.17: Hemoglobin and oxy-hemoglobin absorption spectra
49
Therefore, it is possible to proceed with transmission oximetry or reflection oximetry:
Transmission oximetry (figure 1.18) means that the light that passes through the sample is analyzed: by measuring absorbance. A at two different wavelengths (λ1 and λ2), the concentrations of hemoglobin and oxy-hemoglobin (C(Hb) and C(HbO2), respectively) can be determined as unknown variables of a two-equation linear system, in which extinction coefficients at the different wavelengths h(λ1, HbO2), h(λ2,HbO2), h(λ1,Hb), h(λ2,Hb) are known. Oxygen saturation is obtained without knowing L:
SO2 = C(HbO2)
C(HbO2) + C(Hb)
Reflection oximetry (fig 1.18) is based on the analysis of the light back-reflected from the sample and is calculated by an empirical equation:
SO2 = A − B
R(λ1) R(λ2)
Where R = ln (I
Ir) (I= intensity of incident light, Ir= intensity of reflected light). A and B are
constants related to the hematocrit (amount of red blood cells in blood volume). In order to compensate this dependency, sometimes a third wavelength is used.