The African Financial Development Gap
63
0
0
Testo completo
(2)
(3) EUROPEAN UNIVERSITY INSTITUTE, FLORENCE. DEPARTMENT OF ECONOMICS. The African Financial Development Gap FRANKLIN ALLEN, ELENA CARLETTI, ROBERT CULL, JUN “QJ” QIAN and LEMMA SENBET. EUI Working Paper ECO 2010/24.
(4) This text may be downloaded for personal research purposes only. Any additional reproduction for other purposes, whether in hard copy or electronically, requires the consent of the author(s), editor(s). If cited or quoted, reference should be made to the full name of the author(s), editor(s), the title, the working paper or other series, the year, and the publisher. ISSN 1725-6704. © 2010 Franklin Allen, Elena Carletti, Robert Cull, Jun “QJ” Qian and Lemma Senbet Printed in Italy European University Institute Badia Fiesolana I – 50014 San Domenico di Fiesole (FI) Italy www.eui.eu cadmus.eui.eu.
(5) The African Financial Development Gap Franklin Allen, Elena Carletti, Robert Cull, Jun “QJ” Qian, and Lemma Senbet Current Version: May 13, 2010. Abstract Economic growth in Africa has long been disappointing. We document that the financial sectors of most sub-Saharan African countries remain significantly underdeveloped by the standards of other developing countries. We examine the factors that are associated with financial development in Africa and compare them with those in other developing countries. Population density appears to be considerably more important for banking sector development in Africa than elsewhere. Given the high costs of developing viable banking sectors outside metropolitan areas, technology advances, such as mobile banking, could be a promising way to facilitate African financial development. Similarly to other developing countries, natural resources endowment is associated with a lower level of financial development in Africa, but macro policies do not appear to be an important determinant.. Keywords: Africa, finance and growth, banks, institutions, population density. JEL Classifications: O5; K0; G0.. Allen is from the University of Pennsylvania, Carletti is from the European University Institute, Cull is from the World Bank, Qian is from Boston College, and Senbet is from the University of Maryland. We appreciate helpful comments from Patrick Alila, Meghana Ayyagari, Thorsten Beck, Shawn Cole, Sankar De, Marcella Lucchetta, Chukwuemeka Okoye, Daniel Sarpong, Philip Strahan, and seminar/session participants at Harvard Business School, the ERD 2009 Workshop in Accra, the Financial Intermediation Research Society meetings in Prague, and the Summer Research Conference at the Indian School of Business. We are grateful to Giulia La Mattina, Sailu Li, and Mircea Trandafir for excellent research assistance, and the Gates Foundation, NBER, and the authors’ respective institutions for financial support. We are responsible for all the remaining errors..
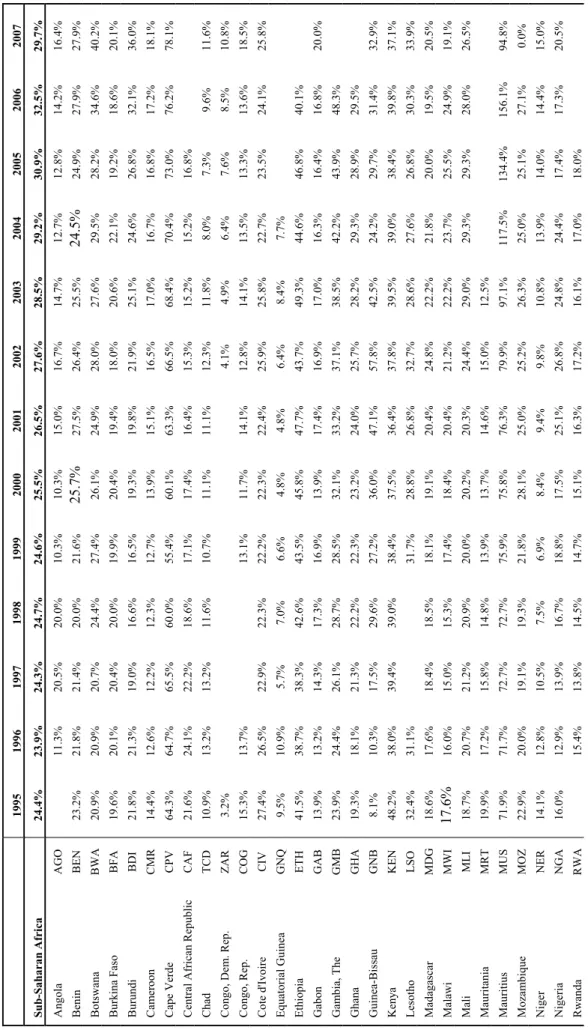
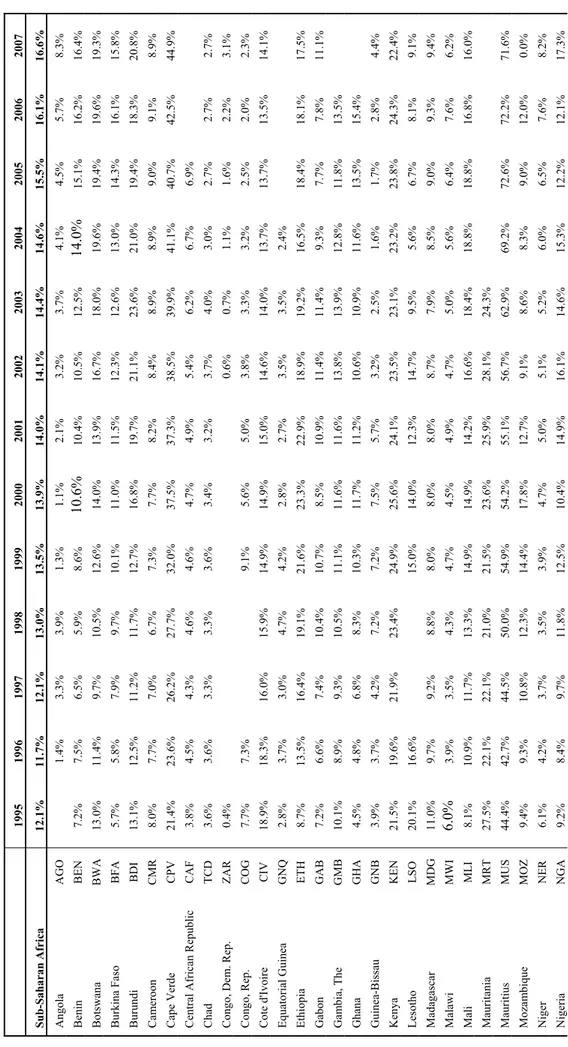
(6) I. Introduction Africa’s growth performance has long been disappointing and it has been described as a tragedy by some commentators (e.g., Easterly and Levine, 1997). Although less well-documented and perhaps not surprising, the financial sectors of sub-Saharan African countries remain woefully under-developed, even relative to the standards of developing countries. This is despite the fact that most of these countries have undergone extensive financial sector reforms in the last two decades of the same proportions as other developing and emerging countries.1 The failure of the economic and financial sector reforms in sub-Saharan Africa is visible in the data. For example, the population-weighted trends for developing regions in GDP in terms of liquid liabilities and private credit show that the rest of the developing world has seen substantial improvement relative to Africa in the last two decades, though the patterns differ across regions. Countries that started with similar or lower income levels in the Middle East, North Africa, and Asia have seen substantial improvement in both financial development and income. By contrast, the liquid liabilities of African financial sectors averaged slightly below 30 percent of GDP in 2007. In no other region of the developing world did that figure stand below 40 percent (Table 1). The credit side of the picture looks even worse. Africa’s average level of credit extended to the private sector represented only 16.6 percent of GDP in 2007 compared with ratios ranging from 32.5 to 43.9 percent for other developing regions (Table 2). These data show that the financial development indicators of Africa have improved in the period 1995-2005, but at a much slower pace than in other developing and emerging countries in Asia and Latin America. These disappointing results and, more generally, the poor state of African financial development raise a number of important questions on what went wrong with the financial reforms 1. The reform packages included price and interest rate liberalization, removal of credit ceilings, introduction of a variety of measures for banking and capital market development, including financial regulatory schemes, and large scale privatizations of state-owned enterprises (see, for instance, Nissanke and Aryeetey, 1998; Senbet and Otchere, 2006; and Honohan and Beck, 2007).. 1.
(7) in Africa and on what could be improved. Is African financial development slow in itself, or is it merely a reflection of broader economic and policy failures? Are the levels of financial development achieved outside of Africa, in both developed and developing countries, achievable for most African countries? What factors have inhibited African financial development to this point? If those factors were corrected and financial development did take hold, would the finance-growth nexus hold in Africa as seen in other places? Understanding these issues is of crucial importance since, as well documented in the ample empirical evidence, there is a convincing linkage between financial development and economic development.2 Moreover, in the context of Africa where poverty is so widespread, the positive relationship between financial development and economic development is suggestive of a positive linkage between finance and poverty alleviation. There is virtually no rigorous academic research that addresses these questions. This paper represents a first step in addressing key issues at the heart of African financial development. Our aim is to assess whether African financial development is slower than it ought to be, and if so why. To do this, we first analyze the determinants of financial development in other developing countries (low- and middle-income countries) via regression models based on prior research. We use the regression coefficients to generate predicted levels of financial development, as measured by the ratios of liquid liabilities and private credit over GDP, for sub-Saharan African countries (excluding South Africa). Then we compare those predicted levels with the actual levels of financial development in the African countries. We find that most African countries tend to have lower levels of financial development than would be predicted based on their fundamentals. The average country falls 13 percentage points short of its predicted level for liquid liabilities over GDP and 12 percentage points for private credit over GDP. To understand why this is the case, we examine in a second step whether the factors that. 2. See, for example, Levine (2005), Levine, Loayza, and Beck (2000), and Rajan and Zingales (1998).. 2.
(8) drive financial development in Africa are the same as in other developing countries. We run regressions for other developed countries and African countries separately. We also examine the combined sample with an African dummy, and interact the African dummy with factors affecting financial sector development. One of our main findings is that population density appears to be more important for banking sector development as measured by liquid liabilities and private credit (relative to GDP) in Africa than in other developing countries. If frequent interactions among firms, households, and investors are a necessary condition for business transactions and therefore financial development, then our results are plausible in that many African countries are endowed with scattered population and roads. Furthermore, we find a nonlinear relationship between population density and banking sector development, and the largest gap between Africa and the rest of the developing world is for those African countries ‘trapped’ in the low density area. This suggests that the minimum, viable banking scale in Africa is perhaps greater than elsewhere. We further explore the channels through which population density may affect banking sector development by examining additional variables related to population density. We find that the percentage of population living in the largest cities, roads per square kilometer and bank branch penetration are all associated with more banking sector development, but the results are weaker for the scale of private (bank) credit. These results imply that the minimum viable banking sector scale is best achieved in major cities, and that technology advances such as mobile banking could be a promising way to facilitate African financial development, especially on the savings side of the banking sector outside metropolitan areas. Concerning other factors explaining banking sector development, we find that macroeconomic stability and broad measures of institutional quality are less important in Africa than in other developing countries, while the natural resource ‘curse’ (e.g., Sachs and Warner, 1995, 2001) is no worse in Africa than elsewhere. Finally, regarding the indicators of stock market. 3.
(9) development, such as market capitalization and turnover, we do not find any of the factors associated with stock market development in the rest of the world to be significant in Africa. In large part, this is due to the fact that most African stock markets remain thin, illiquid and dysfunctional; and only very recently Sub-Saharan African countries have made a policy commitment to their development. Given the criticisms of cross-country studies, and in particular, that the results are possibly due to measurement errors and/or unobservable country-level factors, we also conduct firm-level analyses. Employing the widely used World Bank global Investment Climate Surveys (ICS) with most of the surveyed firms unlisted, we examine factors determining firms’ access to external finance in the form of bank loans (from both domestic and foreign banks) and/or credit cards. This is consistent with prior research showing that financial institutions provide the most important source of external finance in most developing countries (e.g., Beck, Demirgüç-Kunt, and Levine 2000). The idea is that if a country’s banking sector is more developed, firms, and in particular privately owned firms, should have an easier access to these types of formal finance. We run regression models where we include the same country-level factors as in our cross-country studies as well as firm characteristics (e.g., age, size, industry, exporter and foreign ownership status) that could explain substantial variations in the demand for and in the use of financial services. Once again, we include the African dummy and interact it with both country- and firm-level variables. The results of the micro-level regressions confirm that population density is an important factor for access of firms to financial institutions. While bank branch penetration is an important factor for access to bank finance, the coverage of roads is not as important for African firms as their counterparts elsewhere. As with country-level studies, general infrastructural failures are not necessarily responsible for low levels of firm access to bank finance in Africa, but rather failures are specific to the banking sector and markets for loans. While manufacturers are more likely to access. 4.
(10) bank finance in other countries, they show no strong tendency to rely on external finance relative to other firms in Africa. The rest of the paper is organized as follows. Section II describes the data, methodology for benchmarking financial development across countries, and the summary statistics. Section III examines whether the actual financial sector development in Africa is below what the fundamentals would predict using other developing countries as benchmarks. Then Section IV examines whether the variables associated with banking development in other developing countries from our base models are related in a similar way to African banking development. Section V present results on the determinants of firm access to external finance in Africa and other developing countries. Section VI offers concluding remarks.. II. Benchmarking Financial Development: Data and Methodology The stylized facts, such as those in Tables 1 and 2, permit comparisons across countries in terms of their levels of financial development. Such comparisons can be revealing, especially when looking at a set of peers that are at a similar level of economic development. Yet, the selection of such peer groups is somewhat ad hoc and limits the degree to which a country can be compared to a broader set of countries. Moreover, comparing levels of financial development yields little insight into the factors (endowments, institutions, and policies) that led to those outcomes. For that, the literature has turned increasingly to regression analysis to examine the level and variation of financial development across countries relying on some of the same variables that have been used to study the links between financial development and growth (Levine, 2005).3. 3. As in other recent papers, we use these variables, including growth, to describe financial development (Cull and Effron, 2008; Cull, Senbet, and Sorge, 2005). By contrast, in the finance and growth literature, the financial indicators are among the explanatory variables used to explain growth.. 5.
(11) There is no general consensus in the literature about the factors that should be taken into account in explaining financial development, nor what indicators of that development are most reliable. In the choice of the latter, we ground our analyses on the recent attempt by Beck et al. (2008) to standardize the selection of financial development indicators. Under this approach, the potential financial development indicators are ranked on the basis of the following criteria: (a) the directness of their linkages to welfare, (b) the goodness of fit of regressions that explain variations in them, (c) their coverage in terms of countries and years, and, (d) the degree to which an indicator is stable within a country from year to year, but varies substantially across countries.4 In most of our analysis we use the two standard indicators presented in Tables 1 and 2, namely the ratio of liquid liabilities in the banking system to GDP and the ratio of credit to private sector to GDP. Both measures score among the highest based on the all four criteria listed above. They score especially high relative to others on the first criterion, because they are robustly associated with long-run economic growth (Levine 2005; Levine, Loayza, and Beck 2000). Moreover, our analysis is rooted in banking indicators because banks hold the vast majority of financial sector assets in Africa and other developing countries.5 Despite this, we perform robustness checks using measures of stock market development as indicators of financial development. In the choice of the explanatory variables for financial development, we first rely again on previous studies in particular those on the finance-growth nexus (e.g., Levine, 2005) and on government policies that promote financial development (e.g., Beck et. al, 2008). These studies (in 4. Beck et al. (2008) call this the ratio of within sample variance to between sample variance. They worry that high within-country variation may reflect measurement errors or a high degree of co-movement with the business cycle. They argue that indicators of financial development are (or at least should be) better suited to measuring longer-term differences across countries rather than fluctuations along the cycle for a given country. 5 The ratio of private credit to GDP can include lending by nonbank financial institutions. As Table 4 shows, though, the correlations between private credit/GDP and stock market capitalization, and those between liquid liabilities/GDP and stock market capitalization/GDP are of similar magnitude (0.65 and 0.68), respectively. In our robustness checks, we introduce indicators of stock market development, but they have limited impact because of the thinness of African stock markets and their infancy.. 6.
(12) particular, Beck et al. 2008) regress the indicators of financial development on a set of variables that describe the environment in which such development takes place, but that are exogenous to that process such as population size and density, natural resources and offshore centers. They also include per capita income as an exogenous regressor, claiming that its effect on financial development is contemporaneous while the effect of financial development on income is lagged. The residuals from those regressions, therefore, provide an indication of the extent to which the chosen government policies promote financial development. However, as our objective is to benchmark African financial development relative to a set of variables that have been robustly associated with financial development in countries outside of Africa, especially in low and middle income countries, we expand further the set of regressors by including macroeconomic variables, such as inflation, real growth, and the current account balance, broad measures of institutional development, and variables describing banking sector structure and ownership. We stress from the outset that we are not necessarily estimating causal relationships for the expanded set of regressors. For ease of exposition, however, we refer to all explanatory variables as determinants of financial development throughout the paper. The regression for the expanded set of explanatory variables is then: (1) FDi = Į + ȕ1Populationi + ȕ2Population Densityi + ȕ3Natural Resourcesi +ȕ4Offshore Centeri. Exogenous determinants, based on Beck et al. (2008). +ȕ5Per Capita Incomei +ȕ6Population*GDP Per Capitai. Plausibly exogenous, Financial development affects these variables at a lag, Beck et al. (2008). +ȕ7Real GDP Growth Ratei +ȕ8Inflation Ratei +ȕ9Current Account Balance/GDPi. Macroeconomic variables. +Ǻ10KKM Indexi. Index of institutional development. + ȕ11Bank Concentration +Ǻ12Foreign Ownership Sharei +Ǻ13State Ownership Sharei. Banking sector structure and ownership variables. +Ǻ14Manufacturing/GDPi +Ǻ15Secondary/Primary enrolment + İi. Other variables. 7.
(13) We briefly explain our variables below: Financial Development indicator (FDi): This measures an indicator of financial development in country i. We average our indicators of financial development and our explanatory variables over multiple years (from 2001 to 2005), as is customary in the literature on financial development and growth so as to reduce the influence of outliers. We therefore have only one observation per country. The results are qualitatively similar when we use all yearly observations from 1990 to 2006 in panel regressions, and when we lag the explanatory variables in either the panel regressions or the cross-sectional regressions.6 Because our goal is to describe a general picture of the factors that are robustly linked to financial development, however, we present below only the simplest cross-country regressions in which the financial indicators and explanatory variables are contemporaneous. Population: We measure population both with size and density and we expect both variables to be positively associated with financial development. A larger size of population should spur financial development due to scale and networking effects that make provision of financial services more efficient in larger economies. Density, as measured by the number of residents per square kilometre, should have a positive coefficient because it is easier for financial institutions to accumulate savings when a higher number of potential depositors have easy access to them. Natural Resources: An abundance of natural resources may have a negative effect on financial development via the so-called “resource curse.” Consistent with this, Sachs and Warner (1995, 2001) offer evidence that resource-rich developing countries have grown more slowly since 1960 than other developing countries. We measure the intensity of a country’s reliance on natural resources by using a. 6. For example, in the cross-sectional regression we average the explanatory variables from 1990 to 2000 and use them to explain financial development indicators averaged from 2001 to 2005. In the panel regression, we lag the explanatory variables by one to three years.. 8.
(14) comprehensive approach that measures resource abundance based on trade indicators rather than solely on oil exports:: Natural resources. petroleum, forest, tropical, ½. Exportsk - Importsk. ¦ Population ages 15 - 64 , where k ®animal,cereal, raw materials¾ ¯. k. ¿. The key advantage of this approach is that this measure of net exports is available for most countries and, as shown by Lederman and Maloney (2008), it is more closely linked to actual natural resource reserves than other trade-based endowment measures. If there is a resource curse and it impacts financial development, we would expect the coefficient on this variable to be negative. Offshore Centers: The financial sectors of offshore centers are typically much larger than their economies would otherwise warrant. We measure this effect with a dummy variable for offshore financial centers and we expect it to be positive.7 Per Capita Income: Per capita income is expected to be positively linked to financial development, because the volume and the sophistication of financial activities demanded is greater in richer countries and, on the supply side, richer economies can better exploit scale economies in the provision of financial services. Per capita income reflects an aggregation of past growth, and hence its coefficient summarizes the long-run positive relationship between growth and financial development. Moreover, per capital income may interact with population, and we capture this effect by including an interaction variable. Indicators of Macroeconomic Stability: Financial development is more likely in a sound macroeconomic environment and to measure this, we include real growth, inflation and the current account balance (relative to GDP) in the regressions. (a) Real growth: The effect of real growth on financial development is ambiguous. On the. 7. One could question whether this is an exogenous variable. We follow Beck et al. (2008) in taking it as exogenous.. 9.
(15) one hand, countries with rapid growth may be associated with greater financial development. On the other hand, countries with higher levels of development, as reflected in GDP per capita, tend to have slower growth according to ‘conditional convergence’ (Levine and Renelt, 1992; Easterly and Levine, 1997). Given that financial development indicators tend to be highly correlated with per capita income, it is likely that the faster growing countries will have lower levels of financial development. We would therefore expect a negative coefficient for real growth in our financial development regressions. The coefficient should also capture the negative short-run relationship between financial development and growth as emphasized in Loayza and Ranciere (2006). (b) Inflation: On the private credit side, inflation should slow financial development if it makes loan contracting over extended periods more difficult. Inflation could also have a dampening effect on liquid liabilities, making depositors more hesitant to place their savings in the formal financial system for fear of not being able to get them back quickly enough. Therefore, we expect the coefficient for inflation to be negative in our regressions. (c) Current Account Balance: The current account balance can be seen as a rough indicator of the health of the macroeconomic environment, and we thus expect it to be positively associated with our financial indicators. Institutional Development: We include in the regression KKM, which is the measure of broad institutional development created by Kaufmann, Kraay, and Maztruzzi (2007). Institutional development has been found to foster financial development in developing countries (Cull and Effron, 2008), and thus we expect a positive coefficient for KKM in our regressions. Banking Sector Concentration: To control for the structure of the banking sector, we include a measure of banking sector concentration as represented by the share of assets held by the three largest banks in a country. We have no strong prediction about the sign of its coefficient. On the one hand, large dominant banks may foster financial development as they may be better able to. 10.
(16) exploit economies of scope and scale and thus provide more services than smaller banks. On the other hand, large banks may have a negative impact on financial development as they may use their market power to raise the price of financial services (or lower the interest rate offered for deposits), thus curtailing outreach and the volume of services that they provide. Bank Ownership: We measure the impact of bank ownership by including two different variables, the share of banking sector assets held by state-owned and by foreign-owned banks. (a) State ownership: There is a substantial empirical literature demonstrating that state ownership of banks has negative effects on financial sector outcomes also in terms of real growth and productivity (La Porta, Lopez-de-Silanes, and Shleifer, 2002), and bank portfolio quality and profitability (Barth, Caprio, and Levine, 2001a, b; 2004).8 We would therefore expect a negative coefficient for the share of banking sector assets held by state owned banks in our regressions. (b) Foreign ownership: Predictions about the foreign bank ownership variable are less clear. On the one hand, foreign banks tend to have lower overhead costs, charge lower spreads, and help promote bank competition by pressuring other banks to lower their costs and their spreads in developing countries (Claessens, Demirguc-Kunt and Huizinga, 2001; Claessens and Lee, 2003; Claessens and Laeven, 2003; and Martinez Peria and Mody, 2004). On the other hand, foreign banks may extend services to fewer customers, either due to prudence or ‘cherry-picking’ a small group of wealthy clients (Detragiache, Tressel, and Gupta, 2006). Manufacturing: We include the share of GDP generated by the manufacturing sector. Industrial sectors that are relatively more in need of finance tend to grow faster in countries with well-developed financial sectors (Rajan and Zingales, 1998). Manufacturing encompasses a broad variety of activities that tend to rely heavily on external finance so that we expect countries with a. 8. Using bank-level data from over 1,600 banks in 100 emerging economies, Mian (forthcoming) confirms that stateowned banks are significantly less profitable and have higher loan default rates than private banks, despite the fact that their deposit costs are substantially lower than private banks.. 11.
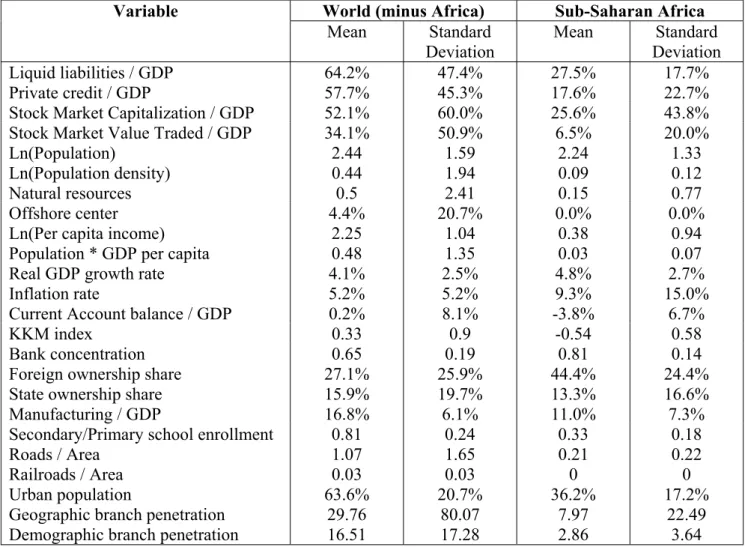
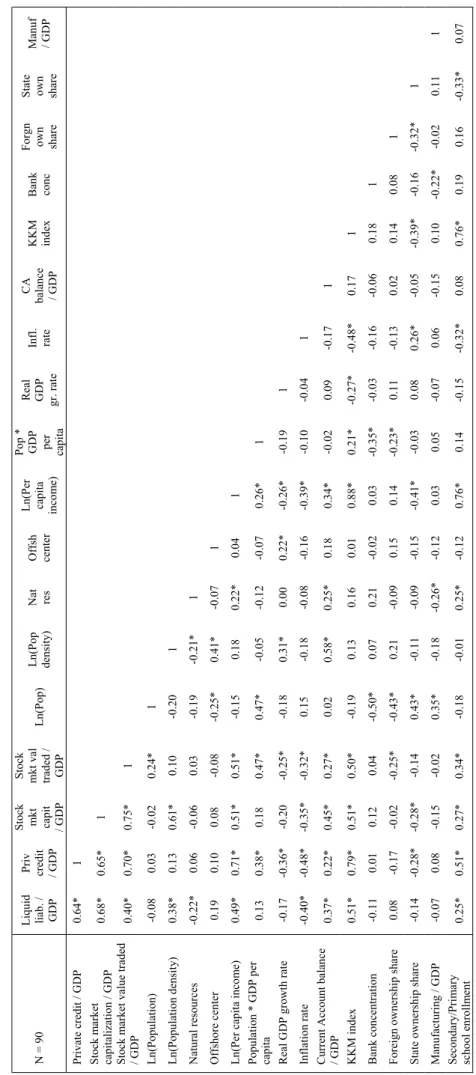
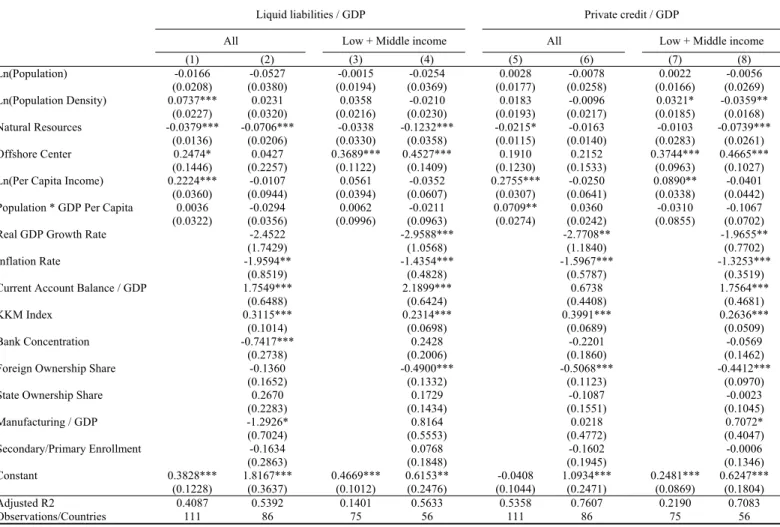
(17) large manufacturing sector to have well-developed complementary financial institutions. We therefore expect a positive coefficient for manufacturing in our regressions. Secondary/Primary enrollment: Finally, we want to measure the impact of risk management on financial development. The idea is that a lack of capacity in risk management may be a deterrent to banking sector development and broader financial sector development (e.g., stock markets). As measuring financial capabilities across countries directly is not possible, we proxy risk management capability with the ratio of secondary to primary school enrolment and we expect its coefficient to be positive. Our argument is that risk management capability is fundamentally a question of human capital development and thus of talented financial people. The summary statistics and the correlations between the key variables appear in Tables 3 and 4. Table 3 shows that the mean values for the financial indicators are uniformly lower in Africa than the rest of the world, measured in terms of liquid liabilities, private credit provision, and stock market development. We also see marked differences in the explanatory variables between Africa and the rest of the world, particularly with respect to population density, per capita income, current account balance/GDP and institutional development as proxied by the KKM index. The correlations in Table 4 are instructive. All indicators of financial development -liquid liabilities/GDP, private credit/GDP, stock market capitalization/GDP, and stock market value traded/GDP- are highly correlated; and population density is positively associated with two of them, liquid liabilities/GDP and stock market capitalization/GDP. The macro economic variables are strongly associated with the measures of financial development in an expected way. In particular, there is a negative relationship between the financial development indicators and both inflation and real growth, and a positive relationship between the indicators and the current account balance. However, the relationship with real growth is weaker than the other macro variables. The KKM index of institutional development is strongly and positively associated with all of the. 12.
(18) indicators of financial development. The same holds for the log of per capita income. This is indicative that there is a long-run relationship between finance and growth. Finally, the secondary/primary school enrollment is positively associated with the measures of financial development. This proxy is intended to capture the need for increasing talent as the financial system develops.. III. Empirical Results at Country Level: The African Financial Development Gap What is the positioning of Africa in the financial development path? To measure this, we estimate the regression Equation (1) specified above for countries outside Africa so as to predict what African financial development should be based on the experience of these other countries. Specifically, we first run the regressions excluding all African countries, and we derive out-ofsample predictions for African financial development. Then we compare these predictions with the actual levels of African financial development to measure the development gap.9 We present models for all countries and for low and middle income countries separately. The latter are more reflective of the African experience.. A. Benchmarking Results for the Determinants of Financial Development The results for the estimation of the regression Equation (1) are presented in Table 5. The signs of almost all of the coefficients are as predicted and many of them are significant. When we use the full sample of countries and the limited set of regressors as a benchmark, (see Columns 1 and 5), only the Per Capita Income Variable is positively associated with both indicators of banking development, while our proxy for Natural Resource intensity is negatively linked to those indicators. Population Density and Offshore Financial Center are significantly positive in the liquid 9. The same approach has been used, for example, to assess whether the levels of foreign direct investment received by China are abnormally high, or whether they can be explained by fundamentals (Fan, Morck, Xu, and Yeung, 2008).. 13.
(19) liabilities regression (Column 1) but not the private credit regression (Column 5). When we benchmark to a sample of only low and middle income countries, using the limited set of regressors (Columns 3 and 7), the Offshore Financial Center is highly significant for both indicators, while the Per Capita Income and Population Density variables are positive and significant, but only in the private credit regression.10 The expanded regression results, where we include macroeconomic, institutional, banking structure, and other explanatory variables, are presented in Columns 2, 4, 6 and 8. The results show that Real Growth is negative and significant (or very nearly so) for both private credit and liquid liabilities for both samples of countries that we use. This indicates that the fastest growing countries tend to have the least-developed financial sectors, providing support for conditional convergence. As discussed earlier, this is just a reflection of a short-run relationship between financial development and growth. Inflation is negative and highly significant across financial indicators and country samples. The coefficients are similar in size for the full set of countries and for the low and middle income countries, indicating that macroeconomic instability is strongly linked to financial under-development even in developing countries. The Current Account Balance/GDP is strongly positively linked to both indicators for both samples, though coefficients are larger for the low and middle income sample. In short, the coefficients support our hypotheses and indicate strong links between macroeconomic outcomes and financial development.. 10. These results are similar to those in Beck et al., (2008). Aside from our proxy for natural resource intensity, our regressions differ from theirs in two ways. First, we use the more conservative cross-sectional approach, whereas they use the full panel. We choose to do this because errors from observations from the same country are likely to be correlated with one another. This could artificially deflate standard errors, thus increasing the significance level of coefficients. For robustness, we ran our models also on the full panel and qualitative results are similar. Second, they include a version of the poverty gap in their regressions, which is the proportion of the population under the poverty line, times the average distance from the poverty line (Source: Povcal Net, World Bank). Since the poverty gap is so tightly linked to income levels, they use the residuals from a regression of the gap on income in their regressions. We did the same, but the variable provided little explanatory power and reduced our sample. Also, unlike the other variables in our analysis, the poverty counts are based on surveys that do not occur at regular intervals, and thus the panel is highly unbalanced. For these reasons, we present models without the poverty gap variable.. 14.
(20) Our proxy for the degree of institutional development, as represented by the KKM index, is positive and highly significant across financial indicators and samples, providing support for the notion that broad institutional development helps to foster financial development. The coefficients are larger for the full-country sample than for the sample of low and middle income countries, but they are still large even in the latter case: a one-point increase in the KKM index (5-point scale) is associated with a 23 percentage point increase in liquid liabilities/GDP and a 26 percentage point increase for the private credit ratio. Among the rest of the variables in the expanded regressions, only the Foreign Ownership Share variables is negatively and almost always robustly associated with both our indicators of banking development, and the link is especially strong in low and middle income countries. At first blush, this result would appear to support the notion that foreign banks tend to cherry-pick a set of elite customers and shun the rural sector in favor of the urban sector. However, it is well known that governments and banking supervisors were looking for foreign investors to re-capitalize failed banks during this period. It seems likely, therefore, that much of the increased foreign bank presence occurred in countries with weaker banking systems. Supporting evidence of this can be found in Cull and Martinez Peria (2008), who find that crisis-induced foreign entry was associated with reduced provision of credit to the private sector, whereas countries with reasonably high and stable levels of foreign bank presence tended to have higher private credit levels before, during, and after crises. As we show below, the foreign ownership variable is not significant for Africa, where systemic crises involving large runs by depositors have been much less frequent than in other parts of the developing world. The other variable of bank ownership, State Ownership Share, is positively associated with the liquid liabilities to GDP ratio, but not with the private credit ratio, though the result is not significant for either indicator of banking development. The result on the private credit ratio is. 15.
(21) consistent with the argument that large state ownership of banks makes it possible for the public sector to crowd out the private sector in the credit market and to lower development. The result on the liquid liabilities is instead somewhat more counterintuitive. One possible explanation is that the liquid liability measure is more reflective of excessive liquidity in the state-owned banks. Viewed that way, the liquidity measure becomes a perverse indicator of financial development in a state dominated banking system. Finally, in the expanded models, natural resource intensity remains negatively related to banking sector development for both indicators, and in particular in the low and middle income sample. Similarly, the offshore financial center variable is significant for both indicators for low and middle income countries. Neither per capita income nor the population density variables remain positive and significant when we use the expanded set of regressors. To summarize, the factors that are robustly associated with financial development in developing countries outside of Africa are real natural resource intensity, the offshore financial center dummy, real GDP growth, inflation, the current account balance, broad institutional development, the share of banking sector assets held by foreign banks. These results are used as a benchmark in understanding the financial development gap in Africa.. B. Predicted Versus Actual African Financial Development We now use the regression coefficients in Table 5 to derive a predicted level of financial development for each country in Africa. Because they are likely to be more reflective of the African experience, as our benchmark we rely on the models that include only low and middle income countries.11 Again, we are not claiming that the relationships we find in Table 5 are causal. Rather, we are asking what the level of financial development would be if the same relationships 11. We also tried to estimate models based only on low income countries outside of Africa, but there were too few observations to generate meaningful results.. 16.
(22) held in Africa as in the rest of the developing world. To the extent that predicted and actual levels of financial development are similar, one can say that African financial development is about what it should be. We suppress the bank ownership variables in deriving the predictions because they are large (in absolute value) and are likely to be driven by selection effects in the case of foreign ownership for the reasons described above. Also, as described below, they are not reflective of the African experience. Including the foreign ownership variable drags predicted levels down near actual levels. It seems farfetched to us, however, to believe that the presence of foreign banks can explain the sizable differences between predicted and actual levels of banking sector development that we summarize in this section. 1. African financial development gap: Liquid liabilities. Figure 1 shows that only seven of thirty-one countries have levels of liquid liabilities/GDP which are at or above their predicted levels. Of those, three (Angola, Sierra Leone, and Zambia) are huddled in the lower left hand corner of the figure where actual and predicted values are very low. Because the predicted values are based on linear regressions, they tend to be very near zero for these countries.12 That their actual levels exceed zero by some small amount is little consolation. To a lesser extent the same is true of Mozambique. Ethiopia has predicted and actual levels of liquid liabilities that are quite similar. The result on Ethiopia seems surprising given the country is known to have embarked on very low levels of financial sector reforms and has a banking system dominated by the government. State-owned banks collect deposits but they do not intermediate (lend) well. In fact, the dominant bank in Ethiopia is known to have a high accumulation of liquidity and idle funds in line with the results above that the liquidity measure in the case of state-owned banks is just a perverse measure of financial development. There are only two countries, namely Cape Verde and Mauritius – 12. Indeed, for Angola the predicted value is negative (and large in absolute value). This is due to its high average GDP growth (10.6%), low KKM score (-.71), and high inflation (86.4% per year). Negative levels of financial development are not, however, possible. For countries that have negative predicted values, we reset them to zero in both the figures. The calculations are discussed in the text.. 17.
(23) among the smallest in Africa – that exceed their predicted levels by a substantial amount, but neither of the two is particularly reflective of the African experience. As Figure 1 shows, twenty countries have levels of liquid liabilities that are more than ten percentage points below their predicted levels. The worse ten performers for example range between 24 and 47 percentage points below. The average country falls 13 percentage points short of its predicted level, which is quite sizable, given that the average ratio of liquid liabilities to GDP hovered between 26.5 and 30.9% from 2001 to 2005. 2. African financial development gap: Private Credit: As shown in Figure 2, the level of private credit/GDP for African countries lies far below predicted levels. Again, only seven countries exceed their predicted levels and only Mauritius does so by more than ten percentage points. Of the twenty-four countries with predicted levels that are higher than their actual private credit ratios, seventeen fall short by more than ten percentage points. The ten poorest performers range from 22 to 34 percentage points below their predicted levels, and the average country falls short of its predicted level by 12 points. The magnitude of this measure of under-performance is quite large when one considers that the average ratio of private credit to GDP stood at 15.5% in 2005. The gap in the observed African financial development, relative to what is predicted by the benchmark determinants, is stark. The levels of liquid liabilities to GDP for African countries are about two-thirds the level predicted by statistical relationships that hold elsewhere in the developing world. Private credit ratios are even lower, slightly better than half their predicted levels. There is also general consistency in rankings across the two indicators. Of the bottom ten performers in terms of liquid liabilities, seven are also among the bottom performers in terms of private credit, and the correlation for the differences between predicted and actual levels for the measures of financial development is 0.85. Our results point to systematic under-performance relative to the fundamentals that have been associated with banking sector development in the rest of the world.. 18.
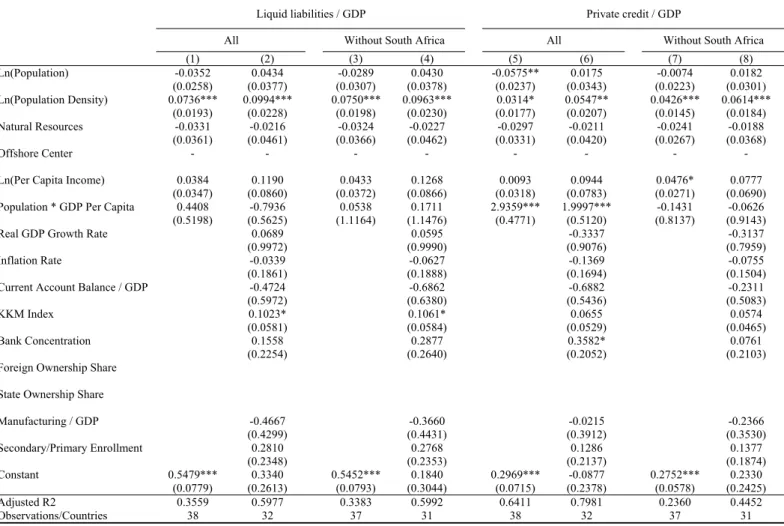
(24) To analyze this gap more in depth, in the next sections we look at whether the factors in our base models relate to African financial development differently than to financial development in the rest of the world. IV. Are the Determinants of African Financial Development Different? So far we have defined under-development in African financial sectors in terms of the determinants of financial sector development in other parts of the developing world. However, the course of African financial sector development might depend on a different set of factors than those that have been important elsewhere.13 While we are reluctant to accept that African financial sectors have a distinct model of development, it seems plausible that some factors may be somewhat more or less important in the African context. To see whether this is indeed the case, as a first step, we estimate the model in Table 6 for the sample of African countries. Note that this method essentially accepts that the level of financial development in Africa is lower than that in the rest of the developing world, and then tries to explain variation around the African mean based on the explanatory variables in our base models. Still, the results are instructive.14 First, population density is much more strongly linked to both liquid liabilities/GDP and private credit/GDP than it was elsewhere in the world. In fact, among the set of exogenous factors in the regression equation (1), population density is the only one that is robustly linked to our indicators of banking development. Moreover, the interaction between population and per capita income is positive and significant in two of the private credit regressions, although not when South Africa is dropped from the African sample. This is reasonable, given the relatively high level of economic development of this country. Second, among the factors that explain financial 13. It may also be that the factors explaining financial development in Africa are the same as for the other countries but these factors load up or contribute differently in the African context. We are open to either interpretation. 14 Note that the offshore financial center variable does not appear in the models in Table 6 because no African countries qualify.. 19.
(25) development in the rest of the developing world, only the KKM index of institutional development seems relevant for Africa but only for the liquid liabilities measure. The other additional factors in the expanded regressions in Table 6 are less important in Africa than elsewhere. Real growth is not significant. We argued earlier that the negative, significant coefficient for growth in the rest of the developing world was consistent with conditional convergence, because it indicated that the least financially developed countries had higher growth rates. The non-result for Africa suggests that such convergence did not occur there, a point which was also made for some African countries in Pritchett (1997). In addition, neither inflation nor the current account balance is significant in the African regressions, whereas both were highly significant in the rest of the world as shown in Table 5. The poor results for inflation, the current account, and growth indicate that the macroeconomic fundamentals that are associated with financial development in other developing countries are not important in Africa.15. A. A Closer Look at Differences in Financial Development Factors The models in Table 6 provide a strong initial indication that the factors associated with banking development in Africa differ from those in the rest of the world. However, those African models are based on only a small number of observations. Moreover, when we include the bank ownership variables in the regressions, our sample drops to only 25 observations, and we cannot derive meaningful results (thus those models do not appear in Table 6). To address the small sample issue we re-run our models for all low and middle income countries (including Africa) and include an interaction between each of our explanatory variables 15. The results on macroeconomic fundamentals suggest that African countries were able to avoid the financial rollercoaster ride associated with macroeconomic instability that other countries experienced during this period. However, this apparent benefit might have come at a substantial opportunity cost associated with the same low levels of financial development during this period. To some extent, therefore, our base regressions give credit to some African countries for having relatively low initial levels of development, stable prices, and a current account surplus. These factors contribute to higher predicted financial development than has actually occurred.. 20.
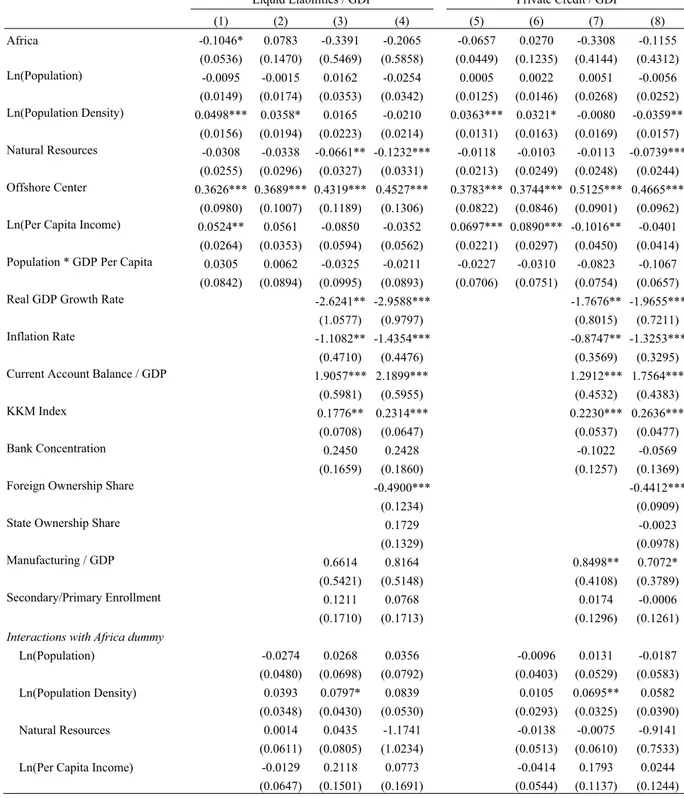
(26) and an Africa dummy variable. We also include an Africa dummy variable on its own to test whether the constant for Africa in our regressions is the same as in the rest of the developing world. This is akin to a seemingly unrelated regression (SUR), but the coefficients on the interactions terms enable us to make more precise statements about whether the effects for Africa are statistically different than for the rest of the developing world and from zero (i.e., there is no effect). The results are presented in Table 7. In the simplest regressions, we include only the Africa dummy and the limited set of regressors (Columns 1 and 5). The Africa dummy is negative for both indicators but it is significant only in the liquid liabilities regression. Per capita income is positive and significant for both indicators; and it remains positive when the Africa interactions are introduced (Columns 2 and 6), although it then becomes insignificant in the liquid liabilities regression. Moreover, per capita income is mostly not significant when we introduce the African interaction terms for the expanded set of regressors (Columns 3, 4, and 8). The offshore financial center variable is positive and significant across all specifications in Table 7, though again no African country qualifies as an offshore center and so there is no Africa interaction for the variable. The most relevant explanatory variable for Africa is again population density. When only the limited set of regressors is included in the regression, population density is positive and highly significant for both indicators of financial development (Columns 1 and 5). When the Africa dummy is interacted with the limited set of regressors (Columns 2 and 6), the relationship is still positive but weaker in terms of significance. When interactions are included for the expanded set of regressors (Columns 3, 4, 7, and 8), the variable is no longer positive and significant. However, the interaction between population density and the Africa dummy is significant for both of our indicators of banking development when the bank ownership variables are excluded from the regressions (Columns 3 and 7). We also reject that the sum of the coefficients for density and its interaction with the Africa dummy is zero at the p = 0.05 level for those models (see F-statistics. 21.
(27) near the bottom of Table 7). In other words, the relationship between population density and our banking development indicators for African countries is significantly different from zero. When the bank ownership variables are introduced (Columns 4 and 8), the coefficient for Africa*population density is positive and remains similar in size for both indicators, but does not quite achieve significance, and we cannot reject that the sum of density and its Africa interaction is zero. This is not too much of a concern, however, as foreign banks do not enter markets randomly and are, in fact, attracted to densely populated areas. The correlation between foreign ownership and density is 0.43 which is significant at the p = 0.01 level. It is no surprise, therefore, that those variables compete for explanatory power in the regression. The density of population clearly preceded and led to the presence of foreign-owned banks, and not the other way around. Therefore, we can safely interpret our regressions in Table 7 as implying that there is a strong relationship between population density and banking indicators for Africa, but not for the rest of the world. In contrast, the relationship between natural resource intensity and banking indicators is about the same in Africa as it is in the rest of the developing world. The coefficient for our proxy of natural resource intensity is negative and tends to be highly significant in our models with the expanded set of regressors and Africa interactions (Columns 3, 4 and 8). The coefficient for its interaction with the Africa dummy is never significant. Thus, we reject the hypothesis that the relationship between natural resources and banking development is somehow different for Africa. In other words, the relatively low levels of banking development cannot be attributable to the curse of natural resources being more severe in Africa than in other parts of the developing world.16. 16. When the bank ownership variables are included in the model the negative coefficients for the interaction between Africa and natural resource intensity, though not significant, become much larger (in absolute value). While this is suggestive of the resource curse being more severe in Africa, there is interplay between the natural resources variable and the foreign bank ownership variable that renders that conclusion dubious. Foreign owners are attracted to resourcerich countries and thus there is a positive correlation between foreign bank ownership and our proxy for resource intensity (0.21, p-value 0.06). It is not therefore surprising that the inclusion of the foreign ownership variable has an effect on the coefficient for the endowment variable. In any event, the standard errors on its interaction with the Africa dummy are so large that the coefficient is telling us very little.. 22.
(28) Concerning the regressors that are only included in the expanded set, the coefficient for real growth is negative and highly significant across all specifications for both indicators of financial development. The coefficient for the Africa*growth interaction is positive and insignificant in the models without the ownership variables (Columns 3 and 7). However, we cannot reject the hypothesis that the sum of the two coefficients (growth and Africa*growth) is zero.17 The same is true for the models with the ownership variables (Columns 4 and 8), even though the Africa*growth coefficients are negative (again see F-statistics near the bottom of Table 7). This indicates again that the conditional convergence result does not hold in Africa, as was suggested by our simple comparison of the coefficients from the base model (Table 5) with those from the African models (Table 6). Similar results hold for the inflation variable which remains negative and highly significant when the interactions are included in the regressions. The interaction between inflation and the Africa dummy is positive, significant, and of a magnitude similar to that of the simple inflation variable. We cannot, therefore, reject the hypothesis that the sum of the inflation and Africa*inflation variables is zero, which indicates that, like real growth, also inflation has not been associated with less financial development in Africa. A similar pattern also holds for the current account balance. Its coefficient is positive and highly significant across models without interactions, but it turns negative in all specifications and significant in most when interacted with the Africa dummy variable. We cannot reject the hypothesis that the sum of the two coefficients is equal to zero; that is, that the current account balance has no effect on African banking development. The regressions that include interaction terms therefore indicate that the high predicted levels of financial development for Africa from our base models derive, in part, from macroeconomic factors that matter only outside Africa. 17. The F-statistic and the p-value are, respectively, 0.001 and 0.97 for the liquid liabilities regression in Column 3, and 0.07 and 0.80 for the private credit regression in Column 7.. 23.
(29) The pattern for the KKM index of institutional development is somewhat different than that for the macroeconomic variables. Its coefficient is positive and significant in all specifications, indicating that it has been associated with banking development outside Africa. Its interaction with the Africa dummy variable is insignificant for the liquid liabilities regression, and we cannot reject the hypothesis that the relationship found elsewhere also applies to Africa. For the private credit regression, however, the interaction term is negative and significant, indicating that such relationship does not hold for Africa. Moreover, summing the coefficient for KKM and its interaction with Africa, we cannot reject the hypothesis that there is no relationship between institutional and banking development in Africa for either indicator (see F-statistics near the bottom of Table 7). In short, the positive relationship between the KKM index and banking development is weaker in Africa than in other developing countries, and what relationship there is seems to apply only to the liabilities side of bank balance sheets rather than to the provision of credit.. B. Toward Resolving the African Finance Puzzle Are the determinants of financial development different in Africa? The more refined analysis indicates that the determinants of banking development in Africa differ from the rest of the world in a significant way. The difference arises even when Africa is benchmarked against other low income countries. Of particular interest is the set of factors that matter outside Africa but not in Africa, and those that matter in Africa but not in the rest of the world. Let us focus on just a few of these factors. While macroeconomic variables are important determinants of banking development in the rest of the world, they surprisingly lose power in the context of Africa. Even an index of institutional development, as represented by the KKM index, shows up weak, particularly in the private credit dimension of banking development. We also observe that the notion of a natural resource curse, which is largely popularized in the context of. 24.
(30) resource-rich countries such as those in Africa, is insignificant in explaining the African financial development gap. The one explanatory variable that stands out for Africa is population density. Our results show a relationship between population density and banking indicators for Africa, but not for the rest of the world. In general, the differences between the predicted and actual values of financial development for Africa become smaller when the interaction terms are included in the regressions. In fact, the average difference for the models with full interactions is very close to zero. No difference is greater than 0.06 or less than -0.06 for either indicator of banking development. The majority of the predicted values lie within two percentage points of their actual levels. The simple Africa dummy, which is really a measure of our ignorance about what drives African financial development, is no longer significant. Our findings suggest that, if mechanisms for holding down inflation, generating a current account surplus, and conditional convergence were to work in Africa as elsewhere, the levels of financial development would be higher. At the same time, it remains a puzzle as to why those mechanisms do not seem to work in Africa, or what policies might help to start the relationship between macroeconomic fundamentals and financial development. Perhaps a period of sustained economic growth will ignite those mechanisms, but the African puzzle continues in a different form.18. 18. Another possibility is that variables that are important for African financial development are omitted from our models. For example, Easterly and Levine (1997) demonstrate that ethnic fractionalization explains a large share of factors that are linked to (slow) growth within Africa. We experimented with two types of variables: fractionalization and armed conflict. We use the fractionalization data as in Alesina et al. (2003); and we use the UCDP/PRIO dataset to calculate the average number of armed conflicts per year for each country. Neither variable is significant in our banking development regressions, and their inclusion does not alter the main qualitative results of our models.. 25.
(31) C. Additional Tests and Robustness Checks We now perform additional tests and robustness checks. In particular, we analyze in further depth the role of population density, which shows up so strongly in Africa, and of foreign bank ownership, which has mixed effects. Moreover, we consider another indicator of financial development as represented by the stock market development, and see whether a similar gap as the one found for banking development indicators arises in the context of stock markets. Although stock markets still remain small and illiquid, African countries seem to have committed to the equity sector in promoting financial development and several stock exchanges have emerged in Africa in the recent past. 1. Population density: We try to better understand why sparsely populated African countries have low levels of banking development by, first, examining the ‘shape’ of the relationship between density and financial development based on our regression models and, second, including additional variables related to population density in the regressions. The final aim is to get a sense of what policy responses may be promising to improve financial development in Africa. Figure 3 shows the relationship between population density and liquid liabilities/GDP for the typical African and non-African developing country based on Table 7. Specifically, the vertical axis plots predicted values from Model 2 in Table 7. For all variables other than population density, we use the mean value for the subsample (either Africa or other developing countries) multiplied by the appropriate coefficient for that subsample. For population density, we run through the range of possible values and multiply by the appropriate coefficient for each subsample to generate the curvature. Hence, non-population density factors (partially) account for the distance between the curves for Africa and that for other developing countries. Three features of the graph in Figure 3 are worth noting: (1) the largest differences between Africa and the rest of the developing world come at the lower end of the density scale; (2) density. 26.
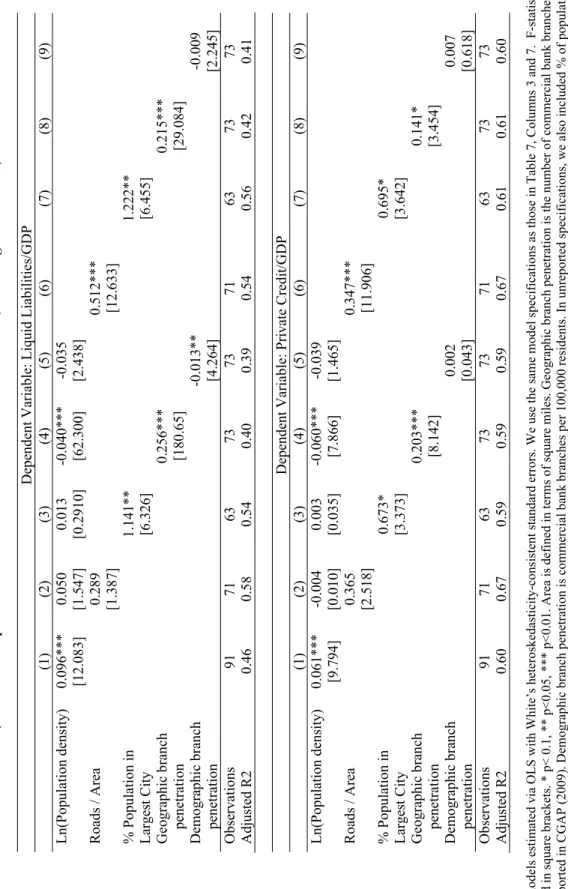
(32) affects financial development in all countries but the relationship is much steeper for Africa; and (3) although African countries tend to have lower population densities, there is substantial overlap for the two samples, which suggests that comparisons across the full range of the density spectrum are valid. The picture points to important differences between Africa and the rest of the world, which could be due to the fact that the minimum viable scale in banking is greater in Africa than elsewhere or to other institutional or infrastructural failures. Regardless of the explanation, Figure 3 highlights Africa’s difficulty in overcoming problems related to scale for the least densely populated countries. Similarly to Figure 3, Figure 4 shows the relationship between population density and private credit/GDP based on the coefficients of Model 6 in Table 7. As in the figure for liquid liabilities/GDP, the gap between Africa and the rest of the developing world is largest at the lowest levels of population density. However, unlike for the liquid liabilities measure, that gap does not dramatically close at intermediate density levels. This suggests that while differences in minimum viable scale could explain differences between Africa and the rest of the developing world with respect to savings, they cannot account for Africa’s lower levels of private credit over the full range of population densities. To understand the aspects of population density that contribute to low levels of banking development in Africa, we include additional variables in our regressions that summarize (1) spatial population characteristics, such as large population agglomerations, (2) infrastructural and transportation development, and (3) physical banking presence (i.e., branch penetration measures). The results of these new regressions can help understand what policies may be effective in fostering African development. If population agglomeration and infrastructural development can account for most of the strong relationship between population density and banking under-development in Africa, provision of financial services might improve as a natural consequence of broader economic/infrastructural improvements or policies that specifically encourage economic. 27.
(33) participation by those that live outside urban agglomerates. On the other hand, if measures of bank branch penetration are better able to account for the density/banking development relationship in Africa, then it is more likely that specific banking market failures, perhaps related to relatively high minimum viable scale, are at the heart of African under-performance. For spatial population characteristics, we include the percentage of the population residing in the largest city, the percent of the population in urban agglomerates, and a measure of population concentration with zero indicating a uniform distribution of residents across 20km by 20km cells and one indicating that the entire population is concentrated in a single 20km by 20km cell. For infrastructural development we include roads per square km and railroad track per square km. For bank penetration, we include commercial bank branches per 100,000 residents (demographic penetration) and branches per sq. km (geographic penetration). Inclusion of many of these variables reduces sample size substantially and their coefficients are insignificant. The results for the variables that do produce significant results (roads per sq.km, percentage of population in the largest city, and the two branch penetration measures) are presented in Table 8. The population density variable is no longer significant when any of these variables are introduced (in fact it becomes negative and significant when the geographic branch penetration variable is included), suggesting that roads, population in major cities, and bank branch penetration are all relevant factors in understanding the strong link between population density and financial development in Africa. That said, only the coefficients for the percentage of population in the largest city and the geographic bank branch penetration measure are consistently significant across the models in Table 8. This pattern is consistent with the notion that physical proximity to providers of financial services accounts for much of the variation in African banking development and thus the minimum viable scale is best achieved in major cities.. 28.
(34) It is also worth noting that the links to financial development for the geographic penetration and largest city population variables are much stronger (in terms of statistical significance) for liquid liabilities to GDP than for private credit to GDP. Again, overcoming difficulties associated with population density appears more effective on the savings side than on the credit side. 2. Bank foreign ownership: In Table 7 the foreign ownership variable has a negative and highly significant coefficient, while its interaction with the Africa dummy produces a positive coefficient that is significant and somewhat larger (in absolute value). Summing those coefficients up, the net relationship between foreign ownership and our banking indicators for African countries is positive, though we cannot reject the hypothesis that there is no relationship (i.e., that the coefficient for Africa is zero). Still, whatever negative relationship there is between foreign ownership and banking development in the rest of the world, it does not seem to apply to Africa. While the share of banking sector assets controlled by foreign banks is perhaps the most obvious ownership measure to include in our regressions, non-random selection is a major concern, and its inclusion does affect other coefficients such as population density and natural resource intensity. What we need is a variable that describes ownership patterns but is less endogenous to the process of financial development. We therefore use the Barth, Caprio, and Levine (2008) indexes of limitations on foreign bank entry and ownership and of general requirements to enter into banking, reasoning that those restrictions provide an indication of a country’s predilections toward outside investment in its financial sector. Such predilections can be easily overturned, as in times of financial crisis, and many countries, in fact, have a high degree of foreign ownership of the banking sector and restrictive rules on foreign entry. We therefore think that the restrictions on entry and ownership are more plausibly exogenous, though we admit that these too are not perfect. Similarly to Barth et al. (2008), we find a negative coefficient for the index of foreign entry limitations when we include these indexes in the regressions in Table 7, or when we replace the. 29.
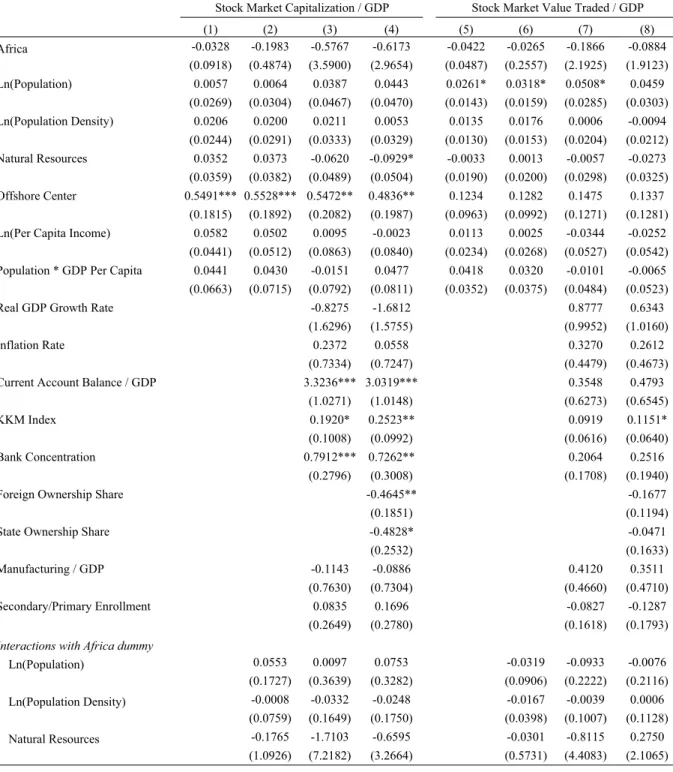
(35) state and foreign ownership variables with them, though the coefficient is not always significant. The result suggests that countries with a predilection to restrict foreign presence are likely to have less banking development than others. More importantly, when we replace the ownership variables with the restrictions on entry, the results for the population density variable are qualitatively very similar to those for regressions that do not include the ownership variables (Columns 3 and 7, Table 7). For that reason, we do not present the results using the indexes of restrictions in the paper. The results from those regressions do, however, support the notion that the relationship between population density and banking sector development is important in Africa, but not elsewhere. 3. Stock market development: We replace our indicators of banking development with indicators of stock market development, namely stock market capitalization and the value of traded shares, each divided by GDP, and re-run the models in Table 7. These are yearly observations that we average over the sample period for each country as described above. We are unable to run our base models from Table 6 on the sample of African countries because so few of them have indicators of stock market development. The results from the full interaction models in Table 9 are notable only because none of the variables that are associated with stock market development in the rest of the developing world are important in Africa. That is, we cannot reject the hypothesis that the relationship between any of the variables in our models and our indicators of African stock market development is zero (see Fstatistics at the bottom of Table 9). This is very likely to depend on the early stage of development of stock markets in Africa. Once these stock markets are better established, it might be easier to analyze the determinants of their development via cross-country regressions.. V. Firm-level Tests on the Access to External Finance As mentioned earlier, cross-country studies focusing on country-level variables have been. 30.
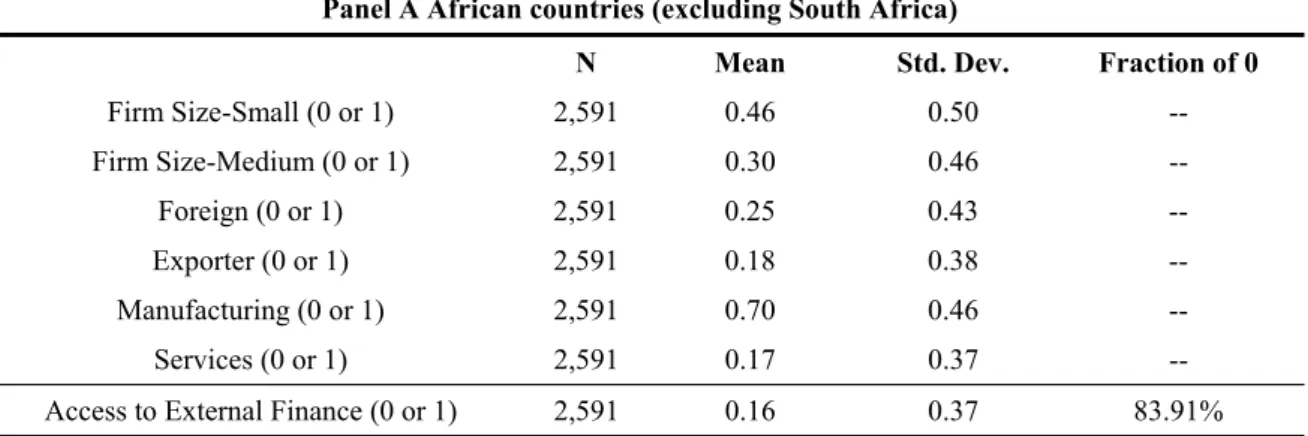
(36) criticized on several grounds. For example, the observed results may be driven by measurement errors or unobservable factors. As a final empirical exercise we turn to firm-level information drawn from the Investment Climate Surveys (ICS) conducted by the World Bank over the past decade.19 While country level indicators of banking development might suffer from measurement errors, firm-level responses about their use of financial services should not. Also, our country level regressions involve one observation per country and thus have fewer degrees of freedom than what are available in firm-level regressions. Finally, the firm-level data sets allow us to control for a number of potentially relevant firm characteristics (e.g., size, sector) that could explain substantial variations in the demand for and use of financial services. For all of these reasons, the firm-level regressions could provide more precise estimates of the relationships between financial development and our explanatory variables than the country-level regressions. Furthermore, to the extent that we derive similar qualitative results for the firm- and country-level regression, it provides additional, and perhaps stronger, support for the conclusions that we have drawn to this point based only on the country-level regressions. Table 10 presents summary statistics on our firm-level sample. Firm characteristics (all dummy variables) include size (small, medium, and large based on the number of employees), industry (manufacturing, services, and others), exporter status and foreign ownership status. It appears that there are more small firms and non-exporting firms in the African (excluding South Africa) sample than in other developing countries, while the fraction of firms with foreign ownership stakes is higher in the African sample. Firm financing sources, for both short term (working capital) and long term (new investments) purposes, include internal (e.g., retained earnings) and external channels. Following prior research, we focus on long term external financing from financial institutions, the most important external financing channel in most 19. These surveys have been used frequently in recent cross-country, firm-level studies on law, institutions, finance and growth (e.g., Beck, Demirgüç-Kunt, and Levine, 2005; Beck, Demirgüç-Kunt, and Maksimovic, 2005).. 31.
(37) developing countries. Specifically, the external finance dummy equals one if a firm has access to loans from domestic or foreign banks, or credit card debts from these institutions; and zero otherwise. Almost 84% (74%) of firms in Africa (other developing countries) do not have access to financial institutions.20 Our basic strategy is to pattern our firm-level regressions on the country-level regressions, but also to include variables that summarize firm characteristics. We note, however, that we have all of the necessary variables for firms from only twelve countries in Africa. Since the standard errors in our models allow for clustering at the country level, we are not able to include all of the country-level regressors that were in the cross-country regressions in Table 7, though the most important ones are included.21 Since the majority of firms in Africa and elsewhere do not have access to bank finance (Table 10), our dependent variable is a dummy indicating whether the firm received any financing from a formal provider, rather than a continuous variable showing the importance of institutional finance among all financing sources.22 Table 11 reports the marginal effects from Probit regressions. The main result from Table 11 is that both the geographic and demographic bank branch penetration variables are positive and significant for African countries, though again the result is stronger for geographic penetration. These variables are insignificant and of lower magnitudes in the rest of the developing world than for Africa. By contrast, population density is positive and significant for non-African countries (models 1 and 2), but not for African countries when the 20. We only include firm observations for which data is available on whether the firm has access to all three external financing channels (domestic and foreign banks and credit cards). Summary statistics reported in Table 10 represent the sample we use in regressions reported in Table 11. 21 We performed a series of robustness checks in which we added each of the country-level variables from the countrylevel regressions in Table 7 that do not appear in the firm-level regressions in Table 11, one at a time. Qualitative results are very similar to those reported in Table 11. 22 For the surveys completed through 2006, the dummy variable is equal to one if the firm reported a positive value for finance from local banks, foreign banks or credit cards. For the surveys after 2006, those questions were broadened to ask whether firms received finance from private or state owned commercial banks, or from non-bank financial institutions. Since banks are the main providers of financial services throughout the developing world, this slight change in question format does not present a major problem. Regression results are very similar when we include a post-2006 dummy variable.. 32.
Figura
+7
Documenti correlati
We find that more knowledgeable investors are more likely to consult advisors, while less informed ones either invest by themselves (without any pro- fessional advice) or delegate
“Using Financial Innovation to Support Savers: From Coercion to Excitement.” In Rebecca Blank and Michael Barr (eds), Insufficient Funds: Savings, Assets, Credit and Banking
Remittances grew substantially up to 2008 in all case studies (for which there were data), but the crisis led to a decline or greatly reduced growth in remittances during the
In particular, the recent global financial crisis has challenged the idea that multinational banks play a positive role as shock absorbers in local markets; with reference to
The two types experimental results (in the computer simulation and in the real economic experiment) show that introduction of complementary currency removes the restrictions arisen
In una missiva inviata dal Montecuccoli l’11 maggio 1599 11 , ad esempio, troviamo alcuni casi tipici: quello del contadino Bartolomeo Forghieri di Novi, delinquente abituale,
Once we assessed the effectiveness of the produced framework, we used it for automatic remote animal monitoring considering the unlabeled data available, which we could not use in
The analyzed interferograms showed two deformation events that can be directly related to pre-eruptive deformation phases at two mud volcanic edifices: the Ayaz-Akhtarma and
