RESEARCH ARTICLE
Signatures of selection and environmental
adaptation across the goat genome
post-domestication
Francesca Bertolini
1,2*, Bertrand Servin
3, Andrea Talenti
4, Estelle Rochat
5, Eui Soo Kim
6, Claire Oget
3,
Isabelle Palhière
3, Alessandra Crisà
7, Gennaro Catillo
7, Roberto Steri
7, Marcel Amills
8, Licia Colli
9,10,
Gabriele Marras
11, Marco Milanesi
9,12, Ezequiel Nicolazzi
11, Benjamin D. Rosen
13, Curtis P. Van Tassell
13,
Bernt Guldbrandtsen
14, Tad S. Sonstegard
6, Gwenola Tosser‑Klopp
3, Alessandra Stella
10, Max F. Rothschild
1,
Stéphane Joost
5, Paola Crepaldi
4and the AdaptMap consortium
Abstract
Background: Since goat was domesticated 10,000 years ago, many factors have contributed to the differentiation of goat breeds and these are classified mainly into two types: (i) adaptation to different breeding systems and/or purposes and (ii) adaptation to different environments. As a result, approximately 600 goat breeds have developed worldwide; they differ considerably from one another in terms of phenotypic characteristics and are adapted to a wide range of climatic conditions. In this work, we analyzed the AdaptMap goat dataset, which is composed of data from more than 3000 animals collected worldwide and genotyped with the CaprineSNP50 BeadChip. These animals were partitioned into groups based on geographical area, production uses, available records on solid coat color and environmental variables including the sampling geographical coordinates, to investigate the role of natural and/or artificial selection in shaping the genome of goat breeds.
Results: Several signatures of selection on different chromosomal regions were detected across the different breeds, sub‑geographical clusters, phenotypic and climatic groups. These regions contain genes that are involved in impor‑ tant biological processes, such as milk‑, meat‑ or fiber‑related production, coat color, glucose pathway, oxidative stress response, size, and circadian clock differences. Our results confirm previous findings in other species on adaptation to extreme environments and human purposes and provide new genes that could explain some of the differences between goat breeds according to their geographical distribution and adaptation to different environments. Conclusions: These analyses of signatures of selection provide a comprehensive first picture of the global domesti‑ cation process and adaptation of goat breeds and highlight possible genes that may have contributed to the differen‑ tiation of this species worldwide.
© The Author(s) 2018. This article is distributed under the terms of the Creative Commons Attribution 4.0 International License (http://creat iveco mmons .org/licen ses/by/4.0/), which permits unrestricted use, distribution, and reproduction in any medium, provided you give appropriate credit to the original author(s) and the source, provide a link to the Creative Commons license, and indicate if changes were made. The Creative Commons Public Domain Dedication waiver (http://creat iveco mmons .org/ publi cdoma in/zero/1.0/) applies to the data made available in this article, unless otherwise stated.
Open Access
*Correspondence: [email protected]; [email protected]
1 Department of Animal Science, Iowa State University, Ames, IA 50011, USA
Background
The goat (Capra hircus) is considered one of the earli-est domearli-esticated livearli-estock species. The domearli-estication process started around 10,000 years ago in the Fertile Crescent area from a unique wild and still living ances-tor, the bezoar or Capra aegagrus [1]. At present, there are more than one billion of goats that inhabit all types of ecological areas across the globe [2]. Compared with the other major livestock species such as pigs, cattle and sheep, goats have undergone the largest increase (+34%) in population since 2000, i.e. larger than pigs (+15%), cattle (+14%) and sheep (+14%) (http://www. fao.org/faost at/en/). Today, over 90% of the goats are distributed across Asia and Africa, followed by the Americas, Europe, and Oceania [3]. In the most rural areas of the world, goats are often considered the poor person’s cow. In fact, goats can be used for milk, meat, fiber, and leather production [4], as well as transport. Moreover, they are easy to house and manage; goats can be raised by small families, women, and children and provide a fundamental source of food for millions of people. Several factors have contributed to the differen-tiation of goat breeds, which are classified mainly into two types: (i) adaptation to different breeding systems and/or purposes, i.e. in some countries, breeds have been selected for specific production traits such as milk (e.g. Saanen and Alpine), meat (e.g. Landrace and Boer) and fiber (e.g. Angora and Cashmere); and (ii) adapta-tion to different environments, i.e. goats have adapted to various agro-climatic conditions. In addition, goat breeds have undergone differentiation through founder effects, and the processes of admixture and genetic drift. Thus, about 600 breeds have been developed and are distributed worldwide [5]. They differ from one another in terms of many phenotypic characteristics such as size, color, horn shape and dimension, repro-ductive and prorepro-ductive traits and are adapted to a wide range of bioclimatic conditions. Directional natural and artificial selection events have left footprints across the genome, which are known as signatures of selec-tion. Signatures of selection are defined as the reduc-tion, elimination or change of genetic variation in genomic regions that are adjacent to causative variants in response to natural or artificial selective pressure. Such variants usually affect several traits and contrib-ute to shaping a breed [6]. The process by which the frequency of a selectively favored variant increases in a population is termed a selective sweep. The recent development of species-specific genomic tools (such as single nucleotide polymorphism (SNP) arrays) have allowed researchers to extend whole-genome analy-ses to livestock species, which cover many aspects of
genetic diversity, including signatures left by selection processes [7].
In spite of the major economic importance of goats, high-throughput genomic resources for this species have become available only recently. In 2011, the Inter-national Goat Genome Consortium developed and released the first high-throughput SNP chip with more than 50,000 SNPs (Illumina CaprineSNP50 BeadChip), which was built using 10 biologically and geographi-cally different breeds [8]. The first complete assembly of the goat genome was released in 2013 by Dong et al. [9] and a second version of the reference genome that exploits single-molecule long read sequencing (PacBio) has just been released (ARS1; [10]). With this new ver-sion, gene annotation has improved considerably and the position of the SNPs on the CaprineSNP50 BeadChip has been updated. With the availability of genomic and high-throughput SNP tools, there is an increased interest in identifying and exploring signatures of selection and the genomic diversity resulting from adaptation to environ-ment and human selective pressure. These genomic tools were used to identify signatures of selection in circum-scribed datasets. The CaprineSNP50 BeadChip was used to investigate and compare several Swiss goat breeds and genomic signatures of selection were detected in regions that affect variation in coat color, growth, and milk com-position [11]. The combination of analyses of runs of homozygosity (ROH), FST (fixation index), XP-EHH (cross population extended haplotype homozygosity), and the use of Bayesian methods allowed the detection of signatures of selection in a region that contains genes related to the immune system in another mountain breed raised in the North of Italy, the Valdostana Italian goat breed [12]. Other analyses of signatures of selection were performed in a reduced number of breeds, thus detecting regions that are linked to production and reproduction traits [13] and in the Barki Egyptian goat breed, which is raised and adapted to hot/dry environments [14]. In the latter study, analyses of iHS (integrated haplotype score) and pairwise FST that identified selective sweeps led to the identification of genes related to thermotolerance, body size, energy metabolism and nervous and auto-immune response [14]. Furthermore, signatures of selec-tion that were linked to dry and hot condiselec-tions and to metabolic traits were identified by using whole-genome sequence (WGS) data from Moroccan goat breeds through XP-CLR analysis [15]. WGS information was also successfully used to detect regions that are under different selection pressures in Chinese and Mongolian goats and are related to breeding or reproductive traits [16, 17].
Genomic changes that result from climate changes and are linked to adaptation to different environments can be
analyzed with a landscape genomic approach, which was successfully applied in other livestock species, for exam-ple in Ugandan cattle [18]. To date in goats, this approach was applied only on a reduced number of SNPs or ampli-fied fragment length polymorphism (AFLP) markers [19, 20]. However, it would be interesting to apply it at the genomic level since it provides useful information on the environmental factors that shaped the genome.
In this work, we used different approaches to iden-tify regions under artificial and environmental selection across the AdaptMap goat dataset, which is composed of data from more than 3000 animals that were collected worldwide and genotyped with the CaprineSNP50 Bead-Chip. For this purpose, we considered several groups of animals that were partitioned based on geographi-cal area, as done in Colli et al. [21], production uses, available records on solid coat color and environmental variables in relation to the geographical coordinates of sampling. For the first time, we applied FLK and hapFLK analyses on goat data, which have been successfully used in analyses of high-throughput data from sheep [22, 23]. These methods increase the power of detection for sig-natures of selection, and they enable detection of soft or incomplete selective sweeps. Finally, we also applied landscape genomic approaches to this large goat dataset, to investigate the role of natural selection in shaping the goat genome.
Methods
Prior to the application of methods for detecting signa-tures of selection, we applied several filtering steps to the AdaptMap goat dataset, which originally contained 4563 animals from 144 breeds that were collected world-wide and genotyped with the CaprineSNP50 Bead-Chip. This dataset was first edited by removing mixed breeds, related animals, SNPs that were monomorphic, unmapped, mapped to sex chromosomes or with low call rate, which resulted in a working dataset of 46,654 SNPs and 3197 animals [21].
Additional filtering steps were applied depending on the analysis performed, as described below. The main analyses are summarized as follows: (1) detection of signatures of selection based on the genetic diversity of subcontinental populations or breeds, and (2) detection of signatures of selection associated with specific phe-notypes, traits or external variables (e.g. annual mean temperature based on global positioning system (GPS) coordinates). In general, each investigation was con-ducted using two complementary approaches. For each analysis, genes within selected regions or nearby detected SNPs (± 100 kb) were identified using the Bedtools
software [24] and the most recent version of the goat genome assembly (ARS1; [10]).
Signatures of selection based on genetic diversity of subcontinental populations or breeds
Signatures between and within subcontinental groups To detect signatures of major differentiation between populations, we used the FLK [25] and hapFLK [26] approaches. Briefly, these methods account for popu-lation structure and differences in effective popupopu-lation size by modelling the genetic divergence between pop-ulations as derived from drift and population division. Because these methods are not completely robust to strong bottlenecks and large admixture events, subsets of populations were selected starting from the work-ing dataset, removwork-ing admixed animals and strongly inbred populations. This was done first by identify-ing genetic sub-structure in the initial diversity analy-sis which defined sub-continental groups [21]. Then, an admixture analysis was carried out to identify and remove admixed populations within each sub-conti-nental group, which generated sub-contisub-conti-nental filtered groups. This last step was performed using the Treemix software [27], allowing for up to three migration events within each group. Graphical representations of the results of all Treemix analyses are in Additional file 1. The number of animals included in each sub-continen-tal group is in Table 1. The final dataset comprised 2481 individuals that are grouped into 62 (61 Capra hir-cus + one Capra aegagrus) populations.
Following filtering of the data, FLK and hapFLK analy-ses were carried out on each of the sub-continental fil-tered groups, using the wild ancestor of domestic goat (Bezoar, Capra aegagrus) as an outgroup to root popu-lation trees. For hapFLK, the cross-validation procedure was performed with the fastPHASE software [28], which determined that 30 haplotype clusters were needed to capture haplotype diversity. For both hapFLK and FLK analyses, p-values were computed as explained in the hapFLK software documentation. False discovery rates (FDR) were estimated using the qvalue R package [29] and SNPs corresponding to an FDR of 0.15 or less were considered significant.
A genome scan for signatures of selection between sub-continental groups was also performed using FLK analysis as described by Fariello et al. [22]. Briefly, the frequency of the ancestral allele of each group was esti-mated from the within-group analysis. These ancestral alleles were then used to perform a new genome scan using FLK analysis. Frequencies of Bezoar alleles were used to root the population tree. Only the groups that corresponded to clear geographical clustering of goat populations were considered for this ancestral analysis,
i.e. the Southwestern, Southeastern, Northern and Alpine European groups, the Central Asian group and the Northwestern, Easter and Southern African groups. Signatures of selection within breeds
The above-mentioned filtered dataset that was used for FLK and hapFLK analyses was also used to detect signa-tures of selection within the breeds using: (i) ROH and (ii) iHS statistic [30]. ROH analyses were performed using the Zanardi software [31] by considering a mini-mum of 15 SNPs per ROH, a minimini-mum ROH length of 1 Mb and allowing for one heterozygous SNP within an ROH to account for the possibility of genotyping errors. For each SNP, the proportion of animals that displayed a homozygous region at that SNP was calculated. Then, this measure was transformed by its empirical quantile for all SNPs across the genome (i.e. the proportion of all SNPs with a higher or equal proportion of homozygous animals in the breed considered). The iHS analyses were performed in populations with at least 10 genotyped individuals. Within each population, phasing of individu-als was performed using SHAPEIT2 [32]. For SNPs with a minor allele frequency higher than 0.05, the ancestral alleles were randomly assigned. The iHS statistics were calculated using the rehh v2.0 R package [33]. Standard-ized iHS values were computed in allele frequency bins of 0.05 and then further corrected using robust estimations of their mean and variance using the rlm function from the MASS R package [34]. Because assessing significance of ROH and iHS values is less robust, ROH and iHS sig-nals were reported only for significant FLK or hapFLK signatures of selection.
Signatures of selection associated with specific traits or external covariates
External phenotypes and production traits
Reduced subsets of the dataset were investigated to detect genomic regions associated with specific phe-notypes. Reductions were performed according to the availability of the information for each animal or breed included in the dataset. Therefore, two reduced panels were created corresponding to differences related to pro-duction purposes and phenotypes (solid coat colors). Panel 1: production purposes A questionnaire that con-tained four possible production assignments (milk, meat, fiber, and leather) was circulated to all AdaptMap mem-bers who provided the samples, to obtain information on the main purpose of each breed. Pre-filtering was per-formed by considering only breeds with known and prev-alent purposes. Since none of the breeds was described Table 1 Number of animals and breeds that composed
the sub-continental groups after filtering steps
Groups Breed code Breed name
(Country) Number
Alpines ALP_FR Alpine (France) 50
BIO Bionda dell’Adamello 24
FSS Fosses 24
ORO Orobica 22
PTV Poitevine 27
SAA_FR Saanen (France) 50
VAL Valdostana 24
VSS Valpassiria 24
Angoras ANG_AR Angora (Argentina) 50 ANG_FR Angora (France) 26 ANG_ZA Angora (South Africa) 48
ANK Ankara 18
IRA Iranian goat (unknown) 9
KIL Kil 23
Boers BOE_AU Boer (Australia) 32 BOE_CH Boer (Switzerland) 50 BOE_US Boer (United States) 29 BOE_ZW Boer (Zimbawe) 17
Central Asia THA Thari 16
TED Teddi 47
PAH Pahari 19
KAC Kachan 19
DDP DDP 20
East Africa ABR Abergelle 49
GAL Galla 23 GUM Gumez 39 KAR Karamonja 19 KEF Keffa 44 MAA Maasai 18 PRW Pare White 19
SEA Small East African 50
SEB Sebei 21
SNJ Sonjo 20
WYG Woyito Guji 39
Egypt BRK Barki 50
NBN_EG Nubian (Egypt) 50
OSS Oasis 50
SID Saidi 50
Northern Europe LNR_DK Landrace (Denmark) 50 LNR_FI Landrace (Finland) 20
NRW Norwegian 17
North west Africa CAM Cameroon goat 37
GUE Malagueña 16
PEU Peulh 22
RSK Red Sokoto 19
SAH Sahel 15
TAR Targui 19
as being solely raised for leather production, this purpose was excluded from subsequent analyses.
Then, another filtering step was performed on the working dataset to remove breeds that are raised for more than one purpose by using an in-house script that discarded animals belonging to different purpose groups that shared the same coordinates of the first component ± 1.5 of the overall quantile distribution (ee Additional file 2: Figure S1). The final filtered dataset included 192 animals (three breeds) for fiber, 241 ani-mals (12 breeds) for meat and 818 aniani-mals (23 breeds) for milk. Details on breeds and sample sizes are in Table 2a. Three types of analyses were carried out on the final fil-tered dataset: ROH, FST and XP-EHH. ROH analyses were performed for each separate purpose group using the Zanardi software [31] by considering a minimum of 15 SNPs per ROH, a minimum ROH length of 1 Mb and allowing for one heterozygous SNP within an ROH to account for the possibility of genotyping errors, as pre-viously mentioned. The FST and XP-EHH analyses were carried out by comparing each group against all the oth-ers and using the script described by Talenti et al. [12] in which 1-Mb windows with an overlap of 500 kb were considered for window-based FST and the Selscan soft-ware [35] for XP-EHH. The results were normalized with the norm normalization tool included in the software suite.
For all three analyses (ROH, window-based FST and XP-EHH), the top 0.5% of SNPs based on marker or win-dow distribution was retained as relevant. The Bedtools software [24] was used to find consensus regions between two or all three approaches. Only regions detected by
at least two approaches were considered for further analyses.
Panel 2: solid coat colors Pictures representative of the breeds for each animal of the working dataset were pro-vided by the AdaptMap members and were inspected to find common and unique patterns across each breed. Considering the high variability of patterns and the lack of availability of high-quality pictures for some breeds, only those with confident solid coat colors were con-sidered. Three groups were created: a Black group (79 animals and three breeds), a White group (375 animals and six breeds), and a Red group (93 animals and three breeds). Breeds and samples sizes are in Table 2b. For each group, a FST analysis was carried out by consider-ing the followconsider-ing pairwise comparisons: White vs. Black and Red, Black vs. White and Red vs. White. These comparisons were performed using the script described by Talenti et al. [12] for which 500-kb windows with overlaps of 250 kb were considered. For each compari-son, the top four windows that contained at least four SNPs, corresponding to the 0.9996 percentile of the overall distribution were considered. The genes within these windows were screened using the coat color gene website of the International Federation of Pigment Cell Society (http://www.espcr .org/micem ut) to investigate their direct or indirect associations with coat colors in mice and shades of skin color in humans.
SNPs that were located on either side of candi-date genes for both purpose and coat color panels (± 5 Mb = short and ± 10 Mb = long) were used as sets of variables with the same animals for canonical discri-minant analysis (CDA), which was performed with the CANDISC procedure implemented in SAS-stat software (SAS Institute, Inc., vers.9.4). These analyses allowed the identification of the SNPs that contributed most to the discrimination between groups. These contributions were summarized as canonical functions (CAN), which were linear combinations of the original variables (discri-minant SNPs). Visual inspection of the CAN1 vs. CAN2 scatter plot of the CAN1 and CAN2 values for each SNP was used to pinpoint the precise regions associated with the separation between groups.
Signatures of selection associated with bioclimatic environmental variables
To study the influence of the environment on the distri-bution of adaptive genetic variation, a landscape genomic approach using the Samβada software [36] and FST analyses were applied to identify genotypes that are sig-nificantly associated with environmental variables. For this purpose, we used a reduced subset of samples with Country is indicated when necessary for the analysis
Table 1 (continued)
Groups Breed code Breed name
(Country) Number
South Africa DZD Dedza 15
LND Landin 29
MSH Mashona 22
South eastern Europe ARG Argentata 24
CCG Ciociara Grigia 16
DIT Di Teramo 19
GAR Garganica 15
GGT Girgentana 24
South western Europe BEY Bermeya 23
MAL Mallorquina 18
MLG Malaguena 40
MUG Murciano‑Granadina 20
PYR Pyrenean 26
known geographic coordinates of the sampling point. This reduced dataset contained 2661 animals from 28 countries (Table 3). Finally, an additional filtering step was applied before performing the FST analyses (see below).
Landscape genomic analyses The environmental condi-tions were characterized using the bioclimatic variables from the WorldClim database (http://www.world clim. org/) (see Additional file 3: Table S1). These data were available worldwide at a resolution of one arc-second and represented an average of the conditions from years 1950 to 2000. The values of these variables were extracted for the coordinates of each sampling point using the QGIS
2.14.7 software and were centered-reduced. A buffer area around each sampling point was generated to integrate, into the model, the environmental variability of the area that could influence an individual. Here, a radius of 5 km was selected which assumed that the goat could move in a circular area of 10 km in diameter, centered on the sam-pling point. Within that area, in order to consider only the area corresponding to the potential home range of the goats, a land cover discrimination based on the Global Land Cover 2000 classification was applied [37]. On this basis, the areas corresponding to artificial surfaces (urban land cover) and water bodies were removed. For the remaining areas, the bioclimatic variables were retrieved and for each one, seven statistical measures (minimum, Table 2 List of filtered animals and breeds for comparisons of breeds with different production purposesa and coat
colorsb
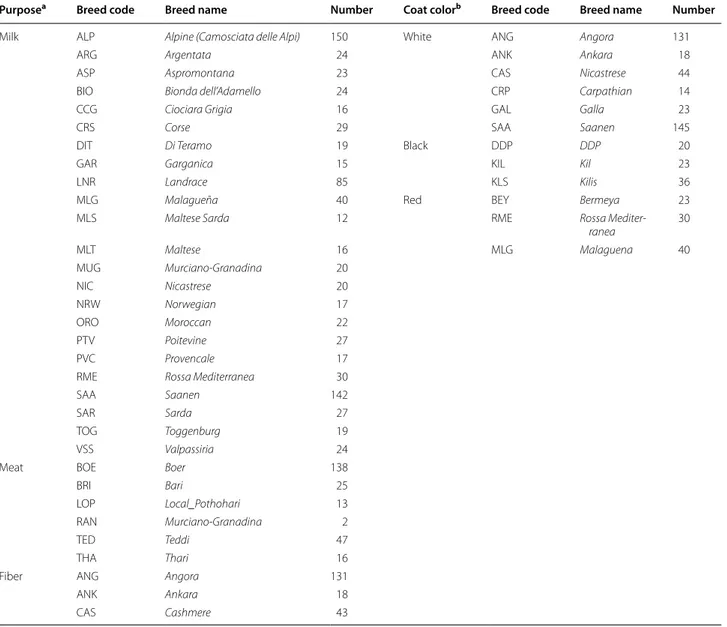
Purposea Breed code Breed name Number Coat colorb Breed code Breed name Number
Milk ALP Alpine (Camosciata delle Alpi) 150 White ANG Angora 131
ARG Argentata 24 ANK Ankara 18
ASP Aspromontana 23 CAS Nicastrese 44
BIO Bionda dell’Adamello 24 CRP Carpathian 14
CCG Ciociara Grigia 16 GAL Galla 23
CRS Corse 29 SAA Saanen 145
DIT Di Teramo 19 Black DDP DDP 20
GAR Garganica 15 KIL Kil 23
LNR Landrace 85 KLS Kilis 36
MLG Malagueña 40 Red BEY Bermeya 23
MLS Maltese Sarda 12 RME Rossa
Mediter-ranea 30 MLT Maltese 16 MLG Malaguena 40 MUG Murciano‑Granadina 20 NIC Nicastrese 20 NRW Norwegian 17 ORO Moroccan 22 PTV Poitevine 27 PVC Provencale 17
RME Rossa Mediterranea 30
SAA Saanen 142
SAR Sarda 27
TOG Toggenburg 19
VSS Valpassiria 24
Meat BOE Boer 138
BRI Bari 25
LOP Local_Pothohari 13
RAN Murciano‑Granadina 2
TED Teddi 47
THA Thari 16
Fiber ANG Angora 131
ANK Ankara 18
maximum, mean, standard deviation, range, median and mode) were computed.
The Samβada software [36] was used to compute the parallel processing of multiple univariate logistic regressions between each genotype versus each envi-ronmental variable. All univariate models were com-puted and filtered considering a significance threshold of 0.05 before Bonferroni correction. Then, a second step of filtering was applied to retrieve only the SNPs
for which at least two genotypes were significantly associated with an environmental variable and showed simultaneously: (1) a very strong effect of the environ-ment on the genotype (absolute value of the β1 regres-sion coefficient higher than the 0.99 percentile of all absolute values of β1 of the significant models), (2) a high statistical significance of the association (G and Wald scores higher than the 0.95 percentile of all G and Wald scores of the significant models) and (3) a strong Table 3 List of breeds (name, code and number of animals per breed) with available GPS coordinates used for landscape genomic analysis
Breed code Breed name Number Breed code Breed name Number Breed code Breed name Number
ABR Abergelle 49 GHA Ghazalia 4 NSJ Nsanje 6
ALB Alpine x Boer 5 GOG Gogo 12 OIG Old Irish Goat 11
ALP Alpine (Camosciata delle Alpi) 146 GUE Guera 16 ORO Orobica 22
AND Nganda 6 GUM Gumez 39 OSS Oasis 50
ANG Angora 80 IRA Iranian goat 9 PAF Pafuri 4
ARG Argentata 24 JAT Jattan 15 PAH Pahari 19
ARR Traditional Arran 8 JON Jonica 11 PAL Palmera 14
ASP Aspromontana 23 KAC Kachan 19 PAT Pateri 27
BAB Barbari 16 KAM Kamori 38 PEU Peulh 22
BAR Barcha 4 KAR Karamonja 19 PRW Pare White 19
BAW Balaka‑Ulongwe 12 KEF Keffa 44 PTV Poitevine 27
BEY Bermeya 23 KES Koh‑e‑sulmani 13 PVC Provençale 15
BEZ Bezoar 7 KIG Kigezi 4 PYR Pyrenean 26
BIO Bionda dell’Adamello 24 LGW Lilongwe 3 RAN Rangeland 50
BLB Bilberry 10 LND Landin 29 RAS Blanca de Rasquera 20
BOE Boer 108 LNR Landrace 50 RME Rossa Mediterranea 30
BRI Bari 25 LOH Lohri 17 RSK Red Sokoto 19
BRK Barki 50 LOP Local Pothohari 13 SAA Saanen 106
BUT Bugituri 31 MAA Maasai 18 SAH Sahel 15
CAM Cameroon goat 37 MAL Mallorquina 18 SDN Soudanaise 22
CAN Caninde 23 MAN LaMancha 3 SEA Small East African 50
CAS Cashmere 44 MAU Maure 13 SEB Sebei 21
CCG Ciociara Grigia 1 MEN San Clemente 19 SHL Sahel 19
CHA Chappar 9 MLG Malagueña 24 SID Saidi 50
CRE Creole 49 MLY Malya 11 SNJ Sonjo 20
CRO Local Cross 5 MOR Moroccan goat 10 SOF Sofia 22
CRP Carpathian 14 MOX Moxoto’ 23 SOU SudOuest 8
CRS Corse 29 MSH Mashona 22 TAP Tapri 22
DDP DDP 20 MTB Matebele 22 TAR Targui 19
DIA Diana 14 MUB Mubende 18 TED Teddi 47
DJA Djallonke 10 MUG Murciano‑Granadina 20 THA Thari 16
DRA Draa 4 NAI Naine 14 THY Thyolo 9
DZD Dedza 15 NBN Nubian 63 TOG Toggenburg 20
FSS Fosses 24 NDA Noire de l’Atlas 4 TUN Tunisian 21
GAL Galla 23 NGD Nganda 11 VAL Valdostana 24
GAR Garganica 15 NOR Nord 4 WAD West African Dwarf 49
goodness of fit of the models, with an Akaike’s infor-mation criterion (AIC) lower than the 0.10 percentile of all AIC of the significant models. The Enrichr data-base [38, 39] was used for the genes detected with the Samβada analyses to identify the major biological pro-cesses that involved the identified genes (GO biologi-cal process) by considering significant clusters with a P value lower than 0.05.
FST analyses Each animal of the working dataset with a known GPS geographic location was assigned to a Köp-pen climate group (Tropical, Dry, Temperate, and Cold; [40]) through the website climate-data.org. Then, we applied the following filters: (i) for each climate group, only breeds with at least 10 animals allocated were con-sidered, and (ii) if the same breed was in two or more groups only the animals that belonged to the groups of known breed origin were considered and the others were discarded. The assignment of each individual to a Köppen group and the subsequent filtering of animals provided a dataset of 1689 animals (141 for the Tropical group, 796 for the Dry group, 632 for the Temperate group and 120 for the Continental group), with no redundant breeds across the groups; assignments are summarized in Table 4. MDS (multidimensional scaling) of the filtered animals was performed using the Plink 1.9 software [41]. Single SNP FST was performed by comparing each group to the remaining groups merged together. The top 20 SNPs of each comparison, corresponding to the 0.9995 percentile of the distribution were considered and compared with the previous results of the landscape genomics analysis that had been filtered based on a significance threshold of 0.05 before Bonferroni correction. Only the selected FST SNPs with a G score or Wald score and β1 regression coef-ficient higher than 0.99 quantile were retained for further analysis. Allele frequencies of the SNPs that were shared by different groups were calculated and compared using the Plink 1.9 software [41].
Results
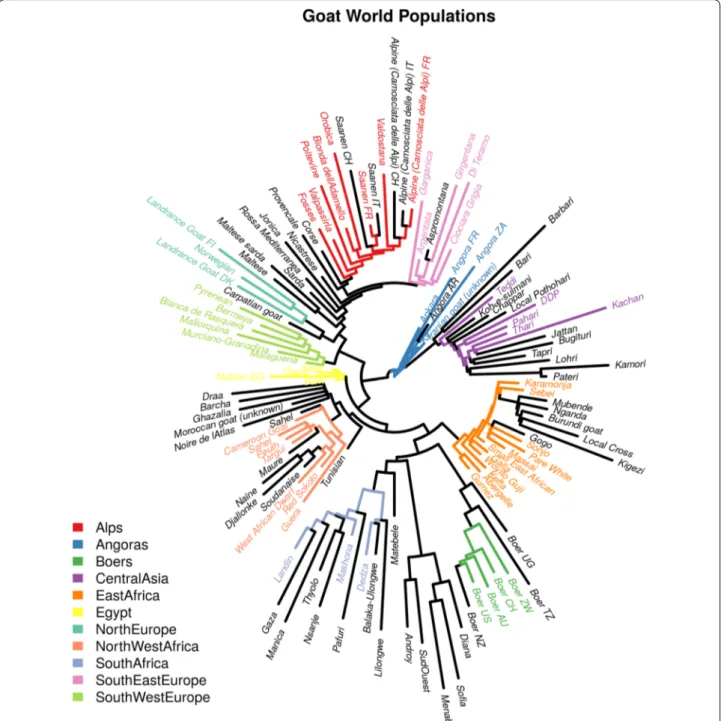
Selection of goat populations for the analysis of signatures of selection based on worldwide genetic diversity
A dataset of goat breeds ensuring robust modelling was developed prior to FLK and hapFLK analyses. This data-set included 61 breeds, which overall represented all the genetic diversity present in the complete dataset (Fig. 1). The genetic diversity in this set of breeds mirrored their geographical origin and was consistent with a radiation from the domestication center. Thus, each population was assigned to one of the 11 sub-continental groups, and each sub-continental group was analyzed independently. In Fig. 1, the root of the population tree, which is located at the center, corresponded to the ancestral population
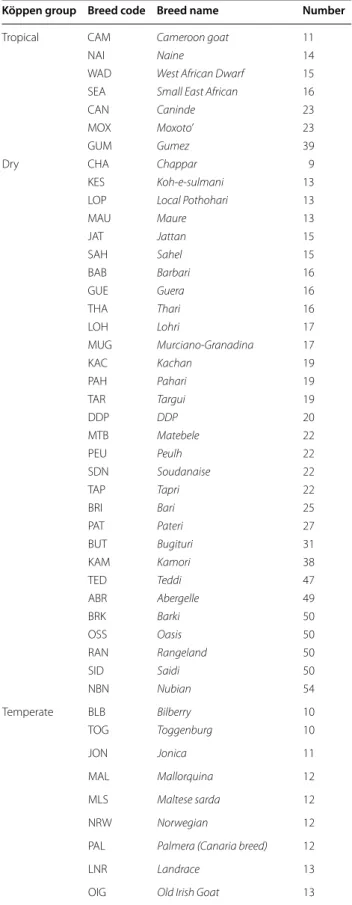
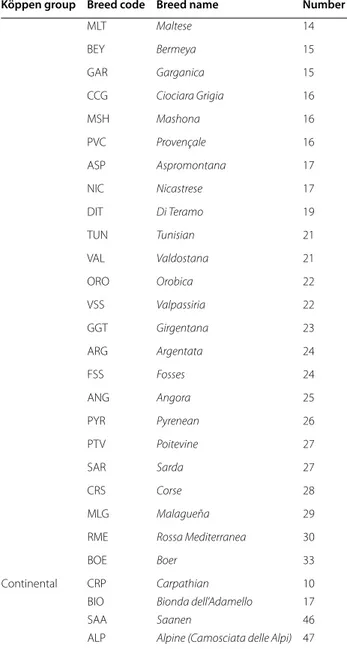
Table 4 Breed composition and number of animals according to the Köppen group classification
Köppen group Breed code Breed name Number
Tropical CAM Cameroon goat 11
NAI Naine 14
WAD West African Dwarf 15
SEA Small East African 16
CAN Caninde 23
MOX Moxoto’ 23
GUM Gumez 39
Dry CHA Chappar 9
KES Koh‑e‑sulmani 13
LOP Local Pothohari 13
MAU Maure 13 JAT Jattan 15 SAH Sahel 15 BAB Barbari 16 GUE Guera 16 THA Thari 16 LOH Lohri 17 MUG Murciano‑Granadina 17 KAC Kachan 19 PAH Pahari 19 TAR Targui 19 DDP DDP 20 MTB Matebele 22 PEU Peulh 22 SDN Soudanaise 22 TAP Tapri 22 BRI Bari 25 PAT Pateri 27 BUT Bugituri 31 KAM Kamori 38 TED Teddi 47 ABR Abergelle 49 BRK Barki 50 OSS Oasis 50 RAN Rangeland 50 SID Saidi 50 NBN Nubian 54 Temperate BLB Bilberry 10 TOG Toggenburg 10 JON Jonica 11 MAL Mallorquina 12 MLS Maltese sarda 12 NRW Norwegian 12
PAL Palmera (Canaria breed) 12
LNR Landrace 13
of all goat breeds, i.e. the ancestral domesticated popu-lation. Extant populations radiated from this ancestral population with populations that were geographically closer to the domestication center also usually genetically closer. The populations that were closest to the ancestor belonged to the “Angora” group, which originated from Turkey. A little further, in their own sub-group, there was a set of breeds from Pakistan (“Central Asia” group). The other two large sub-trees consisted of populations from Africa and Europe, which were split further into sub-con-tinental groups.
Signatures of selection participating in the adaptive differentiation of goat populations
The FLK and hapFLK analyses detected 67 signatures of selection among the 10 population groups. Figures S2 and S3 (see Additional file 2: Figures S2 and S3) show the Manhattan plots for the FLK and hapFLK analyses and Figure S4 (see Additional file 2: Figure S4) shows the overview of the genomic distribution of all signa-tures of selection. The complete list of signasigna-tures of selection is in Table S2 (see Additional file 3: Table S2). Graphical representations of FLK, hapFLK, ROH and iHS signals for all signatures of selection are in Addi-tional file 4. The northern European group was the only group for which no significant signatures of selection were detected. The populations that constitute this group display long terminal branches in the population tree (Fig. 1), which indicates that they have all experi-enced a strong reduction in population size. Such a reduction in size creates extensive genetic drift, which alone can explain the genetic differentiation of these populations. Hence, such extensive genetic drift makes the detection of signatures of selection difficult, which can explain the lack of power observed for the northern European group.
Most of the signatures detected were specific to one population. A total of 13 genomic regions were shared between at least two groups (see Additional file 3: Table S2). These regions were annotated by (i) listing the genes that were located ± 10 0 kb near the highest FLK or hapFLK signal and (ii) identifying the populations that showed an elevated ROH and/or iHS signal within the region.
A signature of selection on chromosome 5 between 30 and 40 Mb encompasses the ADAMTS20 (ADAM met-allopeptidase with thrombospondin type 1 motif 20) gene (see Additional file 2: Figure S5 and Additional file 4). This genomic region matched with a ROH signal in the Pyrenean goat population of the southwestern European group and with an iHS signal in the Argentata dell’Etna breed of the southeastern European group. It also matched with ROH and iHS signals in the Sahel, Peulh and Thari breeds of the northwestern Africa group. These breeds were genetically quite homogeneous and clus-tered within the same population in the genetic diversity study, thus, they were combined for the ROH analysis. An iHS signal was present in the Murciano-Granadina population, but did not match with the position of the ADAMTS20 gene, thus it may represent another selec-tion target.
A second signature selection on chromosome 6 har-bors the KIT (KIT proto-oncogene receptor tyrosine kinase) gene in three population groups (see Additional file 2: Figure S6 and Additional file 4). A ROH signal was Table 4 (continued)
Köppen group Breed code Breed name Number
MLT Maltese 14 BEY Bermeya 15 GAR Garganica 15 CCG Ciociara Grigia 16 MSH Mashona 16 PVC Provençale 16 ASP Aspromontana 17 NIC Nicastrese 17 DIT Di Teramo 19 TUN Tunisian 21 VAL Valdostana 21 ORO Orobica 22 VSS Valpassiria 22 GGT Girgentana 23 ARG Argentata 24 FSS Fosses 24 ANG Angora 25 PYR Pyrenean 26 PTV Poitevine 27 SAR Sarda 27 CRS Corse 28 MLG Malagueña 29
RME Rossa Mediterranea 30
BOE Boer 33
Continental CRP Carpathian 10
BIO Bionda dell’Adamello 17
SAA Saanen 46
detected in the Kacchan breed of the central European group, the Abergelle breed of the east European group and the Argentata dell’Etna breed of the southeastern European group.
A third selection signature on chromosome 13 matched with the position of the ASIP (Agouti signaling protein) gene (see Additional file 2: Figure S7 and Addi-tional file 4). In Pakistani breeds, a clear ROH signal,
corresponding to a large fixed haplotype was detected in the Kacchan population sample from Pakistan and in several breeds of the Alpine group (Alpine, Poitevine and Valdostana). The most significant FLK signal in the Alpine group corresponded to the SNP that was closest to ASIP, however, the highest FLK signal in central Asian breeds did not correspond to the same SNP and the region spanned several genes.
Fig. 1 Populations used to detect signatures of selection. Populations are color‑coded according to their identified geographical groups.
Another relevant signal was detected on chromosome 1 between 110 and 130 Mb in the Alpine and south-western European groups (see Additional file 2: Figure S8 and Additional file 4). This region seemed to match with an FLK signal in the Alpine Valdostana breed, which presents a high proportion of homozygous individu-als for this region. An iHS signal individu-also on chromosome 1, at ~ 108 Mb was found in the Ciociara Grigia Italian breed of the southeastern European group (see Addi-tional file 2: Figure S26). Another signal was detected on chromosome 6 close to the cluster of casein genes CSN1S1, CSN1S2 and CSN2, in the groups of Alpine breeds and Eastern African populations (see Additional file 2: Figure S9 and Additional file 4). The signature of selection detected for the Alpine populations clearly points to the casein genes while for the Eastern African populations, the FLK signals seem to point to a differ-ent cluster of genes that encode glucuronosyltransferase enzymes.
A complex signature of selection on chromosome 6 was identified between 25 and 50 Mb (see Additional file 2: Figure S10 and Additional file 4) and probably results from multiple signals in different genes and dif-ferent groups. In the Egyptian group, the gene closest to the highest hapFLK signal was LCORL (ligand depend-ent nuclear receptor corepressor like). This region clearly matched with an extended region of shared ROH in the Nubian goat population from Egypt (see Additional file 4). Among the southwestern European popula-tions, the Bermeya population presented an iHS signal at the same locus. This region in Egyptian populations overlaps with other signals detected in the southwest-ern and southeastsouthwest-ern European groups. It contains the ABCG2 (ATP binding cassette subfamily G member 2)
gene and matched with an iHS signal in the Murciano-Granadina breed of the southwestern European group and in the Argentata dell’Etna breed of the southeast-ern European group. In both population groups, the hapFLK signal is much stronger than the FLK signal and no clear ROH signal was observed in the breeds of these two groups. A possible explanation for these two observations is that the signature of selection is due to a soft selective sweep rather than a hard sweep.
Another signature of selection was found on chromo-some 12 in the southwestern European group and the central Asian group (see Additional file 2: Figure S11 and Additional file 4). This region contained the RXFP2 (relaxin/insulin like family peptide receptor 2) gene. The two populations that showed a clear signature of selection in this region were the Thari goat from Cen-tral Asia (iHS signal) and the Blanca de Rasquera Span-ish breed (ROH signal).
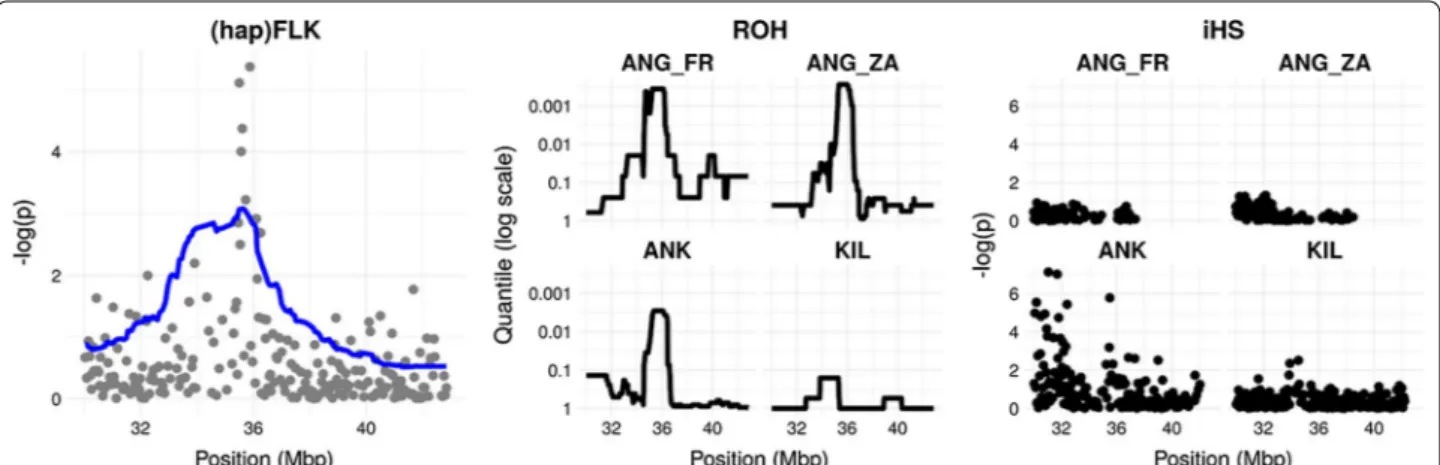
Finally, a region on chromosome 25 (35.50-35.88 Mb) was detected in the FLK analysis in the Angora group and confirmed by ROH and iHS analyses (Fig. 2). Signatures of early adaptation
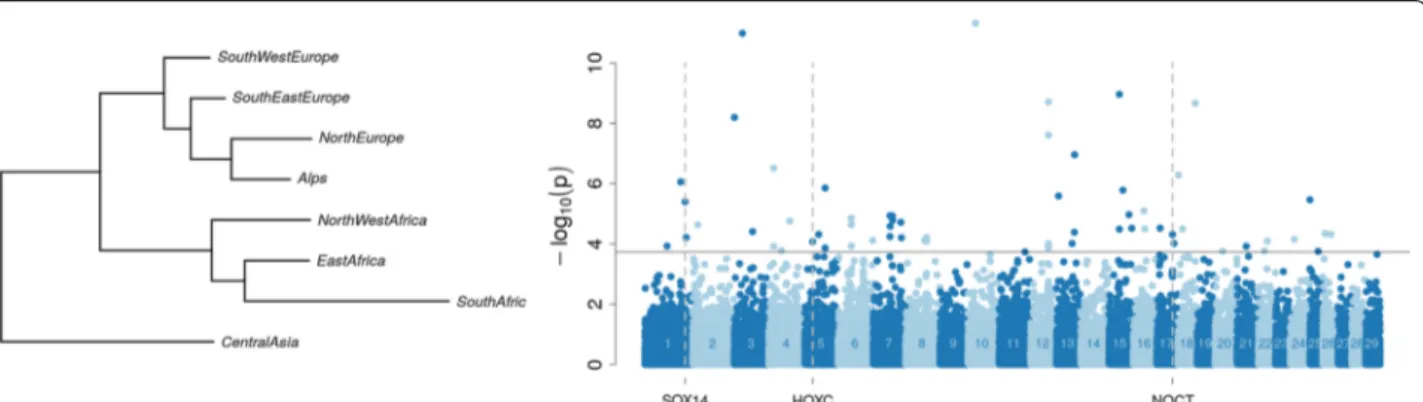
FLK analysis on the filtered geographical dataset based on the estimated ancestral allele frequency of geograph-ical groups detected 62 SNPs with evidence for outlying differentiation among groups (Fig. 3) and (see Addi-tional file 3: Table S3). The phylogenetic tree seemed to confirm the relationship between sub-continental blocks. Among the 62 SNPs, two signatures of selec-tion were found on chromosome 1 close to the SOX14 (SRY-box 14) gene and on chromosome 16 close to the NOCT (nocturnin) gene. Another signature of selection
Fig. 2 Signatures of selection on chromosome 25 in the Angora group. Left panel: FLK (points) and hapFLK (line) signals. Middle panel: ROH signals.
on chromosome 5 is located within the HOXC (home-obox C) gene cluster (see Additional file 3: Table S3). Signatures of selection associated with external phenotypes and production traits
Production purposes The analyses performed on the group of “fiber-producing” goat breeds detected 18 regions on 11 chromosomes with ROH, 88 regions and/or SNPs on 27 chromosomes with XP-EHH and 24 regions
on 11 chromosomes with FST (Fig. 4). Among these, six regions on chromosomes 6, 18 and 25, including 34 genes, were detected by all three methods (see Additional file 3: Table S4). The region on chromosome 25 (34.69-36.43 Mb) showed the highest values in all the three analyses (Fig. 4a). Among the three breeds that compose the “fiber-producing” goat breed group, only Angora and Ankara showed a signature of selection in this region with none being detectable in Cashmere (Fig. 4b). This signa-Fig. 3 Genome scans for early adaptation based on differentiation between geographical groups. Left: Population tree built from the estimates
of ancestral allele frequency in each continental group. Right: Manhattan plot of FLK p‑values computed from the estimates of ancestral allele frequency and accounting for the ancestral tree structure
Fig. 4 ROH, FST and XP‑EHH for fiber (a), and detail of the ROH analyses on chromosome 25 for the breeds that compose the group of
“fiber‑producing” goat breeds: Angora, Ankara and Cashmere (b). (a) The three analyses are shown with different plot colors, within the most external squared‑based circle, where each color represent a chromosome (chromosome number outside the squares): green (external) = ROH; blue (middle) = FST; violet (internal): XP‑EHH. For the three analyses, the regions above the threshold are marked in red. The region of high
homozygosity (chromosome 25: 35,240,726‑36,394,939 bp) is highlighted in red. (b) The three different breeds are labelled with different colors: green (external) = Angora; blue (middle) = Ankara; violet (internal): Cashmere. For the three breeds, the part corresponding to the 35‑36 Mb region is marked in red when above the threshold
ture of selection overlapped with the regions detected by FLK/hapFLK, ROH and iHS analyses within the Angora group (Fig. 2) and contained 24 genes, including the CUX1 (cut like homeobox 1) and the PLOD3 (procollagen-lysine,2-oxoglutarate 5-dioxygenase 3) genes. The win-dow-based FST analysis between Cashmere and Angora breeds pointed out several regions on chromosomes 2, 5, 6, 8, 9, 12, 13, 14, 17, 20, 25, 28 (data not shown). The ROH analyses on the Cashmere individuals highlighted several major regions on chromosomes 2, 10, 22 (47-48 Mb), 3, 5 and 8 (data not shown).
The analyses performed on the group of “meat-producing” goat breeds detected 25 regions on eight chromosomes with ROH, 121 regions and/or SNPs on 27 chromosomes with XP-EHH and 24 regions on 16 chromosomes with FST (see Additional file 2: Figure S12]. Among these regions, two regions on chromo-somes 3 and 18 were detected by at least two of the three methods and contained 18 genes [see Additional file 3: Table S5), including TSHB (thyroid stimulating hormone beta), NRAS (neuroblastoma RAS viral onco-gene homolog) and AMPD1 (adenosine monophosphate deaminase 1), all on chromosome 3.
The analyses performed for the group of “milk-pro-ducing” goat breeds detected 11 regions on eight chro-mosomes with ROH, 286 regions and/or SNPs in all autosomes with XP-EHH and 24 regions on 15 chro-mosomes with FST (see Additional file 2: Figure S13). Among these regions, four were on chromosomes 11, 13 and 14, which included 20 genes that were detected by at least two of the three methods (see Additional file 3: Table S6), among which the EFEMP1 (EGF con-taining fibulin like extracellular matrix protein 1) gene on chromosome 11. The ROH analysis revealed a region on chromosome 6 (75-120 Mb) that contains the cluster of casein genes, although it was not confirmed by the FST and XP-EHH analyses (data not shown).
The CDA, which was performed on the chromo-somal regions surrounding the genes previously identi-fied for the three groups, confirmed the results found in previous analyses. The region on chromosome 25 (34.69-36.43 Mb) that contained the CUX1 and PLOD3 genes could separate individuals in the group of “fiber-producing” goat breeds from the other two groups on the CAN1 variable, and the SNPs that best separate the three groups were in the middle of these regions (see Additional file 2: Figure S14). The region on chromo-some 3 that included the TSHB, NRAS and AMPD1 genes could separate the group of “meat-producing” goat breeds from the remaining two groups on the CAN2 variable when considering the highest peak in the middle of the region (see Additional file 2: Figure S15). Finally, the region on chromosome 6 that contains
the casein cluster could separate the “milk-producing” breeds from the other two groups on the CAN1 vari-able, with a high peak near to the CSN1S1 (alpha S1 casein) gene (see Additional file 2: Figure S16).
Coat color The distribution on the MDS plot of the single breeds using the medium-density SNP chip over-lapped partially between the three groups of coat color. This probably reflects geography rather than coat color, with the Middle Eastern, Asian (Pakistan) and African goats being separated from all European goats on the first component (see Additional file 2: Figure S17). The Angora and Ankara (White) breeds and the Kil and Kilis (Black) breeds, which all originate from Turkey formed two clus-ters. For the “coat color” groups, we detected regions on chromosomes 5 (70.0–70.5 Mb), 13 (53.0–53.5 Mb), and 18 (15.50–16.25 Mb) in the Black vs. White com-parison, regions on chromosomes 5 (36.25–36.75 Mb), 9 (11.5–12 Mb), and 13 (53–53.5 Mb and 62.75–63.25 Mb) in the White vs. Black and Red comparison, and regions on chromosomes 8 (27.0–27.5 Mb), 22 (2.25–3.0 Mb) and 29 (39.25–39.75 Mb) in the Red vs. White comparison. The list of genes within these regions is in Table S7 (see Additional file 3: Table S7) and includes ADAMTS20 and TIMP3 (TIMP metallopeptidase inhibitor 3) on chromo-some 5, SOX18 (SRY-box 18) and ASIP on chromochromo-some 13, and MC1R (melanocortin 1 receptor) on chromosome 18. CDA on the MC1R gene showed that SNPs present on either side of this gene could distinguish the solid Red goats from the solid Black and White animals that were close on the CAN1 (see Additional file 2: Figure S18), which disagrees with the above result that indicated that MC1R could separate black and white individuals. Similarly, SNPs located near the ASIP gene seemed to be able to distinguish the solid Red from the solid black and white groups (see Additional file 2: Figure S19). In the CDA, SNPs in the region surrounding the ADAMTS20 gene could distinguish and separate all three groups on the CAN1 variable, and particularly the white group (see Additional file 2: Figures S20).
Adaptation to environment Landscape genomics analysis
The Samβada results showed that more than 80% of the SNPs appear in at least one significant associa-tion between a genotype and a bioclimatic variable. In addition, 57 SNPs were involved in associations that respected the second series of filtering criteria (values for the β1 coefficient, G score, Wald score > 0.99 quan-tile, AIC criterion < 0.1 quanquan-tile, and at least two geno-types associated with at least one environmental variable) (see Additional file 3: Table S8). The most significant
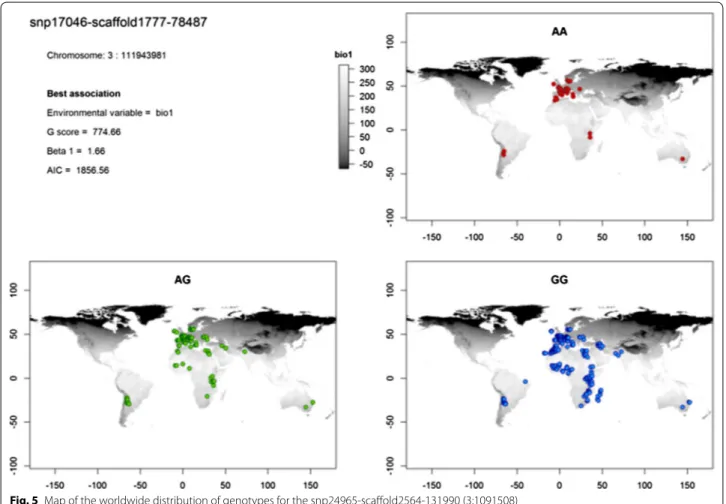
associations (highest G score) obtained with these SNPs involved the environmental variable related to annual mean temperature (bio1) for 49 SNPs, mean temperature of the coldest quarter (bio11) for three SNPs, mean diur-nal range (bio2) for three SNPs, precipitation of the driest month (bio14) for one SNP and isothermality (bio3) for one SNP. The results obtained with the sampling point variables were very similar to those obtained with mode, maximum, mean and median values computed within the buffer area, whereas the associations with range, mini-mum and standard deviation were less significant. One of the strongest associations was observed between the CC genotype of SNP snp24965-scaffold2564-131990 located on chromosome 3:1091508 and the mean annual temper-ature (bio1). This association had the highest G and Wald scores of the models filtered using the criteria above and the highest Efron score of all significant models (using a threshold 0.05 before Bonferroni correction). The spatial distribution of the genotypes for this SNP showed that the AA genotype is only present in Europe or in southern regions of high altitude. The AC genotype showed a simi-lar trend, even if it is slightly more frequent in the south-ern regions, while the CC genotype was observed in the
whole area of study (Fig. 5). This SNP is located close to the pre-B cell leukemia homeobox 1 (PBX1) gene. The list of genes that are located near (± 100 kb) each of the 57 SNPs is in Additional file 3: Table S9 and the geographi-cal distribution of the genotypes for the remaining 56 SNPs is in the Additional file 5. Analysis of the biologi-cal processes of the genes located in the vicinity of these SNPs (see Additional file 3: Table S10) highlighted genes that are linked to several pathways, such as the insulin and glucose signaling pathway and metabolism [(IGF2 (insulin-like growth factor 2)], glycogen metabolism, lipid biosynthetic processes, oxidative stress [GPR37L1 (prosa-posin receptor GPR37L1) and INS (insulin) genes] and regulation of vasodilation. Two genes are involved in cir-cadian rhythms regulation: RAI1 (retinoic acid induced 1) and TH (tyrosine hydroxylase).
FST and landscape genomic analyses of climatic associations
The MDS analysis (see Additional file 2: Figure S21) showed an overlap between the Köppen climate groups, with Tropical and Continental being the smallest and most clustered groups. The FST plots are in Fig. 6 and Figures S22 to S24 (see Additional file 2: Figures S22, S23
and S24) and indicate for each analysis the number of SNPs above the selected threshold. Twenty SNPs for each comparison met the threshold of the quantile > 0.9995, among which, 13 are shared between the Dry and Tem-perate/Continental groups with opposite major alleles between these groups (see Additional file 3: Table S11). Interestingly, the Tropical group did not have any com-mon SNPs with the other groups, which reduced the list from 80 to 65 SNPs. When these 65 SNPs were compared with the Samβada results, they all showed either high G scores, Wald scores or β1 regression coefficients (quan-tile values considering only those obtained from the sig-nificant models > 0.99 of the empirical distribution) for at least one genotype in several environmental variables. These SNPs are summarized in Table S12 (see Addi-tional file 3: Table S12). In the landscape genomic anal-ysis, nine of these SNPs showed G scores, Wald scores and β1 regression coefficients that were all higher than the 0.999 quantile. In total, 197 genes were detected in the regions (± 100 kb) close to these 65 SNPs (see Addi-tional file 3: Table S13). For the Tropical group, a clus-ter of HOXC genes (HOXC4, HOXC5, HOXC6, HOXC8, HOXC9, HOXC10, HOXC11, HOXC12 and HOXC13) that are located near the three SNPs on chromosome 5 was detected. Analysis of the genes for the four Köppen climate groups revealed several genes such as SOX17 (transcription factor SOX-17) for the Dry and Temperate groups, CLYBL (citrate lyase subunit beta-like protein)
for the Dry and Continental groups, LYPLA1 (lysophos-pholipase 1), ATP6V1H (vacuolar ATPase) and RGS20 (regulator of G-protein signaling 20) for the Dry and Tem-perate groups and, with a different SNP, also in the Tropi-cal group, CAPN10 (Tropi-calpain 10) and RNPEPL1 (arginyl aminopeptidase (aminopeptidase B)-like 1) were found for the Continental group only but also detected in the landscape genomic analyses and in the FLK analyses for signature of early adaptation.
Discussion
Detection of signatures of selection from genotype data alone is possible either by searching for genomic regions that show high levels of differentiation between popula-tions or by looking for regions of low genetic diversity within a population. In this work, both approaches were used because they detect different kinds of selection events. Selection events that lead to the rapid fixation of an initially rare variant, i.e. hard sweeps, should lead to signals that can be detected by both approaches. How-ever, in this case, within-population methods are more powerful than differentiation-based methods, but differ-entiation-based approaches can detect a greater diversity of selection signals, such as selection on standing varia-tion (soft sweeps) or diversifying selecvaria-tion.
Our analyses were not limited to searching for sig-nals of selection within or among populations. We also exploited other available information, such as differences Fig. 6 FST plot of the comparison of the Tropical group vs. the other groups. The threshold line in red represents the 0.995 of the percentile
in production purposes, phenotypes, and geographical/ bioclimatic coordinates to elucidate the mechanisms of selection. The detection of adaptive loci in the genome is an essential part of studies on environmental adap-tation, since it can help understanding which regions of a genome and therefore which genes have been or are being shaped by natural selection. Spatial analysis with geographical information systems (GIS) and envi-ronmental variables, along with molecular data, were included in the landscape genomic analysis to uncover the genomic regions under selection and identify candi-date environmental factors that cause this selection. Mul-tiple univariate logistic regressions were carried out to test for association between allele frequencies at marker loci and environmental variables. The analyses consid-ered variables that can be summarized by differences in temperature and precipitation, which could be indirectly correlated to water availability. The Samβada analy-ses showed that more significant associations and more selected SNPs were associated with differences in tem-perature than with differences in precipitation. Therefore, temperature appears to have played a bigger role in the adaptation processes of goat breeds.
In addition, our analyses examined the signals that were detected in the genome after a detailed modeling of genetic divergence and population structure. Complex admixture and strong population bottlenecks can mimic the effect of selection by reducing local variability consid-erably. Therefore, to detect these signals, we applied the FLK and hapFLK approaches to individuals with a unique genetic background, without recent admixture or popu-lation bottlenecks. Finally, signatures of selection left by recent human selection on goat populations that are linked to production purposes or phenotypic standardi-zation were analyzed.
Taken together, these analyses contributed to provide a genome-wide picture of the genes and genomic regions that have been subject to selection and led to signatures of selection that concern different biological pathways or group of genes, which were detected by one or more types of analyses.
Genes related to milk production
Among all the genes that can contribute to milk yield, quality and processing, the casein genes are one of the most important gene families in ruminants, since they have a major role in the production of cheese products from milk. In the goat genome, this gene cluster is located on chromosome 6 between 85.95 and 86.25 Mb. Analysis of the ROH scores of the breeds selected for milking pur-poses showed that the longest region with loss of vari-ability coincides with the casein region on chromosome 6 between 85.9 and 86.2 Mb. The goat breeds used for milk
and cheese production belong mainly to the European breeds, particularly from Italy and France, which suggests that the signals identified are related to a common direc-tion of selecdirec-tion within these breeds, i.e. that they are used mainly to produce whole milk (20% of production) and cheeses (80% of production) [42]. Many dairy goat breeds of Europe have been developed through breeding with the two most specialized dairy breeds, i.e. Saanen and Alpine from Switzerland [21]. Due to its popularity as a dairy breed, Saanen goats are distributed across more than 80 countries worldwide [5]. The genomic region that contains the cluster of casein genes was also detected by FLK analysis, which identified a region containing this gene cluster in the group of Alpine breeds and a region close to this cluster in the group of Eastern African popu-lations. The different analyses and particularly the FLK and hapFLK analyses also detected other regions related to milk production. Chromosome 6 carries several genes that are related to milk production and found in several ruminant species. Another region on chromosome 6 that contains the ABCG2 gene was detected in the Egyptian, southwestern and southeastern European groups, which was further confirmed by the iHS signal detected for the Murciano-Granadina and Argentata dell’Etna breeds. The ABCG2 gene matched with a previously identified signa-ture of selection in sheep [22] and polymorphisms in this gene have been associated with milk yield and composi-tion in cattle and sheep [43, 44]. The ROH/Fst/XP_EHH analyses detected another consensus region on chromo-some 11 that contains the EFEMP1 gene, which is associ-ated with conjugassoci-ated linoleic lipid contents in the meat of Wagyu Angus cattle breed [45]. A region on chromo-some 1 between 110 and 130 Mb that was detected in the Alpine and southwestern European groups is homolo-gous to a genomic region in dairy cattle for which selec-tive pressure was previously reported [46]. A separate signature of selection approximately 5 Mb away from this region was also found in the Italian local breed Ciociara Grigia, which is used for milk production. Brito et al. [13] recently identified other genomic regions that may be associated with milk production, using a partially over-lapping subset of breeds [13]. This difference may be due to a different breed composition of the dataset used and underlines the fact that there may be some breed-specific regions related to milk composition. Therefore, more tai-lored experiments are needed to decipher the genetics behind milk production in goat.
Genes related to fiber production
For the group of “fiber-producing” goat breeds, the strongest signature of selection in all three types of analy-ses (ROH, XP-EHH and FST) was detected in the genomic regions containing the CUX1 and PLOD3 genes. The
detected regions in Angora and Ankara were confirmed by the FLK and hapFLK analyses. These genes are asso-ciated with hair development: CUX1 is assoasso-ciated with wavy hairs and curly whiskers in mouse [47] and PLOD3 may play a role in the formation of hairs or in their tex-ture [48]. The roles of these genes are consistent with the presence of a signature of selection only in the two Angora breeds (Angora and Ankara), which have curly hairs, and not in the Cashmere breed, which has long and wavy hairs. For the Cashmere breed, Brito et al. [13] pro-posed several alternative genomic regions. The FST analy-ses comparing the Cashmere vs. the Angora and Ankara breeds that revealed a signature of selection on chromo-some 25 did not show any overlapping regions with those reported in [13], probably because the approach used in [13] highlighted other genomic regions. The ROH analyses carried out on the data for the Cashmere breed revealed a region on chromosome 22 that overlapped with one of the regions reported by Brito et al. [13] and was identified by a FST analysis of Cashmere against several other breeds. Thus, this may be an interesting region to investigate further for fiber production in the Cashmere breed. In addition, it suggests that different genomic regions are involved with fiber production in Cashmere and Angora/Ankara breeds.
Genes related to meat production
In the analyses comparing breeds for meat production, some of the detected regions contain genes associated with muscle formation. On chromosome 3, we identi-fied a region that includes the AMPD1 and NRAS genes, in agreement with previous findings in cattle and mice. AMPD1 is involved in the deamination of AMP in skel-etal muscles [49] and its disruption was reported to influ-ence the expression of neighboring genes, such as NRAS, in mice [50]. In addition, allelic variants of the AMPD1 gene are associated with traits such as heart girth and body weight in Chinese beef cattle [51]. Another gene within the same region, TSHB may also be associated with muscular functionality. TSHB encodes a subunit of the thyroid stimulating hormone (TSH), which plays a pivotal role in regulating thyroid activity, stimulating col-loid reabsorption and in the release of the T4 hormone [52]. The role of thyroid function in growth is known, and different levels of TSH are associated with hyperthyroid-ism or hypothyroidhyperthyroid-ism [53]. In fact, high levels of TSH are commonly found in obese human children and ado-lescents [54]. In goat, this gene has been characterized in relation with reproductive seasonality [55].
The main breed of the “meat-producing” group is the Boer breed, which is selected for meat production and for which several breeding programs have been devel-oped. In spite of this, no evidence of strong selection
in the Boer breed for genes related to meat production was detected in our analyses. A possibility is that varia-tion in meat producvaria-tion traits in this populavaria-tion may have a highly polygenic basis (many alleles of small effects determine the trait). Because of the size of the samples and the availability of phenotype records, we used approaches that are not suited to detect such selec-tion events. Other targeted studies on the Boer breed are needed to evaluate the possible genomic impact of breed-ing programs in this population.
Genes related to coat color
ROH analysis of the data for the three groups of solid coat colors detected signatures of selection near at least five genes that are known to be involved in the color and pattern definition of the coat: ADAMTS20, MC1R, ASIP, SOX18 and TIMP3. Two of these genes (MC1R and SOX18) were specifically detected in the comparison between solid Black and solid White individuals, whereas the remaining three were identified in both solid Black vs. solid White and solid Black and Red vs. solid White groups.
The well-known MC1R gene is involved in the genetic determinism of color [56] and located on chromosome 18 in goats. It plays a major role in controlling the switch from eumelanin (black and brown) to pheomelanin (yel-low to red; [57]) produced by melanocytes. This gene has already been studied in several species [58], such as cat [59], horse [60], dog [61], pig [62], cattle [63], sheep [64] and even in goat [65–68]. Although described in other species, no direct association between MC1R and red coat color is known in goat.
ASIP is a competitive antagonist of MSH (melanocyte stimulating hormone) for binding MC1R, enabling the switch from eumelanin to pheomelanin [69]. Similarly to what we observed for SNPs within the region surround-ing MC1R, SNPs within the region around ASIP seemed to be able to distinguish the solid Red from the solid Black and White groups. The presence of an association with the Red/Black group in the region surrounding this gene seems to confirm its role also in goats, as hypoth-esized in several studies [11, 70]. Moreover, the signal on this gene was also found with the differentiation tests (FLK, hapFLK) in Alpine, Poitevine and Valdostana goats with black-and-tan pigmentation pattern. This further confirms the potential role of this gene in modulating the melanocyte activity in goats, in particular its involvement in the switch from black to red pigments, whereas the white color may to be caused by other gene(s).
The third candidate gene identified is SOX18, which encodes a transcription factor that plays an important role in hair follicles and blood vessel development during
embryogenesis in disheveled mice, a semi-dominant mutation characterized by coat sparseness [71, 72]. In addition, alleles of this gene seem to be responsible for a dark phenotype in mice [57, 73].
ADAMTS20 located on chromosome 5 encodes a highly conserved metalloprotease. This gene is required for melanoblast survival and mediating Kit signaling in skin colonization such as the belted white locus in inbred mouse colonies [74–76]. It is also important in multiple biological functions, such as delayed palate closure [77] and soft tissue syndactyly [78]. Another gene detected with these approaches, TIMP3, is known to inhibit the activity of metalloproteinases, and shows high specific-ity and selectivspecific-ity for the ADAM and ADAMTS families [79] that are involved in melanoma cancerous cell devel-opment [80]. A signature of selection that included this gene was also found in the Southwestern European goat group and in particular in the Pyrenean goat population, which is characterized by a piebald black and white pat-tern, in the Argentata dell’Etna breed, which is character-ized by a silver coat colour, and in the group of breeds from Northwestern Africa where Sahel, Peulh and Thari breeds are characterized by white or white spotted coat colours. However, for the last three breeds, no reliable pictures were available to evaluate the coat color pattern.
The signatures of selection near the KIT gene observed in the Kacchan and Abergelle breeds could be related to their spotted phenotypes (in this case, this phenotype is localized mainly on the anterior parts of the animals) as already observed in other species. It should be noted that the Argentata dell’Etna breed has a silver phenotype and that, in the fox, an analogous phenotype is caused by a mutation on an autosomal copy of the KIT gene [81]. Genes related to other traits
In this work, a strong association was found between the results of the landscape genomics analyses and those obtained using independent analyses based on other types of more categorical classifications, such as the Köp-pen classification. Several signals were associated with environmental parameters and these loci behave atypi-cally in comparison with the theoretical distribution for neutral loci. Among the 13 common SNPs that differen-tiated the Dry and Temperate/Continental groups, i.e. between hot-dry and temperate-cold areas, all showed a different major allele, and this may be the sign of natural selection that is driving alleles in opposite directions for the adaptation of the breeds to different environments. These SNPs were also confirmed by landscape genom-ics analyses, i.e. although they are not included in the top 57 SNPs, they displayed a high significance for one or more bioclimatic variables. Several of the genes around these 13 SNPs are associated with production traits in
cattle. LYPLA1 encodes a hormone that acts as a ghre-lin inhibitor and is, therefore, involved in the regulation of the appetite, as shown in rats [82]. This gene is also associated with feed intake and weight gain in cattle [83]. Other genes, such as RGS20 and SOX17 may play a role in pubertal development, as shown in Brahman cattle [84]. Regarding CLYBL, it was shown to be differentially expressed in cows with different milk citrate contents [85]. A region detected by FLK and landscape genomics and which is unique in the Continental group through FST analysis contains the CAPN10 and RNPEPL1 genes. Calpains are calcium-regulated proteases involved in cel-lular functions that include muscle proteolysis both ante- and postmortem. In livestock, they play important roles in muscle growth and development, myoblast fusion, and differentiation [86]. The early post-mortem cleav-age of these proteins leads to the tenderization of meat and, thus, calpain genes have been associated with meat tenderness [87, 88]. The RNPEPL1 gene is differentially expressed in pigs with different muscularity traits [89]. FLK analyses detected the RXFP2 gene in the Southwest-ern European group and the central Asian group, par-ticularly in the Thari and Blanca de Rasquera breeds. This well-known gene is responsible for the polled condition in most domestic sheep populations and associated with horn phenotypes in the Soay breed, a feral archaic sheep from Scottish islands, but it has not been shown to be involved in the development of horns in goats [22]. This signature of selection suggests that the genetic determin-ism of horns in these two goat populations may be spe-cific compared to other goat breeds.
The LCORL gene was present in a signature of selec-tion detected in the Egyptian group, particularly in the Nubian breed. It has been associated with signatures of selection linked to animal size in cattle [90, 91] and in European commercial and local pig breeds [92].
Insulin, glucose pathway and oxidative stress response genes
Temperature variation detected by the Samβada analyses can operate as a primary environmental stressor. A major cellular effect caused by multiple environmental stressors is the generation of reactive oxygen species (ROS) that leads to oxidative stress. This was reported in livestock species such as cattle and chickens. In goats, it could be supported by genes that are involved in pathways linked to temperature changes, such as insulin or glucose path-ways and oxidative stress response. The GPR37L1 gene is primarily expressed in neuronal cells and has a role in protecting primary astrocytes against oxidative stress [93]. Another gene related to oxidative stress is the INS gene, its level in pancreatic cells changing in case of oxi-dative stress [94], which stimulates the HSP (heat shock