Università degli Studi di Sassari INRA – SUPAGRO Montpellier
SCUOLA DI DOTTORATO DI RICERCA Centre International
Scienze dei Sistemi Agrari e Forestali d'études supérieures
e delle Produzioni Alimentari en sciences agronomiques
Indirizzo Biotecnologie Microbiche Agroalimentari
Ciclo XXVI
A genome based approach to characterize genes involved in yeast
adaptation to Sherry-like wines’ biological ageing
dr. Annalisa Coi
Direttore della Scuola: prof. Alba Pusino
Referente di Indirizzo prof. Severino Zara
Co-Tutor prof. Marilena Budroni
Università degli Studi di Sassari INRA – SUPAGRO Montpellier
SCUOLA DI DOTTORATO DI RICERCA Centre International Scienze dei Sistemi Agrari e Forestali d'études supérieures e delle Produzioni Alimentari en sciences agronomiques
Indirizzo Biotecnologie Microbiche Agroalimentari
Ciclo XXVI
La presente tesi è stata prodotta durante la frequenza del corso di dottorato in “Scienze e Biotecnologie dei Sistemi Agrari e Forestali e delle Produzioni Alimentari” dell’Università degli Studi di Sassari, a.a. 2012/2013 - XXVI ciclo, con il supporto di una borsa di studio finanziata con le risorse del P.O.R. SARDEGNA F.S.E. 2007-2013 - Obiettivo competitività regionale e occupazione, Asse IV Capitale umano, Linea di Attività l.3.1 “Finanziamento di corsi di dottorato finalizzati alla formazione di capitale umano altamente specializzato, in particolare per i settori dell’ICT, delle nanotecnologie e delle biotecnologie, dell'energia e dello sviluppo sostenibile, dell'agroalimentare e dei materiali tradizionali”.
Anna Lisa Coi gratefully acknowledges Sardinia Regional Government for the financial support of her PhD scholarship (P.O.R. Sardegna F.S.E. Operational Programme of the Autonomous Region of Sardinia, European Social Fund 2007-2013 - Axis IV Human Resources, Objective l.3, Line of Activity l.3.1.).
INDEX
Preface p. 4
1 Introduction p. 6
1.1 Comparison of flor ageing processes p. 7
1.2 Flor strains specificities p. 8
1.3 Wine fermentation vs Flor ageing p. 10
1.4 Biofilm p. 12 1.4.1 Archeal biofilms p. 13 1.4.2 Bacterial biofilms p. 13 1.4.3 Fungal biofilms p. 14 1.5 Quorum sensing p. 15 1.6 Extracellular matrix p. 16
1.7 Flor yeast velum and role of FLO11 p. 16
1.8 FLO11 regulation p. 18
1.8.1 Filamentous growth MAPK pathway p. 19
1.8.2 cAMP/PKA pathway p. 23
1.8.3 Snf1 glucose-sensing pathway p. 24
1.8.4 TOR pathway p. 26
1.8.5 Epistatic pathway p. 27
1.8.6 pH sensing pathway p. 27
1.8.7 ncRNAs switch of FLO11 expression and epigenetic control p. 27 2 Construction of tools: strains and synthetic flor media p. 30
2.1 Materials and methods p. 32
2.1.1 Strains p. 32
2.1.2 Media and growth conditions p. 33
2.1.3 Creation of haploid strains p. 34
2.2 Results p. 35
2.2.1 Construction of haploid strains p. 35
2.2.2 Selection of a synthetic medium p. 37
2.3 Conclusion p. 39
3 Identification and characterization of genes that differentiate flor
from wine yeasts p. 40
Abstract p. 41
Introduction p. 41
Materials and methods p. 43
Yeast strains, media and growth conditions p. 43
Genome sequencing, population analysis and SNP’s detection p. 45
Evaluation ZRT1 phenotype p. 48
Microarray analysis p. 49
Results p. 50
Flor strains phylogeny p. 50
Search for regions differentiating wine and flor strains possibly explaining
flor yeast adaptation p. 53
Comparison of P3-D5 flor and K1 wine yeast transcriptomes p. 60 Evaluation of the role of ZRT1 gene in wine fermentation/velum ageing
adaptation p. 62
Discussion p. 67
Flor strains phylogeny p. 67
Search for regions explaining phenotypic differences between wine and flor p. 68 Evaluation of the role of ZRT1 gene in wine fermentation/velum ageing
adaptation p. 70
References p. 72
4 Analysis of other variant alleles potentially related to flor domestication p. 85
4.1 Materials and methods p. 86
4.1.1 Yeast strains and media p. 86
4.1.2 Construction of mutants p. 89
4.1.3 Evaluation of ZRT1 phenotype using Phenotype Microarray analysis p. 88
4.1.4 Evaluation of PDC1 phenotype p. 89
4.2 Results p. 91
4.2.1 Evaluation of the role of FRE genes in wine fermentation/velum
ageing adaptation p. 91
4.2.2 Evaluation of the role of PIK1 gene in adaptation to velum ageing p. 98 4.2.3 Evaluation of the role of PDC1 gene in adaptation to velum ageing p. 105 4.2.4 Evaluation of the role of ZRT1 gene in wine fermentation/velum
ageing adaptation p. 111
4.3 Conclusions p. 112
5 Discussion p. 114
Flor and wine yeast domestication p. 120
6 Conclusions and perspectives p. 123
References p. 126
Preface
Wine making is a very ancient process dating very likely from the beginning of agriculture and the most ancient remains of wine have characterized from pottery vessels found in Iran at Hajji Firuz Tepe (McGovern et al., 1996) dated between 5400-5000 BC. Close to this region the most ancient winery has been excavated in southeastern Armenia (Barnard et al., 2011). Since these very ancient times, wine production has changed drastically with the numerous innovations that lead to our modern wines. Indeed the first wines were kept in closed clays vessels, and were added resins, very likely as well as spices as preservatives (McGovern, 2003). These clay amphora were still porous to air leaving the possibility of wine to get oxidized.
Among these, three innovations had a great impact on wine styles. The use of sulphite is thought to be extremely early as Egyptians and Romans used sulphite to clean their wine containers (Romano and Suzzi, 1993). The use of wooden barrels (200 BC) and then of glass bottles in the middle of the 17th century with cork stoppers has provided another improvement of oxygen management in wine, that enabled wine ageing and paved the way to the modern wine style. Indeed, modern wine making processes try to limit the impact of oxygen in order to protect grapes and wine aromas. However, in contrast to this recent trend limiting the impact of oxygen, flor ageing developed in a few European countries (Hungary, France, Italy and Spain) appears as the opposite trend in which wine is deliberately (but moderately) oxidized by yeast in order to obtain the specific flavors and aromas of Vin Jaune (France), Vernaccia di Oristano (Italy), Tokay (Hungary) and Sherry wines (Spain). In addition these ageing methods produce wines almost stable towards oxidation. Interestingly Capece et al. (2013) reported recently a study of a wine making process performed in Georgia, the “Kakhetian” technique, in which fermentations take place in amphora in the presence of skins, peduncles, pips and stalks, and then take place a maceration phase. In this wine making process that can be considered as antique, flor yeast develop during the maceration/ageing final step. This suggests that flor/velum ageing is indeed a very ancient process and that ageing performed in Hungary, France, Italy and Spain are in fact remains of an ancient wine making process optimized for Sherry wine ageing.
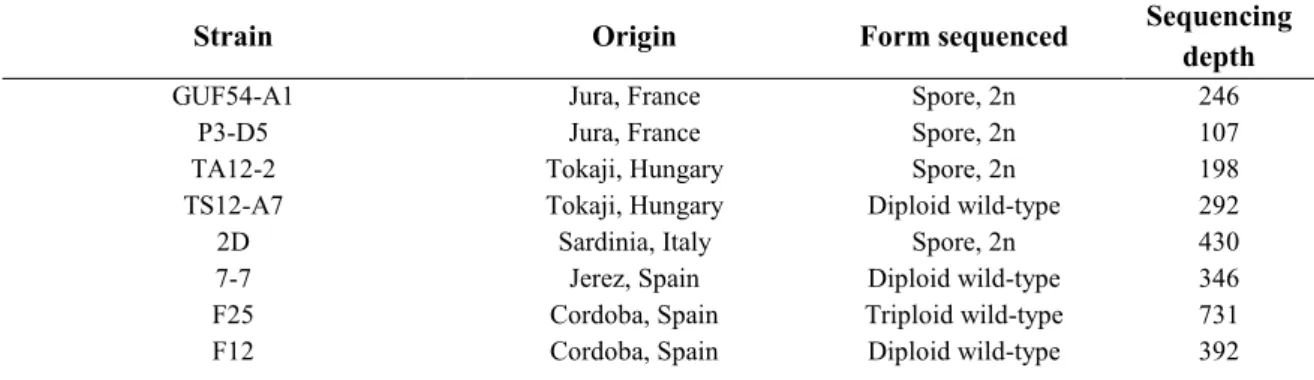
Fermentation and flor ageing are performed by two different lineages of yeast strains (Legras et al., submitted), and the last decade has brought to light some of the specificities of flor yeast in comparison to wine, but these specificities still remain globally unknown. In this thesis we have studied flor yeast in comparison to wine yeast in order to unravel their specificities. The genome sequence of 18 strains (wine and flor) from France, Hungary, Italy and Spain have been obtained. We have also developed a set of haploid flor strains for the molecular evaluation of different targets, and developed as well a synthetic media mimicking wine for that purpose. We present here the divergent regions that we have detected from the comparison of these genome sequences. For some of them, we have evaluated the impact of allelic variation in order to assess their role in the flor phenotype. The information gained by genome exploration of flor strains in comparison to wine strains should shed new light on the adaptation to flor ageing media and help to explain the genomic features peculiar to flor strains.
This manuscript presents first a bibliographic part where are illustrated different types of flor ageing process and the constraint they impose on yeast metabolism, the state of the art of biofilm build-up and FLO11 regulation. Experimental data are detailed in three chapter: one presenting the construction of tools necessary for the evaluation of different target genes; another, consisting in a not yet published article, presenting the genome sequencing, the identification of regions that differentiate flor and wine strains and the evaluation of the allelic impact of some of them; and a third additional chapter describing the evaluation of some target genes for which we do not succeed in the identification of a differential phenotype. The experimental part is followed by a general discussion and conclusion.
1.1 Comparison of Flor ageing processes
Flor ageing is performed in different countries, for Vin Jaune (France), Tokaji (Hungary), Vernaccia (Italy) and the most famous Sherry (Spain). Each vine area has developed a specific process of flor ageing.
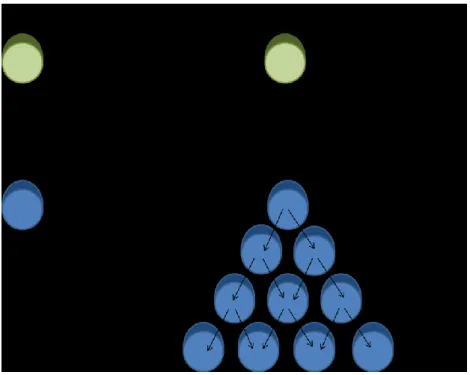
The simplest ageing processes are performed in Italy (Sardinia) and France (Jura). In Sardinia, after the end of the fermentation the wine is transferred to chestnut and oak barrels left empty for 1/10 of the total volume, where biological ageing by flor strains takes place. Ageing process is then followed by an oxidative step (Del Caro et al., 2009). In Jura, alcoholic fermentation is performed separately in a cask or a tank, and after alcoholic fermentation, wines are transferred in another cask, where ageing takes place with or without inoculation with starter yeast (Levaux & Berthaud, 2011). These two systems are static (Fig. 1A) and inoculation is not always performed.
In contrast to Italian and French wines, Fino Sherry wine ageing are produced using a sophisticated system: the “sobretablas” and “solera” systems which alternate static and blending steps. “Sobretablas” is the first phase and consists in the fermentation of the must in 500-600 l oak casks to produce young wine that is fortified with 15-16% ethanol (v/v). In the second phase (“solera”), in which takes place the biological ageing of sherry wines, oak barrels are organized in rows that contain wine at different ageing stages: the lowest stage, called “solera”, contains the oldest wine and is followed by stages, called first, second and third “criadera”, containing wine progressively younger. Usually the system is a four-scale but sometimes the number of stages can reach up to 6. Commercial wine is collected from “soleras” and an identical amount corresponding to one third of the total volume is replaced with wine coming from the upper stage and so on till to replace the youngest wine at the top with that obtained from “sobretablas” (Fig. 1B) (Domecq, 1989). In this way there is a homogenization of the wine and the organoleptic profile is always similar inside oneself-scale. Some authors demonstrated that short and periodic aerations during the biological ageing or increasing the surface/volume ratio of the wine can reduce the length of this process (Mauricio and Ortega, 1997; Cortés et al., 1999; Saavedra and Garrido, 1961). The transfer of wine in the “solera” system, called blending, increases oxygen concentration in all the rows and diminishes the nutrient in a gradual way, from the upper “criadera” to the “solera”. This leads to a progressive diminution of acetic acid,
glycerol and L-Proline while the concentration of acetaldehyde increases all along ageing (Berlanga et al., 2004).
Figure 1: Sherry-like wine production process. Adapted image from Villamiel et al. (2008). A) Production system of Vin Jaune (France) and Vernaccia di Oristano (Italy). B) “Criadera/solera” system in Spanish Sherry production.
All these ageing processes share an interesting and surprising feature: the concentration of volatile compounds increased, which seems to be mainly due to water evaporation through the wood of the butts (Martínez de la Ossa et al., 1987).
1.2 Flor strains specificities
Flor strains have been found genetically isolated from wine strains (Sancho et al., 1986) and possess various distinctive genetic features that differentiate them from other wine strains.
A first genetic specificity of flor yeast has been reported in their ITS sequence: a 24-bp deletion in the ITS1 region detected in Spanish flor strains and the insertion of a nucleic acid base C identified in the same region in French flor strains (Esteve-Zarzoso et al., 2001; Charpentier et al., 2009), leading to specific digestion profiles. Population studies have revealed a high mitochondrial DNA polymorphism (Esteve-Zarzoso et al., 2001; Castrejon et al., 2002) as well as large polymorphism in their karyotypes (Mesa et al., 1999).
More recently, the diversity of Jura flor yeast has been investigated with interdelta-typing and karyotyping, and reported a relation between flor strain genotype clusters and phenotypes (Charpentier et al., 2009). A more recent study compared the diversity of these Jura flor strains to strains from Hungary, Spain and Italy with microsatellite markers which revealed that all these yeast strains belong to the same genetic cluster (Legras et al., submitted).
The high karyotypic polymorphism of flor strains has been associated with aneuploidy and gross chromosomal rearrangements (GCRs) (Infante et al., 2003; Guijo et al., 1997). During a CGH-array comparison of two flor strains, Infante et al. (2003) found numerous duplicated genes, possibly provoked by the high frequency of double-strand breaks (DSBs) in DNA associated with the high acetaldehyde content produced during biological ageing (Ristow et al., 1995). They concluded that GCRs are an important factor for adaptive evolution of flor strains (Infante et al., 2003). Genes contained inside these duplicated regions may have a higher expression as a result of gene dose effect that could be useful for flor characteristics (Infante et al., 2003). Several recent experimental adaptation studies have shown that, indeed, aneuploidies can favor adaptation to harsh conditions (Dunham et al., 2002; Gresham et al., 2008, 2010; Infante et al., 2003).
However, recent CGH array results obtained on 6 flor strains isolated from Hungary, Spain, France and Italy, infirm the hypothesis that GCRs play a major role in the evolution of flor strains (Legras et al., submitted), as few duplicated genes were found in the genome of the strains being compared. In addition these authors reported ploidies close to 2n for most strains except for 2 Spanish strains. This suggests that the large aneuploidies observed by Infante et al. (2003) are rather more the results of the comparison of two strains of different ploidies than the results of the amplification of specific genes.
Flor strains are also characterized by poor sporulation and nonviable spores (Ibeas and Jiménez, 1996; Budroni et al., 2000) even though some differences can be observed between strains (Legras, personal communication), and by the incapacity to ferment galactose and maltose (Budroni et al., 2005). Low spore viability together with the consumption of galactose and maltose seems to be inversely correlated to flor-forming ability in Sardinian flor strains (Budroni et al., 2005).
Moreover, Sardinian flor strains were described to undergo a different life cycle than wine strains (Santa Maria and Vidal, 1970; Budroni et al., 2000; Pirino et al., 2004). This
semi-homothallic cycle is characterized by an atypical segregation, 2 non-mating and 2 mating spores, dominant HO and Ya (or Yα) in homozygosis at both silent loci HML and HMR. During fermentation flor strains are more affected than wine strains by lack of lipids in the must, showing lower viability and sluggish fermentation activity as a result of decreased production of unsaturated fatty acids and ergosterol (Zara et al., 2009). This phenomenon does not appear to be linked to defects in the functionality of lipid biosynthesis, because the saturation of the culture medium with oxygen restores proper cell lipid composition. The authors suggest that flor strains require a large amount of oxygen during the early stages of fermentation in order to successfully complete the first oxygen-dependent steps in the lipids biosynthesis. Moreover, the addition of lipid supplements could reduce the adverse effects of the production of reactive oxygen species (ROS) and oxidative damage during fermentation (Landolfo et al., 2008; Landolfo et al., 2010).
But, finally, one of the most important traits of flor strains is their ability to build biofilm, essential for the biological ageing of Sherry-like wines.
1.3 Wine fermentation vs flor ageing
Wine fermentation and flor ageing are two processes that take place in different environments, where yeasts display different lifestyles. Flor ageing is an oxidative process and this oxidative metabolism is necessary to keep flor strains at the wine surface. Indeed flor petite mutants cannot form velum and are more susceptible to ethanol (Jiménez and Benítez, 1988).
A key difference between wine and flor yeast comes from the differences in growth style: during wine fermentation yeasts are in suspension in the vessel as a pelagic growth whereas during biological ageing of Sherry-like wines, flor strains form multicellular aggregates and rise at the wine surface forming a biofilm. The manner the biofilm installed depends of the type of ageing (Sherry, Vernaccia di Oristano or Vin Jaune). Biofilm formation can install immediately at the end of fermentation, when the concentrations of any fermentable carbon source is null or undetectable (Martinez et al., 1997a) or it can happen later. In the case of Vernaccia di Oristano flor strains can start to form biofilm when the fermentation is still ongoing (Budroni, personal communication).
Yeast requires carbon and nitrogen sources, oligoelements and vitamins for growth. During wine fermentation grape must is rich in nutrients: it contains a high concentration of
glucose and fructose (ranging from 150 to 260 g/L in mature grape juice) (Ribéreau-Gayon et al., 1998) and assimilable nitrogen in variable content depending on the must (from 50 to more than 400 mg N/L) (Bely et al., 1990), sufficient to provide growth in most cases. On the contrary, during flor ageing on wine, glucose and fructose are almost completely depleted, and ethanol and various by-products (glycerol, organic acids, higher alcohols and their acetate) have been produced during alcoholic fermentation. In wines, ethanol is produced inconcentrations up to 16%, and the concentration in glycerol, which is the most abundant by product after ethanol and CO2, reaches 6-10 g/L. Glycerol synthesis takes place mainly during the growth phase and plays a major role during wine fermentation to reoxidize the NADH excess produced during biomass formation.
The exhaustion of glucose and fructose and the presence of oxygen impose flor yeast cells to shift from fermentative to oxidative (respiratory) metabolism. Both ethanol and glycerol, the most abundant carbon sources, can sustain flor yeast growth but glycerol enables a much better growth than ethanol (Zara et al., 2010). Flor yeasts can also consume organic acids (acetic, lactic, citric and succinic) as carbon sources.
Another important source for yeast is nitrogen not only to ensure cellular growth and metabolism but also because low levels of this compound can cause stuck and sluggish fermentations (Bely et al., 1990; Mauricio et al., 1995) and amino acids are the precursors of higher alcohols which take part to the composition of wine aroma (Henschke and Jiranek, 1994). The major nitrogen compounds in musts are ammonium, arginine and proline (Huang and Ough, 1991; Ough et al., 1991). During fermentation the first to be used is ammonium, that when abundantly present causes the nitrogen catabolite repression, preventing the use of other nitrogen compounds (Beltran et al., 2004; 2005). Even arginine and other amino acids are consumed while proline is used only to a limited extent during wine fermentation because the lack of molecular oxygen, which is essential for the activity of proline oxidase (Duteurtre et al., 1971; Mantachian, 1984), and the inhibition of proline permease by the above-cited nitrogen catabolite repression (Lasko and Brandriss, 1981; Horák and Ríhová, 1982). Instead, during biological aging the main nitrogen source becomes proline (Botella et al., 1990; Mauricio and Ortega, 1997).
The aerobic growth from available carbon and nitrogen resources leads to significant changes in the general composition of the wine and as well in organoleptic features. Flor yeast form mainly acetaldehyde but other volatile compounds such as acetic acid, acetoin,
2-3 butanediol and diacetyl are also produced. Ethanol is metabolized to acetaldehyde which provokes a decrease of ethanol content, and the high concentration of acetaldehyde, a chemically reactive compound, is one of the most important characteristics of Sherry wines (Domecq, 1989). Acetaldehyde gives rise to the production of lactones such as solerone and sotolon, and the latter is very important for the flavor of the French Sherry-like wine (Dubois et al., 1976; Guichard et al., 1992). The concentration of glycerol decreases during wine ageing.
Other families of chemical compounds are changed during ageing: a significant reduction of total acidity is observed and this decrease could be explained by the metabolism of flor strains which assimilate especially acetic acid (Berlanga et al., 2004), however main organic acids, except acetic acid, do not seem to enable velum growth when provided as the sole carbon source (Zara et al., 2010). This consumption of acetic acid leads to the reduction of volatile acidity.
1.4 Biofilm
During biological ageing S. cerevisiae flor strains grow aerobically at the surface of the wine forming multicellular aggregates. This aggregation leads to the build-up of a biofilm, also called velum, and allows cellular population to overcome stress conditions, like nitrogen and sugar depletion, after the end of fermentation.
Many other microorganisms than flor yeast are able to form biofilms, which are a widely encountered mode of growth for microorganisms. Some bacteria, fungi and archaea are able to form multicellular aggregates, and should be seen as the default mode of life of microorganisms. Most of microorganisms form pathogenic biofilms and 65-80% of human microbial infections derive from these biofilms that are difficult to eradicate by conventional antimicrobial therapy (Costerton et al., 1999; Donlan and Costerton, 2002). These biofilms can be defined as surface-associated microorganisms embedded in a matrix of extracellular polymeric substances (Hall-Stoodley et al., 2004). Inside the biofilm, coordinated chemical communication between cells enables biofilms to behave as multicellular entities (Costerton, 1995). This structure confers unique benefits to cells: resistance to antibiotics, defence from toxic compounds, higher retention of extracellular enzymes near the cell, resistance to desiccation and control of competition and predation (Quintero and Weimer, 1995; James et al., 1996; Costerton et al., 1995).
1.4.1 Archaeal biofilms
Biofilms formed by archaea are the less studied even if frequently detected in different environments (Kruger et al., 2008; Zhang et al., 2008). Archaea can coexist in biofilm with bacteria both in natural habitats and in human diseases (Hall-Stoodley et al., 2004).
Formation of biofilms in archaea is induced by different stress conditions: high metal and antibiotics concentrations, oxygen, extremes of temperature and high pH (Lapaglia and Hartzell, 1997).
In archaea flagella are responsible of cell-cell connections and adhesion to surfaces promoting biofilm formation (Näther et al., 2006).
Archaeoglobus fulgidus forms a biofilm very heterogeneous which contains proteins,
polysaccharides and metals. The property to include metals in its biofilms can have applications in the detoxification or in the concentration of metals (Lapaglia and Hartzell, 1997).
1.4.2 Bacterial biofilms
Bacterial biofilms were the first to be observed and are the most studied. Anthony van Leeuwenhoek, towards the end of the XVII century, observed aggregation of bacteria in the plaque development of teeth and Pasteur (1864) noticed aggregated bacteria during acetic fermentation.
Biofilm enables cells to resist in a hostile environment and many infections that involved bacterial biofilms are hardly eradicated with available antimicrobials (Costerton et al., 1999). Bacterial biofilms can be both directly and indirectly responsible for human infections. The first case is that of infective endocarditis (Donlan and Costerton, 2002), cystic fibrosis pneumonia (Koch and Hoiby, 1993; Lyczak et al., 2002) and dental caries while the second is due to contamination of medical devices like prostheses, catheters, cardiac pacemakers, endotracheal tubes, … (Hall-Stoodley et al., 2004).
Bacteria can form two biofilm structures: a heterogeneous mushroom-shaped during growth on glucose or a flat biofilm during growth on citrate (Klausen et al., 2003a).
Formation of the heterogeneous mushroom-shaped biofilm involves three structures: flagella, type I and type IV pili. Flagella give to cells the motility necessary to reach the surface overcoming its repulsive forces during the first steps of velum formation (O’Toole and Kolter, 1998a,b; Pratt and Kolter, 1998). Type I pili, which contain mannose-sensitive
adhesins, are necessary in the initial stages of biofilm formation and operate adhering to abiotic surfaces, carrying out a stable cell-surface attachment (Pratt and Kolter, 1998; Davey and O’toole, 2000). Then, motility and type IV pili help biofilm diffusion on the surface (O’Toole and Kolter, 1998a,b). In particular, type IV pili, during the last stages of biofilm formation, are used to climb up on the initial microcolonies formed making a cap and completing the biofilm mushroom-shaped (Klausen et al., 2003b).
In flat biofilm, instead, attachment of cells is independent from flagella and type IV pili, microcolony formation is due to clonal growth and biofilm diffusion is a consequence of twitching mobility (Klausen et al., 2003a).
1.4.3 Fungal biofilms
Like bacteria, some pathogen fungi are able to form biofilm on prostheses or catheters causing infections in patients (Kojic and Darouiche, 2004). Fungal biofilms can also be formed on industrial installations, having an important economic impact for food-processing companies (Verstrepen and Klis, 2006), and on biotic surfaces like oral mucosal (Dongari-Bagtzoglou et al., 2009).
Biofilm structure (cell-to-cell aggregation, the presence of an extracellular matrix, metabolic plasticity and the up-regulation of efflux pump genes) provide a higher resistance towards host immune factors and antifungal drugs than planktonic cells (Fanning and Mitchell, 2012).
Biofilm formation in fungi is the result of three consecutive stages: adherence to the substrate, cell proliferation on the surface and formation of hyphae in the upper part of the biofilm (Finkel and Mitchell, 2011). Hyphae and biofilm formation is contact sensing: yeast cells begin to form hyphae and biofilm after contact with a surface (Kumamoto and Vinces, 2005). In a similar manner, some diploid strains of S. cerevisiae form pseudohyphae in response to the contact with a surface during nutrient deprivation (Gimeno et al., 1992; Lorenz et al., 2000). Candida albicans produces a different response in function of the type of surface with which takes contact: biofilm formation or filamentation occurs after contact with a solid or a semisolid surface respectively (Kumamoto, 2005). For pathogenic fungi contact sensing is important for virulence: the contact with a surface induces formation of invasive hyphae that allow the fungus to reach the bloodstream favouring the onset of infections (Kumamoto, 2008).
Some pathogenic fungi, like C. albicans and Cryptococcus neoformans, are able to carry out dimorphic transition switching from the yeast form to the more invasive hyphal form (Sudbery et al, 2004). Both are important for virulence, hyphae allowing invasion while yeast form being the first responsible of dissemination of infections (Jacobsen et al., 2012; Saville et al., 2003). A large number of environmental signals can cause morphogenesis: temperature, pH, CO2, different carbon sources, Ca2+, proline, N-acetylglucosamine, low ammonia and others (reviewed in Han et al., 2011). The switching in C. albicans is mainly regulated by two pathways activated by external stimuli: the Mitogen-Activated Protein Kinase (MAPK) pathway and the cAMP-Protein kinase A (PKA) pathway (Han et al., 2011).
1.5 Quorum sensing
Formation of all biofilm is mediated by mechanisms of quorum sensing. In a biofilm cells are interactive organisms belonging to a microbial community that manifest coordinate group behaviours. This phenomenon is activated through the production of autoinducers, small molecules that allow cell-to-cell communication (Nadell et al., 2008). These molecules are released by cells and are accumulated depending on cell density. When
quorum (population density threshold) is reached autoinducers interact with receptors,
which control gene expression, on the cell surface. In this way takes place quorum sensing, the coordinated gene expression obtained in function of population density (Fuqua et al., 1994). Quorum sensing is responsible of different effects in cells such as antibiotic biosynthesis (Bainton et al., 1992) or dimorphic transition (Hornby et al., 2001), and biofilm formation (Alem et al., 2006).
For C. albicans, quorum sensing can be obtained through the action of aromatic alcohols and farnesol (Hornby et al., 2001). Farnesol can block biofilm formation (Langford et al., 2009). In S. cerevisiae the aromatic alcohols, phenylethanol, tryptophol, have been described to act as autoinducers in filamentous growth (Chen and Fink, 2006). Each of these alcohols triggers similar but slightly different responses under the control of Cat8 and Mig1 (Wuster and Babu, 2010). The production of autoinducers can be affected by availability of their precursors, such as aromatic amino acids in C. albicans (Ghosh et al., 2008).
1.6 Extracellular matrix
Biofilm formation begins with the interaction of cells with a surface, afterwards the production of extracellular matrix contributes to the architecture of the velum (Davey and O’toole, 2000). Most biofilms present a variable and complex matrix structure: cells embedded in it can form a thin and dispersed layer or a thick one, different sections of matrix display changes in density and channels are present allowing the passage of nutrients and metabolites (Sutherland, 2001). Due to the variety of its constituents, such as water, exopolysaccharide (EPS), cell components derived from cell lysis and substances coming from the surrounding environment, the matrix contributes to the creation of a heterogeneous environment (Davey and O’toole, 2000; Sutherland, 2001). The nature of the matrix is dependent on intrinsic and extrinsic factors: the first comprise genetic features of microorganisms, the second is due to physico-chemical characteristics of the environment (Wimpenny, 2000; Sutherland, 2001). EPS, one of the matrix components, has been reported to have benefits. In fact, it can hamper the access of some antimicrobial agents into the velum (Gilbert et al., 1997), sequester cations, metals and toxins (Decho, 1990; Flemming, 1993) and protect from different environmental stresses, such as osmotic shock, UV radiation, pH changes and desiccation (Flemming, 1993). The amount of EPS is variable depending on the microorganism and increases as the biofilm gets older (Davey and O’Toole, 2000; Varon and Choder, 2000; Branda et al., 2005).
In some strains, C. neoformans and Candida spp., the extracellular matrix is also important for pathogenicity (Mukherjee et al., 2005; Jain et al., 2006).
Most of the information available on the extracellular matrix concerns bacteria and fungi, little is known about S. cerevisiae. The presence of an extracellular matrix was observed in the air-liquid interfacial biofilm of Sardinian flor strains but till now nothing is known about its composition (Zara et al., 2009).
1.7 Flor yeast velum and role of FLO11
Gaining the ability of adhere to each other is a crucial point for the build-up of a biofilm. This ability of yeast cell is obtained through the activation of different adhesins which have been identified in different yeast strains. They include FLO1, FLO5, FLO9, FLO10, and
FLO11 which are cell wall-associated surface protein (Brückner and Mösch, 2012) FLO1, FLO5, FLO9 act as lectins, that recognize mannose oligomers using a Ca2+ binding motif
whereas FLO10 and FLO11 are able to confer cell-to-cell adhesion in a mannose and Ca2+ independent manner (Brückner and Mösch, 2012). The activation of FLO10 and FLO11 lead to an increased cell surface hydrophobicity.
Cells lipid content was found elevated and/or altered in biofilm (Farris et al., 1993; Iimura et al., 1980a, 1980b; Martínez et al., 1997), but several authors individuate in FLO11 the gene responsible of the increased hydrophobicity during biofilm formation (Fidalgo et al., 2006). This gene, localized on the IX chromosome, consists in a 4104 bp ORF (Lo and Dranginis, 1996) and its promoting region contains 4 upstream activation sequences (UASs) and 9 repression elements, reaching a length of at least 2800 bp (Rupp et al., 1999). This gene encodes a glycoprotein localized in the cell wall and contains three domains: a C-terminal domain containing the consensus sequence for the GPI anchor, a central domain containing highly repeated sequences rich in serine and threonine and a hydrophobic N-terminal domain (Lambrechts et al., 1996; Lo and Dranginis, 1996). These domains are retained to be essential for the floatability of flor strains. In fact, the C-term could anchor the glycoprotein to the membrane and the central domain could promote the elongation of the protein across the cell wall exposing the hydrophobic N-terminal domain on the cell surface (Teunissen et al., 1995; Fidalgo et al., 2006).
The higher hydrophobicity of the Flo11 protein seems due to the expansion of the central domain (Reynolds and Fink, 2001; Zara et al., 2005; Fidalgo et al., 2006) which is glycosylated. The glycosylation of this central core of the adhesion is essential for adhesion (Meem et al., 2012). In particular, mutations in the promoter and in the coding region of the gene FLO11 are responsible of the acquisition of floatability: a deletion of 111bp in the promoter which comprises a repression sequence necessary to inhibit FLO11 that results in higher expression levels and a minisatellite expansion which amplification corresponds to an increased hydrophobicity (Fidalgo et al., 2006). A study carried out on 20 Sardinian wild flor strains revealed that FLO11 is highly polymorphic and that the ability to produce biofilm is dependent not only on the expansion of the repeated sequences but also on the transcriptional levels of the gene (Zara et al., 2009). Additional analysis made among Jura flor strains indicated that the 111bp deletion in the promoting regions was sometime missing but was accompanied by an increase in the length of FLO11 (Legras et al., submitted).
Zara et al. (2005) proposed a model for the air-liquid interfacial biofilm formation based on the increased surface hydrophobicity due to the glycoprotein Flo11: at the diauxic shift the
FLO11 expression increase results in a higher cell surface hydrophobicity, in line with the
formation of multicellular aggregates that capture bubbles of CO2 coming for fermentation of residual sugar allowing the floatability of aggregates and velum formation.
Even though Flo11 has been shown to be the main player in biofilm formation, but one can wonder if other parietal proteins contribute to a lower extent to biofilm formation, in this sense, the contribution of Flo1 and Flo10 which are also involved in cellular adhesion phenotypes (Bester et al., 2012) has to be more carefully evaluated. Furthermore, Flo10 has the same structure of Flo11 and it will be not surprising that Flo10 also has a role in biofilm formation. In addition two other proteins were described to have a role in its building up. A 49-KDa mannoprotein was found contributing to cell surface hydrophobicity and probably in biofilm formation in French flor strains (Alexandre et al., 2000) and a point mutation or deletion of HSP12, which encodes a heat-shock protein, leads to a failure in velum formation in Sardinian flor strains (Zara et al., 2001).
1.8 FLO11 regulation
Much of FLO11 regulation has been gained from the study of pseudohyphal growth, which revealed that its regulation is one of the most complex of S. cerevisiae genome. The expression of FLO11 is finely tuned with environmental response such as nutrient deprivation (nitrogen, and sugar), pH and stress. This complex regulation results from the combination of 3 main pathways: the filamentous growth MAPK pathway, the Ras/cAMP/PKA pathway, and the glucose repression pathway. But three other regulatory pathways have also been described: the “Target of Rapamycin” (TOR) pathway, a pH sensing pathway and an epistatic pathway (Verstrepen and Klis, 2006; Cullen and Sprague, 2012). FLO11 expression is triggered by two long intergenic noncoding RNAs (ncRNAs) (Bumgarner et al., 2009) on which acts the different regulatory transcription factors, and is also under epigenetic control (Frieman and Cormack, 2004; Halme et al., 2004; Barrales et al., 2012). Nutrient depletion or stress factors activates its transcription (Sampermans et al., 2005) while availability of glucose represses it.
1.8.1 Filamentous growth MAPK pathway
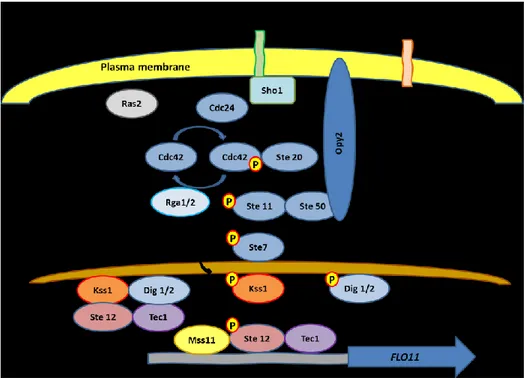
The filamentous growth MAPK pathway (FG pathway) is activated by nutrient deprivation (Fig. 2). Msb2, a signaling mucin, is believed to be a receptor for the external signals that activate this pathway and might act in response to stress or nutrient deprivation (Cullen et al., 2004; Cullen and Sprague, 2012). Msb2 associates with the transmembrane osmosensor Sho1 to transmit the signal to the downstream components of the pathway (Tatebayashi et al., 2007). Cullen et al. (2004; 2012) proposed a model where Msb2 activated by the signal and associated with Sho1 bring the guanidine nucleotide exchange factor (GEF) Cdc24 in proximity of its Rho-like GTPase Cdc42, which is then activated and can bind and transmit signal to its effector proteins, among which the MAPKKKK Ste20. Then, GTPase-activating proteins (GAPs) Rga1 and Rga2 can turn back Cdc42 to its inactive form Cdc42-GDP, accelerating GTPase activity (Smith et al., 2002; Tcherkezian and Lamarche-Vane, 2007). Ste20 activates the MAPK cascade phosphorylating Ste11, which forms a complex with Ste50 and in turn phosphorylate Ste7. The MAPK/ERK (Extracellular signal Regulated) kinase Ste7 then phosphorylates Kss1 (Madhani and Fink, 1997). Kss1 triggers filamentous growth in two opposed different manners: itactivates filamentation through its kinase-dependent activity and inhibits it as well through a kinase-independent role (Madhani and Fink, 1997). When the FG pathway is activated Ste7 phosphorylates Kss1, which becomes an activator. Kss1 shows its kinase activity phosphorylating Ste12 (Madhani and Fink, 1997). In this way, Ste12 together with Tec1 binds at filamentous growth response elements (FRE) in the promoter of FLO11 and triggers filamentation (Lo and Dranginis, 1998; Rupp et al., 1999; Gagiano et al., 2002). Another player, Mss11 acts as a transcriptional activator of FLO11 (van Dyk et al., 2005) which interacts with Ste12 and Tec1. The repressive kinase-independent role, instead, takes place in absence of stimuli for filamentous growth, and in this case Kss1 binds to Ste12 and inhibits its function of transcriptional activator of FLO11 (Lambrechts et al., 1996; Bardwell et al., 1998). The two nuclear proteins, Dig1 and Dig2, bind to Kss1 and Ste12 during repression (Cook et al., 1996; Tedford et al., 1997). Kss1, when activated, phosphorylates Dig1, Dig2 and Ste12 allowing a full derepression (Bardwell et al., 1998).
Recent data indicate also that nitrogen transport affects pseudohyphal growth. Rutherford and collegues (2008) reported first that the ammonium permease Mep2 transmits the signal along the MAPK pathway. However, more recently Torbensen et al. (2012) reported that
amino acid transporters GAP1, DIP5 and GNP1 are essential for biofilm formation. Deletion of GAP1 induced a MAP kinase, cAMP/PKA, FLO11 independent invasive growth. Meanwhile, Judeh et al. (2013) inferred from microarray data obtained under nitrogen stress that the deletion of FLO8 is likely to affect the biosynthesis/metabolism of sulfur containing nitrogenous compound and impair transport of nitrogen compounds (Judeh et al., 2013).
Figure 2: Filamentous growth MAPK pathway. Image adapted from Gagiano et al. (2002), Verstrepen and Klis (2006). Some associations are not shown to simplify the picture.
Several component of the pathway are associated in complexes: Msb2 associated not only with Sho1 but also with Cdc42 (Cullen et al., 2004), Opy2 associates with the adaptor Ste50 (Wu et al., 2006; Ekiel et al., 2009) which, in turn, associates with Cdc42 and Ste11 (Posas et al., 1998; Truckses et al., 2006; Garcia et al., 2009), Cdc42 binds also Ste20 (Simon et al., 1995; Zhao et al., 1995; Peter et al., 1996), inactive Kss1 associates with Dig1, Dig2, Ste12 and Tec1 (Cook et al., 1996; Tedford et al., 1997; Gagiano et al., 2002), phosphorylated Ste12 binds Tec1 in the promoting region of FLO11 (Madhani and Fink, 1997).
In addition to Cdc42 another GTP-binding protein, Ras2, has been proposed to transmit the signal along the FG pathway. Some authors have suggested that Ras2 acts upstream of Cdc42 (Mösch et al., 1996) but is not clear how it can regulate the pathway. To date the involvement of Ras2 in the FG MAPK pathway cannot be excluded but there is no evidence of its role in this pathway. In fact, a direct association with the upstream
components of the pathway has been excluded (Cullen and Sprague, 2012): Msb2 binds Cdc42 but not Ras2 (Cullen et al., 2004), Ste50 links to Cdc42 but not Ras2 (Truckses et al., 2006).
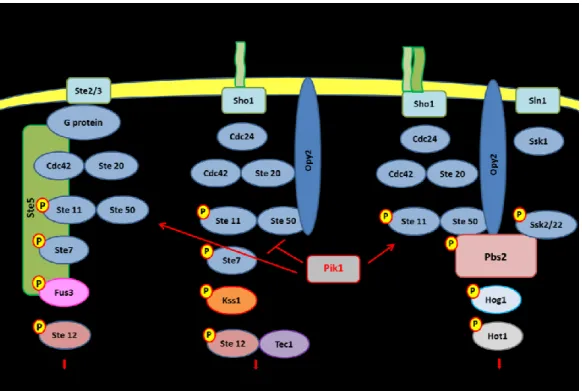
Some of the components of the filamentous growth MAPK pathway (Cdc42, Ste20, Ste11, Ste50 are also shared by other two MAPK pathways (Fig. 3): the mating pathway and the High Osmolarity Glycerol (HOG) response pathway.
The mating pathway is activated by pheromone, which is sensed by Ste2/Ste3 receptors. Ste2 is present in MATa cells, Ste3 in MATα cells (Jenness et al., 1983; Hagen et al., 1986). When pheromone signal reaches cell wall, the receptor changes conformation, transmitting the signal to the G protein with which it is associated in the plasma membrane and activates the downstream components of the pathway (Konopka and Fields, 1992). As the FG pathway, the complex Cdc42/Ste20 phosphorylates Ste11 activating the MAPK cascade, but unlike the FG pathway the last kinase is not Kss1 but Fus3 (Elion et al., 1991; Cullen and Sprague, 2012), which phosphorylates Ste12 (Elion et al., 1993). The transcription factor Ste12 is also present in the FG pathway and it has been proposed that signalling specificity is due to Tec1, another transcription factor that acts as a coregulator during filamentous growth while it is degraded during mating (Madhani and Fink, 1997; Bao et al., 2004; Cullen and Sprague, 2012). Ste5 a large scaffold protein that associates with Fus3, Ste7, Ste11 is a component of the mating pathway not shared by the other two MAPK pathways (Cullen and Sprague, 2012) and the β subunit of the G protein (Whiteway et al., 1995). The β subunit associates also with Ste20 (Leeuw et al., 1998).
The HOG pathway is activated by high extracellular osmolarity and the signal is sensed by 2 membrane sensor proteins that transmit the osmotic stimulus along 2 separated branches: Sho1, osmosensor present also in the FG pathway, and Sln1 (Maeda et al., 1994, 1995). Sho1 associates with two signaling mucins, Msb2 and Hkr1, to transmit the signal (Tatebayashi et al., 2007). The downstream components from Sho1 to Ste11 are shared by the FG pathway. When activated, Ste11 associates and activates Pbs2, MAPKK and scaffold protein common to both branches of the HOG pathway (Cullen and Sprague, 2012). When the osmotic stimulus reaches Sln1, its histidine kinase activity is repressed, unphosphorylated Ssk1 accumulates inducing the autophosphorylation of Ssk2/22 that phosphorylate Pbs2 (Maeda et al., 1994; Posas et al., 1996; Posas and Saito, 1998). Pbs2, when activated, phosphorylates the MAPK Hog1, which in turn phosphorylates different
transcription factors (Westfall et al., 2004). Thus, both branches sense hyperosmolarity but transmit the signal to Pbs2 independently of each other.
The mating and the HOG pathway not only share some of the components with the FG pathway but can also regulate it. Hog1 inhibits the filamentation pathway and it has been proposed that it could act by phosphorylating and, hence, inactivating a component of the pathway, but is still unclear which component of the FG pathway is the target of Hog1 (Cullen and Sprague, 2012). Also Fus3 has been proposed to have an inhibitory function in filamentation and the mating pathway can regulate the transcription of Tec1 and Kss1 (Oehlen and Cross, 1998; Roberts et al., 2000). Moreover, Kss1 is partially activated in response to pheromone and osmotic stress (Cullen and Sprague, 2012).
Cappell and Dohlman (2011) reported that PIK1, encoding Phosphatidylinositol 4-kinase (PtdIns 4-kinase), among its different roles inside the cell has also the function to regulate the activity of these three MAPK pathways in yeast. Pik1 carries out its regulatory activity promoting the activation of Fus3 and Hog1, MAP kinases that induce respectively mating program and high osmolarity glycerol response, and repressing the activation of Kss1, MAP kinase which, when active, induces filamentous growth. This regulation is achieved, very likely in an indirect way, through upstream components common to all three pathways: Ste11, Ste50 and Opy2 (Cappell and Dohlman, 2011). Thus, PIK1 contributes to filamentous growth but its involvement in the regulation of biofilm formation is not known.
Figure 3: Schematic representation of Mating, Filamentous growth and HOG MAPK pathways. Image adapted from Cappell and Dohlman (2011), Cullen and Sprague (2012).
1.8.2 cAMP/PKA pathway
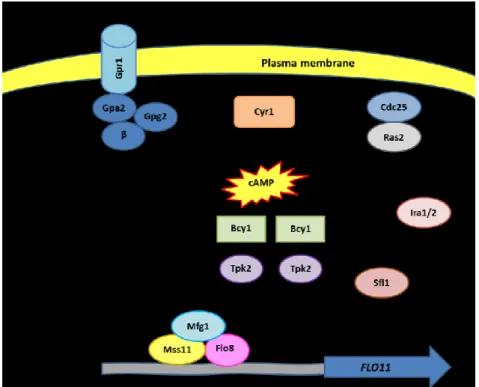
This pathway can be activated independently via Ras2 or Gpr1/Gpa2 (Fig. 4). In response to a glucose signal the small G protein Ras2 binds its GEF, Cdc25, which induces the exchange of GDP with GTP and activates it. The activity of Ras2 is regulated by Ira1 and Ira2, which bind the G protein and stimulate the hydrolysis of GTP to GDP and thus reverse the activation of CDC25. The active complex Ras2/Cdc25 associates and activates, in turn, the adenylate cyclase Cyr1 causing the production of cAMP which binds Bcy1, the regulatory subunit of the cAMP-dependent protein kinase (PKA) (Gagiano et al., 2002). In absence of cAMP (in the absence of glucose), PKA consists in a heterotetrameric complex in inactive state formed by two regulatory subunits and two catalytic subunits. PKA catalytic subunits are three (Tpk1, Tpk2 and Tpk3) and each one displays different functions. Tpk2 is responsible of filamentous growth while Tpk1 and Tpk3 inhibit filamentation (Verstrepen and Klis, 2006; Malcher et al., 2011; Gagiano et al., 2002). Tpk1 exerts its role inhibiting the epistatic Yak1/Sok2/Phd1 pathway that brings to FLO11 activation (Verstrepen and Klis, 2006; Pan and Heitman, 2000; Malcher et al., 2011) (see below). When cAMP associates with Bcy1, the latter undergo to a conformational change which reduces its affinity for its catalytic subunits and causes their release (Gagiano et al.,
phosphorylates it preventing the binding of Sfl1 with the promoter of FLO11. On the other hand, Tpk2 exerts its role of activator of filamentous growth activating the transcriptional factor Flo8, which binds FLO11 promoter together with Mss11 inducing its transcription (Verstrepen and Klis, 2006). Recently, Ryan et al. (2012) identified Mfg1, another regulator of FLO11 expression which interacts with Flo8 and Mss11 in the promoter of
FLO11. The other branch of the pathway which brings to cAMP production and PKA
activation consists of a G-protein-coupled receptor (GPCR), Gpr1, and a G protein. To date only α and γ subunits have been identified: Gap2 (Gα) and Gpg1 (Gγ). Gpr1 senses sucrose outside the cell and transmits the signal to the G protein activating it and stimulating cAMP production by Cyr1 (Cullen and Sprague, 2012).
Figure 4: cAMP/PKA pathway. Image adapted from Verstrepen and Klis (2006).
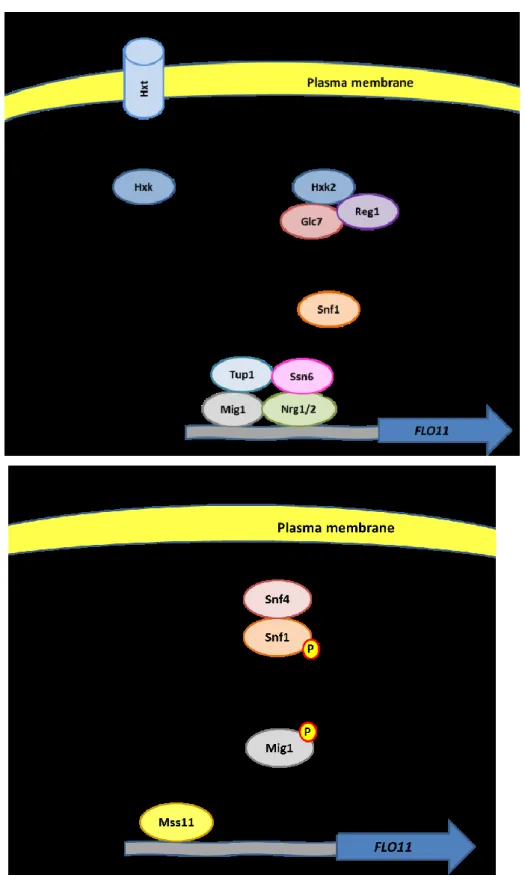
1.8.3 Snf1 glucose-sensing pathway
Another pathway regulates FLO11 transcription in response to glucose depletion independently from Gpr1/Gpa2/cAMP/PKA pathway: the Snf1 glucose-sensing pathway (Fig. 5). The AMP-activated protein kinase Snf1 formed a complex which consists in an α subunit (Snf1), a β subunit (comprising one of the three isoforms Gal83, Sip1 and Sip2) and a γ subunit (Snf4). During glucose starvation the activating subunit Snf4 binds the
regulatory domain of Snf1 inducing the phosphorylation of its activation loop by an upstream kinase (Busti et al., 2010). Snf1 is activated and phosphorylates the transcription factor Mig1 inhibiting FLO11 repression (Verstrepen and Klis, 2006). Instead, under high concentrations of sugar, glucose is transported inside the cell by Hxt transporters and phosphorylated by hexokinases to glucose 6-phosphates (Verstrepen and Klis, 2006). The hexokinase Hxk2 promotes the dephosphorylation of Snf1 carried out by the phosphatase complex Glc7/Reg1 bringing to Snf1 inactivation and enabling the transcriptional factors Mig1 and Nrg1/2 to bind FLO11 promoter (Verstrepen and Klis, 2006; Busti et al., 2010). The formation of the complex Mig1/Nrg1/Nrg2/Tup1/Ssn6 on FLO11 promoting region represses FLO11 transcription (Verstrepen and Klis, 2006). Mig1 and its homolog Mig2 regulate also the FG MAPK pathway through their interaction with Opy2. In particular, the glucose-sensing pathway components Mig1, Mig2 and Snf1 activate the FG pathway during glucose starvation while repress it when glucose concentration is higher (Karunanithi and Cullen, 2012). The transcriptional activator Mss11 seems to be required for the derepression of FLO11 by Nrg1 and Nrg2 (van Dyk et al., 2005).
Figure 5: Snf1 glucose-sensing pathway. Image adapted from Verstrepen and Klis (2006).
1.8.4 TOR pathway
The “target of rapamycin” (TOR) pathway has been described to be involved in FLO11 regulation. The ammonium permease Mep2 captures nitrogen signals (Gagiano et al., 1999)
and transmits them along the TOR pathway regulating FLO11 expression through the transcription factor Gcn4 (Cullen and Sprague, 2012). Details of this regulation pathway are not yet been understood.
1.8.5 Epistatic pathway
An epistatic pathway has been suggested and involves the transcription factors Sok2, Phd1 and Ash1 (Verstrepen and Klis, 2006). This pathway can be inhibited by the PKA catalytic subunit Tpk1. In particular, when PKA is active Tpk2 activates FLO11 and Tpk1 inhibits Yak1, very likely phosphorylating it. Phosphorylated Yak1 negatively regulates Sok2, which in turn represses FLO11 (Malcher et al., 2011) and Phd1, transcriptional activator which together with Mss11 activate the transcription of FLO11 (van Dyk et al., 2005) . Instead, when PKA complex is inactive Yak1 unphosphorylated can activate the pathway and positively regulate FLO11. Furthermore, Yak1 controls FLO11 regulation also through the transcription factor Haa1 (Malcher et al., 2011) while Sok2 negatively regulates FLO11 not only directly or through Phd1 but also through the transcription factor Ash1 (Pan and Heitman, 2000).
1.8.6 pH sensing pathway
A pH-sensing pathway has been suggested as further mechanism for FLO11 activation. This regulation involved the transcription factor Rim101 which is activated by Rim20 (Barrales et al., 2008).
1.8.7 ncRNAs switch of FLO11 expression and epigenetic control
A very specific regulation mechanism triggering FLO11 expression involves two long intergenic noncoding RNAs, PWR1 and ICR1. When Flo8 binds FLO11 promoter PWR1 is transcribed in the opposite direction of FLO11, blocking the transcription of the second ncRNA ICR1. Instead, ICR1 transcription occurs in the same direction of FLO11 when Sfl1 binds FLO11 promoter. ICR1 acts covering most of FLO11 promoting region and inhibiting its expression (Bumgarner et al., 2009). This complex interplay between ICR1 and PWR1 has been described as a toggle mechanism. However, the study of the expression of these genes at a single cell level has revealed instead that ICR1 transcription inhibits recruitment of Flo8 and Sfl1 to the FLO11 promoter (Bumgarner et al., 2012). Interestingly, this mechanism leads as well to a variegated cell population for the expression of FLO11. Epigenetic switch that toggles independently and slowly enable a
large combination of expression states and generate a large phenotypic diversity (Octavio et al., 2009). Silencing of FLO11 occurs in a SIR independent manner (Halme et al., 2004), and rely on histone deacetylase Hda1. Hda1 may be recruited by Sfl1 to silence FLO11 in a positional and promoter-specific way (Halme et al., 2004). In addition, the Rpd3L deacetylase and Swi/Snf complexes, respectively responsible of histone modification and chromatin remodeling, affect also promoter chromatin structure and activate FLO11 transcription. It has been proposed that both complexes act repressing the FLO11 transcription repressor SFL1 (Barrales et al., 2008; Barrales et al., 2012). Indeed Rpd3L may act through the repression of its ncRNA ICR1 (Bumgarner et al., 2009).
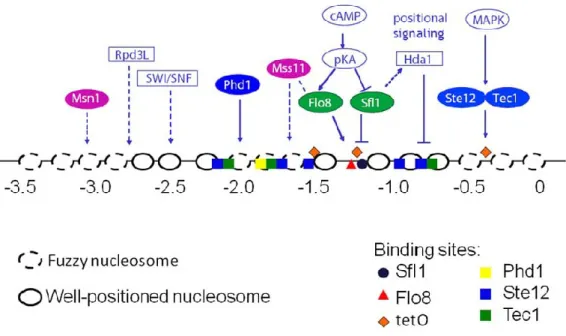
Octavio et al. (2009) proposed a global model kinetic explaining variegated FLO11 expression in cell population resulting from the combination of conventional activation and silencing. They hypothesized a three-status model for FLO11 expression: silenced (no expression), inactive but competent (no or weak expression) and active state, and different speed for changing status. The switch from silenced to competent is slow, whereas the switch from competent to active (the conventional regulation) is fast. They categorized transcription factors in three categories. Class I contains Tec1, Ste12, and Phd1, which stabilize weakly the competent state with low expression, and the binding sites of these activators are located in nucleosomally occluded regions. The second class of activators, which stabilize the competent state, contains Msn1 and Mss11. Flo8 and Sfl1 represent the third class of activators with opposed action. Flo8, acts in a mode somehow similar to Class II activators. Sfl1 acts as a conventional repressor of FLO11 and as well as a silencer via Hda1 (Fig. 6).
Figure 6: Schematic representation of regulators that converge to FLO11 promoter. Image from Octavio et al. (2009).
1. CONSTRUCTION OF TOOLS: STRAINS AND
SYNTHETIC FLOR MEDIA
The validation of specific genes obtained from a genetic study such as genome sequencing or QTL analysis requires representative strains easy to manipulate genetically, and a growth medium mimicking velum growth on wine to simulate the conditions of flor wines ageing. As some of these tools were not available at the beginning of my PhD thesis, we decided to expand the existing toolbox.
Microsatellite genotyping (Legras et al., 2007) as well RAD-tag sequencing (Cromie et al., 2013) have shown that most laboratory strains (S288c, By4741and By4742, W303, FL100 and FL200, Sigma1278, CENPK113.7D) share the same origin except SK1 and all these strains are not wine strains (http://wiki.yeastgenome.org/index.php/Strains). Along the years, different genetics studies have revealed that these lab strains share deficient alleles for different genes such as FLO8, leading to flocculation defects (Kobayashi et al., 1996),
HAP1 leading to have respiratory defects (Gaisne et al., 1999) or ABZ1 (Ambroset et al.,
2011) leading to poor fermentation performances. Sigma1278, a strain widely used for the study of filamentous growth, has a functional version of the FLO8 gene, but is still not a wine strain. RM11.1a, another haploid strains used in many genetics studies (Brem et al., 2002; Ehrenreich et al., 2010; Ronald & Akey, 2007), has been isolated from a Californian vineyard, but is also a strain with poor ability to ferment (Camarasa et al., 2011). An alternative could have been the use of strains that have been used classically in SPO lab (INRA Montpellier, France) such as V5 (Michnick et al., 1997), a meiotic spore of the industrial strain CIVC8130 (which is a variant of the popular commercial wine strain EC1118). V5 is a good fermenting strain but produces abnormal quantities of some metabolites of central carbon metabolism (Camarasa et al., 2011). More recently 59A, a spore of EC1118 has been chosen for validating the effect of allelic variation at different QTL detected in a cross between EC1118 and S288C (Ambroset et al., 2011). However these two strains, V5 and 59A, present one major disadvantage: as they are derivatives from EC1118 which results from a cross between a wine strain and a flor strain (see chapter 3), their properties cannot be connected to wine or flor genetic background.
For flor strain, the diploid strain 2D has been isolated from a spore of a Sardinian flor strain, and requires to be haploidized in order to simplify the replacement of different genes. However, it must be pointed out that this Mediterranean strain possess several genes which are recombined or deleted in comparison to Jura strains (such as FRE2-3) and this strain has a mutated version of ICR1 non coding RNA that Jura strains P3-D5 do not have
(see chapters 3 and 4). 2D is also an excellent velum grower, and produces a thick velum whereas P3-D5 produces a thin velum that is appreciated by Jura wine makers.
As a consequence we chose to develop a set of haploid strains from the strain that we have sequenced in order to obtain pure wine or flor laboratory strains that will be representative of the different types of strains that we are studying.
In a similar manner, the popular synthetic YNB medium is very easy to handle, but presents high quantities of vitamins that make it too distant from wine composition. As consequence we decided to develop a synthetic wine medium for velum growth to mimic flor wine ageing.
2.1 Materials and methods 2.1.1 Strains
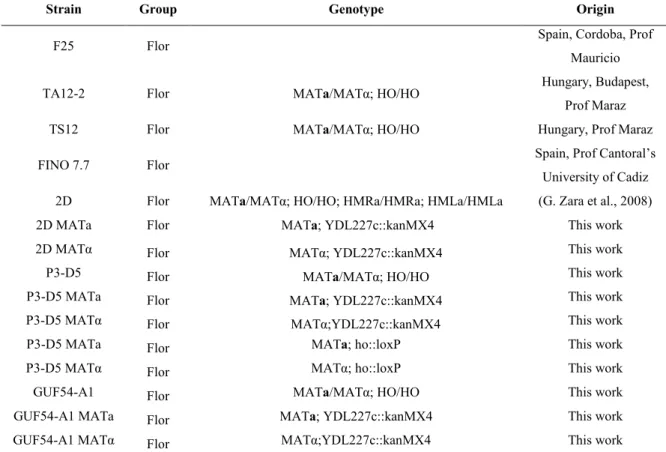
Strains used and obtained in this work are reported in table 1. One strain was obtained by Zara et al. (2010), 4 strains were obtained from INRA-UMR1083 SPO collection, 2 strains were obtained from Spain and 2 from Hungary, 16 strains were obtained in this work. Table 1: List of strains used and obtained
Strain Group Genotype Origin
F25 Flor Spain, Cordoba, Prof
Mauricio TA12-2 Flor MATa/MATα; HO/HO Hungary, Budapest,
Prof Maraz TS12 Flor MATa/MATα; HO/HO Hungary, Prof Maraz
FINO 7.7 Flor Spain, Prof Cantoral’s
University of Cadiz 2D Flor MATa/MATα; HO/HO; HMRa/HMRa; HMLa/HMLa (G. Zara et al., 2008) 2D MATa Flor MATa; YDL227c::kanMX4 This work 2D MATα Flor MATα; YDL227c::kanMX4 This work
P3-D5 Flor MATa/MATα; HO/HO This work
P3-D5 MATa Flor MATa; YDL227c::kanMX4 This work P3-D5 MATα Flor MATα;YDL227c::kanMX4 This work
P3-D5 MATa Flor MATa; ho::loxP This work
P3-D5 MATα Flor MATα; ho::loxP This work
GUF54-A1 Flor MATa/MATα; HO/HO This work
GUF54-A1 MATa Flor MATa; YDL227c::kanMX4 This work GUF54-A1 MATα Flor MATα;YDL227c::kanMX4 This work
GUF54-A1 MATa Flor MATa; ho::loxP This work GUF54-A1 MATα Flor MATα; ho::loxP This work K1 MATa Wine MATa;YDL227c::kanMX4 UMR SPO K1 MATα Wine MATα;YDL227c::kanMX4 UMR SPO
K1 MATa Wine MATa; ho::loxP This work
K1 MATα Wine MATα; ho::loxP This work
D47 MATa Wine MATa;YDL227c::kanMX4 UMR SPO D47 MATα Wine MATα;YDL227c::kanMX4 UMR SPO
D47 MATa Wine MATa; ho::loxP This work
D47 MATα Wine MATα; ho::loxP This work
2.1.2 Media and growth conditions
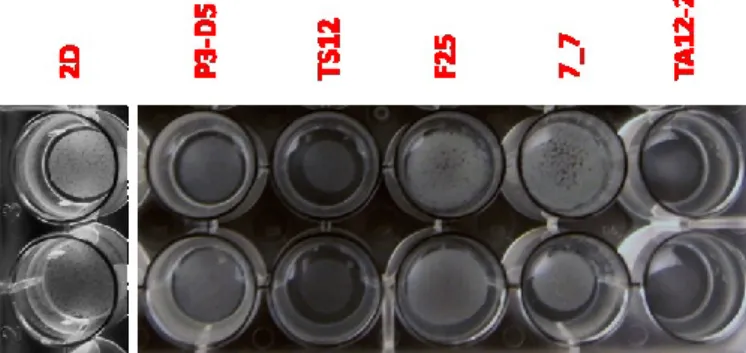
Strains were precultivated in YEPD (2% glucose, 1% yeast extract, 2% peptone) and, after 24 hours, inoculated (OD600 = 0.1) in an adaptation medium consisting of YEPD + 3% ethanol (v/v). After 16 hours yeast cells were centrifugated, washed twice to remove any residual sugar from YEPD, resuspended in synthetic flor medium (see table 2) and inoculated (OD600 = 0.1) in 50 ml flor medium in 250 ml Erlenmeyer flasks with foam cap. Yeasts were cultivated for 300 hours at 28°C and with 180 rpm agitation. To induce biofilm formation flor strains were precultivated in YEPD overnight, washed twice and resuspended in synthetic flor medium. Three replicates of 2 ml (107 cells/ml) of each cellular suspension were transferred in a 24-wells polystyrene plates (flat bottom, 353047, Becton-Dickinson Labware) and incubated in static conditions at 25°C for 4 days.
Table 2: Synthetic flor medium composition. Modified from refermentation medium (Maisonnave et al., 2013):
Compound Amount in 1000 ml Compound Amount in 1000 ml
Glycerol Ethanol 96% Malic acid NaOH solution Minerals: KH2PO4 K2SO4 MgSO4∙7H2O CaCl2∙2H2O NaCl FeCl3 ZnSO4∙7H2O CuSO4∙5H2O MnSO4∙4H2O 7 g 4% (v/v) 10 g to pH 3.4 100 mg 400 mg 300 mg 35 mg 25 mg 5 mg 1 mg 0.3 mg 2 mg Vitamins: Myoinositol Calcium pantothenate Thyamine hydro Nicotinic acid Pyridoxine Biotin Riboflavin Amino Acids: Proline Alanine Arginine GABA Glutamic acid Lysine Leucine 220 mg 0.14 µg 2.2 µg 0.44 µg 0.12 µg 0.6 µg 0.47 µg 800 mg 32.7 mg 29.8 mg 26.2 mg 24.3 mg 16.4 mg 15.7 mg
Asparagine Histidine
11.4 mg 7.6 mg
Media used to induce sporulation in strains deleted for HO gene were: presporulation medium (1% yeast extract, 0.5% peptone, 10% glucose) and sporulation medium (0.1% yeast extract, 0.05% glucose, 1% potassium acetate, 0.002% adenine).
2.1.3 Creation of haploid strains
Primers used to construct deletion cassette and to verify the deletion are reported in table 3. A 50 µl PCR reaction mix contained: 10 µl 5X KAPA GC Buffer, 0.3 mM KAPA dNTP Mix, 0.3 µM each primer (table 3), 25 ng pUG6 template DNA, 0.5 U KAPA HiFi HotStart DNA Polymerase (KAPAbiosystems). PCR conditions were: 95°C for 3 min, 98°C for 20 sec 60-75°C for 15 sec 72°C for 30 sec/Kb (30 cycles), 72°C for 2 min. The PCR product was used to transform the strains P3-D5 and GUF54-A1 using the protocol described by Güldener and colleagues (1996). Confirmation of HO deletion was performed by PCR: initial denaturation at 95°C for 3 min; 94°C for 30 sec, 55°C for 30 sec and 72°C for 30 sec/Kb (39 cycles); final extension at 72°C for 5 min. A 25 µl PCR reaction mix contained: 2.5 µl 10X Taq Buffer KCl, 0.2 mM each dNTP, 0.3 µM of each primer (table 3), 25 mM MgCl2, 1.20 U Taq DNA Polymerase (Fermentas). Positive transformants were then precultivated in 10 ml of presporulation medium (1% yeast extract, 0.5% peptone, 10% glucose) for 7 hours at 28°C and with 450 rpm agitation. Then, 200 µl of cultures were inoculated in 20 ml sporulation medium (0.1% yeast extract, 0.05% glucose, 1% potassium acetate, 0.002% adenine) and incubated for 2 weeks at RT with slight agitation. Asci were digested with a solution 5% of the enzyme Lyticase (from Arthrobacter luteus, crude. Sigma) for 8 min and spores were separated using a micromanipulator (MSM300 Singer Instrument). Spores bringing HO gene deletion were selected on YEPD plates containing 200 µg/ml geneticin G418. Mating type was assigned testing the formation of zygote with haploid references.
Wine haploid strains K1 and D47 were already obtained in the lab INRA-UMR1083 Sciences Pour l’Oenologie with the same method. Kanamycin cassette was removed using the Cre-lox P recombination system (Güldener et al., 1996). The protocol of transformation was the same used for gene deletion but for a Cre-lox P experiment 35 ng (12 µl) of the
plasmid pSH65 was used. Selection of transformants was performed on YEPD plates containing 150 µg/ml phleomycin. Excision of KanMX cassette was confirmed by replica-plate on YEPD and YEPD plus geneticin G418 (colonies that lost resistance were not able to grow on geneticin) and PCR. PCR conditions and reaction mix are described above, primers used were HOdelVerifFOR and REV (table 3).
Table 3: List of primers used
Primer Sequence Purpose
HOdelFOR HOdelREV HOdelVerifFOR HOdelVerifREV KanP1 KanP2 5' ATGCTTTCTGAAAACACGACTATTCTGATGGCT AACGGTGCTTCGTACGCTGCAGGTC 3’ 5’ TTAGCAGATGCGCGCACCTGCGTTGTTACCACA ACTCTTTAGTGGATCTGATATCACCTA 3’ 5’ TGTTGAAGCATGATGAAGCG 3’ 5’ TGAAACAAATCAGTGCCGGT 3’ 5’ GCTAAATGTACGGGCGAC 3’ 5’ TCGCCTCGACATCATCTG 3’
Obtaining of HO::KAN cassette from pUG6
Obtaining of HO::KAN cassette from pUG6
Confirming HO::KAN insertion and excision cassette
Confirming HO::KAN insertion and excision cassette
Confirming HO::KAN insertion cassette
Confirming HO::KAN insertion cassette
2.2 Results
2.2.1 Construction of haploid strains
We first deleted the HO gene of 3 flor strains, 2D, P3-D5 and GUF54-A1, with a loxP-KanMX-loxP disruption cassette, and obtained Δho haploid spores from tetrads dissection. We removed then the Kanamycin cassette with the help of a plasmid carrying the Cre-loxP recombinase under the control of a GAL1 promoter (Güldener et al. 1996) in order to be able to use the KanMX marker in further experiments. We obtained haploids of each sexual type MATa and MATα from the strains P3-D5 and GUF54-A1 (table 4). We were not successful to remove the Kanamycin cassette from the flor strain 2D, possibly as this strain is not able to metabolize maltose and galactose (Budroni et al., 2005), which are required to induce the Cre-loxP recombinase on that plasmid. Alternative assays on glycerol as carbon source were not successful as well. Comparison of the GAL4 gene sequence of flor strains revealed that flor strains had a frameshift in the ORF at position 1860 for most strains and 1797 for 2D leading into a premature stop codon in positions 627 and 617 respectively. This may explains the Gal- character of flor strains (Braulio