T E C H N I C A L N O T E
Open Access
Seforta, an integrated tool for detecting the
signature of selection in coding sequences
Salvatore Camiolo
*, Sara Melito, Giampiera Milia and Andrea Porceddu
Abstract
Background: The majority of amino acid residues are encoded by more than one codon, and a bias in the usage of such synonymous codons has been repeatedly demonstrated. One assumption is that this phenomenon has evolved to improve the efficiency of translation by reducing the time required for the recruitment of isoacceptors. The most abundant tRNA species are preferred at sites on the protein which are key for its functionality, a behavior which has been termed“translational accuracy”. Although observed in many species, as yet no public domain software has been made available for its quantification.
Findings: We present here Seforta (Selection for Translational Accuracy), a program designed to quantify translational accuracy. It searches for synonymous codon usage bias in both conserved and non-conserved regions of coding sequences and computes a cumulative odds ratio and a Z-score. The specification of a set of preferred codons is desirable, but the program can also generate these. Finally, a randomization protocol calculates the probability that preferred codon combinations could have arisen by chance.
Conclusions: Seforta is the first public domain program able to quantify translational accuracy. It comes with a simple graphical user interface and can be readily installed and adjusted to the user's requirements.
Keywords: Codon bias, Translation optimization, Translational accuracy Findings
In spite of the various mechanisms which have evolved to maintain mRNA translation accuracy, errors still arise at a rate of one every 103-104codons [1]. Between ten and 50% of random residue substitutions compromise protein function through their effect on the product's three dimensional structure [2]. Coding sequence com-position is expected to influence the rate of mistransla-tion errors [3,4]. Because multiple aminoacyl tRNAs compete with one another for loading at the ribosome acceptor sites, codons corresponding to the most abun-dant tRNAs (preferred codons) tend to be translated with the highest fidelity. In E.coli, it has been demon-strated that the frequency of amino acid residue errors at preferred codons is approximately ten fold lower than at other codons [5]. Missense errors are likely to induce their greatest deleterious effect when they occur in a region which is key for the protein's functionality. Thus preferred codons may be non-homogeneously distributed
due to a variety of evolutionary constraints affecting diffe-rent parts of the gene product. This phenomenon has been noted in a number of genomes and is referred to as “selec-tion for transla“selec-tional accuracy” [6]. Despite this, there is as yet no public domain software available to quantify trans-lational accuracy. Here we present such a program, which we have called Seforta (SElection FOR Translational Ac-curacy); it benefits from a simple graphical user interface, and is designed to uncover the signature of selection for accuracy together with the identification of an optimal codon set.
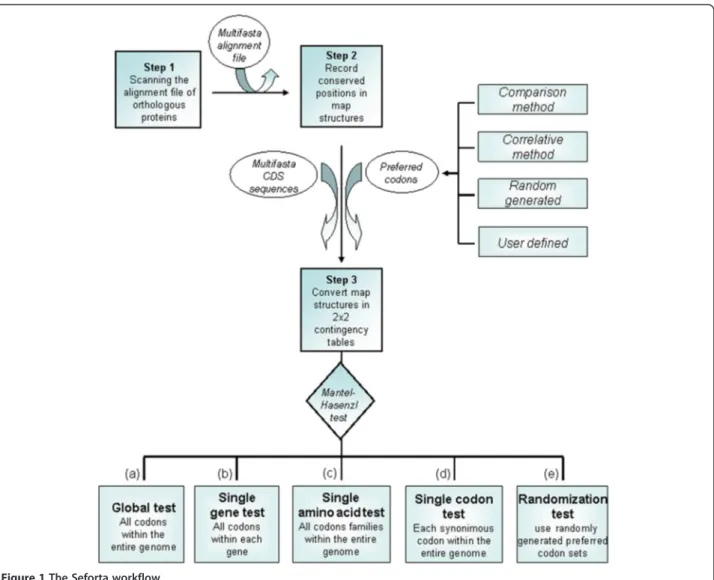
If natural selection biases codon usage to maximize translational accuracy, it is probable that preferred codons encode sites where a substitution would be dele-terious [3]. Due to their importance for protein func-tionality, such sites are expected to be evolutionarily constrained and hence their position within coding se-quences can be inferred by alignment between homologs [3]. Seforta analyzes whether the preferred codons are more frequent at these conserved sites by performing a test developed by H. Akashi [3]. The whole procedure is executed in three steps (Figure 1 and Additional file 1:
* Correspondence:[email protected]
Dipartimento di Agraria, Università degli Studi di Sassari, Sassari 07100, Italy
© 2014 Camiolo et al.; licensee BioMed Central Ltd. This is an Open Access article distributed under the terms of the Creative Commons Attribution License (http://creativecommons.org/licenses/by/2.0), which permits unrestricted use, distribution, and reproduction in any medium, provided the original work is properly credited. The Creative Commons Public Domain Dedication waiver (http://creativecommons.org/publicdomain/zero/1.0/) applies to the data made available in this article, unless otherwise stated.
Camioloet al. BMC Research Notes 2014, 7:240 http://www.biomedcentral.com/1756-0500/7/240
Figure S1). First, each alignment of homologous proteins is scanned for conserved and non-conserved residue po-sitions. Next, a set of independent 2x2 contingency ta-bles summarizing the frequency of preferred codons at both the conserved and non-conserved residue positions is constructed (Additional file 1: Figure S1). Finally, a joint probability (for each residue in each gene analysed) is calculated following the Mantel Hasenzl procedure [7] (see Figure 1, option a). Alternatively a joint probability can be calculated for each gene individually (option b). It is also possible to compute the odds ratio for each residue across the entire genome (option c). Seforta allows the odds ratio to be calculated for each codon by considering it as the preferred one within a synonymous family (option d). The program also implements a rou-tine which iteratively performs the Akashi test taking as input a randomly generated set of preferred codons (option e). In this way it becomes possible to identify the number and composition of the random sets of codons associated with a higher odd ratio than the chosen ones,
and then allows this information to be used for signifi-cance testing [4].
Two alternative methods for the identification of pre-ferred codons are available. The first is based on a com-parison of codon frequencies between genes which are strongly or weakly expressed, using a conventional 2x2 contingency table analysis. Seforta identifies the two ex-pression datasets to be compared by either selecting the two tails of the expression data distribution (based on a user-defined percentile value) or by dividing the dataset into a number of groups based on equal-sized intervals of expression level. When expression data are not
Figure 1 The Seforta workflow.
Table 1 Comparison between Seforta output and a published test of D. melanogaster sequence data [11]
Method Odds ratio P (better codon set)
Ref. [11] 1.362 2.72E-07
Seforta 1.362 6.60E-07
The size of the better codon set is reflected by a higher P value.
Camioloet al. BMC Research Notes 2014, 7:240 Page 2 of 3
available, the preferred codon lists can be identified via the correlation method proposed by Hershberg et al. [8,9]. This method identifies which codon(s) increase in frequency as genes become more biased in their codon usage. Seforta calculates the overall codon bias of a gene by using the effective number of codons (Nc’), which measures bias without any prior assumption regarding the identity of the preferred codons, while also control-ling for background nucleotide composition [10]. The identification of preferred codons relies on the size of the Spearman correlation, having adjusted the overall level of codon bias for background nucleotide compos-ition [8,9].
A test of Seforta on sequence data of Drosophila mela-nogaster [11] resulted in a perfect agreement with pub-lished statistics (Table 1). Of 6 million randomly chosen sets of preferred codons taken for the computation of the Akashi test, just four emerged with an association higher than the actual set of preferred codons, a result fully in line with the conclusions of Drummond and Wilke [11]. (Note that the latter authors performed the analysis using all possible codon sets, rather than using a randomization approach). Finally, we have used Seforta to calculate the signature of selection for translational accuracy for both each amino acid residue and each syn-onymous codon. The former analysis revealed different usage of preferred codons at selectively constrained sites for the analyzed amino acid residues (Additional file 2: Table S1). The single codon computation produced a positive and significant odds ratio for CGA, GGA, ACG and CGG, even though all these codons have been classified as non-preferred in D. melanogaster [11] (Additional file 2: Table S2). The synonymous codon test identified which residues in preferred co-dons are used most frequently at conserved sites, together with which codons appear to be under selec-tion for translaselec-tional accuracy. The analyses have sug-gested that fidelity and translation efficiency are not necessarily co-ordinated.
Availability and requirements
Project name: seforta (version 0.1)
Project home page: http://sourceforge.net/projects/ seforta/
Operating system: Linux 64-bit Programming language: C++, Java
Other requirements: xterm must be installed License: GNU GPL
Availability of supporting data
The software source code together with test files are available at the Project home page reported above.
Additional files
Additional file 1: Figure S1. The Seforta procedure. In step 1 the sequence alignment file is scanned and the sequences of conserved residues (C), variable sites (V) and gapped sites (G) are used to construct a 2x2 contingency table based on the usage of preferred/non-preferred codons (step 2). The 2x2 table is an example of a Leucine contingency table relative to the gene fragment highlighted in the box.
Additional file 2: Table S1. Amino acid under selection for accuracy in D. melanogaster. Table S2: Single codon test performed by Seforta on D. melanogaster. Codons that proved to be significantly over used in conserved sites are represented in bold. Codons that proved to be involved in the selection for translational accuracy while being“not preferred” according to previous studies are underlined.
Competing interests
The authors declare that they have no competing interests. Authors’ contributions
SC was involved in the design and realization of the software. SM and GM contributed to its testing and to correcting the algorithm. AP contributed to the conception of the project and participated in the drafting of the manuscript. All authors read and approved the final manuscript. Acknowledgments
We would like to thank the PhD program entitled“Scienze e biotecnologie dei Sistemi Agrari e Forestali e delle Produzioni alimentari” and the "Master and Back" program 2011 (RAS - Regione Autonoma della Sardegna) for financial support.
Received: 9 January 2014 Accepted: 11 April 2014 Published: 16 April 2014
References
1. Kramer EB, Farabaugh PJ: The frequency of translational misreading errors in E. coli is largely determined by tRNA competition. RNA 2007, 13:87–96. 2. Pakula AA, Sauer RT: Genetic analysis of protein stability and function.
Annu Rev Genet 1989, 23:289–310.
3. Akashi H: Synonymous codon usage in Drosophila melanogaster: natural selection and translational accuracy. Genetics 1994, 136:927–935. 4. Drummond DA, Wilke CO: The evolutionary consequences of erroneous
protein synthesis. Nat Rev Genet 2009, 10:715–724.
5. Precup J, Parker J: Missense misreading of asparagine codons as a function of codon identity and context. J Biol Chem 1987, 262:11351–11355. 6. Akashi H: Translational selection and yeast proteome evolution.
Genetics 2003, 164:1291–1303.
7. Mantel N, Haenszel W: Statistical aspects of the analysis of data from retrospective analysis of disease. JNCI 1959, 22:719.
8. Hershberg R, Petrov DA: Selection on codon bias. Annu Rev Genet 2008, 42:287–299.
9. Hershberg R, Petrov DA: General rules for optimal codon choice. PLoS Genet 2009, 5:e1000556.
10. Novembre JA: Accounting for background nucleotide composition when measuring codon usage bias. Mol Biol Evol 2002, 19:1390–1394. 11. Drummond DA, Wilke CO: Mistranslation-induced protein misfolding as a
dominant constraint on coding-sequence evolution. Cell 2008, 134:341–352. doi:10.1186/1756-0500-7-240
Cite this article as: Camiolo et al.: Seforta, an integrated tool for detecting the signature of selection in coding sequences. BMC Research Notes 2014 7:240.
Camioloet al. BMC Research Notes 2014, 7:240 Page 3 of 3