INEA 2012
italian agriculturE
an abridged version of the
annuario dEll’agricoltura italiana
Volume LXIV IT ALIAN A GRICUL TURE 2011 V OL UME LXIV
Volume non in vendita iSBn 97888-8145-245-3
ROME, INEA 2012
ItalIan agrIculturE
2010
an abridged version of the
annuarIo dEll’agrIcoltura ItalIana
Volume LXIV
Editor: Maria Carmela Macri
MEMbErsof Editorial CoMMitEE: Maria Carmela Macri, Gaetana Petriccione, Andrea
Povellato, Maria Rosaria Pupo D’Andrea, Roberta Sardone translatEdby: Vania Del borgo
sECrEtary: Lara Abbondanza, Debora Pagani, Francesca Ribacchi
dataproCEssing: Marco Amato, Fabio Iacobini
publishingCoordinator: Benedetto Venuto
publishingsECrEtary: Roberta Capretti
graphiCdEsignandlayout: J. Barone, P. Cesarini, F. Lapiana, S. Mannozzi
Italian Agriculture 2010 An abridged version of the
“Annuario dell’Agricoltura Italiana” Volume LXIV Roma, INEA, 2011
Table of Contents
Chapter I - The Italian Agro-food System
1.1 Agriculture and the international economic climate 7
1.2 Trends in Italian agriculture 8
1.3 International trade in the agro-food sector 10
1.4 Farm enterprises 12
1.5 Food industry 14
1.6 Economic organisation of producers 15
1.7 Distribution and consumption 18
Chapter 2 - Factors of Production in Agriculture
2.1 The land market 35
2.2 Investments, loans and risk management 37
2.3 Inputs 40
2.4 Employment 43
2.5 Knowledge systems in agriculture 46
Chapter 3 - Public Policy in agriculture
3.1 Community Policy: First Pillar 55
3.2 Community Policy: Second Pillar 57
3.3 National policy 59
3.4 Regional policies 61
3.5 Fiscal policy 63
3.6 The framework of responsibilities and consolidated
public support 65
Chapter 4 - Multifunctionality, Environment and Territory
4.1 Management of natural resources and sustainable agriculture 77
4.2 The diversification of agriculture 82
4.3 Quality and food safety 85
Chapter 5 - Production in agriculture, forestry and fishing
5.1 Cereals, industrial crops and forage 97
5.2 Fruit, flowers and vegetables 99
5.3 Grapes and olives 102
5.4 Animal husbandry 104
5.5 Milk and dairy products 106
5.6 Fish products 108
Foreword
This volume is an abbreviated version of the sixty-fourth edition of the Annu-ario dell’Agricoltura Italiana (Yearbook of Italian Agriculture), the annual publi-cation of the INEA, the Italian National Institute of Agricultural Economics.
The first edition of the Annuario was published in 1948. During more than half a century of life, the publication has benefited from the collaboration of experts drawn from professional, administrative and academic backgrounds, as well as that from numerous important public and private bodies operating in the food sector. It is recognised as a unique and authoritative source of information on all aspects of rural life in Italy.
Successive editions of the Annuario trace the history of the remarkable so-cial and economic changes that have taken place in Italy since the middle of the twentieth century: the relative decline of the agricultural sector from its prime position as a source of employment and household income, but, at the same time, the development of a flourishing agro-food sector, noted for the high quality of its final products as well as that of its technical equipment. In this transition, the rural sector has taken on specific new tasks: in particular, it has assumed a key role in protection of the environment, at the same time extending hospitality and infor-mation to a wider public, both Italian and foreign, who are now able to appreciate the cultural aspects of the rural environment and benefit from its salutary effects.
The form and content of the Annuario have been adapted over the years to take into account changing circumstances, with the intention of producing a “user friendly” volume.
This abbreviated English edition has now reached its twenty-third year. It re-places the summaries in English which followed each chapter in the Italian edi-tion prior to 1987, and includes translaedi-tions of key statistical tables.
The idea which inspired this publication was that of making available to a wider group of readers information on some of the key factors affecting the Ital-ian rural, agricultural and agro-food sectors – an objective which seems all the more relevant considering the size and importance of the EU agro-food sector and the increased attention to agricultural and environmental policies and trade in the international dialogue.
6 Italian Agricultural Yearbook Abridged version - 2010
The present volume is structured into five chapters, each of which summarises the principal contents of each of the five sections (28 chapters) in the Italian ver-sion. The statistical tables presented for each chapter have been selected from the more than 250 tables in the original version, giving priority to those documenting newly available information and events of particular interest in the year in ques-tion.
This English version of the Yearbook thus reflects the structure of the Italian version, which offers a broad and well-documented collection of data and facts dealing with production, employment, credit in agriculture and with public sup-port for the sector. In particular, the results are also presented of the two annual surveys, on the land market, and on the employment of both EU and non-EU im-migrant workers in agriculture. These are surveys which INEA traditionally car-ries out in the whole of Italy, through its regional branches. Themes regarding the agro-food system including, amongst others, food safety and quality agro-food products are also dealt with.
The Italian version is available through bookshops and is published by Edizio-ni Scientifiche Italiane.
********
INEA, the Italian Institute of Agricultural Economics, was established in 1928 and is a public body, an organ of the State, with autonomous administrative and legal status. The statutory task of the Institute is to undertake surveys and studies on the economic aspects of the rural environment, agriculture and forestry, with special reference to requirements for legislation, rural administration, farmers’ and workers’ organisations. Since 1965, it has acted as liaison organ of the Italian state to the EU Farm Accountancy Data Network. Sixteen Regional Offices and eighteen Farm Accountancy Offices are maintained and coordinated by the Head-quarters, which are located in Rome. The Library of the INEA is also situated in Rome, open to the public and also available for consultation on-line. It houses a collection of more than 28,000 volumes and 400 scientific journals, representing publications from most parts of the world.
Chapter 1
The Italian Agro-food System
1.1 Agriculture and the international economic climate
Worldwide production in 2010 registered growth of 5%, a strong recovery after the minimal 0.5% contraction posted in 2009. Performance, however, varied across the globe. Lower rates of growth were recorded in advanced economies (up 3%), with higher rates of growth in emerging economies (up 7.3%) such as China and India, which were the principal drivers of world growth with output up on average by 9.7%.
In 2010, the US economy registered growth of 2.9%, while European Union (UE-27) growth of 1.8% - a figure also recorded in the Eurozone – was low-er. Europe’s fastest-growing economy was Germany (up 3.6%). Lower rates of growth were recorded in France (up 1.5%), and in Italy and the United Kingdom (up 1.3%). Close to zero growth was registered in Spain, while Greece and Ire-land posted negative figures. Economic activity across the Eurozone was driven mainly by exports as internal demand provided only limited support. Consumer price inflation in this area during 2010 remained low (1.6%), although by the end of the year it had started rising again. Employment fell slightly in 2010 (down 0.5%), even though significant differences were registered among major nations.
As far as world agriculture was concerned, 2010 was characterised by an up-turn in agricultural product prices, which gathered pace during the second half of the year. This was predominantly due to a contraction of supply in the second half of the year, although this was, nevertheless, insufficient to offset globally low levels of inventory. Other causes were depreciation of the dollar, rising demand in emerging economies, oil price trends, and the increasingly large role played by investment funds on agricultural markets. Upward price pressure first emerged in the cereals sector before spreading to other sectors.
EU-27 increases in real income from agriculture in 2010 were a consequence of greater agricultural value of production in real terms (up 3.9%) and, to a more
8 Italian Agricultural Yearbook Abridged version - 2010
limited extent, of a rise in production costs (up 1.2%).
In 2010, 56.3 million hectares of crops were grown in the EU (down 3.8%), for total output of 277.2 million tonnes (down 5.8% compared with 2009). An estimated 11 million hectares of oilseed was planted in the EU, generating output of 28.3 million tonnes (down around 3%). Rice production amounted to 1.8 mil-lion tonnes, up on the figure recorded in 2009 following an increase in the amount of land cultivated and higher yields. Protein crops yielded output of 2.9 million tonnes.
In the fruit and vegetable sector, 2010 was a positive year in terms of prices, which rose significantly to return to levels seen previously in 2008. Unfavourable climatic conditions penalised output and contributed to these price rises. Olive oil output in 2010 was estimated at 2.1 million tonnes, up significantly compared with 2009.
The value of animal production in 2010 rose as a result of higher producer prices (up 1.2%) and volumes (up 0.8%)
Agricultural input costs posted a 1.2% increase in real terms, driven by a 1.3% rise in prices above all in “power and lubricants” and feed; purchasing volumes remained more or less unchanged (down 0.1%).
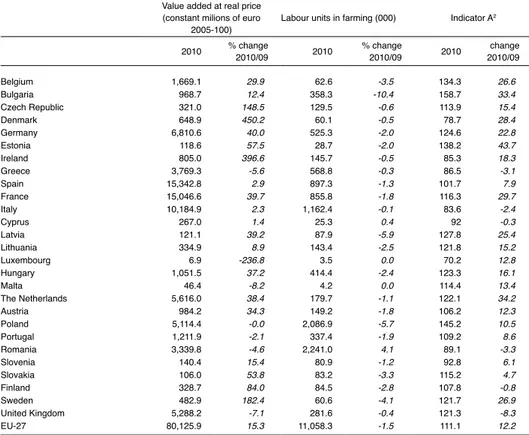
As a result of these trends, real agricultural income per labour unit, according to EUROSTAT’s Indicator A, rose in 2010 on average by 12.2% (table 1.1). The largest increases took place in Estonia (up 43.7%), the Netherlands (up 34.2%), Bulgaria (up 33.4%), France (up 29.7%), and Denmark (up 28.4%). On the con-trary, significant reductions were registered in the United Kingdom (down 8.3%), Romania (down 3.3%), Greece (down 3.1%) and Italy (down 2.4%).
1.2 Trends in Italian agriculture
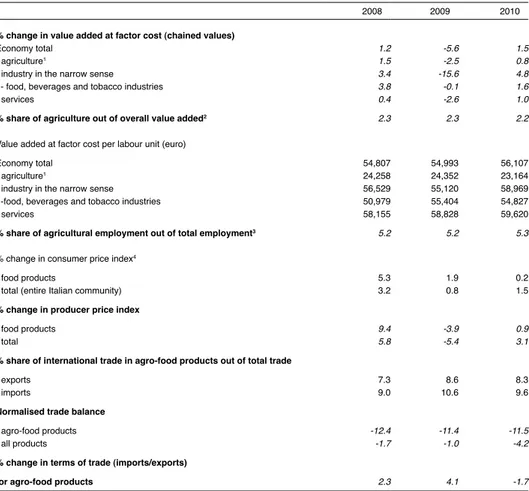
In 2010, the Italian economy achieved a recovery in economic activity, with GDP posting a modest rise of 1.5% in real terms. This came on the heels of a col-lapse registered in 2009 (down 5.6%, table 1.2). Exports were the main driver of this growth.
All sectors of production contributed to GDP growth, led by industry in the
narrow sense of the term, which posted the best performance in value added at factor cost (up 4.8%). The food industry achieved more modest growth of 1.6%.
Agriculture registered a value added at factor cost increase rate of 0.8%, which was insufficient to counter the drop registered in 2009. These trends meant that agriculture fell slightly as a proportion of GDP (2.2%), whereas the food industry maintained its value of around 1.8% of the economic system as a whole.
9
Capter. I - The Italian Agro-food System
economy as a whole. On the contrary, the food industry posted a slight decrease to 1.8%.
As a result of these two variables moving in opposite directions, value added per labour unit varied in different sectors of production. Industry in the narrow sense of the term registered the greatest increase (up 7% compared with 2009) to reach an average per capita level of €58,969; on the contrary, agriculture posted a significant drop in per-unit value added (down 4.9%) to just €23,164, an increase corresponding to 41.3% of the average level for the economy as a whole.
As far as price trends were concerned, in 2010 the inflation rate (the general consumer price index) started to rise again, albeit at a moderate pace (up 1.5%, compared with a rise of 0.8% in 2009). On the contrary, consumer prices for food products posted a significant slowdown in growth rates to 0.2%, compared with 1.9% in 2009. In 2010, agriculture resumed its traditional role as a brake on inflation. At production price level, in 2010 the food products index registered an increase of 0.9%, far lower than the general index (which was up 3.1%).
The value of production of agriculture, forestry and fishing amounted to €48,855 million at current prices. The 2% rise recorded in 2010 was sufficient, however, to recover only a small portion of the dismal 2009 performance.
Agricultural production in the narrow sense of the term rose 1.7% to a total of €46,130 million at current prices; in real terms, however, this essentially cor-responded to no change at all. The rate of positive change varied from place to place: the highest rates of growth took place in Italy’s northern areas (1.7% in the North West, 3.2% in the North East); increases were more limited in the South and Islands (up 1%); and there was close to no change in the Centre (up 0.4%, see table 1.3).
Moving on to examine the main sectors of production, in crops a particularly positive performances were posted by cereals (up 11.3%), pulses (up 15.1%), industrial crops (up 4.4%) and forage crops (up 3.6%), as well as olive-growing products (up 10.3%) and fruit (up 7.2%), all of which were predominantly ascrib- able to price increases. However, in real terms, trends were prevalently down-wards or unchanged.
On the contrary, livestock farming output fell slightly compared with 2009 (down 0.4% at current prices), predominantly as a result of a modest contraction in prices. Varying performances were posted across the sector. Significant growth was achieved in the marginal sector of honey (up 26.3%), while meat underwent a reduction and milk remained essentially unchanged.
Agriculture-related services also registered an increase (up 2.4%), as did an-cillary activities (up 5%), which accounted for a slightly greater proportion of the agricultural sector than in 2009 (table 1.4). By region, in terms of production originated by agriculture-related services, Lombardy, Veneto, Emilia-Romagna,
10 Italian Agricultural Yearbook Abridged version - 2010
Puglia and Sicily together continued to account for around 50% of Italy’s national total; just three regions (Lombardy, Trentino-Alto Adige and Tuscany) accounted for around 45% of output generated by ancillary activities (table 1.5).
Turning now to trends in prices and trade in agriculture, it should be noted that in 2010 prices of both agricultural products and inputs registered an upward trend (figure 1.1). Specifically, the prices of agricultural products accelerated in the general index, especially in the second half of the year, to generate an average increase of 1.5%. The price of vegetables rose 3.1% compared with the preceding year, predominantly as a result of rises in the prices of cereals (up 7.7%), for-age crops (up 12.4%) and potatoes (up 13.4%). On the contrary, animal product prices registered a slight contraction (down 1%) compared with 2009. With the exception of ovine and caprine products, this may be ascribed to a general reduc-tion that applied to all types of meat.
Prices of inputs registered a 2.9% increase compared with 2009. This rise was driven predominantly by the prices of goods from outside Italy, such as “power and lubricants”, and feed, which registered the highest increases of all (6.6% and 6%, respectively).
A comparison between trends in agricultural product and intermediate input prices in 2010 reveals a further deterioration in terms of trade for Italian agricul-ture, continuing a trend that has characterised the primary sector for a number of years now.
The higher rate of growth of inputs in 2010 compared with production caused a slight decrease in value added by agriculture, forestry and fishing, which reached €26,370 million at current prices (a rise of 1.9% compared with 2009). In real terms, the increase in value added was more modest still (up 1%). Across Italy, all areas posted positive changes, with the North East registering the best performance and outstripping the national average (up 3.7% at current prices). 1.3 International trade in the agro-food sector
In 2010, Italy’s degree of openness, calculated as the ratio between trade vol-ume and domestic output, reached a level of 43%, a rise of some four percentage points compared with 2009, following an appreciable rise in both imports and exports. Imports and exports both increased by more than four percentage points over the year, returning to growth after the setback registered in 2009. The degree of commercial coverage, that is to say the ratio between exports and imports, fell slightly over the last year.
Trends on Italy’s domestic market were particularly weak, especially on the supply side: domestic production remained more or less pegged to 2009 levels
11
Capter. I - The Italian Agro-food System
(up 0.4%), while domestic consumption growth came in only slightly stronger (up 1.4%). Italy’s degree of self-sufficiency, that is to say the ratio between pro-duction and consumption, amounted to roughly 91%, down slightly on the pre-ceding year.
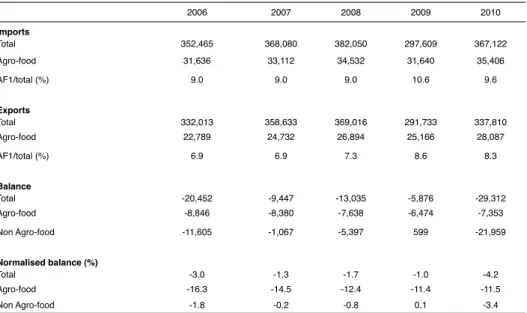
Italy’s trade balance worsened further in 2010 to reach -€29,312 million, the lowest figure registered in recent years (table 1.6). The strong rise of the value of imports (up 23.4%), ascribable above all to an increase in purchases of energy-related products, outstripped the 15.8% increase in exports.
In 2010, the Italian agro-food industry also recorded a reduction in balance, albeit less pronounced. Growth in imports of 11.9% slightly outperformed growth in exports (up 11.5%). In terms of origin and destination, the majority of Italy’s exports (about 84%) consisted of consumer products, of which 69% were pro-duced by the food industry. Consumer goods also accounted for a significant proportion of imports (around 52%).
In 2010, exports of consumer products increased significantly. However, agricultural products far outperformed processed products (22.5% compared with 10%).
Foreign sales of raw materials destined for the food industry more than dou-bled. As far as imports were concerned, significant increases were registered in foreign purchases of products destined for non-food use, both in the primary and food industry sectors (up around 30% in both cases).
Examining trade by sub-sector (table 1.7), it may be seen that in 2010 the re-covery was particular strong for agricultural products (imports up 14.3%, exports up 21.3%), but less so for food industry and drinks products (imports up 12.5%, exports up 10.9%). Within the primary sector, imports were down for citrus and other fresh fruit as a result of a collapse in volumes purchased. On the contrary, volumes increased for other imported products, specifically products related to forestry, oilseed and fruit, cocoa, coffee, tea and spices. On the export side, ex-ceptional results were recorded by fresh fruit and vegetables in 2010 following years of gradual decline: a 30% rise for pulses and fresh vegetables, a 35% rise for citrus, and an 18.9% rise for other fresh fruit. Moreover, a particularly large increase was recorded in the foreign sales of Italian cereals (up 68%), which was wholly attributable to an increase in the volume of exports.
As regards industrial food products and drink, significant rises in imports were posted in oils and fats (up 19%), cereal derivatives (up 12%), and dairy products (up 21.8%). On the export side, major increases were posted in 2010 for net ex-port sub-sectors such as processed fruit (up 14.9%), dairy products (up 21.1%), oils and fats (up 15.4%), fresh and frozen meat (up 20.1%), and sugar and sweet confectionery (up 12.6%).
12 Italian Agricultural Yearbook Abridged version - 2010
Looking at trade by geographical area, in 2010 the increase in agro-food ex-ports was particularly significant to certain specific areas outside the EU, such as North America (up 13.6%), other European nations (up 14.6%), Asian countries (up 19.8%), candidate countries (up 15.3%), and third-party Mediterranean coun-tries (up 20.3%). As far as imports were concerned, the largest increases occurred
with regard to a number of areas outside the EU,in particular Asian nations (up
20.9%), and EEA countries(up 26.3%); far more modest growth was posted for
imports from outside the EU(South America up 4.6%).
1.4 Farm enterprises
The Italian statistical agency undertook its Sixth Agricultural Census in 2010. In a break from the past, ISTAT boosted its pre-census list of farms by incorporat-ing information from a number of administrative archives. As is customary, the basic unit of measurement used in the survey was the individual farm/livestock enterprise. Companies exclusively involved in forestry were not included in the census.
One important new development concerned the field of observation, which was standardised under EC Regulation 1166/2008, and therefore differs from the
field used in previous surveys to define the reference size threshold. ISTAT
conse-quently reprocessed its data from 2000 to comply with the new definition to make it possible to undertake comparisons over time.
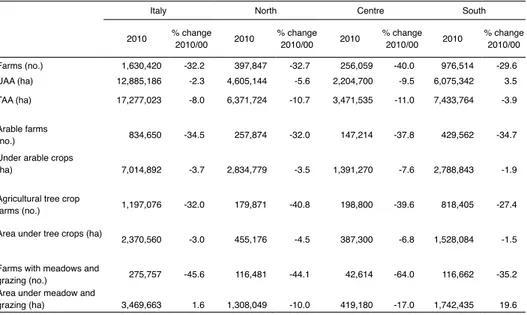
As at 24 October 2010, Italy had 1,630,420 farms operating on a Total
Agri-cultural Area (TAA)exceeding 17.2 million hectares, and a Utilized Agricultural
Area (UAA)of 12.8 million hectares (table 1.8). Census data confirmed the trend
of larger average farm sizes, following a significant reduction in the number of farms (down 32.2% compared with 2000) and a more limited decrease in UAA
(down 2.3%). Average UAAincreased from 5.5 hectares in 2000 to 7.9 hectares
in 2010. The largest decrease in the number of farms (down 40%) and UAA (down 9.5%) occurred in central Italy; in southern Italy, although the number
of farms fell by almost 30%, UAAincreased by 3.5%. In actual fact, this figure,
which is explained by a greater area of meadow and pastureland, may in all likeli-hood be ascribed more to the inclusion of commonly-owned land, which was not always included in all regions in 2000, than to an actual increase in this type of agricultural land.
The process of transferring land to active farms predominantly concerned uti-lized agricultural area, and only marginally unused land or woodland. Indeed,
TAAfell by 8% over the decade under consideration, which was considerably
13
Capter. I - The Italian Agro-food System
According to the 2010 Census, land use remained essentially unchanged com-pared with the preceding decade. The 12,885,186 hectares of agricultural land (table 1.8) was used predominantly for arable crops (54%), followed by meadow and pastureland (27%), and then permanent crops (18%). Arable land is present on more than 834,000 farms (51% of the total), down 35% compared with 2000. A total of 1,197,076 farms grew agricultural tree crops (73% of the total) on 2,370,560 hectares. The number of agricultural tree farms compared with 2000 fell by 32% nationwide, while the area farmed decreased by 3%.
A total of 3,469,663 hectares was permanent meadow and grazing land, up just 1.6% compared with 2000. These results require further investigation as a result of changes to how common land is assessed in a number of regions in the South between 2000 and 2010.
The 2010 Census registered 209,996 farms with livestock, predominantly in the North (44% of the total) and South (39%). The significance of livestock farm-ing in the North is borne out by the fact that 23% of farms in this part of the country raise livestock, compared with 14% of the total in Central Italy and less than 9% of farms in the South. As with arable farms, the trend for livestock farms was towards a gradual concentration of production among an ever-more-limited number of farms.
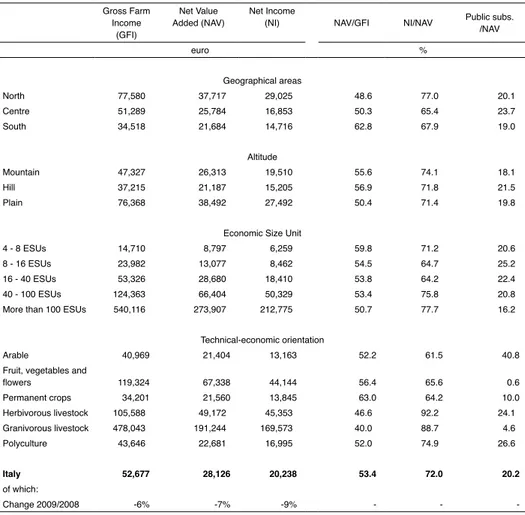
Moving on to examine output and agricultural income, for 2009 the FADN survey estimated average Gross Farm Income (GFI) of Italian farms at a little over €52,000, with Net Value Added (NAV) at around €28,000, corresponding to 53% of GFI. Net income (NI) reached an average value of just under €20,000 (table 1.9).
The value of GFIexceeded the national average for farms located in northern
regions and on plains, which have the highest concentration of farms and the most solid production facilities. At livestock farms, the trend was for costs incurred in the purchase of raw materials, especially feedstuffs and forage, and amortization/ depreciation to be higher than average; at fruit and vegetable and tree crop farms, where the use of casual labour is prevalent, costs for waged labour and rent were a significant factor.
On average, public subsidies had a 20% impact on farm earnings (NAV), and were particularly vital for farms specializing in arable crops (41%). Public sup-port has less than average impact at high-earning farms (16% at farms of more than 100 ESUs), making them less dependent on public farm grants for the same
NAVproduced.
On higher altitude land, there continues to be a substantial difference in aver-age impact: mountain farms receive a lower degree of support from public sub-sidies than hill or plain farms, notwithstanding ongoing signs of difficulty and a trend in marginal areas for people to quit farming altogether.
14 Italian Agricultural Yearbook Abridged version - 2010
As regards factor productivity, average productivity per hectare of cultivated land in 2009 amounted to around €3,225. As in previous years, farms in the North and on plains performed better than the national average in terms of higher levels of production intensity and profitability.
The economic efficiency of labour factors (NAV/LU) – for which the national average corresponds to €23,500 – presented great variability depending on farm location and type. As in previous years, farms in the North achieved far higher than average labour productivity.
Production efficiency and labour profitability were directly related to the eco-nomic size of farms. The results for 2009 confirm the difference in circumstances between farms in the mountains and on the plains. Indeed, farms on the plains generated added value per labour unit that was far higher than the national aver-age (close to €30,000/TLU), whereas mountain farms posted profitability per worker that was closer to the national average (a little under €21,000/TLU). 1.5 Food industry
For Italy’s food industry, 2010 was characterized by a reasonably positive trend in earnings, after a rise in turnover which followed on from the setback recorded in 2009. According to Federalimentare estimates, turnover rose 3.3% compared with the previous year to reach €124 billion at current values. This
performance was borne out by data from ISTATon the industry’s turnover index,
which in 2010 posted an increase of 2.3% (figure A.2). Exports were key to this increase, posting 10.6% growth in 2010 in the wake of a fall in 2009.
Positive turnover performance was also posted by the ISTAT Index of
In-dustrial Productionfor the food, drink and tobacco industry, which was up 2.3%
(table 1.10). Most sub-sectors posted a rise in production. The only sub-sectors in which the index fell were fruit and vegetable processing (down 0.9%), pasta (down 0.7%), sauces (down 5.1%) and mineral water/soft drinks (down 2.6%).
In 2010, the value added by the food industry came in a little lower than the primary sector, amounting to €24.8 billion at current prices, down 3.5% com-pared with 2009. In real terms, the change returned to positive territory with a 1.6% rise.
In terms of occupation, the food, drinks and tobacco industry shed 3.4% of its workforce to 441,000.
Structurally, according to Infocamere-Movimprese data the Italian food in- dustry consisted of 67,898 registered firms (down 0.4%), of which 59,730 enter-prises were actually active (down 0.2%). Food-producing firms predominated, accounting for 94.5% of the industry.
15
Capter. I - The Italian Agro-food System
The most common legal forms for food companies in 2010 were sole propri-etorships (accounting for 46.9% of the total), followed by partnerships (30.6%) and joint stock companies (19.2%). Drinks industry companies tend to be joint-stock firms, which accounted for 44.7% of the total.
Enterprises classified as “crafts-based” accounted for a considerable propor-tion of Italian food companies: 39,819 of which 39,436 were active.
These firms accounted for as much as 68.5% of total food production. As far as legal form is concerned, 60.6% of total crafts-based companies were sole proprietorships.
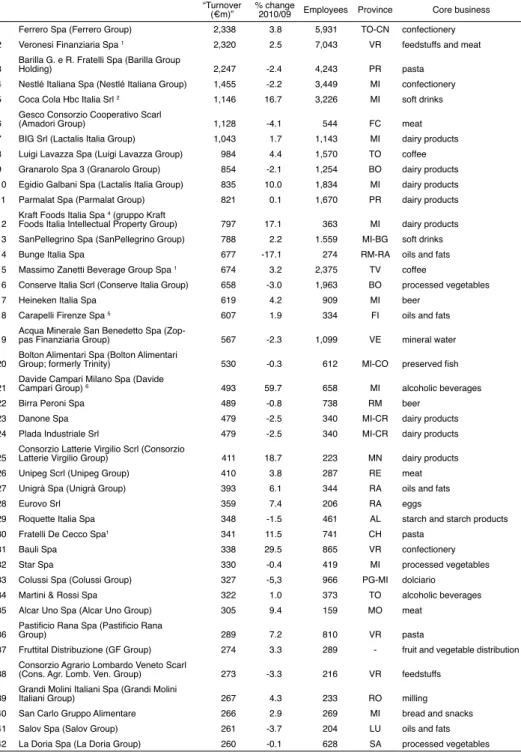
One of the largest food industry groups at European level, Nestlé, maintained its top position in 2010 with turnover of €25.1 billion, and the equivalent of 91,000 employees. Europe’s number two and three groups were, respectively, the Anglo-Dutch Unilever Group (€12 billion) and the Dutch Heineken Group (€11 billion).
Just two Italian food industry groups ranked in Europe’s top 20: Ferrero, Ita-ly’s largest group with turnover of €6.3 billion, in eighth position, and Barilla, in
15th position, with turnover of €4.1 billion.
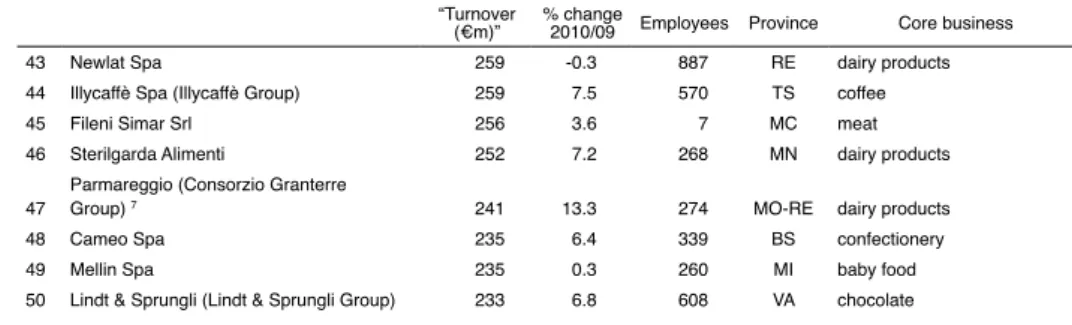
Of Italy’s top 50 food groups, 64% reported a growth in turnover in 2010, con-firming the recovery currently taking place in Italy’s food industry (table 1.11). 1.6 Economic organisation of producers
A survey undertaken by the National Observatory on Agricultural
Coopera-tion1 covering the two-year period 2008-2009 showed that the role of
cooperative-based producers had consolidated to represent 36% of agricultural production and 24% of Italy’s food industry turnover. The sector is characterized by strong links to local areas, and is mutualistic in nature. Italian agro-food cooperation is one of Europe’s leaders in terms of member raw material input. Despite this, the sector faces a number of critical issues, notably the reduced average size of firms, and an ongoing major growth gap between cooperatives in northern Italy, which are responsible for generating almost 80% of national turnover, and cooperatives in the country’s south.
An analysis of the Italian Agro-food cooperative system reveals that the four central representative bodies (FedagriConfcooperative, Legacoop Agroalimen-tare, ASCAT-UNCI and AGCI-Agrital) recorded an increase in the number of
1 The National Observatory on Agricultural Cooperation was established at the Ministry for
Agricultural, Food and Forestry Policies under Law no. 231 of 2005, and is supported by agro-food cooperative representation organisations.
16 Italian Agricultural Yearbook Abridged version - 2010
cooperatives (around 6,200 in 2010) and turnover (€37.4 billion in 2010), while also experiencing a further reduction in overall membership, which now stands at around 900,000 (table 1.12). These trends resulted in a rise in average turnover per cooperative in 2010 to €5.8 million.
In January 2011, central representative bodies Fedagri-Confcooperative, Leg-acoop Agroalimentare and AGCI-Agrital established the Alliance of Italian Co-operatives to coordinate cooperative representation to government, parliament, European institutions and the social partners.
As far as Producer Organisations (OPs) were concerned, as at 31 December 2010 a total of 163 non-fruit and vegetable producers were registered on the MIPAAF 163 OP Registry. With 22 new POs recognised (as well as recognition being withdrawn from 2 olive-sector POs) the upwards trend for this type of organisation continued in 2010. The olive sector benefits from the greatest repre-sentation, with 35 POs recognised, most of which operate in Puglia and Calabria. For the second year running, the tobacco sector saw the greatest growth, with 13 new POs gaining recognition in 2010.
There were also major developments in the field of agro-energy associations in 2010, following the establishment of the “Verde Energia” [Green Energy] PO, the second organization in Italy to obtain recognition in the agro-energy sector pursuant to article 2, Legislative Decree no. 102/05.
In geographical terms, following a rise in the number of tobacco POs Campa-nia is now Italy’s fourth-largest region in terms of non-fruit and vegetable POs, behind Calabria (20), Emilia-Romagna (20) and Puglia which, with 26 POs is the Italian region with the highest number of such organisations.
In the fruit and vegetable sector, regulated under (EC) 1234/2007 for Com-mon Market Organisation, as at 30 June 2011, 291 organisations were recognised, of which 274 were Producers’ Organisations (POs), 13 were Associations of Pro-ducers’ Organisations (AOPs), and the remaining four had been recognised as Producers’ Groups (GPs) prior to 2008.
Moving on to contractual tools, 2010 saw an intensification of contract-related activities in the various sectors of production.
In the dairy industry, after long negotiations a six-month inter-professional agreement was signed in the Lombardy region to set the farmgate price of raw milk at 33.156 eurocents. Another significant agreement was signed in the Lazio region, after regional government mediation, establishing the farmgate price for milk at 38 eurocents per litre. Further locally significant agreements were reached in the regions of Tuscany, Puglia and Piedmont.
In the cereals sub-sector, agreements and supply-chain contract renewals were undertaken in 2010 for landmark agreements (the “High quality durum wheat in Emilia-Romagna” framework agreement, and the SIGRAD and Granaio italiano
17
Capter. I - The Italian Agro-food System
supply-chain agreements), alongside the start-up of two new ventures for the wheat supply chain, and conclusion of a major three-year framework agreement for the rice supply chain. New developments included the signature of a two-year regulatory contract between Filiera Italiana Trading Seminativi (FITS)2 and Barilla for the provision of DOC registered-origin durum wheat; and, under the auspices of the 2007-2013 Marches Region RDP, the start-up of a supply-chain project oriented towards the signature of an agreement between Fedagri-Conf-cooperative, Legacoop Agroalimentare, a number of cereals brokers and Barilla. In the fruit and vegetable sector, the main contract-related events that occurred in 2010 were the renewal of sector agreements where they have traditionally been in place, such as tomatoes for industrial use and potatoes (industrial process-ing and fresh consumption), in addition to the signature of an inter-professional agreement for the peach and nectarine supply chain.
Contractual activities in the tomato for industrial use sector initiated with an update to the three-year 2008-2010 inter-professional agreement, which set a 2010 target ceiling of 68-70,000 hectares of cultivated land, and 46-48 million quintals of product delivered. As part of this process the framework contract for the northern Italy production area was renewed and a base reference price was set at €70 per tonne (-12% compared with 2009). This was followed by completion of an area agreement for Central and Southern Italy (€70 per tonne for round tomatoes and €80 per tonne for elongated varieties). In the peach and nectarine subsector, the inter-professional agreement for the 2010 season set a number of rules for releasing fresh product onto the market, targeting certain product cat-egories and sizes. In the fresh consumption potato subsector, with the patronage of the Emilia-Romagna regional administration a three-year regional framework contract was renewed for the sale of around 100,000 tonnes of product at a price to be set by the Bologna Potato Exchange. The inter-professional agreement for potatoes earmarked for processing entered its third year, and in 2010 confirmed its target to process 170,000 tonnes.
In the olive-growing and oils sub-sector, in addition to an update to the UNAPROL-Consorzio olivicolo italiano supply chain contract, in 2010 the first inter-professional agreement for this supply chain was signed by a majority of sector players.
For the beet/sugar subsector, during 2010 beet associations and sugar compa-nies (Eridania Sadam, COPROB-Italia Zuccheri and Zuccherificio del Molise) signed an inte-rprofessional agreement setting terms of payment for beet over the next four seasons, from 2010/11 to 2013/14, the last year that the current
18 Italian Agricultural Yearbook Abridged version - 2010
COM applies. Moreover, in implementation of Agro-energy projects (in addi-tion to, as opposed to as an alternative to the main producaddi-tion of sugar beet), ground-breaking inter-professional agreements were signed in 2010 that envisage incorporating a minimum payment as part of the base price to reflect the energy value of pulp.
In the Agro-energy subsector, three multi-year framework contracts were signed in 2010 by farm producers and electricity generators, in addition to the COAGR.ENERGY supply chain contract.
Moving on to joint-trade associations, Italy has very few inter-professional organisations within its domestic agro-food system. The first (and thus far only) such body to have gained recognition in Italy through an ad hoc ministerial de-cree is “Ortofrutta Italia”, which was established in the fruit and vegetable sector in 2004. In the cereals subsector, one major inter-professional venture is being run by SIGRAD, a consortium with an inter-professional mission established in 2004, whose members include some of Italy’s largest industrial and farm produc-tion enterprises, in addition to a seed research and production firm. In the beef subsector, Italy’s IntercarnePro beef joint-trade association was founded in 2009 to boost cattle farming, drawing inspiration from the French Interbev model. An inter-professional organisation for olive oil was also recently set up in order to create more effective vertical integration between all of the stakeholders in the supply chain.
One new tool introduced under recent Italian legislation (Law no. 33/2009, as amended under Law no. 122/2010) is the network contract, the main function of which is to set rules for firms to maintain their own independence while develop-ing joint industry projects oriented towards enhancwhich is to set rules for firms to maintain their own independence while develop-ing their ability to innovate and compete. In addition to offering opportunities for growth, this approach also ensures access to loans.
1.7 Distribution and consumption
In 2010, trade retail sales of food products underwent an overall reduction. While modern distribution channels posted positive sales performance (up 0.4%), smaller retail outlets continued to perform negatively (down 1.4%). The number of specialist stores also staged a recovery, although the number of specialist meat and meat-based products sales outlets suffered a 0.9% setback.
In recent years, farmers’ markets have achieved considerable growth.
In the modern retail sector, according to the annual Nielsen survey, 2010 saw a consolidation of growth trends in terms of sales outlet floorspace, particularly in the discount store subsector (up 6.6% compared with 2009). Only mini-markets
19
Capter. I - The Italian Agro-food System
continued to perform negatively.
The retail distribution system in Italy is rather highly concentrated: the five largest groups account for fully 60% of the nation’s supermarkets and hyper-markets (table 1.13). In 2010, Conad was Italy’s largest group, with 2,813 sales outlets (up 1.8% compared with 2009). However, the Coop registered the highest number of sales, amounting to €12.9 billion (up 1.1% compared with 2009).
In addition to stimulating demand, the main strategies employed by modern retailers were the ongoing development of own-brand products, which registered growth corresponding to 6.5% compared with 2009.
Moving on to food consumption, Italian household spending resumed growth (up 2.4%) in 2010. Increases were registered right across the board, led by educa-tion, leisure and culture, clothing and footwear. Food spending, however, regis-tered a more limited increase (0.4%); it should be noted that this figure includes higher levels of growth in spending on fish (up 4.1%) and bread and cereals (up 1.3%), as a result of increases both in the quantity consumed and prices (table 1.14). Other products (milk, cheese and eggs, sweet confectionery and coffee, tea and cocoa) registered more modest growth in terms of spending, whereas other categories, particularly oils and fats and vegetable products, posted a decrease in spending.
Moving on to examine household spending by food type, ISTAT datarevealed
a fall in the quantity consumed of oils and fats (down 16.1%), fish products (down 7.3%) and dairy (down 4.9%). Spending on bread and cereals, vegetable and meat all remained substantially stable. For meat products there was a shift away from red meat towards chicken: in 2010 beef consumption dropped in quantity by 4.6%, while the consumption of chicken rose by 2.7%. In cereal derivatives, there was a reduction in the consumption of bread (around 3%), offset by growth in substitute products (crackers, pre-packaged loaves, bread sticks, etc.).
An upwards trend was also registered in 2010 towards the purchase of prod-ucts with a higher level of service incorporated, such as the consumption of ready-prepared vegetables and organic produce, alongside a lesser rate of growth in the consumption of typical local and PDO-PGI products. There has also been a constant rise in so-called “functional foods”; in recent years the focus on innova-tion has been greatest in dairy products.
20 Italian Agricultural Yearbook Abridged version - 2010
Table 1.1 – Net real value added1 from farming to base prices, labour units and the real farm
income indexper labour unit in the EU-27
(net value added at factor cost per labour unit in agriculture)
Value added at real price (constant milions of euro
2005-100) Labour units in farming (000) Indicator A
2
2010 % change2010/09 2010 % change2010/09 2010 2010/09change
Belgium 1,669.1 29.9 62.6 -3.5 134.3 26.6 Bulgaria 968.7 12.4 358.3 -10.4 158.7 33.4 Czech Republic 321.0 148.5 129.5 -0.6 113.9 15.4 Denmark 648.9 450.2 60.1 -0.5 78.7 28.4 Germany 6,810.6 40.0 525.3 -2.0 124.6 22.8 Estonia 118.6 57.5 28.7 -2.0 138.2 43.7 Ireland 805.0 396.6 145.7 -0.5 85.3 18.3 Greece 3,769.3 -5.6 568.8 -0.3 86.5 -3.1 Spain 15,342.8 2.9 897.3 -1.3 101.7 7.9 France 15,046.6 39.7 855.8 -1.8 116.3 29.7 Italy 10,184.9 2.3 1,162.4 -0.1 83.6 -2.4 Cyprus 267.0 1.4 25.3 0.4 92 -0.3 Latvia 121.1 39.2 87.9 -5.9 127.8 25.4 Lithuania 334.9 8.9 143.4 -2.5 121.8 15.2 Luxembourg 6.9 -236.8 3.5 0.0 70.2 12.8 Hungary 1,051.5 37.2 414.4 -2.4 123.3 16.1 Malta 46.4 -8.2 4.2 0.0 114.4 13.4 The Netherlands 5,616.0 38.4 179.7 -1.1 122.1 34.2 Austria 984.2 34.3 149.2 -1.8 106.2 12.3 Poland 5,114.4 -0.0 2,086.9 -5.7 145.2 10.5 Portugal 1,211.9 -2.1 337.4 -1.9 109.2 8.6 Romania 3,339.8 -4.6 2,241.0 4.1 89.1 -3.3 Slovenia 140.4 15.4 80.9 -1.2 92.8 6.1 Slovakia 106.0 53.8 83.2 -3.3 115.2 4.7 Finland 328.7 84.0 84.5 -2.8 107.8 -0.8 Sweden 482.9 182.4 60.6 -4.1 121.7 26.9 United Kingdom 5,288.2 -7.1 281.6 -0.4 121.3 -8.3 EU-27 80,125.9 15.3 11,058.3 -1.5 111.1 12.2
1 Net valued added is calculated as the difference between the value of production - (inputs + amortization/
depreciation).
2 2005 = 100.
21
Capter. I - The Italian Agro-food System
Table 1.2 – Agriculture in the Italian economy
2008 2009 2010
% change in value added at factor cost (chained values)
Economy total 1.2 -5.6 1.5
- agriculture1 1.5 -2.5 0.8
- industry in the narrow sense 3.4 -15.6 4.8
- food, beverages and tobacco industries 3.8 -0.1 1.6
- services 0.4 -2.6 1.0
% share of agriculture out of overall value added2 2.3 2.3 2.2
Value added at factor cost per labour unit (euro)
Economy total 54,807 54,993 56,107
- agriculture1 24,258 24,352 23,164
- industry in the narrow sense 56,529 55,120 58,969
-food, beverages and tobacco industries 50,979 55,404 54,827
- services 58,155 58,828 59,620
% share of agricultural employment out of total employment3 5.2 5.2 5.3
% change in consumer price index4
- food products 5.3 1.9 0.2
- total (entire Italian community) 3.2 0.8 1.5
% change in producer price index
- food products 9.4 -3.9 0.9
- total 5.8 -5.4 3.1
% share of international trade in agro-food products out of total trade
- exports 7.3 8.6 8.3
- imports 9.0 10.6 9.6
Normalised trade balance
- agro-food products -12.4 -11.4 -11.5
- all products -1.7 -1.0 -4.2
% change in terms of trade (imports/exports)
for agro-food products 2.3 4.1 -1.7
1 Agriculture, forestry and fishing.
2 At factor cost (current prices).
3 In terms of labour units.
4 National consumer price index, 1995=100.
22 Italian Agricultural Yearbook Abridged version - 2010
Table 1.3
– Pr
oduction and value added to basic prices in agricultur
e in Italy by pr
oduct category and geographical ar
ea - curr
ent prices (million of euro)
North W
est
North East
Centre
South and Islands
2010 distrib. % % change 2010/09 2010 distrib. % % change 2010/09 2010 distrib. % % change 2010/09 2010 distrib. % % change 2010/09 CROPS 4,602 43.9 18.2 6,200 48.8 5.5 3,958 57.6 0.7 10,931 68.1 1.7 - Field crops 2,462 23.5 3.2 3,046 24.0 7.4 1,923 28.0 1.9 5,540 34.5 -2.2 - Cereals 1,308 12.5 7.1 1,208 9.5 23.7 517 7.5 0.4 778 4.8 9.5 - Pulses 14 0.1 9.9 10 0.1 34.8 22 0.3 25.5 41 0.3 8.3
- Potatoes and vegetables
511 4.9 -0.5 1,341 10.5 -3.5 1,034 15.1 3.0 4,061 25.3 -4.7 - Industrial crops 64 0.6 6.6 327 2.6 8.6 142 2.1 0.1 137 0.9 -1.5
- Flowers and potted plants
565 5.4 -2.1 160 1.3 -1.8 209 3.0 -0.1 522 3.3 0.8 Forage crops 587 5.6 6.9 535 4.2 4.6 239 3.5 1.9 355 2.2 -1.6 Tree crops 989 9.4 2.8 2,619 20.6 3.6 1,796 26.2 -0.8 5,036 31.4 6.6
- Wine and grape-related products
508 4.8 4.9 895 7.0 -4.1 469 6.8 -7.3 1,162 7.2 10.2 - Olive-related products 26 0.2 -17.2 10 0.1 1.6 263 3.8 5.9 1,354 8.4 11.9 - Citrus 0 0.0 -0 0.0 -2 0.0 6.5 1,368 8.5 1.0 - Fruit 266 2.5 3.7 1,555 12.2 9.4 308 4.5 3.7 960 6.0 5.7 Other tree 188 1.8 -0.5 158 1.2 -3.0 755 11.0 -0.3 192 1.2 -2.4 LIVEST OCK F ARMING 5,346 50.9 -0.1 4,826 37.9 0.4 1,748 25.5 -1.3 2,970 18.5 -2.0
Livestock food products
5,346 50.9 -0.1 4,825 37.9 0.4 1,745 25.4 -1.3 2,962 18.5 -2.0 Meat 3,235 30.8 -1.3 2,971 23.4 -0.5 1,136 16.5 -1.6 1,790 11.1 -1.5 Milk 1,800 17.2 1.6 1,406 11.1 1.6 447 6.5 -2.4 888 5.5 -4.4 Eggs 300 2.9 2.8 440 3.5 2.8 154 2.2 2.8 275 1.7 2.8 Honey 10 0.1 29.9 9 0.1 27.7 8 0.1 24.4 9 0.1 22.8 Non-foodstuf f livestock products 1 0.0 7.9 1 0.0 10.0 3 0.0 0.2 8 0.0 -0.7 AGRICUL TURE-RELA TED SER VICES 930 8.9 1.9 1,321 10.4 2.5 916 13.3 2.2 2,283 14.2 2.5 PROD. OF AGRICUL TURAL GOODS AND SER VICES 10,313 98.3 1.5 12,347 97.1 3.2 6,622 96.4 0.3 16,184 100.8 1.1 (+) Ancillary activities 1 348 3.3 7.2 591 4.6 4.6 370 5.4 3.8 255 1.6 4.7 (-) Ancillary activities 1 168 1.6 4.0 221 1.7 5.5 126 1.8 10.7 385 2.4 6.6 PROD. FROM THE AGRICUL TURAL SECT OR 10,493 100.0 1.7 12,717 100.0 3.2 6,866 100.0 0.4 16,054 100.0 1.0
intermediate consumption (including Sifim)
5,678 54.1 2.2 6,595 51.9 2.7 2,872 41.8 0.9 6,492 40.4 1.7 VALUE ADDED IN THE AGRICUL TURAL SECT OR 4,815 45.9 1.1 6,122 48.1 3.7 3,994 58.2 -0.1 9,562 59.6 0.6
1 Ancillary activities are considered to be activities carried out within the agricultural sector
, and which therefore are not separable, that is to say
, agri-tourism, th
e
processing of milk, fruit and meat, which are indicated by the (+) sign, and activities carried out by other sectors of economic activity within the framework of cultivation and livestock rearing (for example, by shops), as indicated by the (-) sign. Source:
i
st
at
23
Capter. I - The Italian Agro-food System
Table 1.4
–
Associated and ancillary activities in agricultur
e – Pr oduction at curr ent prices (million of euro) 2000 2008 2009 2010 Distrib. % 2010
% change 2010/09 at current prices
Chained values
(2000)
% change 2010/09
ACTIVITIES REGARDING AGRICUL
TURE-RELA
TED SER
VICES
Agricultural contracting, and the hiring of agricultu
-ral machines and equipment
2,045.6 2,305.9 2,317.2 2,398.5 44.0 3.5 0.7
Harvesting, initial processing and preserving agricultural products
1 1,109.1 1,390.7 1,438.6 1,481.0 27.2 2.9 2.5 Seed conservation 219.7 358.9 353.1 324.9 6.0 -8.0 -0.4
Maintenance of parks, gardens and flowerbeds
989.5 1,507.9 1,471.4 1,473.2 27.0 0.1 -1.2
New crops and plantations
183.3 218.2 21 1.0 193.0 3.5 -8.5 -10.5
Livestock raising-related service activities
2 94.4 95.7 96.9 96.8 1.8 0.0 -2.3 Total 4,238.6 5,300.3 5,324.0 5,449.4 100.0 2.4 0.6 ANCILLAR Y ACTIVITIES Meat processing 340.4 396.5 373.5 402.0 25.7 7.6 0.5 Fruit processing 72.8 39.8 39.3 42.6 2.7 8.5 1.9 Milk processing 234.5 271.8 264.4 287.3 18.4 8.7 -0.3 Farm-based tourism 387.3 819.2 813.0 832.3 53.2 2.4 2.5 Total 1,035.0 1,527.4 1,490.0 1,564.1 100.0 5.0 1.5
1 Also refers to other contracted out farm-related service activities. Does not include agricultural product processing. 2 Excluding veterinary services. Source:
i
st
at
24 Italian Agricultural Yearbook Abridged version - 2010
Table 1.5 –
Associated and ancillary activities in agricultur
e by r egion - Pr oduction at curr ent prices (million of euro) Associated services Ancillary activities (+) Ancillary activities (-) 2009 2010 distr . % % change 2009 2010 distr . % % chang 2009 2010 distr . % % change Piedmont 320,352 326,912 6.0 2.0 91,046 96,756 6.2 6.3 52,287 55,134 6.1 5.4 Valle d’Aosta 9,839 10,149 0.2 3.1 12,688 13,188 0.8 3.9 1,175 1,198 0.1 2.0 Lombardy 522,842 532,975 9.8 1.9 202,924 219,395 14.0 8.1 102,165 105,230 11.7 3.0 Trentino-Alto Adige 85,339 87,615 1.6 2.7 268,055 272,215 17.4 1.6 9,953 10,595 1.2 6.4 Veneto 513,712 526,572 9.7 2.5 123,814 132,558 8.5 7.1 94,121 98,757 11.0 4.9 Friuli-V enezia Giulia 131,154 133,954 2.5 2.1 38,575 40,616 2.6 5.3 8,886 9,223 1.0 3.8 Liguria 59,640 59,612 1.1 0.0 17,761 18,427 1.2 3.7 5,724 6,187 0.7 8.1 Emilia-Romagna 557,976 572,871 10.5 2.7 134,967 145,874 9.3 8.1 96,352 102,159 11.4 6.0 Tuscany 264,602 269,688 4.9 1.9 202,549 208,965 13.4 3.2 26,273 28,623 3.2 8.9 Umbria 100,668 102,756 1.9 2.1 34,893 36,360 2.3 4.2 10,999 11,438 1.3 4.0 Marches 198,941 204,095 3.7 2.6 50,393 52,396 3.3 4.0 21,429 22,276 2.5 4.0 Lazio 332,029 339,013 6.2 2.1 68,775 72,343 4.6 5.2 54,899 63,408 7.0 15.5 Abruzzo 132,695 135,671 2.5 2.2 40,242 41,864 2.7 4.0 31,698 34,961 3.9 10.3 Molise 70,327 72,286 1.3 2.8 10,499 11,284 0.7 7.5 8,791 9,584 1.1 9.0 Campania 302,214 309,917 5.7 2.5 52,451 55,730 3.6 6.3 90,959 101,624 11.3 11.7 Puglia 512,964 524,310 9.6 2.2 25,256 26,562 1.7 5.2 71,212 75,567 8.4 6.1 Basilicata 167,897 172,948 3.2 3.0 13,167 14,016 0.9 6.4 14,770 15,946 1.8 8.0 Calabria 225,278 231,263 4.2 2.7 23,232 24,172 1.5 4.0 29,929 32,163 3.6 7.5 Sicily 570,681 585,694 10.7 2.6 31,776 33,530 2.1 5.5 77,788 73,659 8.2 -5.3 Sardinia 244,875 251,1 10 4.6 2.5 46,973 47,846 3.1 1.9 36,436 41,829 4.6 14.8 Italy 5,324,025 5,449,412 100.0 2.4 1,490,036 1,564,097 100.0 5.0 845,847 899,562 100.0 6.4 Source: i st at .
25
Capter. I - The Italian Agro-food System
Figure 1.1 – Agricultural product and input price trends
Table 1.6 – Trends in Italian agro-food and overall trade
(million of euro at current values)
2006 2007 2008 2009 2010 Imports Total 352,465 368,080 382,050 297,609 367,122 Agro-food 31,636 33,112 34,532 31,640 35,406 AF1/total (%) 9.0 9.0 9.0 10.6 9.6 Exports Total 332,013 358,633 369,016 291,733 337,810 Agro-food 22,789 24,732 26,894 25,166 28,087 AF1/total (%) 6.9 6.9 7.3 8.6 8.3 Balance Total -20,452 -9,447 -13,035 -5,876 -29,312 Agro-food -8,846 -8,380 -7,638 -6,474 -7,353 Non Agro-food -11,605 -1,067 -5,397 599 -21,959 Normalised balance (%) Total -3.0 -1.3 -1.7 -1.0 -4.2 Agro-food -16.3 -14.5 -12.4 -11.4 -11.5 Non Agro-food -1.8 -0.2 -0.8 0.1 -3.4 1 AF = Agro-food
26 Italian Agricultural Yearbook Abridged version - 2010
Table 1.7 – Italian agro-food trade by subsector - 2010
million of euro Balance
imports % exports % balance normalised
Cereals 1,959.1 5.5 164.9 0.6 -1,794.2 -84.5
- from seed 80.4 0.2 33.3 0.1 -47.1 -41.4
Fresh pulses and vegetables 874.6 2.5 1,214.6 4.3 340.0 16.3
- from seed 160.2 0.5 86.4 0.3 -73.8 -29.9
Dried pulses and vegetables 177.1 0.5 37.3 0.1 -139.8 -65.2
Citrus 238.4 0.7 208.9 0.7 -29.5 -6.6
Fresh fruit, other 1,052.8 3.0 2,281.8 8.1 1,229.0 36.9
Dried fruit 663.5 1.9 256.8 0.9 -406.7 -44.2
Coarse fibrous plants 98.3 0.3 9.5 0.0 -88.8 -82.4
Oilseeds and oleaginous fruits 719.7 2.0 75.8 0.3 -643.9 -80.9
Cocoa, coffee, tea and spices 1,138.5 3.2 50.6 0.2 -1,087.9 -91.5
Ornamental flowers and plants 503.9 1.4 643.5 2.3 139.6 12.2
Raw tobacco 51.4 0.1 218.2 0.8 166.8 61.9
Live Animals 1,457.8 4.1 54.9 0.2 -1,402.9 -92.7
- for breeding 117.5 0.3 27.5 0.1 -90.0 -62.1
- for fattening and slaughter 1,317.2 3.7 16.0 0.1 -1,301.2 -97.6
Other livestock products 358.8 1.0 91.4 0.3 -267.4 -59.4
Forestry products 753.6 2.1 89.8 0.3 -663.8 -78.7
Fish products 979.3 2.8 207.5 0.7 -771.8 -65.0
Game 72.4 0.2 11.9 0.0 -60.5 -71.7
Other agricultural products 65.4 0.2 55.4 0.2 -10.0 -8.3
Total primary sector 11,164.5 31.5 5,672.7 20.2 -5,491.8 -32.6
Cereal derivatives 1,098.8 3.1 3,765.5 13.4 2,666.7 54.8
- Pasta 61.2 0.2 1,793.3 6.4 1,732.1 93.4
Sugar and confectionery 1,429.4 4.0 1,229.8 4.4 -199.6 -7.5
Fresh and frozen meat 4,349.0 12.3 1,016.6 3.6 -3,332.4 -62.1
Processed meat 330.2 0.9 1,072.9 3.8 742.7 52.9
Fish, processed and preserved 3,022.4 8.5 320.5 1.1 -2,701.9 -80.8
Processed vegetables 890.4 2.5 1,902.4 6.8 1,012.0 36.2
Processed fruit 483.5 1.4 890.6 3.2 407.1 29.6
Dairy products 3,587.5 10.1 2,151.1 7.7 -1,436.4 -25.0
- milk 842.0 2.4 11.2 0.0 -830.8 -97.4
- cheese 1,498.6 4.2 1,660.1 5.9 161.5 5.1
Oils and fats 2,837.0 8.0 1,591.2 5.7 -1,245.8 -28.1
Oilseed cake and feed 1,597.5 4.5 436.7 1.6 -1,160.8 -57.1
Beverages 1,369.5 3.9 5,249.1 18.7 3,879.6 58.6
- wine 256.3 0.7 4,036.7 14.4 3,780.4 88.1
- other alcoholic 901.4 2.5 712.0 2.5 -189.4 -11.7
- non-alcoholic beverages 206.8 0.6 459.8 1.6 253.0 38.0
Other food industry products 1,500.1 4.2 2,174.8 7.8 674.7 18.4
Other food products 1,089.5 3.1 347.5 1.2 -742.0 -51.6
Total food and drinks industry 23,584.8 66.6 22,139.8 78.9 -1,445.0 -3.2
TOTAL AGRO-FOOD1 35,408.1 100.0 28,053.0 100.0 -7,355.1 -11.5
1 The agro-food total includes other products (under thresholds 1-24) that are not reported under primary
sector and food and beverage industry totals.
27
Capter. I - The Italian Agro-food System
Table 1.8 – Farms and related areas covered under the main forms of UAA
Italy North Centre South
2010 % change2010/00 2010 % change2010/00 2010 % change2010/00 2010 % change2010/00
Farms (no.) 1,630,420 -32.2 397,847 -32.7 256,059 -40.0 976,514 -29.6
UAA (ha) 12,885,186 -2.3 4,605,144 -5.6 2,204,700 -9.5 6,075,342 3.5
TAA (ha) 17,277,023 -8.0 6,371,724 -10.7 3,471,535 -11.0 7,433,764 -3.9
Arable farms
(no.) 834,650 -34.5 257,874 -32.0 147,214 -37.8 429,562 -34.7
Under arable crops
(ha) 7,014,892 -3.7 2,834,779 -3.5 1,391,270 -7.6 2,788,843 -1.9
Agricultural tree crop
farms (no.) 1,197,076 -32.0 179,871 -40.8 198,800 -39.6 818,405 -27.4
Area under tree crops (ha) 2,370,560 -3.0 455,176 -4.5 387,300 -6.8 1,528,084 -1.5
Farms with meadows and
grazing (no.) 275,757 -45.6 116,481 -44.1 42,614 -64.0 116,662 -35.2
Area under meadow and
grazing (ha) 3,469,663 1.6 1,308,049 -10.0 419,180 -17.0 1,742,435 19.6
28 Italian Agricultural Yearbook Abridged version - 2010
Table 1.9 – Gross farm output, net value added and average net income by
location, altitude, and ESU and Farm Type - 2009
Gross Farm Income
(GFI)
Net Value
Added (NAV) Net Income (NI) NAV/GFI NI/NAV Public subs. /NAV
euro % Geographical areas North 77,580 37,717 29,025 48.6 77.0 20.1 Centre 51,289 25,784 16,853 50.3 65.4 23.7 South 34,518 21,684 14,716 62.8 67.9 19.0 Altitude Mountain 47,327 26,313 19,510 55.6 74.1 18.1 Hill 37,215 21,187 15,205 56.9 71.8 21.5 Plain 76,368 38,492 27,492 50.4 71.4 19.8
Economic Size Unit
4 - 8 ESUs 14,710 8,797 6,259 59.8 71.2 20.6
8 - 16 ESUs 23,982 13,077 8,462 54.5 64.7 25.2
16 - 40 ESUs 53,326 28,680 18,410 53.8 64.2 22.4
40 - 100 ESUs 124,363 66,404 50,329 53.4 75.8 20.8
More than 100 ESUs 540,116 273,907 212,775 50.7 77.7 16.2
Technical-economic orientation
Arable 40,969 21,404 13,163 52.2 61.5 40.8
Fruit, vegetables and
flowers 119,324 67,338 44,144 56.4 65.6 0.6 Permanent crops 34,201 21,560 13,845 63.0 64.2 10.0 Herbivorous livestock 105,588 49,172 45,353 46.6 92.2 24.1 Granivorous livestock 478,043 191,244 169,573 40.0 88.7 4.6 Polyculture 43,646 22,681 16,995 52.0 74.9 26.6 Italy 52,677 28,126 20,238 53.4 72.0 20.2 of which: Change 2009/2008 -6% -7% -9% - - -NOTES:
GFI: gross farm income is the sum total of sales, public subsidies for operating expenses, own consumption, payments in kind, repurposing for farm use, fixed assets, the value of production earmarked for processing, and the balance of the value of product inventory and revenues from associated activities.
NAV: Net Added Value is the result of the difference between GFI and current production costs and amorti-sation/depreciation. NI: Net Income is the difference between NAV and wages payable to off-farm factors of production.
Public subsidies: aid paid for operating expenses is taken into consideration.
Source: inEa, riCa database 2009.
29
Capter. I - The Italian Agro-food System
Figure 1.2 – Index of food and manufacturing industry turnover
Source: calculated using ISTAT data.
Table 1.10 – Trends in Italian food industry production
(rough indices - 2005=100)
Average % change
2010/09
2008 2009 2010
Prod. of processed meat and derivatives 102.1 100.6 101.8 1.2
Processing and preservation of fish and derivatives 98.0 96.6 98.7 2.3
Processing and preservation of fruit and vegetables 112.4 113.2 112.2 -0.9
Manuf. of plant and animal oils and fats 104.6 110.0 123.1 11.9
Dairy industry 101.3 97.6 100.5 3.1
Processing of grains and starch products 92.7 93.1 95.3 2.3
Bakery products 104.0 103.7 105.6 1.8
Fresh bread and confectionery 105.7 104.3 106.9 2.5
Toasted biscuits, sweet biscuits and pre-packaged confectionery 105.9 110.0 112.2 2.0
Pasta, couscous and similar 97.4 96.2 95.5 -0.7
Other food products 93.6 92.4 96.1 4.0
Sugar 28.2 26.6 27.4 3.0
Cocoa, chocolate, sweets and confectionery 101.8 98.7 103.6 4.9
Tea and coffee 110.8 108.8 114.7 5.4
Flavourings and spices 119.4 114.4 108.6 -5.1
Prepared dishes 82.4 81.9 111.5 36.2
Baby foods and dietetic preparations 101.6 100.6 100.9 0.3
Manufactured food for animals 103.2 93.4 96.9 3.7
Drinks industry 104.9 105.1 105.6 0.5
Distilled alcoholic beverages 109.0 113.5 115.7 1.9
Wine (from grapes not produced on-site) 102.0 103.9 106.4 2.4
Beer 104.4 100.0 100.3 0.3
Mineral water and soft drinks 106.2 w103.7 101.0 -2.6
Food, drinks and tobacco industry 101.8 100.5 102.8 2.3
Manufacturing industry 103.1 82.8 88.5 6.9
30 Italian Agricultural Yearbook Abridged version - 2010
Table 1.11 – The main food firms in Italy - 2010 “Turnover
(€m)” % change 2010/09 Employees Province Core business
1 Ferrero Spa (Ferrero Group) 2,338 3.8 5,931 TO-CN confectionery
2 Veronesi Finanziaria Spa 1 2,320 2.5 7,043 VR feedstuffs and meat
3 Barilla G. e R. Fratelli Spa (Barilla Group Holding) 2,247 -2.4 4,243 PR pasta
4 Nestlé Italiana Spa (Nestlé Italiana Group) 1,455 -2.2 3,449 MI confectionery
5 Coca Cola Hbc Italia Srl 2 1,146 16.7 3,226 MI soft drinks
6 Gesco Consorzio Cooperativo Scarl (Amadori Group) 1,128 -4.1 544 FC meat
7 BIG Srl (Lactalis Italia Group) 1,043 1.7 1,143 MI dairy products
8 Luigi Lavazza Spa (Luigi Lavazza Group) 984 4.4 1,570 TO coffee
9 Granarolo Spa 3 (Granarolo Group) 854 -2.1 1,254 BO dairy products
10 Egidio Galbani Spa (Lactalis Italia Group) 835 10.0 1,834 MI dairy products
11 Parmalat Spa (Parmalat Group) 821 0.1 1,670 PR dairy products
12 Kraft Foods Italia Spa Foods Italia Intellectual Property Group)4 (gruppo Kraft 797 17.1 363 MI dairy products
13 SanPellegrino Spa (SanPellegrino Group) 788 2.2 1.559 MI-BG soft drinks
14 Bunge Italia Spa 677 -17.1 274 RM-RA oils and fats
15 Massimo Zanetti Beverage Group Spa 1 674 3.2 2,375 TV coffee
16 Conserve Italia Scrl (Conserve Italia Group) 658 -3.0 1,963 BO processed vegetables
17 Heineken Italia Spa 619 4.2 909 MI beer
18 Carapelli Firenze Spa 5 607 1.9 334 FI oils and fats
19 Acqua Minerale San Benedetto Spa (Zop-pas Finanziaria Group) 567 -2.3 1,099 VE mineral water 20 Bolton Alimentari Spa (Bolton Alimentari Group; formerly Trinity) 530 -0.3 612 MI-CO preserved fish
21 Davide Campari Milano Spa (Davide Campari Group) 6 493 59.7 658 MI alcoholic beverages
22 Birra Peroni Spa 489 -0.8 738 RM beer
23 Danone Spa 479 -2.5 340 MI-CR dairy products
24 Plada Industriale Srl 479 -2.5 340 MI-CR dairy products
25 Consorzio Latterie Virgilio Scrl (Consorzio Latterie Virgilio Group) 411 18.7 223 MN dairy products
26 Unipeg Scrl (Unipeg Group) 410 3.8 287 RE meat
27 Unigrà Spa (Unigrà Group) 393 6.1 344 RA oils and fats
28 Eurovo Srl 359 7.4 206 RA eggs
29 Roquette Italia Spa 348 -1.5 461 AL starch and starch products
30 Fratelli De Cecco Spa1 341 11.5 741 CH pasta
31 Bauli Spa 338 29.5 865 VR confectionery
32 Star Spa 330 -0.4 419 MI processed vegetables
33 Colussi Spa (Colussi Group) 327 -5,3 966 PG-MI dolciario
34 Martini & Rossi Spa 322 1.0 373 TO alcoholic beverages
35 Alcar Uno Spa (Alcar Uno Group) 305 9.4 159 MO meat
36 Pastificio Rana Spa (Pastificio Rana Group) 289 7.2 810 VR pasta
37 Fruttital Distribuzione (GF Group) 274 3.3 289 - fruit and vegetable distribution
38 Consorzio Agrario Lombardo Veneto Scarl (Cons. Agr. Lomb. Ven. Group) 273 -3.3 216 VR feedstuffs
39 Grandi Molini Italiani Spa (Grandi Molini Italiani Group) 267 4.3 233 RO milling
40 San Carlo Gruppo Alimentare 266 2.9 269 MI bread and snacks
41 Salov Spa (Salov Group) 261 -3.7 204 LU oils and fats
42 La Doria Spa (La Doria Group) 260 -0.1 628 SA processed vegetables
31
Capter. I - The Italian Agro-food System
Table 1.11 – The main food firms in Italy - 2010 “Turnover
(€m)” % change 2010/09 Employees Province Core business
43 Newlat Spa 259 -0.3 887 RE dairy products
44 Illycaffè Spa (Illycaffè Group) 259 7.5 570 TS coffee
45 Fileni Simar Srl 256 3.6 7 MC meat
46 Sterilgarda Alimenti 252 7.2 268 MN dairy products
47 Parmareggio (Consorzio Granterre Group) 7 241 13.3 274 MO-RE dairy products
48 Cameo Spa 235 6.4 339 BS confectionery
49 Mellin Spa 235 0.3 260 MI baby food
50 Lindt & Sprungli (Lindt & Sprungli Group) 233 6.8 608 VA chocolate
1 Consolidated turnover.
2 Absorbed subsidiary SOCIB - Società Capua Group Imbottigliamento Bevande on 1 Jan. 2010.
3 Sold its logistics arm to subsidiary Zeroquattro on 1 June 2010.
4 Took over the Kraft Foods Italia Biscuits Production (formerly Saiwa) marketing activities going concern
on 14 Jun 2010. Through a partial spin off, on 19 July 2010 sold the “Simmenthal” brand to parent com-pany Kraft Foods Italia Intellectual Property.
5 Formerly Mediterranean Dressing. On 1 Jan. 2010 absorbed Carapelli Firenze and took on its name.
6 On 1 Jan. 2010 absorbed subsidiary company Campari Italia.
7 During 2010, took over the “Servizi Gestionali” arm of Consorzio Granterre-Caseifici e Allevamenti, and
transferred its “Allevamento Bovini” going concerns in Castelfranco Emilia (MO) and Carpi (MO) to Bonlatte and Albalat respectively.
Source: calculated using Mediobanca data.
Table 1.12 – Trends regarding farm cooperative members of central representative
organisations in Italy
Entries 2006 2007 2008 2009 1 2010 Var. %20
10/09 2
Number of cooperatives 6,419 6,431 6,213 4,997 6,197 1.5
Number of members 914,334 949,632 932,649 694,752 900,196 -0.9
Turnover (million of euro) 34,666 35,477 36,216 28,704 37,391 2.2
Average turnover per cooperative (thousands of euro) 5,400.5 5,516.6 5,829.0 5,744.3 6,033.7 0.7
Average turnover per member (thousands of euro) 37.9 37.4 38.8 41.3 41.5 3,1
1 2009 is not inclusive of data for Legacoop Agroalimentare, as it was not available.
2 2010/09 percentage changes were calculated solely using Fedagri, asCat-unCi and agCi-Agrital data. Source: