Experimental investigation on thermal diffusivity of PM steels
Gian Filippo Bocchini, P/M Consultant, Rapallo, (GE), Italy Gianluigi Bovesecchi, University of Rome ‘Tor Vergata’, Rome, Italy
Paolo Coppa, University of Rome ‘Tor Vergata’, Rome, Italy Sandra Corasaniti, University of Rome ‘Tor Vergata’, Rome, Italy Roberto Montanari, University of Rome ‘Tor Vergata’, Rome, Italy Alessandra Varone, University of Rome ‘Tor Vergata’, Rome, Italy Abstract
The scanty literature data on thermal diffusivity of P/M steels seems contradictory, if the cooling speed on quenching is the evaluation parameter. Due to the basic importance of diffusivity on the response of P/M steels to heat-treating, an experimental survey has been carried out, to collect data on various P/M steels, based on prealloyed, or diffusion-bonded, or admixed powders. The study has also covered the influence of processing parameters, such as compaction pressure and sintering temperature. The flash method has been used to measure the thermal diffusivity of P/M steels. This method directly measures the thermal diffusivity of a sample in slab shape. A plane-parallel sample is inserted in the test apparatus and then a short light pulse, produced by a laser or a flash lamp, heats the front surface of the sample. The heat diffuses through the sample, leading to a temperature rise on the sample rear surface. An infrared detector measures this temperature rise, versus time, and thermal diffusivity is derived from the least square regression on the whole temperature trend, using the analytical solution of heat conduction. The results show that thermal diffusivity increases as density increases. This achievement can be justified by a simple theoretical analysis of the thermal conduc-tivity on thermal diffusivity. The collected data also enable us to ascertain the influence of sintered material composition and carbon content on thermal diffusivity. The results should contribute to clarify some un-certainties and perplexities on the behavior of properly elaborated P/M steels, to be hardened by heat treat-ment, conventional – such as oil quenching – or innovative, such as sinter hardening.
Keywords: density, physical properties, sintered steels. 1. Introduction
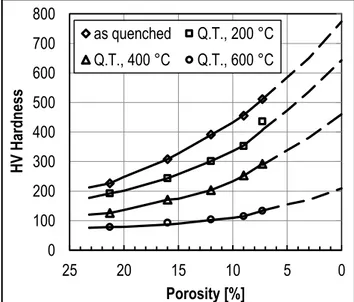
Presumably, the first paper on heat treatment of P/M steels was published in 1947 by Chadwick and Broadfield, [1, 2], who investigated the influence of porosity and tempering temperature on the Vickers hardness of nearly eutectoid Fe-C materials. Figure 1 is a replica of the original graph. Less than 20 years later, Bockstiegel and Struglics, [3], published the results of a systematic experimental survey, aimed at finding the influences of density and alloy additions on the response to heat treatments of P/M steels. The relevant literature – and the industrial practice as well – indicate that hardening
processes, to increase the properties of P/M steels, have been growing for more than 5 decades. For a long period, case hardening (carburizing or carbonitriding), followed by oil quenching predominated. Thanks to the improved system of carbon control on sintering, even induction hardening became quite common at the be-ginning of the seventies. Subsequently, in the last dec-ade of the previous century, sinter-hardening found an increasingly positive answer from the market of P/M parts for demanding applications. The producers of iron-base powders substantially contributed to this de-velopment, with the introduction of new types of raw materials, from hybrid to completely alloyed, [4]. It may be interesting to remark that all the listed processes have a common aspect: the need of a fluid to remove heat from the hot parts (austenitised materials) at high-enough velocity, to achieve prevailingly martensitic structures on cooling. This means that the cooling speed, on the surfaces and internally, is a critical
pa-0 100 200 300 400 500 600 700 800 0 5 10 15 20 25 H V H ar dness Porosity [%] as quenched Q.T., 200 °C Q.T., 400 °C Q.T., 600 °C
Figure 1. HV Hardness of oil-quenched and tempered (or stress-relieved) Fe-C (1% nominal C) P/M steels. From Kieffer and Hotop, [2], redrawn.
rameter to achieve the required properties. To the authors’ knowledge, the most meaningful experimental data on thermal diffusivity and thermal conductivity of sintered and dense carbon steels have been published by Gierl et alii, [5]. Data reported in the present work have been compared with these last. The thermal diffusivity is a thermo-physical property, [6], that determines the speed of heat propagation by conduction when temperature changes. The higher the thermal diffusivity, the faster heat propagation will occur. Thermal diffusivity [m2s-1] is a function of thermal conductivity, k, specific heat, c, and density, as follows:
k
c
(1) or, adding the subscript s to designate sintered materials,, .
(1
)
1
(1
)
1
s s s s s sk
k
n
n
c
c
(2) where: is the thermal diffusivity of the fully dense metal or alloy, k is the thermal conductivity of the fully dense metal or alloy,
is the density of the fully dense metal or alloy, c is the specific heat of the fully dense metal or alloy,
s,s is the thermal diffusivity of the sintered metal (or alloy) at s density, ks is the thermal conductivity of the sintered metal (or alloy) at s density,
s is the density of the sintered metal (or alloy), cs,s
n
is the specific heat of the sintered metal (or alloy) at s density, is the porosity of the sintered metal,
is a factor, > 1, depending on process conditions. As a rule, it is 1.5 ≤ n ≤ 1.2. Beiss, [7, 8], pub-lished data confirming the indicated range.
According to Hirschhorn, [9], a very simple relationship should relate thermal conductivity and porosity of a P/M steel: (3) where
ks is the thermal conductivity of the sintered material, kfd is the thermal conductivity of the fully dense material, is the porosity of the sintered material.
This equation corresponds to a simple model, where the porosity is disposed by layers, oriented as shown on the left portion of figure 2. By the same ap-proach, in case of 90° rotation, as shown on the right portion of figure 2, due to typical thermal conductivities of gases, this property, for porous materials, would always be 0.
Generally, conduction heat transfer in not fully dense materials is an overlap-ping of two mechanisms: parallel and cross conduction (Fig. 2). Apart from the basic series and parallel models and combination of these, the most com-monly quoted thermal conductivity models in different fields literature are the Maxwell–Eucken equation, [10], Levy’s modification to the Maxwell– Eucken equation, [11], and the effective medium theory, proposed by Mattea, [12]. Many researchers have worked on theoretical models regarding porous media or composite materials and their geometric and thermal configuration (Tarnawski et al, [13]; Gori and Corasaniti [14, 15, 16]).
As shown by Bocchini, [17, 18], the spatial distribution of the porosity does not correspond to the ideal model of Figure 2, but features a strong tortuosity. In addition, the contact surfaces between adjacent granules, welded during sintering, inevitably present some anomalies; the contact surface between grains increases as sintering time or sintering temperature increase. Bocchini demonstrated that it must be ks < k(1 – ) and, presumably, ks ≥
k(1 – 2). The diagrams published by Beiss, [8], show that, for ≤ 0.15, the great majority of experimental results falls between (1 – 2) and (1 –1.5). Quite simple physical consideration can confirm this result. Of course, again for physical reasons, it is s = fd (1 – ), and cs = cfd, due to the negligible contribution of air. Under the hypothesis that it is ks = kfd(1-n), porosity always reduces thermal diffusivity of a porous material. The relative
1
s fd
k
k
Figure 2. Scheme of layered porosity and effects on thermal conductivity
A different approach, based on a suggestion by Beiss, [8], (“For structural parts, it is recommended to calculate thermal conductivity ks from ks /kfd = (s/fd)m, with m = 2.4”), leads to the equation
2.4 1.4 , . (1 ) 1 (1 ) s s fd s s fd s s fd k k c c
(4)Figure 3 presents the curves corresponding to different hypotheses and includes the experimental results pub-lished by Beiss et al, [7].
Some experimental results published by Saaritas et al, [19], and, subsequently, by Bocchini et al, [20, 21, 22], seem astonishing, at first sight, because they show, clearly, that the cooling speed inside a porous steel body – cooled by an external fluid – increases as the porosity increases, as shown in Figure 4.
A possible explanation of disagreement with previous considerations (eq. 3) can be found considering the sur-face increase in porous media and consequent enhancement of heat transfer during cooling.
A comparison between figures 5 and 6, from James, [23], helps to understand why a generally valid relation-ship between porosity fraction and thermal conductivity is a hard issue. Therefore, data based on experimental approaches seems preferable.
Figure 5. Typical pattern of porosity on a sample Figure 6. Typical pattern of spatial distribution of correctly prepared for microscopy observation. porosity net inside a sintered component. Metal From B. James, [23]. removed by acid etching. From B. James, [23].
0,5 0,6 0,7 0,8 0,9 1,0 6,6 6,8 7,0 7,2 7,4 7,6 R elative ther mal condu ctivity Density [g/cm3] Hirschhorn Bocchini Beiss, average Beiss, minimum
300 400 500 600 700 800 900 1 10 100 1000 Tem per at ur e [ °C] Time [s] 7.0 g/cm^3 6.8 g/cm^3
Figure 3. Relative thermal conductivity of sintered iron-base materials versus density
Figure 4. Representative cooling curves (still air) monitored at 3 mm distance from the “quenched” face of P/M steel. From Bocchini et al, [20, 21, 22].
2. Investigated materials
The full research program includes 4 grades of base powder, 3 compaction pressures, 2 sintering tempera-tures. Table I lists materials, process conditions, reference codes (3 digit system) and Table II lists the chemi-cal (nominal) compositions
Table I. Processimg conditions of test materials
Base powder Compaction pressure Sintering conditions
Type Code MPa Code °C, time, min. Code
Plain iron 1 400 4 1160, 25 1
Cr-Ni Prealloy 2 550 5 1260, 25 2
Cr-Mo prealloy 3 700 6
Table II. Nominal chemical compositions of the (unlubricated) materials Base
powder Producer
Chemical composition, w % Cr Cu Mo Ni C Fe Fersint Pometon SpA - - - 100 Ecosint A Pometon SpA 1.4 - 0.8 0.4 0.5 rest Astaloy CrM Höganäs AB 3.0 - 0.5 - 0.35 3. Experimental
The flash method, (ASTM 1461-01, [24]), has been used to measure the thermal diffusivity of P/M steels. This method directly measures the thermal diffusivity of a sample in slab shape. A plane-parallel sample is inserted in the test apparatus. Then the front surface of the sample is heated by a short light pulse, produced by a laser or a flash lamp. The heat diffuses through the sample, leading to a temperature rise on the sample rear surface. This temperature rise, versus time, is measured by means of an infrared detector, and thermal diffusivity is derived from the least square regression on the whole temperature trend, using the analytical solution of heat conduction as model.
3.1 Test set up
The experimental apparatus (Fig. 8) is composed by:
- a MCT (mercury cadmium telluride) quantum radiation detector working in photoconductive way. The sensor is cooled to the liquid nitrogen (LN2) temperature (77K), to detect the radiation emitted by the rear surface of the sample. This detector is inserted in a specific dewar to keep the LN2; also a suited power supply and signal amplifier is provided
- a ZnSe infrared lenses (50 mm of focus length), transparent to visible and IR radiation from 0.5 to 13 µm, mounted in front of the MCT detector
- a photographic medium-high power flash Metz Mecablitz 60CT, 200W
- a data acquisition system NI USB-6229, set at a sampling frequency of 500Hz, and ± 10V range Recording of the direct flash irradiation shows that the flash time length was about 15 ms, in agreement with the hypothesis of delta Dirac shape pulse used in data processing. When the flash is lightened the DAS acquires and stores signals of the data, for the following data processing (following paragraph).
Samples sizes are 40mm x 40mm x 6.5 mm. They are inserted in a polystyrene foam sample holder 120 mm x 200mm x 15 mm, to thermally insulate as much as possible the sample edges. The samples are located just in front of the lamp, and the detector lenses is located close to their rear surface. Both sample surfaces (front and rear) have been blackened with a high emissivity coating (colloidal graphite, Aquadag) in order to increase both light absorption and MCT resolution, (Cernuschi et al, [25]).
3.2 Experiment design
Fortysix samples in 6 different process conditions have been tested. Table I shows the values of compaction pressure and sintering temperature, for each sample series. Each series is made of three samples, and at least 4 repetitions of thermal diffusivity measurements have performed for each sample. Among repetitions on the same sample, one half of the tests have been carried out rotating the sample of 90° around the axis normal to the extended surface, in order to recognize eventual anisotropies of materials. No differences have been de-tected within these tests, so all repetitions have been considered in the average for redundancy. Also the mean density of each sample series is reported in the table, measured simply dividing the sample mass by its volume.
each sample series is reported in the table, measured simply dividing the sample weight with the volume. Its uncertainty is evaluated as rms of 5 repetitions.
Fig. 7: Sketch of the experimental apparatus
Table III. Characterics of tested samples Code Sample Mean Sizes (mm x mm x mm) Average density (kg/m3) 141 29.96 x 11.88 x 6.18 6.99 151 29.93 x 11.90 x 5.92 7,28 161 29.90 x 11.85 x 5.94 7,30 142 29.93 x 11.87 x 6.18 7,00 152 29.93 x 11.89 x 5.93 7,28 162 29.94 x 11.96 x 5.85 7,31 31 6,70 32 7,10 3.3 Data Processing
According to the fundamental works of Parker et al., [26] and Maglic et al., [27], the temperature trend is described by following equation
2 2 0 0 2 1( , )
1 2
cos
exp
nn x
n
t
T x t
T
T
T
L
L
(5) where:T0 is the initial temperature
T∞ is the asymptotic temperature (at the end of heat propagation)
L is the sample thickness
x is the abscissa of the sample, from the heated surface (x=0) to the rear surface (x=L) t is time [s]…
The hypotheses are :
- impulse heating (Dirac ), justified by the short time length of the flash (about 15 ms),
- adiabatic condition of the slab after the pulse, justified by the short time length of the rear surface heating after the pulse, about 1s, compared with the total time length involved in the convection cooling of the sample (more than 20 s),
- one-dimensional heat propagation, due to the large sample width as respect to thickness, and insula-tion of the sample edges.
A non linear least square analysis of the experimental data have been carried out using eq. (5) as analytical model. This procedure supplies the best estimate of two quantities: the temperature increase (T∞ - T0) and the thermal diffusivity
, and their uncertainties, evaluated from the uncertainty propagation from the dispersion of data around the line resulting from regression [28]. This dispersion is reported as an example in Fig. 9, together with the residual analysis (trend of difference between measured and calculated values versus time). Taking into account that a total temperature increase of the sample of about 0.5 °C was verified with a standard type J thermocouple applied to the rear surface, the evaluated temperature uncertainty corresponds to about 0.015 °C. The complete randomness of the residual distribution (Fig. 11 b) demonstrates a good agreement between the experimental data and the regression model, eq. (5).Fig. 9: a) one typical test and its least square regression line, b) residual analysis 4. Experimental results
Fig.s 10-14 report the results of all tests, showing thermal diffusivity as a function of pressure, and hence density. V and H (black and red points) stay for two different orientations of the sample after rotation (see par. 3.2). From the data and figure analysis it is possible to deduce a meaningful dependence of thermal diffusivity on sample density and sintering temperature. As compaction pressure increases sample density also increases, and hence thermal conductivity, because of the higher number of thermal bridges formed in the samples and bigger welding cross sections. Even thermal conductivity resembles the one of full dense material, due to the predominant role of these thermal bridges. Also increases of sintering temperature produce higher values of ther-mal diffusivity, as can be seen comparing Fig.s 10 and 11 for sample 1XX and Fig.s 12 and 13 for sample 2XX.
Fig. 10: Result of thermal diffusivity data versus density at 1160°C. Material: Code 1XX of Table III
Fig. 11: Result of thermal diffusivity data versus density at 1260°C. Material: Code 1XX of Table III
Fig. 12: Result of thermal diffusivity data versus density at 1160°C. Material: Code 2XX of Table III
Fig. 13: Result of thermal diffusivity data versus density at 1260°C. Material: Code 2XX of Table III Fig.12 and Fig.13 report the experimental results for
the sample 2XX. Even in this case the increase of sin-tering temperature produce higher values of thermal diffusivity, but lower respect than sample 2XX; likely due to different composition of the sample.
Figure 14 shows a similar trend for the sample 3X. Only two series of data (both V and H) were ob-tained, but a meaningful dependence of α versus density is also clearly recognizable.
5. Uncertainty analysis
According to the ISO GUM Standard, [29], two dif-ferent uncertainty sources can be attributed to these tests: type A (statistical ones) and type B (non statis-tical). Data processing produces two kinds of type A uncertainty: the prevision uncertainty due to the least
square regression procedure, from the covariance matrix of the unknown, [28], and the standard uncertainty de-riving from the repetitions of tests. This second source results about three times the first, and hence the first can be neglected. This type A uncertainty results about 0.6%. Type B uncertainty derives from other non statistical sources, practically from previous knowledge of the instrumentation and phenomena. Previous analysis of these sources [30], [31], leads to about 1% of total uncertainty of the described procedure. So, finally, this last value can be assumed as the total uncertainty attributed to the tests.
6. Analysis of the results
A better description of measured data is obtained with a different model. It must be taken into account that α increases with density, and the maximum reachable value can be assumed as the one of the full dense material. So plotting all the measured data vs. density for the pure iron (sample 1XX) including the one at full density, Fig. 17 is obtained. The trend results clearly exponential, so the following new empirical equation can be proposed: 3 1 2 b b b e
(6) Table IV reports the results of the least square regression analysis of all data of sample 1XX, toghether with the one of full dense material (from [32]).Table IV 1 1 b b s 2 2 b b s 3 3 b b s s / (13.12 ± 0.33) · 10-6 (5.53·±8,23)· 10-13 2,12±0,19 3.6· 107
Fig. 14: Result of thermal diffusivity data versus density. Material: Code 3X of Table IV
The best estimate of the three unknown b1, b2 and b3 and of their uncertainties, as evaluated from the least square algoritm, are repoted, and also the prevision uncertainty of (s/) resulting from regression. While b1 represents the asymptote of the trend, i.e. the minimum expected value of thermal diffusivity, b3 can be seen as the “slope” of the exponential trend. This trend (see Fig. 15 together with the ± 2σ uncertainty range, i.e. 95% of probability) is different from the one of Beiss [8], but it corresponds to a much better approximation of data, as can be seen from Fig. 16, which reports the trend corresponding to the eq.(7)
4 b fd fd
(7)Fig. 15: Distribution of data of sample 1XX, empirical correlation,eq. (6) and uncertainty range (covering factor 95%)
Fig. 16 Same as Fig. 15, but with eq. (7) as model
7. Concluding remarks
Thermal diffusivity of sintered steel samples has been measured with the flash method at ambient temperature. 162 different measurements were performed on 46 samples prepared in different process conditions and ma-terials. Least square regression gives the best estimate of the unknown parameters, one of which is thermal diffusivity, and of their standard uncertainties. Thermal diffusivity increases as both, compaction pressure and sintering temperature, and hence density, increase. The evaluation of the total uncertainty brings to a relative value of 1%. The trend of the results versus density, at least in principle, agrees with the curves published by Gierl et alii, [5]. A new empirical equation describing the thermal diffusivity distribution vs. density is also reported, different from the ones reported in literature, but better approaching found data. The adverse effect of chromium on thermal conductivity of steels, well known since long time, [32], is obviously confirmed. The increase of cooling rate as porosity increases should be attributed to an increase of convective heat trans-fer coefficient as porosity increases. Also the increase of exchange surface, at equal mass, plays a certain role on the cooling speed inside a porous body.
Acknowledgments
The authors are indebted to companies Höganäs AB, (Höganäs, Sweden), Pometon SpA, (Maerne di Mar-tellago, VE, Italy.) for the careful preparation of samples to be utilized in the investigation, and to Stame Srl, (Arosio, CO, Italy) for sintering the green specimens.
References
1. R. Chadwick, E. R. Broadfield: Iron Steel Inst., Spec. Rep. Nr. 38, London 1947, p. 123-41 2. R. Kieffer, W. Hotop: Sintereisen und Sinterstahl, Springer-Verlag, Wien, 1948, pp. 409
3. G. Bockstiegel, O. Struglics: “Influence of various alloying additions on case hardening of sintered steel parts”, PM Conference, Stary Smokevec (Cecoslovakia), September 26, 1966
4. W. B. James: “What is Sinter-Hardening”, Advances in Powder Metallurgy and Particulate
5. C. Gierl, M. S. Gonzalez, J. Schmidt, E. Specht, H. Danninger: “Thermophysical Properties of Sintered Steels - Effect of Porosity and Composition”, PM2010 World Congress, Florence, Italy, October 2010 6. F. P. Incropera, D. P. DeWitt: “Introduction to Heat transfer”, John Wiley & Sons, 1996
7. P. Beiss, U. Kutsch, H. J. Jager, F. Schmitz, H. Maier: “Thermal Conductivity of Sintered Stainless Steel 316L”, 1998 PM World Congress. Granada. Proc. EPMA, Shrewsbury, 1998, Vol. 3, p. 425-435. 8.P. Beiss “Structural Mass Production Parts” in Landolt-Börnstein – Group III, Advanced Materials and Technologies, Numerical Data and Functional Relationships in Science and Technology, Springer Ver-lag, 2012
9. J.S. Hirschhorn, "Introduction to Powder Metallurgy", APMI, New York, 1969 (267)
10. A. Eucken, Allgemeine Gesetzmassigkeiten fur das Wärmeleitvermogen verschiedener Stoffarten und Aggregatzustande, Forschung und Gebiete Ingenieur (Ausgabe A) 11 (6) (1940).
11. F.L. Levy, Int J Refrigeration 4 (1981) 223–225
12. M. Mattea, M.J. Urbicain, E. Rotstein, J Food Sci 51 (1) (1986) 113–115
13. V.R. Tarnawski, T. Momose, W. H. Leong, G. Bovesecchi, P. Coppa, Int. J. Thermophys., v. 30, pp.649-668 (2009), DOI 10.1007/s10765-009-0596-0, ISSN:0195-928X
14 F. Gori and S. Corasaniti, Journal of Heat Transfer, ASME 124 (6) (2002) 1001–1008
15. F. Gori, S. Corasaniti, W.M. Worek and W.J. Minkowycz, Theoretical prediction of thermal conductiv-ity for thermal protection systems, Applied Thermal Engineering 49 (2012) 124–130
16 F. Gori and S. Corasaniti, International Communications in Heat and Mass Transfer 47 (2013) 1–6 17. G. F. Bocchini: “The Influences of Porosity on the Characteristics of Sintered Materials”,
Reviews on Powder Metallurgy and Physical Ceramics, Vol. 2, No.4, 1985 p. 314-359
18. G. F. Bocchini, “The Influences of Porosity on the Characteristics of Sintered Materials”, SAE Technical Paper 860148, SAE International Congress and Exposition, Detroit, Michigan, February 24-28, 1986 19. S. Saritas, R. D. Doherty, A. Lawley: “Effect of Porosity of the Hardenability of PM Steels”,
The International Journal of Powder Metallurgy – Volume 38, NO.1, 2002, 31-40
20. G. F. Bocchini, A. Baggioli, B. Rivolta, G. Silva, P. Piccardo, M. R. Pinasco, E. Stagno: “Influence of Density and Surface/Volume Ratio on The Cooling Speed of Sinter-Hardening Materials. Part One: Numerical Analysis of Parallelepipeds”, PM World Congress, MPIF-APMI, Orlando (USA), 2002
21. G. F. Bocchini, B. Rivolta, G. Silva, M. G. Ienco, E. Stagno: “Influence of Density and Surface/Volume Ratio on the Cooling Speed of Sinter-Hardening Materials: Microstructure and Micro-hardness Distribution Inside Parallel-epipeds”, PM World Congress, MPIF-APMI, Orlando (USA), 2002
22. G. F. Bocchini, A. Baggioli, R. Gerosa, B. Rivolta, G. Silva; “Cooling Rates of P/M Steels”, APMI-MPIF, Int. J. of Powder Metallurgy, 40/5, Sept./Oct. 2004, p. 57-65.
23. W. B. James: “Microstructure Development”, EPMA Summer School, EPMA PM Summer School, Acqui Terme (Italy), 2008, June, 22-29
24. ASTM 1461-01, Standard Test Method for Thermal diffusivity of solids by the flash method, vol.37.05.
25. Cernuschi F., Lorenzoni L., Bianchi P., Figari A., The effects of sample surface treatments on laser flash thermal diffusivity measurements. Infrared Physics and Technology vol.43 pp.133-138, 2002 26. Parker W.J., Jenkis R.J., Butter C.P., Abbot G.L., “Flash method of determining thermal diffusivity heat
capacity and thermal conductivity”, J.Appl.Physics,32,1679-1684 (1961)
27. Maglic K.D., Taylor R.E., The apparutus for thermal diffusivity measurements by the laser pulse me-thod. In Compendium of Thermophysical Property Measurements Methods, vol.2, pp.281-314, 1992 28. S. Brandt, Statistical and Computational Methods in Data Analysis, North Holland Pub, Amsterdam, 1970 29. ISO GUM: “Guide to Expression of Uncertainties in Measurements”, ISO/IEC Guide 98-3:2008 30. P.Coppa, Giamberardini F., “Low Temperature Pyrometry (20-200°C) for Flash Method: Expedients in
Test Conduction and Data Processing”, Proc. of VII Convegno dell’A.I.P.T, Pisa, 21 settembre 2001, pp. 35-49
31. G. Bovesecchi, P. Coppa, “Thermal Diffusivity Measurements at High Temperature of SOFC Materials with the Flash Method”, Proc. of XIII Convegno Nazionale A.I.P.T., Trento, 21 settembre 2007, pp. 55-66, ISBN 13: 978-88-87380-62-0
32. S. M. Shelton: “Thermal Conductivity of Some Irons and Steels over the Temperature Range 100 to 500 °C”, Bureau of Standards Journal of Research, vol. 12, April 1934, U.S. Department of Commerce.