Alma Mater Studiorum – Università di Bologna
DOTTORATO DI RICERCA IN
DOTTORATO DI RICERCA IN SCIENZE MEDICHE
SPECIALISTICHE
Ciclo XXVIII
Settore Concorsuale di afferenza: 06/D2
Settore Scientifico disciplinare: MED 14
TITOLO TESI
Histological study on double line of intravenous Tacrolimus
infusion in SLA defined pig model
Presentata da:
Federico Zacchini
Coordinatore Dottorato
Relatore
Prof. Roberto Di Bartolomeo
Prof. Gaetano La Manna
INDEX
1 – ABSTRACT
5
2 – INTRODUCTION
6
2.1 - Calcineurin Inhibitors 6
2.1.1 – Acute CNI Nephrotoxicity 7
2.1.2 – Chronic CNI Nephrotoxicity 8
2.1.3 – Electrolyte Disturbance 10
2.1.4 – Histologic Diagnosis 11
2.1.5 – Systemic Levels of CNI 11
2.2 – Pig as Animal Model 12
2.2.1 – Pig as Animal Model for Transplant 13
2.2.2 – Swine Leukocyte Antigen 14
2.2.3 – Xeno-recognition of SLA molecules 16
2.3 – Pig Blood Groups 17
2.4 – Exosomes 18
2.4.1 – Exosomes Structure and Biogenesis 19
2.4.2 – Biological Function of Exosomes 20
3 – AIM OF THE STUDY
22
4 – METHODS
23
4.1 – Study Design 23
4.1.1 – Treatment Schedules Design 23
4.1.2 – Time Schedules Design 24
4.4 – Pathological and Clinical Investigations 27
4.5 – Cylex ImmuKnow Test 27
4.6 – Monitoring of Blood Tacrolimus Level 28
4.7 – Urine Collection 28
4.8 – Isolation of Urinary Exosomes by Ultracentrifugation 29
4.9 – Isolation of Serum Exosomes by Ultracentrifugation 29
4.10 – Electron Microscopy for Exosomes Identification 30
4.11 – Atomic Force Microscopy for Exosomes Identification 30
4.12 – Gel Electrophoresis and Western Blot 30
4.13 – Proteomic Characterization of the Exosomal Content 31
4.14 – OFFGEL 31 4.15 – Luminex Assay 32 4.16 – Pathological Anatomy 32 4.16.2 – Light Microscopy 32 4.16.2 – Electron Microscopy 33 4.16.3 – Immunofluorescence 33 4.16.4 – Immunohistochemistry 33 4.17 – SLA Typing 34
4.17.1 – Animal and Breeding for Homozygous Determination 34
4.17.2 – SLA typing by DNA sequencing 34
4.17.3 – DNA Extraction 35
4.17.4 – PCR and DNA sequencing 35
4.17.5 – Sequences Analysis 36
5 – RESULTS
38
5.1 – Clinical Parameters Results 38
5.2 – Pathological Anatomy Results 45
5.2.1 – Light and Electron Microscopy 45
5.2.2 – Periodic Acid-Schiff and Masson’s Trichrome Staining 47
5.2.3 – Immunohistochemistry 47
5.3 – Clinical Aspects 47
5.4 – Blood Group Typing 47
5.5 – Exosomes Results 49 5.5.1 – Exosomes Purification 49 5.5.2 – Exosomes Microscopy 51 5.5.3 – Proteomics 52 5.5.4 – Luminex Analysis 55 5.6 – SLA Typing 56
Pathological Anatomy Images 61
5 – DISCUSSION
67
6.1 – General Discussion 68
6.2 – Pathological Anatomy 70
6.3 – Blood Typing 71
6.4 – Characterization of the Exosomal Content 71
6.5 – SLA Typing 73
5 – CONCLUSIONS
75
ABSTRACT
1 – Abstract
The immunosuppressive therapy still remains the only therapeutic strategy to control excessive immune activation following renal transplantation, but remain the problems related to excessive immunosuppression and in particular the toxicity due to high doses of immunosuppressive drugs such as calcineurin inhibitors. The present study has the aim of documenting, in a porcine animal model, the histological damage from calcineurin inhibitors using incremental doses of Tacrolimus, achieved in a limited amount of time, until it reaches toxic blood concentrations. We perform the study under different condition, like oral administration, intravenous infusion and with or without kidney transplant. It is noted that the damage is early, predominantly vascular and that affects different organs in addition to the kidneys. We also observe that the functional damage underestimates the structural damage.
The search for non-invasive methods for the identification of biomarkers of nephrotoxicity and rejection, and to better characterize the inflammation status, led us to conduct analysis of the exosomal content, allowing us to observe the presence of serum cytokines which, although in low amounts, suggest a possible role of these in the inflammatory process mediated by exosomal vesicles.
Finally, following the genetic SLA typing for the determination of the donors and the recipients, in an accessory project, we got a controlled and stable colony of pigs with SLA defined in homozygosis through the coupling of specific pathogen free pigs (SPF) for DQB-1 and SLA-1 genes.
INTRODUCTION
2.1 - Calcineurin Inhibitors
Nowadays, renal transplantation is the best therapeutic option for end-stage kidney disease patients, but despite the evident amelioration of renal transplant results in the short and mid-term (5-years graft survival >90%) [Ojo et al., 2013], the outcomes in the long term are not yet fully satisfying. The main cause of graft loss is mainly due to the activation of host immune system against the allograft [Gastor et al., 2010; Sellarés et al., 2012]. The increased activity of immune cells causes an extensive parenchymal damage, leading to short- or long-term organ loss. Immunosuppressive therapy is still the only strategy to control immune activation, but the chronic use of these drugs can lead to severe complications due to an excessive immunosuppression, potentially giving rise to tumours, infections or high-dose drug toxicity.
Calcineurin inhibitors (CNI), represented in the clinical use of cyclosporine and Tacrolimus (TAC), are an important class of drugs used as immunosuppressants in the process of organ transplant or to treat certain kidney diseases or immune-mediated diseases. After their use, since the 80s, there has been a significant reduction in kidney transplant rejection episodes associated with improved survival of both patient and graft. Today, 94% of the kidney transplant recipients are discharged after transplantation with a CNI-based immunosuppressive regimen [Andreoni et al., 2007].
The immunosuppressive properties of cyclosporine and Tacrolimus result from inhibition of calcineurin, a calcium-dependent and calmodulin-dependent phosphatase. Intracellularly, these molecules bind to cyclophylin for cyclosporine and FKBP12 for Tacrolimus [Takahashi et al., 1989; Harding et al., 1989; Siekierka et al., 1989]. The competitive binding of cyclosporine-cyclophylin and tacrolimus-FKBP12 complexes to calcineurin, inhibits phosphatase activity of calcineurin. This inhibits the dephosphorylation and translocation of the nuclear factors of activated T-cells [Flanagan et al., 1991], which regulates IL-2 transcription and thus T-cell activation [O’Keefe et al., 1992]. Calcineurin is not T-cell specific, and inhibition of this pathway by cyclosporine and Tacrolimus gives rise to toxicity beyond immunosuppression [Liu et al., 2007].
However, their extensive use has shown side effects, both early and late, out of the kidney. In particular they can lead to acute CNI nephrotoxicity or chronic CNI nephrotoxicity. In literature it is not known the
relationship between acute and chronic renal damage in the absence of other possible factors, which influence renal function (hyperglycaemia, obesity, drugs, etc.).
2.1.1 - Acute CNI Nephrotoxicity
The acute nephrotoxicity is primarily due to hemodynamic and tubular toxicity mechanisms [Krejci et al., 2010]. The functional damage is secondary to vasoconstriction of the afferent arteriole [Murray eta al., 1985], mediated by the activation of the renal angiotensin-aldosterone system that induces an up-regulation of vasoconstrictor factors such as endothelin 1 and thromboxane, and simultaneously a down-regulation of vasodilator factors like prostacyclin, prostaglandin E2 and nitric oxide [Olyaei et al., 2001; Burdmann et al., 2003; Hortelano et al., 2000]. The marked vasoconstriction leads to hypoxic damage with the release of free radicals and superoxide anions [Diederich et al., 1994]. These superoxides decrease NO bioavailability that can lead to decreased vasodilation and unopposed vasoconstriction, which is a main mechanism of cyclosporine-induced hypertension and decreased GFR (Glomerular Filtration Rate) [Roullet et al., 1994]. The CNI also induce an increase both in vivo and in vitro of the levels of TGF-β (Transforming Growth Factor beta), cytokine able to promote, along with the endothelin 1, renal interstitial fibrosis through the extracellular matrix synthesis [Khanna et al., 2002]. In native kidneys, stimulating effects of cyclosporine on sympathetic nerve activity could play a role in the acute effects of cyclosporine by increased renal vascular resistance and secondarily decreased GFR [Zhang et al., 2000]. In transplanted kidney, which lack innervation, the sympathetic effects of cyclosporine were not observed [Hausberg et al., 2006]. The effects of cyclosporine on sympathetic nerve activity could be explained by the fact that calcineurin is ubiquitously expressed in neural tissue [Hemenway & Heitman, 1999; Naesens et al., 2009].
At tubular level, in response to the action of glomerular vasoconstriction, can observe the appearance of isometric vacuolization of the cytoplasm of tubular cells characterized by swelling of the endoplasmic reticulum and increased of lysosomes [Mihatsch et al., 1985; Morozumi et al., 2004]. These structural changes are the consequence of hypoxic/ischemic damage by the reduction of renal plasma flow [Du et al., 2009]. Moreover, the acute nephrotoxicity of CNI with renal dysfunction associated to the graft, is often present in absence of these morphologic lesions. In contrast, isometric tubular vacuolization associated with the use of cyclosporine and Tacrolimus can be found in the absence of renal dysfunction. The isometric
tubular vacuolization is not associated with progression to chronic CNI nephrotoxicity [Naesens et al., 2007a].
Furthermore, inclusion bodies are also sometimes noted in the tubular cytoplasm in association with the cyclosporine use [Kim & Suh, 1995]. Most of that are giant mitochondria, but it is currently not known what triggers their formation, but it is clear that cyclosporine has important effects on mitochondrial functioning [Simon et al., 2003].
Finally, thrombotic microangiopathy can occur after renal transplantation as result of many factors, including ischemia-reperfusion endothelial injury, renal infections, rejection, malignancies, and various drugs. The use of the CNI is clearly an important risk factor for post-transplant thrombotic microangiopathy [Ponticelli, 2007]. Furthermore it has been suggested that cyclosporine and Tacrolimus can increase platelet aggregation and activate prothrombotic factors.
2.1.2 - Chronic CNI Nephrotoxicity
The chronic damage associated with CNI therapy was first demonstrated by Myers el al., showing that cyclosporine not only induces reversible alterations in renal vascular resistance, but is associated with irreversible damage of the renal architecture [Myers et al., 1984].
Irreversible changes to every component of the renal parenchyma would be at the basis of chronic nephrotoxicity, whose relationship with the acute injury is not clear. The three kidney compartments can be irreversibly injured by CNI: vessels (arteriolar hyalinosis), tubulointerstitium (tubular atrophy and interstitial fibrosis), and glomeruli (thickening and fibrosis of Bowman’s capsule and focal segmental or global glomerular sclerosis). These structural changes could be the outcome of the constant hemodynamic stimulus and tubular toxicity [Naesens et al., 2007a]. From the histopathological point of view they affect all of the kidney compartments. Characteristic morphological aspect is the presence of granular hyaline deposits in the tunica media of the afferent arterioles, defined arteriolar hyalinosis, which is always observed in chronic CNI nephrotoxicity [Nankivell et al., 2004]. Arteriolar hyalinosis is characterized by the replacement of necrotic smooth muscle cells by focal or circular lumpy protein (hyaline) deposits at the periphery of the wall of afferent arterioles. Arteriolar hyalinosis is commonly regarded as irreversible [Naesens et al., 2007a].
The finding of segmental glomerular sclerosis is very common and reflects the damage of glomerular hyperfiltration. In more advanced stages chronic nephrotoxicity the severe arteriolar hyalinosis contributes to glomerular sclerosis and the tubular degeneration. If not recognized and treated promptly, after these histopathological aspects corresponds clinically progressive decline in kidney function values and the onset of high blood pressure with possible progressive loss of the graft. As mention before, the use of CNI can lead to the release of free radicals and superoxide anions, as a result of renal vasoconstriction that can lead to renal hypoperfusion and hypoxia, and subsequently to the formation of reactive oxygen species or free radicals, which then causes cellular injury and promotes cellular death by apoptosis [Longoni et al., 2001].
Calcineurin inhibition may also directly activate apoptosis genes and increase apoptosis in tubular and interstitial cells, thus inducing tubular atrophy [Servais et al., 2008; Shihab et al., 1999]. Moreover, inflammation with macrophage infiltration has been associated with chronic CNI nephrotoxicity [Young et al., 1995].
The production of TGF-β, that is directly upregulated by cyclosporine, induces the development of focal interstitial fibrosis and tubular atrophy through the synthesis of extracellular matrix proteins, inhibition of their degradation and the activation of the migration of mesenchymal epithelial cells [Border & Noble, 1997; Wolf, 2006].
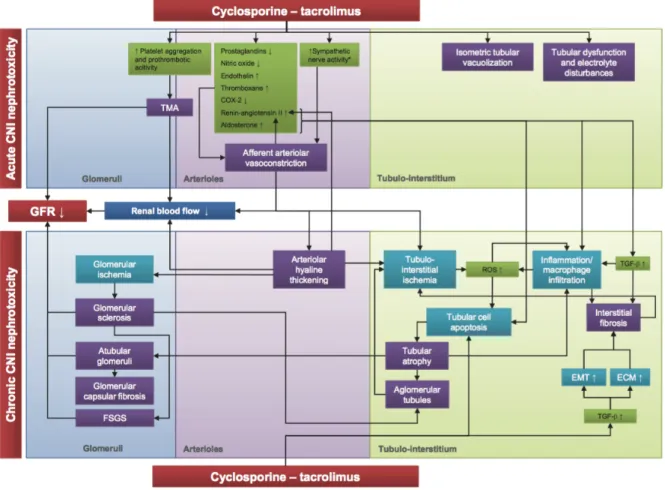
Figure 1: Schematic representation of the etiology of calcineurin inhibitor nephrotoxicity. CNI, calcineurin inhibitor; TMA, thrombotic microangiopathy; EMT, epithelial mesenchymal transition; ECM, extracellular matrix; GFR, glomerular filtration rate; FSFS, focal segmental glomerulosclerosis; ROS, reactive oxygen species. Figure from Naesens et al., 2007a.
2.1.3 - Electrolyte Disturbance
As we already mentioned, the use of CNI impact renal hemodynamics and structure, but lead to tubular functional alteration and ion homeostasis disturbance like hyperkalemia, hypomagnesemia and magnesium wasting, hyperchloremic metabolic acidosis (distal tubular acidosis), and hyperuricemia [Heering & Grabensee, 1991; Clive, 2000; Alexander et al., 2008]. The hyperkalemia induced by CNI is likely multifactorial and refers to inhibitory effects on Na+-K+-ATPase in collecting ducts [Lea et al., 1994] and to
distal tubular acidosis. Furthermore, in 75% of patients treated with cyclosporine, there is evidence of decreased numbers of mineralcorticoid receptors that lead to hyperkalemia and metabolic acidosis as a result of aldosterone resistance [Heering et al., 2004]. The hypomagnesemia relating to reduce expression of
magnesium transport and contributes to magnesium wasting. Finally, it was shown that cyclosporine indirectly opens ATP-sensitive K+ channels by inhibition of calcineurin, which could contribute to the
CNI-associated hyperkalemia [Wilson et al., 2000].
2.1.4 - Histologic Diagnosis
There are a lot of difficulties to have good diagnosis that can distinguish between CNI-related nephrotoxicity and other injury phenomena. Different pathologies share the same clinical picture of gradual decrease in renal graft function and lead to nonspecific tubular atrophy, interstitial fibrosis and loss of renal allograft [Farnsworth et al., 1984]. Tubular vacuolization and progressive arteriolar hyalinosis, that can be considered more specific for CNI nephrotoxicity, are also seen secondary to other processes. To making a positive diagnosis of CNI nephrotoxicity is mandatory to combine several histologic features and exclusion of other processes that lead to similar histologic findings. The study of CNI nephrotoxicity in native kidneys may be less troublesome [Ojo et al., 2003], but it should be kept in mind that an essential difference between native kidneys and transplanted kidneys is the absence of innervation of transplanted kidneys; this innervation plays a prominent role in the regulation of renal vascular resistance. Therefore, the consideration done for the native kidney may not be true for the transplanted kidney and should be interpreted cautiously.
2.1.5 - Systemic Levels of CNI
The main issue after renal transplantation is to maintain a reasonable balance between efficacy, to avoid rejection, and toxicity of the immunosuppressive agents used. Al lot of studies correlate rejection and concentration-toxicity to CNI dosage [Laskow et al., 1996; Kershner & Fitzsimmons. 1996]. The dosage used in these studies was very broad (5 to 25 ng/ml), because Tacrolimus is drug with narrow therapeutic windows. Maintaining the concentrations of the CNI within preset target ranges may be complicated by the high inter- and intraindividual pharmacokinetic variability [Staatz & Tett, 2004], due to the high variability in absorption, distribution, metabolism and elimination of these compounds. Also the intestinal absorption of Tacrolimus is low, variable and influenced by concomitant ingestion of food, diabetes, uremia, ethnicity, gastrointestinal problems and diarrhea. After absorption, Tacrolimus and cyclosporine is distributed in erythrocytes, and is bound to plasma proteins like albumin, globulines and lipoproteins. Metabolism of CNI
occurs mainly in the liver and the gastrointestinal tract and then can be almost completely eliminated in the bile [Fahr, 2003]. This high variability in the pharmacokinetics and concentration-toxicity associations suggests that therapeutic drug monitoring of CNI is useful. Despite that routine monitoring of cyclosporine and Tacrolimus is common practice, the therapeutic application of such monitoring has not prevented kidney transplant recipients from developing acute rejection, or avoiding nephrotoxicity, which is virtually universal by 10 years after transplantation [Nankivell et al., 2003]. Today, is not clear whether the rate of development of lesions that can be associable to chronic CNI nephrotoxicity, correlate to the dose of cyclosporine or Tacrolimus therapy. Some studies suggest association of chronic CNI nephrotoxicity lesion with higher CNI exposure [Nankivell et al., 2004; Nakamura et al., 2007], other studies have found association of lower levels of CNI with higher increase in chronic tubulo-interstitial damage [di Paolo et al., 2004; Naesens et al., 2007b].
2.2 – Pig as Animal Model
The pig is very similar to humans in terms of anatomy, genetics and physiology and can vary from miniature to large breeds. Choosing of the right breed and age allows various surgical and non-surgical procedures used in human medicine including catheterization, heart surgery, valve manipulation, endoscopy and broncho-alveolar lavages. These procedures are particularly difficult or impossible to perform in many animal models including rodents [Meurens et al., 2011]. The anatomy of the pig is comparable to human; for example the size of kidneys is very similar to human kidneys [Ibrahim et al., 2006]. Moreover, pigs have also multirenculate and multipapillate kidneys with true calices. In terms of genetics, the size and the composition of the porcine genome are comparable to those of humans [Hart et al., 2007]. Pigs are also remarkably similar to humans in terms of physiology. Both species are omnivorous and their organs generally share common functional features [Swindle et al., 2012]. Highlighting these similarities, pig-to-primate organ transplantation models are being used successfully [Cooper et al., 2016].
2.2.1 – Pig as Animal Model for Transplant
Study and comprehension of organ transplant biology need the employment of animal models, and several works have been realized organs transplant on different kind of animals, such as mouse [Skoskiewicz et la., 1973; Ge & Gong, 2011], rats [Zhu et al., 2009], swine [Utsugi et al., 2001], dogs [Mathews et al., 2000] and non-human primates [Vial et al., 2000]. For studies that involve analysis of Major Histocompatibility Complex (MHC) compatibility for organ transplantation, it is preferable to use mid-size animal models that share similarity to human, like pigs, instead of murine or rat models, even though the latter are easier to handle. For example, pigs have high percentages of neutrophils in the peripheral blood like humans (50-70%) in contrast to rodents [Fairbairn et al., 2011]. The swine immune system more closely resembles humans for more than 80% of analysed parameters, whereas mice were more similar to humans in less than 10% [Dawson, 2011]. Furthermore, rodents are not suitable for kidney transplant experiments and immune studies because, unlike pigs, they do not constitutively express class II MHC antigens on vascular renal endothelium [Natali et al., 1981]. Swine are considered as a suitable model for transplant biology studies also because MHC organization is well established and controlled. In particular, they were extensively used to evaluate MHC matching for tolerance or immunological activation against the graft [Madariaga et al., 2015; Loss et al., 2007]. The advantage of regular pigs is that growth rate and attainment of a proper weight is faster. Moreover, the creation of a new herd with well-defined characteristics in SLA (Swine Leukocyte Antigen) loci could be useful for many other applications than transplantation, i.e. studies on resistance to infectious diseases that is correlated to SLA.
Also there are few studies that have investigated the mechanisms of nephrotoxicity by CNI in animal models [Utsugi et al., 2001; Cibulskyte et al., 2005]. Most of the studies that employed small rodents have not been able to document the same damage from CNI highlighted in man; on the contrary, the pig is suitable as an animal model affine to the man thanks to the size of the organs and the similar cardiovascular and renal physiology [Bollen et al., 1997; Terris, 1986].
There are some differences between man and pig, in particular in the pharmacokinetics of the molecules with immunosuppressive action: Frey et al. have documented the need to employ doses of steroid and CNI up to six times more in the pig, either orally or intravenously, compared to man, to achieve the same blood levels and accordingly the same pharmacological action [Frey et al., 1988]. Finally it is to be considered in the
animal the presence of endemic and frequent infections in swine that can contribute to kidney damage especially in immunosuppressed subjects.
2.2.2 – Swine Leukocyte Antigen
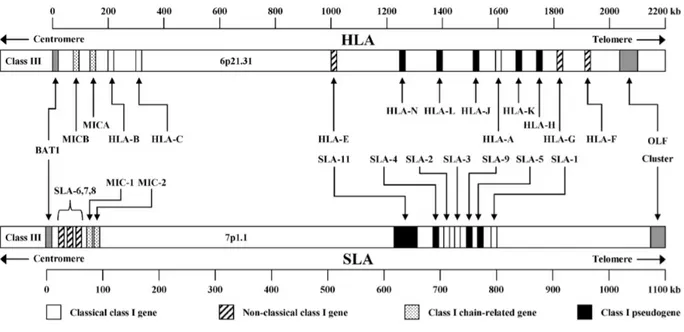
Like previously said, in recent years is increased the interest in pigs as an ideal model for large animals [Lunney, 2007], especially as animals adapted to xenotransplantation of tissues or organs [Dehoux & Gianello, 2007]. Following these considerations, knowledge of the genetic background of the major histocompatibility complex (MHC) that contains the swine leukocyte antigens (SLA) is very important. The SLA genes, that encoding for the MHC molecules, are highly polymorphic [Smith et al., 1995]. This important evolutionary feature adapts to their indispensable role in the immune response of the pig [Potts & Slev, 1995], as it allows the MHC to recognize an almost unlimited number of non-self antigens. The complex of SLA genes is one of the most gene-dense regions of the pig genome and mapped on chromosome 7, spanning the centromere, and are divided into three regions: class I, class II and class III (figure 2a-2b).
Figure 2a: Comparative genomic organization of the human and swine major histocompatibility complex class I region. The swine map is based on fully sequenced haplotype Hp-1.1 [Renard et al., 2006]. Notwithstanding the presence of numerous class I genes, only SLA-1, SLA-2 and SLA-3 are functional and constitutively expressed. Figure from Lunney et al., 2009.
Figure 2b: Comparative genomic organization of the human and swine major histocompatibility complex class II region. The swine map is based on fully sequenced haplotype Hp-1.1 [Renard et al., 2006]. Figure from Lunney et al., 2009.
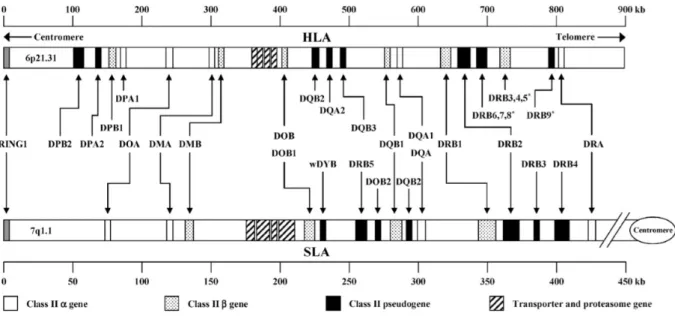
The functional class I genes are the constitutively expressed SLA-1, SLA-2 and SLA-3 genes, while others are pseudogenes [Lunney et al., 2009]. In fact, there is evidence that some SLA haplotypes possess a duplicate SLA-1 locus [Ho et al., 2009; Tanaka-Matsuda et al., 2009]. Classical SLA class I genes (the functional ones) consist of eight exons (figure 3): exon 1 encodes the leader sequence, exon 2–4 encode extracellular domains, exon 5 the transmembrane domain, and exon 6–8 the cytoplasmic domain [Satz et al., 1985]. The functional SLA class I genes code for 45 kDa transmembrane glycoprotein, consisting of three extracellular domains, α1, α2 and α3 [Blicher et al., 2005; Zhang et al., 2009]. This is the domain that plays the most important role in immune recognition. Precisely, the α1 and α2 domains form the peptide-binding groove, whereas the α3 domain is a binding site for the CD8 co-receptor. These proteins are constitutively expressed on the surface of all nucleated cells [Lunney et al., 2009].
The class II genes are discriminated in those for alpha and beta chains of antigens for the SLADR, DQ, -DM, and -DO [Lunney et al., 2009]. There are several pseudogenes for the genes of the beta chain of SLA class II haplotypes, but have not been identified pseudogenes for DQB-1. The class II genes α chain and β chain have essentially the same molecular structure (figure 3) except for additional exons encoding the cytoplasmic domain [Gustafsson et al., 1990]. The expressed SLA class II antigens (DR an DQ) are found primarily on the surface of macrophages, B cells and dendritic cells [Chamorro et al., 2000; Summerfield et
al., 2003]. The SLA class II antigens are heterodimeric proteins, which consist of an α chain non-covalently bound to a β chain, and together form the peptide-binding groove.
Figure 3: Schematic molecular organization of the SLA genes. Exons are represented by the grey ovals and introns by lines. Gene length is approximate based on fully sequenced haplotype Hp-1.1 [Renard et al., 2006]. Figure from Lunney et al., 2009.
2.2.3 – Xeno-recognition of SLA Molecules
The uses of pig xenografts for human transplantation have shown that there is a direct recognition of the SLA molecules from human cells. In particular SLA class II antigens are recognized directly by human T-cells [Yamada et al., 1995; Shishido et al., 1998], which may mediate the xenoimmune response. Natural killer cells [Sullivan et al., 1997] and CD8+ [Shishido et al., 1997] can recognize class I antigens and can lead to the killing of porcine cells and the destruction of the organ. In addition, the SLA protein can inhibit the cytotoxicity mediated by human natural killer cells [Kwiatkowski et al., 1999]. Studies of antibodies against SLA antigens have shown that can induce acute rejection, and the antibodies of the human leukocyte antigen (HLA) class I of sensitized patients cross-react with the antigens of the SLA class I [Naziruddin et al., 1998]. These xeno-recognitions suggest that there is high structural homology between the human and swine MHC proteins.
2.3 – Pig Blood Groups
There are 16 recognized porcine blood groups and the S gene that affects blood group AO expression [Andersen, 1962; Simon et al., 2003]. The blood group factors are defined by antisera derived from sensitized pigs, but five of the blood groups have at least one antigen that is not detectable with current antisera and thus may have a “blank” phenotype. Most of these blood group antigens are present only in erythrocytes, but there is evidence that some group antigens are distributed on other leukocytes or tissues [Hala, 1967]. The gene products have been identified for only four of the blood groups.
The pig is known to have AO blood group system, comparable with the ABO blood group system of humans, for which scientific community have focused his efforts, even for the interest in defining of blood group for xenograft studies. The major erythrocyte antigen is A substance which presence was confirmed in the 1950s and 1960s [Sprague, 1958; Rasmusen, 1964]. Also O groups have also been described [Andresen, 1962]. Pigs do not have a B blood group antigen. In pigs now we can recognize four phenotypes: A, Aw (weak
A), O and blank. The O phenotype can react with anti-s antisera (equivalent to human anti-H substance), while lack of reactivity with either A or anti-s indicated the blank phenotype. Most A phenotyping is now done using monoclonal antibodies that are commercially available for human blood typing or using microtyping cards [Martínez-Alarcón et al., 2010], because of the similar structure of pig A substance to that of human A substance [Sako et al., 1990]. This method makes it possible to identify pigs with A phenotype but does not discriminate O or blank phenotype, even using available monoclonal anti-H antibodies.
Erythrocyte antigen A (EAA) alleles located on chromosome 1 are encoded by UDP-N-acetylgalactosamine transferase, which adds the terminal sugar to create pig A substance [Ellegren et al., 1994]. The blood groups O has a major deletion in EAA alleles, thus, none of the functional enzymes are produced [Yamamoto & Yamamoto, 2001]. Thanks to these knowledge and genetic information, Nguyen et al. developed a multiplex genotyping method for the porcine AO blood group gene [Nguyen et al., 2011]. This method is based on a multiplex PRC to screen gene exons to find the deletion carried by the O group allele (figure 4).
Figure 4: The exon/intron structure of the porcine AO blood group gene allele A (a) and characterization of the deletion junction involved in allele O (b). (a) The rectangles and horizontal lines indicate exons and introns, respectively. The numbers indicate the size (bp) of exons and introns. (b) Ten nucleotides each before and after the starting point of the deletion are shown. Figure from Nguyen et al., 2011.
2.4 – Exosomes
Many studies have focused their attention on some particular structures of cellular origin, called the exosomes, involved in the mechanisms of communication between cells. The exosomes are microparticles of endocytic origin that are released into the extracellular microenvironment by several cell types, like dendritic cells [Zitvogel et al 1998], macrophages [Théry et al., 2009], lymphocytes [Simons & Raposo, 2009], epithelial [Lin et al., 2005] and tumour cells [Wolfers et al., 2001]. They currently have been identified in many cell types in culture as well as in different biological fluids including blood [Caby et al., 2005], urine [Pisitkun et al., 2004], saliva [Ogawa et al., 2011], breast milk [Admyre et al., 2007] and cerebrospinal fluid [Vella et al., 2007]. This ubiquitous characteristic hypothesize that it is a physiological mechanism common to all cells. Due to their nature, they create a microenvironment inside them that represents only a portion of the cytosolic proteins and nucleic acids, a feature that makes them so interesting for studying.
2.4.1 – Exosomes Structure and Biogenesis
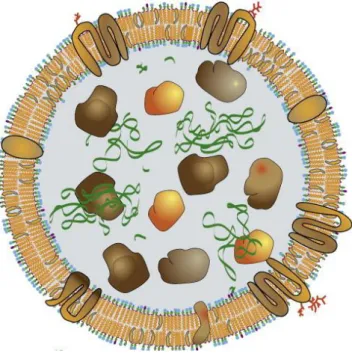
Exosome are approximately 30-100 nm in diameter and present a cup-shaped morphology at electron microscopy [Heijnen et al., 1999]. Their topology is the same as the cell from which originate, meaning that the outer side of the vesicle, from the point of view of structure and composition, corresponds to the outer side of the cell, while the internal corresponds to the cytosol. Exosomes contain many proteins some of which are common to all exosomes such as transport and fusion proteins (annexins, flotillin), the tetraspanins (CD9, CD24, CD63), heat shock protein (Hsp70, Hsp90), cytoskeletal proteins and proteins involved in the biogenesis of multivesicular bodies (Alix, TSG101) [Théry et al., 2001; Simons & Raposo, 2009]. Most of that are good markers for exosome detection, because expressed on multivesicular bodies but almost absent on plasmatic membrane. They also contain a number of proteins that are derived from the cytosol of the cell of origin. The lipid composition refers to lipid rafts [Subra et al., 2008], whereas the composition of nucleic acids is enrichment of microRNAs and mRNA [Valadi et al., 2007]. The DNA was found only in a few studies, as it notoriously is absent or present in small amounts in exosomes [Thakur et al., 2014].
The biogenesis of exosomes derived from endosomal maturation pathway [Lakkaraju et al., 2008]: starting from the mono-ubiquitinated membrane proteins, they are invaginated through vesicles called early endosomes. From here they mature in late endosomes that can come back to the plasma membrane, allowing the recycling of membranes, or join into other endosomes and undergo a further process of invagination, leading to the formation of multivesicular bodies. It’s during this process that these vesicles may introduce in their lumen cytoplasmic components. Finally the multivesicular body may terminate in a lysosome, degrading its content, or fuse with the plasma membrane resulting in the release of the vesicles under the name of exosomes [Théry et al., 2002].
Figure 5: Simplification of the structure and composition of the exosome Inside there are proteins and nucleic acid. The membrane contain cholesterol and phospholipids and membrane proteins.
2.4.2 – Biological Function of Exosomes
The exosomes, following their release into the extracellular space, they can spread in the environment or in the microcirculation and act as active biological signals. Their biological functions ranging from regulating the immune response [Théry et al., 2009], to a role in apoptosis and angiogenesis [Janowska-Wieczorek et al., 2005], inflammation [van Niel et al., 2001; Prado et al., 2008], morphogenesis [Beckett et al., 2013] and coagulation [Heijnen et al., 1999], as well as in the spread of oncogenes by exosomes secreted by cancer cells [Parolini et al., 2009; Hood et al., 2011], or diffusing prions [Vella et al., 2007] and viruses from cell to cell [Pegtel et al., 2011]. All these features show that the predominant role of exosomes may be intercellular communication.
Thanks to these characteristics, exosomes appear to be a means of different communication compared to the more well-known methods, such as the autocrine, paracrine, endocrine, exocrine and synaptic, which are based purely on the interaction of single molecule-receptor. Because of his structure and composition, exosome allows the diffusion of a more complex message, in terms of quantity of information, due to its nature of biomolecules container, that allowing to obtain both specific and different targets, offering therefore more extensive response, both in the number of cells and type of response, such as growth, division, survival
and apoptosis. It has been demonstrated that exosomes play a role in the regulation of immune response; animal studies highlighted a role in tolerance induction through the decrease in the production of pro-inflammatory cytokines and in the proliferation of regulatory T-cells [Li et al., 2012]. Moreover, it seems that exosomes contain mRNA and miRNA involved in modulation of immune system [Montecalvo et al., 2012], as it was demonstrated that mRNA could be translated into proteins by target cells [Valadi et al., 2007] and miRNA can influence cells response [Mittelbrunn et al 2011; Montecalvo et al., 2012].
In recent years exosomes have aroused great interest in the scientific community, especially in regard to the search for biomarkers of pathological conditions; in particular in the field of clinical proteomics and miRNomics, where the search for biomarkers of disease in biological fluids, which is economical and effective for an early diagnosis of the disease, appears to be the desired goal. In this respect exosomes promise to be an excellent source thanks to the fact that they can give information about the cells from which they originate, thanks to their role as communication between cells, and the ability to analyse low abundance proteins that would otherwise be masked by the most numerous proteins present in bio-fluid from which they are derived. Furthermore, the obtaining of the bio-fluids often is performed by non-invasive or minimum invasive techniques to the patients, allowing greater comfort and less risk for them.
AIM OF THE STUDY
Main Project
The present study has set itself the aim of documenting, in an animal pig model, the histological damage by calcineurin inhibitors using incremental doses of Tacrolimus obtained in a limited interval of time, up to reach blood concentrations able to determine high toxicity. Furthermore the goal of the project is to evaluate the alterations in the immune system and the graft after kidney transplantation, through the analysis of classic soluble molecules present in the urine and plasma of SLA-defined pigs. Three treatment regimens will be set up: normal immunosuppression, high-dose and low-dose, in order to evaluate respectively the conditions of tolerance, drug-toxicity and transplant rejection.
Accessory Project
The pigs that underwent renal transplantation are also analysed in the exsosomal content to see some correlation to the inflammatory condition following the transplant and the Tacrolimus administration. The second objective is the development of a controlled colony of pigs with a defined SLA genes (SLA-1, DQB-1), through the coupling of specific pathogen free pigs (SPF).
METHODS
4.1 - Study Design
4.1.1 – Treatment Schedules Design
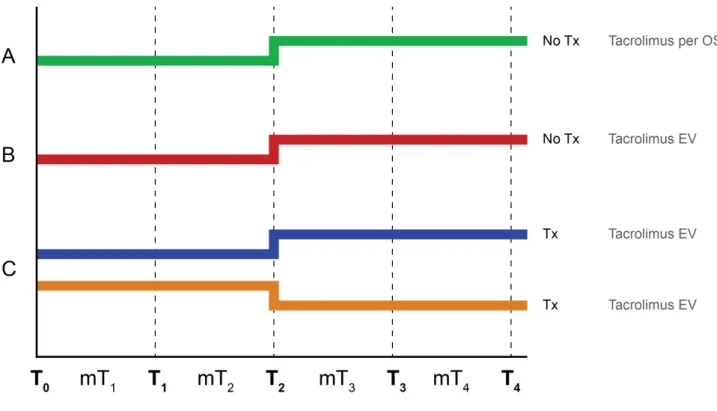
The figure 6 summarizes the study design, which consist in three different treatment schedules (table 1) with Tacrolimus (TAC) performed on a total of 7 pigs (table 2), plus two pig kidney donors.
FEATURES OF PIGS
Sex Female
Age 7 months
Mean body weight 79.6 ± 2.5 kg
Race 5 pigs purebred Large White (LW) and 2 hybrid Large White/Duroc (LW/D)
Table 1 –Features of pigs
TREATMENT SCHEDULES Group A Oral administration of TAC to a pig (A1) of LW breed, "not subject to renal transplantation" Group B Intravenous administration of TAC to two pigs (B1 and B2), both hybrids LW/D, "not following kidney transplantation" Group C Intravenous administration of TAC of 4 pigs (C1, C2, C3 and C4), LW breed, "kidneys transplant".
Table 2 – Treatment schedules
The animals defined as C1 and C2 have received grafts from genetically different pigs (LW/D) while the animals C3 and C4 from pigs genetically identical (LW), to have genetically different subjects, and then with greater biological complexity.
Figure 6 – Study design. Every group follow a therapeutic doses for the first two weeks. The last two weeks in the groups A, B and C-HD the dose of drug has been increased until reaching a toxic blood concentration of Tacrolimus. The group C-LD undergo a progressive reduction of the treatment up to the gradual suspension of the drug.
4.1.2 - Time Schedule Design
The study design, according to the scheme described above, includes the daily analysis of clinical chemistry parameters, the immunosuppressive state assessment using Cylex ImmunKnow procedure twice a week and histological examination of kidney tissues, at the beginning, at the 14th and 28th day (end of study) of the experimentation.
The study duration was 4 weeks and were considered the following times: T0: start of experimentation (drug administration); T1: 7 days from the start of drug administration; T2: 14 days from start of drug administration; T3: 21 days from start of drug administration;
The weekly average values of the studied parameters have been calculated for each animal group: MT1: mean until T1: corresponds to the time interval between T0 and T1 (first week); MT2: mean until T2: interval between T1 and T2 (the second week);
MT3: mean until T3 interval between T2 and T3 (third week); MT4: mean until T4: interval between T3 and T4 (fourth week).
In order to reach a growing blood Tacrolimus level we design a progressive administration of oral or intravenously immunosuppressive drug. For the groups A and B we wanted to reach toxic blood concentration of TAC over four weeks. For the group C we decided to use two different regimens: for each pair of pigs, the first two week was administered a immunosuppressive drug to reach the therapeutic range for immunosuppression. The following two weeks, in one pig the dose of drug has been increased until reaching a toxic blood concentration of TAC (Group C “ High Dose” – HD). The other pigs undergo a progressive reduction of the treatment up to the gradual suspension of the drug (Group C “ Low Dose” – LD).
The therapeutic range for adequate immunosuppression resulted between 30-40 ng/mL of Tacrolimus, as described by Utsugi and collaborators [Utsugi et al., 2001]. The toxicity was achieved by administration of the drug to higher levels.
Are considered input data:
1) Tacrolimus administration (oral/ intravenously).
2) Blood Tacrolimus level.
Are considered output data:
1) Blood and urine samples Blood samples: haemoglobin (g/dL), white blood cells (103/mmc), blood
creatinine (mg/dL); urine samples: urine proteins (mg/dL), urine sodium (mEq/L), urine magnesium (mEq/L) all compared with urine creatinine (mg/dL).
2) Lymphocytes Evaluation of the CD4+ T lymphocytes activation for the determination of cell-mediated immunity with Cylex ImmuKnow test.
3) Biopsies Biopsies of native kidney and also on graft in group C.
The blood samples and urine were performed daily and represented as average values in the MT1, MT2, MT3 and MT4.
The Cylex Test was performed 2 times per week. Biopsies of native kidney and graft were performed whenever possible at T0, T1 and T2, T4. The last biopsies coincided with the necropsy of the subjects and the sampling of tissues of interest. The collection of urine and blood for the extraction of the exosomal vesicles was performed 3 times per week.
4.2 - Surgical Technique
The pigs were catheterized to the outer right jugular vein for the intravenous infusion of the immunosuppressive drug and the left external jugular vein for blood sampling. This has prevented the contamination problems of the drug during the sampling. The urinary biochemical parameters were obtained through bladder catheter and ureter nephrostomy catheter in the transplanted pigs. The appropriate dose of intravenously Tacrolimus over the 24 hours, was administered using elastomeric pumps (Easypump 60 mL/h, B/Braun) (Prograf 5 mg/mL, infusion solution, Astellas) in the jugular vein. The test ended after 28 days with complete necropsy and sampling of kidney and other organ tissues with standardized methods.
4.3 - Pigs Therapy
Because of oral administration, for A1 pork it was not possible to reach toxic levels of blood Tacrolimus for the reduced compliance. This situation has arisen from the 3rd week.
In B and C groups pigs were permitted to reach toxic levels with intravenous administration of TAC. During the study the pigs were supported with fluid intermittent therapy at 1-2 mL/kg/h with sodium chloride 0.9% or ringer lactate solution, infused through the vascular access of the intravenous catheter. For the pigs of group C, the day before renal transplantation was administered antibiotic therapy based on
ampicillin-sulbactam intravenously. Anaesthetic therapy involved the use of ketamine, midazolam, eptadone, atropine, sodium pentothal. Assisted ventilation was performed with the animal paralyzed and isoflurane to 2-4% in air. The heat loss during the surgery has been countered by the use of heated mat and the utilization of the infusion liquid at body temperature. In the first week after transplantation was administered subcutaneously calciparine.
4.4 - Pathological and Clinical Investigations
For the blood count, serum and urinary clinical chemistry, were performed a serial of blood and urine samples. Urinary chemistry was performed after the urinary routine analysis, which includes the evaluation of the specific weight, chemical and physical investigation with dipstick and microscopic evaluation of the sediment.
The blood count was performed using the automated system SIEMENS ADVIA 2120 (manufacturer: ADVIA 2120, Siemens Healthcare Diagnostics, Tarrytown NY, USA), set for the swine. The examination was completed by an evaluation of the blood smear on a slide under a light microscope.
The chemical analysis were performed using the automated analyser Beckman Coulter/Olympus AU400 with dedicated reagents of the same manufacturer (manufacturer: AU 400, Olympus/Beckman Coulter, Brea, CA, USA) and using validated methods for the swine.
4.5 - Cylex ImmuKnow Test
To measure the activation of T lymphocyte we performed the Cylex ImmuKnow test that allows determining the intracellular quantity of ATP of lymphocytes. The test requires a whole blood sample of the animal treated with TAC to recover the lymphocytes. The sample remains intact for 30 hours at room temperature after sampling. Whole blood, collected into tubes containing heparin, is diluted 1:4 with 100 μL of Rosewell Park Memorial Institute Medium (RPMI). Sample was incubated in quadruplicate for 15-18 hours with or without 25 μL of phytohemagglutinin-L (PHA) 2.5 μg/mL in an incubator at 37°C and 5% CO2. Subsequently, the CD4+ T cells stimulated and unstimulated were selected in the wells using magnetic
beads coated with monoclonal antibodies (Dynabeads, Dynal, Oslo Norway) and a powerful magnet (Cylex Magnet Tray 1050, Cylex Inc. Columbia, MD). The conjugation of the monoclonal mouse anti-pig CD4
antibody and magnetic beads was performed using Dynabeads Antibody Coupling kit (Life Technologies, Dynal). After washing of the CD4+ lymphocytes, it was added a reagent able to lyse the cells in order to determine the release of intracellular ATP. Then, a mixture of luciferin/luciferase was added to the cell lysate, and after 30 minutes the level of bioluminescence was measured with a luminometer. The amount of emitted light (maximum emission at 562 nm) is compared with a calibration curve generated with ATP calibrators (0, 1, 10, 100, or 1000 ng/mL). The ATP concentration (ng/mL) in each sample is calculated from the calibration curve using an Excel program provided by Cylex. The level of the animal's immune response is assessed according to the amount of ATP produced.
4.6 - Monitoring of Blood Tacrolimus Level
The quantitative analysis of the TAC on blood samples collected on EDTA tubes was performed with an high performance liquid chromatography tandem mass (LC/MS/MS) as previously described [Meinitzer et al., 2010].
A sample of 100 μL of blood was deproteinized with 200 μL of a solution containing zinc-sulfate eptahydrate and methanol in ratio 1:4. The sample was centrifuged at 12.800 rcf for 12 minutes and 200 μL of supernatant was transferred into plate. Calibrators and controls (at known concentration) were treated in the same way. 15 μL of each sample was injected into the analytical system. The two-dimensional chromatography includes a first step of online sample purification on polymer column Poros R1/20, and a second step of chromatographic separation on reversed phase column Luna Phenyl-Hexyl 50x2.1. The analytes were ionized using electrospray positive ESI source by capturing NH4+ and identified based on their mass to charge ratio.
4.7 - Urine Collection
Urine was collected from catheterized non-transplanted pigs and transplanted pigs directly in a sterile container added with protease inhibitor mixture (P8340, Sigma-Aldrich). Immediately after the collection urine was centrifuged at 3000 rcf for 30 minutes at 4°C. The supernatant was saved and stored at -80°C.
4.8 - Isolation of Urinary Exosomes by Ultracentrifugation
Urine was thawed and centrifuged at 17.000 rcf for 20 minutes at room temperature to remove urinary sediment including whole cells, large membrane fragments and other debris. The supernatant was saved and the 17.000 rcf pellets were suspended in an isolation solution (250 mM sucrose, 10 mM triethanolamine, pH 7.6) followed by incubation with DTT (final concentration of 200 mg/mL) at 37°C for 5–10 minutes. When the pellets were completely solubilized it were centrifuged again at 17.000 rcf for 20 minutes at room temperature. The two supernatants from the 17.000 rcf spins were pooled and ultra-centrifuged at 200.000 rcf for 1 hour at room temperature (Beckman XL-70 ultracentrifuge; Beckman Coulter, Rotor: 70.1 Ti; Beckman Coulter). The exosomal fraction was washed with isolation solution and ultra-centrifuged again at 200.000 rcf for 1 hour at room temperature. Pellets were solubilized in 1:2000 of buffer depending on usage. For microscopy study the pellets were solubilized in PBS, for proteomics study were solubilized in lysis buffer (RIPA buffer or REB II buffer) with protease inhibitors, and then stored at -80°C.
4.9 - Isolation of Serum Exosomes by Ultracentrifugation
The serum was obtained from whole blood with a centrifugation at 3000 rcf for 15 minutes at 4°C. The serum was used fresh or stored at -80°C. The serum, fresh or thawed, was centrifuged at 1500 rcf for 15 minutes at 4°C to remove cell debris. The supernatant was saved and centrifuged at 17.000 rcf for 20 minutes at 4°C. The 17.000 supernatant was filtered with 0.22 μm filter. The filtrated solution was ultra-centrifuged at 200.000 rcf for 1 hour at 4°C (Beckman XL-70 ultracentrifuge; Beckman Coulter, Rotor: 70.1 Ti; Beckman Coulter). Pellets were washed with PBS and ultra-centrifuged again at 200.000 rcf for 1 hour at room temperature. Pellets were solubilized in 1:2000 of buffer depending on usage. For microscopy study the pellets were solubilized in PBS. For proteomics study the exosomal fraction was first solubilized in PBS and then albumin was depleted with affinity removal column (Agilent Human 14 Multiple Affinity Removal System Spin Cartridges) to remove the proteins co-precipitated with the exosome purification process. The depleted exosomes were concentrated with Agilent Concentrators Spin 5K MWCO in a minimum volume of PBS and then stored at -80°C.
4.10 - Electron Microscopy for Exosomes Identification
Exosomal pellets were solubilized in PBS and then quantified with Bradford Assay (Biorad). 10 μg of exosomal protein were applied to formvar-nickel grids for 60 minutes. After washing with PBS the sample was fixed with glutaraldehyde 2.5% for 10 minutes. After washing membranes underwent negative staining with 0.5% uranyl acetate and incubated for 15 minutes. After that the sample was air-dried for 5 minutes. After drying, the grids were examined with an electron microscope operated at 60 kV.
4.11 - Atomic Force Microscopy for Exosomes Identification
The Atomic Force Microscopy (AFM) analysis were performed with the atomic force microscope NT-MDT (Smena Nova, Moscow, Russia). The analysis were conducted in dry, semi-contact mode in the following conditions: scanning speed 0.5 Hz, NSG11 golden silicon probes (NT-MDT) with tips of diameter of 10 nm, the cantilever with the resonance frequency of 115-325 Hz. The images (512 x 512 pixels) have been developed with the software Gwiddion 2.17.
4.12 - Gel Electrophoresis and Western Blot
Urinary exosome pellets were solubilized in lysis buffer (RIPA buffer: 25 mM Tris-HCL pH 7.6, 150 mM NaCl, 1% NP40, 0,1% SDS) and then added Laemmli sample buffer (2% SDS, 10% glycerol, 50 mM Tris-HCl pH 6.8). 30 μg of protein samples were separated by one-dimensional SDS–PAGE electrophoresis and then eventually stained with Colloidal Blue Staining (Biorad). Other gels were transferred to nitrocellulose membranes (Amersham Biosciences) for western blotting, which were blocked with TBS-Tween 0,1% in 5% milk blot (1 hour) and probed with antigen-specific primary antibodies overnight at 4°C: monoclonal antibodies to Heat-Shock Protein (Hsp70) (1:3000), CD9 (1:1000), policlonal antibodies to Acquaporin 2 (AQ2) (1:1000) (Thermo Scientific), CD63 (1:1000) (Gene-Tex). Finally the membrane was incubated with the secondary antibodies conjugated with horseradish peroxidase. The antibody-antigen reactions were visualized by using ECL plus western blotting detection system (Amersham Biosciences). The images were acquired with ChemiDoc Molecular Imager with Image Lab Software (Biorad).
4.13 - Proteomic Characterization of the Exosomal Content
Exosomal pellets were solubilized in lysis buffer (RIPA buffer: 25 mM Tris-HCL pH 7.6, 150 mM NaCl, 1% NP40, 0.1% SDS,) for 30 minutes at 4°C. The proteins were precipitated in 4 volumes of cold acetone (-20°C) and placed overnight at -20°C. Subsequently, the solution was centrifuged at 18.000 rcf for 20 minutes at 4°C, the pellet is dried with speedvac and re-suspended in a minimum volume of urea 8 M. After that, 50 μg of proteins was chemically reduced with DTT (Sigma-Aldrich) in 10 mM Ammonium Bicarbonate 100 mM (AMBIC) for 30 minutes at 56°C. The proteins are alkylated with 55 μM iodoacetamide (Fluka) in 100 mM AMBIC and then digested with 1 μg of trypsin in 1 mM HCl overnight at 37°C. Finally, the reaction is stopped with Formic Acid 5% and the proteins were dried with speedvac and stored at -80°C until mass analysis. Samples, solubilized in 10 μL of H2O:acetonitrile:formic acid - 95:3:2 were diluted 1:5 with 0.1%
TFA and centrifuged to remove insoluble components. 3 μL of each solution were analysed by LC-MS/MS with a QTOF Agilent 6510 equipped with an Agilent 1200 nanoHPLC (60 min gradient) and CHIP-Cube. The eight peptides more intense for scanning have been isolated and sequenced; mass/mass spectra obtained were analysed by database search with the software Mascot Server (v.2.4, Matrix Science, UK).
4.14 - OFFGEL
For isoelectric-point based peptide separation, the 3100 OFFGEL Fractionator and the OFFGEL Kit pH 3– 10 (both Agilent Technologies) with a 12-well setup was used according to the protocol of the supplier. Ten min prior to sample loading, 12-cm-long IPG gel strips with a linear pH gradient ranging from 3 to 10 were rehydrated in the assembled device with 25 μL of focusing buffer per well. One hundred μg of the exosomal protein extract was diluted in focusing buffer to a final volume of 1.8 mL, and 150 μL of sample was loaded in each well. The sample was focused with a maximum current of 50 μA and typical voltages ranging from 500 to 4000 V until 50 kVh was reached after 12 h. The 12 recovered fractions were subjected to buffer exchange to remove glycerol by ultrafiltration in a centrifuge with Amicon (Millipore) with a 3 kDa filter. The buffer was replaced with milli-Q H2O; the purification has required 4 h of centrifugation. The samples
were reduced with 5 μL of DTT in 10 mM AMBIC 100 mM, at 57°C for 30 sec; alkylated with 5 μL of iodoacetamide in 55 mM AMBIC 100 mM; digested with 0.5 μg of trypsin, at 37°C over night. The samples was dried and re-suspended 30 μL of H2O + 0.1% formic acid and analysed by LC-MS/MS.
4.15 - Luminex Assay
The first use of flow cytometry for analysis of microsphere immunoassay was published in 1997 (Fulton et al., 1997). More recently high-level multi-analyte profiling (xMAP) have been successfully developed to complement single-analyte assays. xMAP Technology enables multiplexing of biological tests. Systems using xMAP Technology perform discrete assays on the surface of color coded beads known as microspheres, which are then read in a compact analyser. Using multiple lasers or LEDs and high-speed digital-signal processors, the analyser reads multiplex assay simultaneously results by reporting the reactions occurring on each individual microsphere.
For the evaluation of the exosomal content was performed immune-analysis for recognition of 13 antigens (GM-CSF, IFNγ, IL-1α, IL-1β, IL-1ra, IL-2, IL-4, IL-6, IL -8, IL-10, IL-12, IL-18, TNF). Luminex assay was performed with Porcine Cytokine-Chemokine Magnetic Bead Panel (Millipore) for serum, adapted for exosomal matrix and reading the results using the Magpix (Luminex) system for reading. For each sample were loaded 30 μg of protein extract and normalized to this value.
4.16 - Pathological Anatomy
Biopsies obtained on native and transplant kidneys were studied by light microscopy (LM), electron microscopy (EM), immunofluorescence (IF) and immunohistochemistry (IHC).
4.16.1 - Light Microscopy
Samples for light microscopy were fixed in 10% buffered formalin for 24 hours, cut to automatic tissue processor and embedded in paraffin. The inclusion was cut with the microtome for the preparation of serial sections of 3 micron thickness for each sample. The sections were then stained with hematoxylin-eosin (EE), Periodic acid-Schiff (PAS) and Masson's trichrome stain. The preparations were observed under an optical microscope (Nikon Labophot-2). The evaluation of the vascular damage was done using the vascular score described by Karpinski et al. (1999) modified as follows: the arteries were evaluated observing the narrowing of the lumen, evaluating the grade: 0 - absent; 1 - "Increase wall thickness but to a degree that is less than the diameter of the lumen"; 2 - "That wall thickness is equal or slightly greater than the diameter of the lumen"; 3 - "That wall thickness to xceeds the diameter of the lumen, with extreme luminal narrowing or occlusion".
4.16.2 - Electron Microscopy:
The fresh samples were fixed in 2.5% glutaraldehyde in 0.1 M cacodylate buffer, pH 7.2, and then in 1% osmium tetroxide in 0.1 M cacodylate buffer at pH 7.2 for 1 hour at 4°C. The samples, dehydrated in alcohol, were included in epoxy resin (Araldite). By ultramicrotome were obtained semi-thin sections of 1 and 0.09 μm thick. Thin sections, counterstained with uranyl-acetate and lead-citrate were observed at the transmission electron microscope Zeiss EM 109.
4.16.3 - Immunofluorescence
The samples for the immunofluorescence was immediately frozen in OCT Compound (SAK 4583, Sakura Finetek Europe B.V.) in a plastic tray disposable Cryo-Mold, and stored at -80°C. The inclusion was then cut with a cryostat, with sections of 5 micron thickness, and then collected on charged slides. The sections was then incubated with fluorescent antisera directed against IgG, IgM, IgA, the complement factors of C3c and C1q and fibrinogen (Dako Polyclonal Rabbit Anti-Human IgG-AM-C3c Complement C1q-Complement- Fibrinogen-Kappa Light Chains-Lambda Light Chains/FITC). The dilution expected for all antibodies is 1:30 and the antibodies were diluted in PBS. Incubation lasts 1 hour and the slides are mounted in glycerin. The sections was then observed under a fluorescence microscope Nikon Eclipse 80i and acquired with the NIS-Elements BR Software 3.2.
4.16.4 - Immunohistochemistry
For formalin-fixed immunohistochemistry, sections of 3 μm of paraffin-embedded tissue have been cut, mounted on polarized slides, deparaffinized with diaphanous and gradually hydrated with increasing concentrations of alcohol. The endogenous peroxidase activity was blocked with 30 minutes of incubation with 3% H2O2 in methanol solution. The sections were washed with Tris Buffer and antigens were retrieved
with Pronase-E 0,05%, pH 7.5 for 7 min at 37°C. The non-specific binding was blocked with incubation with 20% normal goat serum (NGS) and 1% BSA in PBS for 30 minutes at room temperature (IgG and IgM) and with Protein Block solution without serum for 15 min at room temperature (IgA). The slides were incubated over night at 4°C with a rabbit polyclonal antibody anti-IgM, diluted 1:30000 in 20% NGS and 1% BSA in Tris and with an antibody anti-IgG rabbit polyclonal, diluted 1:40000 in 20% NGS and 1% BSA
in Tris, and polyclonal anti-IgA goat, diluted 1:4000 in 1% BSA in Tris. All antibodies were made from Novus Biologicals. The slides were stained for 2 minutes at room temperature with 3,3-diaminobenzide tetrahydrochloride (DAB Chromogen/Substrate Kit Tablet format Cat. K 001, Diagnostic BioSystem, Pleasanton, CA). The sections were counter-stained with a Papanicolaou solution. Negative controls were performed in parallel, substituting the primary antibodies with 10% NGS in PBS. For positive controls were used pork sections of formalin-fixed, paraffin-embedded.
4.17 – SLA Typing
For the SLA typing we perform specific molecular techniques using the same pigs for the CNI experiments, and also a different pigs for the SLA homozygous haplotypes determination.
4.17.1 - Animals and Breeding for Homozygous Determination
The specific pathogen free (SPF) pigs herd has been maintained at IZSLER research laboratories. The animal was stabled at SPF condition, under the guidelines of Federation of Laboratory Animal Science Associations (FELASA) [Guillen, 2012]. In this study, a total of 31 pigs were evaluated for their SLA-1 and DQB-1 alleles. 15 SPF pigs were typed in order to select the ones with shared SLA haplotypes to generate offspring with some piglets homozygous. The mating was done using oestrus synchronization techniques and natural service. As a result were obtained three different offspring, called farrow 1 (F1), farrow 2 (F2) and farrow 3 (F3), from one boar and two different sows for a total of 16 piglets.
4.17.2 - SLA Typing by DNA Sequencing
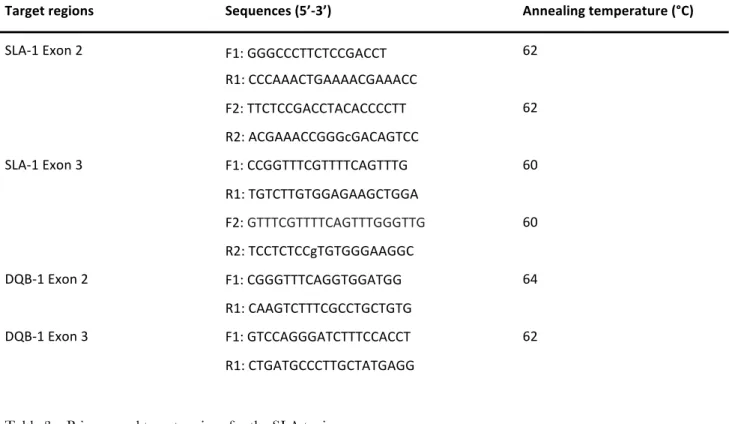
The SLA typing was performed by direct sequencing of the exons 2 and 3 of the polymorphic regions of genes SLA-1 and DQB-1, coding for class I antigens and class II antigens respectively. PCR and sequencing primers were designed in the intronic conserved regions flanking exon 2 and 3 of SLA-1 and oDQB-1 genes using Primer3 software (http:/frodo.wi.mit.edu).
4.17.3 - DNA Extraction
DNA was extracted from whole blood by Blood Purification Kit using Maxwell 16 System (Promega Corporation, Madison, WI USA). The extracted DNA was quantified using the spectrophotometer Nanodrop 3.0.0 (Thermo Scientific). Each sample was normalized to a concentration of 30-50 ng/µL and stored at -20°C.
4.17.4 - PCR and DNA Sequencing
For each sample the fragments of interest were amplified by PCR reactions set up in a final volume of 25 µL using the AmpliTaq Gold Polymerase kit (Thermo Fisher) and GC-RICH PCR System (Roche) for GC rich sequences. The PCR were performed in the thermocycler GeneAmp PCR System 9700 (Applied Biosystem) with the annealing temperatures present in table 3.
The amplified fragments were assessed by gel electrophoresis in agarose and compared with two markers of different molecular weight. Subsequently, the amplified DNA was purified using the QIA quick PCR Purification Kit (250) (QIAGEN Inc. Valencia, CA). The concentration of the purified DNA fragments was assessed by 2% agarose gel electrophoresis by determining the optimum amount of amplified sequence for subsequent PCR. The PCR for DNA sequencing were set up in a final volume of 10 µL using the BigDye Terminator v1.1 Cycle Sequencing kit (ABI) and conducted through the thermal cycler GeneAmp PCR system 9700 with the following thermal profile: 96°C for 30 s, 25 cycles at 95°C for 10 s and 60°C for 3 min. To avoid allele dropout and to be more accurate in the analysis the sequences we design two pair of primers for the exon 2 and 3 of SLA-1 because it’s locus is highly polymorphic. The primer used for PCR were listed below (table 3):
PRIMERS FOR SLA TYPING
Target regions Sequences (5’-3’) Annealing temperature (°C)
SLA-1 Exon 2 F1: GGGCCCTTCTCCGACCT 62 R1: CCCAAACTGAAAACGAAACC F2: TTCTCCGACCTACACCCCTT 62 R2: ACGAAACCGGGcGACAGTCC SLA-1 Exon 3 F1: CCGGTTTCGTTTTCAGTTTG 60 R1: TGTCTTGTGGAGAAGCTGGA F2: GTTTCGTTTTCAGTTTGGGTTG 60 R2: TCCTCTCCgTGTGGGAAGGC DQB-1 Exon 2 F1: CGGGTTTCAGGTGGATGG 64 R1: CAAGTCTTTCGCCTGCTGTG DQB-1 Exon 3 F1: GTCCAGGGATCTTTCCACCT 62 R1: CTGATGCCCTTGCTATGAGG
Table 3 – Primers and target regions for the SLA typing.
4.17.5 - Sequences Analysis
The sequence of PCR were purified with Millipore kit plate and loaded onto 48 capillaries automated sequencer 3730 DNA Analyser (Applied Biosystems). The sequences were aligned and compared to reference alleles available on IPD-MHC SLA sequence database (https://www.ebi.ac.uk/ipd/mhc/sla/) [Robinson et al., 2005]. Alignments were performed using Sequencer software (Gene Codes corp., Ann Arbor, MI), amino acid sequences were deduced from the nucleotide sequence using Sequencer translation utility.
4.18 – Blood Group Typing
The blood groups of these animals were determined by traditional serological method involving typing microcards for human anti-A and anti-B antibodies. For the PCR analysis, genomic DNA was isolated from peripheral blood samples and extracted by Blood Purification Kit using Maxwell 16 System (Promega Corporation, Madison, WI USA). The extracted DNA was quantified using the spectrophotometer Nanodrop 3.0.0 (Thermo Scientific). PCR amplification was performed in a 25 µL reaction containing
50-100 ng of DNA using AmpliTaq Gold Polymerase kit (Thermo Fisher). The multiplex PCR conditions and primers was used as described by Nguyen and collaborators [Nguyen et al., 2011]: PCR had an initial denaturation at 95°C for 3 min followed by 35 cycles of 1 min at 94°C, 1 min annealing at specific temperatures for each set of primers, and extension at 72°C. We use only the primer for recognize the exon 8 and the intron 7 deletion, used together, for discriminate the A group from O group. The primer used for PCR were listed below (table 4):
PRIMERS FOR AO TYPING
Target regions Sequences (5’-3’) Annealing temperature (°C)
Exon 8 F: CGCCAGTCCTTCACCTACGAAC 66 R: CGGTTCCGAATCTCTGCGTG Intron 7 deletion junction F: AATGTCCTTATGCTGGCCTGG 66 R: AACAACACACTCCTGAACAACAGA
RESULTS
Main Project
5.1 - Clinical Parameters Results
The trend of the Tacrolimus is maintained below 60 ng/mL in the first two weeks of treatment (figure 7, table 5). The assumption of the oral drug is characterized by a slower achievement of the target level of blood Tacrolimus, that is realized in mT2 onwards.
In all other cases the therapeutic target is achieved in mT1. These concentrations are changed from the third week highlighting a correlation with the dose administered. In particular, the B group and the C-HD group reach toxic levels ≥ 80.0 ng/mL. Otherwise, the A and the C-LD groups, after a phase of maintenance of therapeutic levels of TAC, shown not more therapeutic concentrations in mT4. This was clear in C-LD group, that was underwent a progressive reduction of the treatment up to the gradual suspension of the drug.
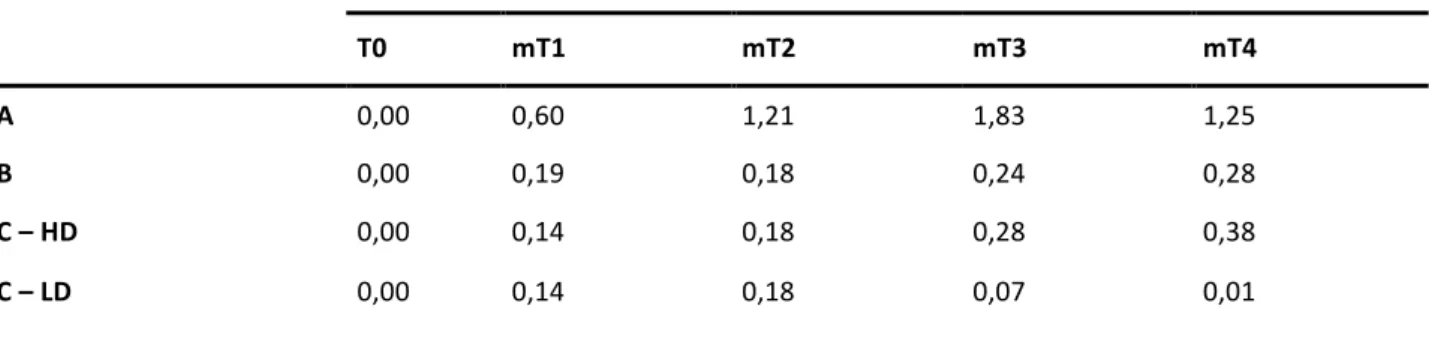
Tacrolimus Administered (mg/kg/die)
T0 mT1 mT2 mT3 mT4
A 0,00 0,60 1,21 1,83 1,25
B 0,00 0,19 0,18 0,24 0,28
C – HD 0,00 0,14 0,18 0,28 0,38
C – LD 0,00 0,14 0,18 0,07 0,01
Table 5 – Average of Tacrolimus dose administered in the time intervals in the different groups.
The trend of renal function expressed as serum creatinine (figure 8) in the four groups of animals is within the normal values until the time mT2, and then worsen, that is more highlights in groups B and C-LD in the two weeks of a high dose. Specifically, the B group, which reached the highest Tacrolimus dosages, develops the most kidney damage with higher creatinine values than the other groups; C-HD group shows a similar pattern but with creatinine values smaller in mT4. It should be considered that such functional deviations in the latter group are made in the presence of native kidney kept in place.
The trend of urine creatinine (figure 9), for a high dose groups, appears specular to that of the serum creatinine, showing in all treated animals a reduction of the values in relation to creatinine.
Figure 9 – Average amount of urinary creatinine observed in the time intervals in the different groups.
We represented the value of urine sodium and urine magnesium as ratio to urine creatinine to normalize the value to the excretory rate. The urine sodium (figure 10) appears more related to the stress of surgery than to the drug levels of the Tacrolimus. Moving away from T0 time, in mT2, there was greater urine sodium in C-LD group until it returns to normal level in mT4. Except for this outline value, the quantity of urine sodium showed no significant difference during the trial.
The same considerations can be made for the urine magnesium (figure 11), considered a marker of tubular damage, which may as a result for Tacrolimus toxicity damage. Despite the tendency to a decrease of the amount in the last weeks, there are no significant differences.