Proceedings of the ASME 2015 34th International Conference on Ocean, Offshore and Arctic Engineering OMAE2015 May 31-June 5, 2015, St. John's, Newfoundland, Canada
OMAE2015-42103
Analysis And Design Of An Oscillating Water Column Wave Energy Converter
With Dielectric Elastomer Power Take-Off
Giacomo Moretti
Scuola Superiore Sant’Anna Pisa, Italy
Gastone Pietro Papini Rosati
Scuola Superiore Sant’Anna Pisa, Italy
Marco Alves
Wave Energy Center Lisbon, Portugal Manuel Grases Sendekia S.L. Madrid, Spain Rocco Vertechy University of Bologna Bologna, Italy Marco Fontana
Scuola Superiore Sant’Anna Pisa, Italy
ABSTRACT
In this paper, we present a concept of near/off-shore Oscillating Water Column (OWC) Wave Energy Converter (WEC) that is equipped with a Power Take Off (PTO) unit based on Dielectric Elastomer Generators (DEGs). DEGs are soft/deformable generators with variable capacitance able to directly convert the mechanical energy that is employed for their deformation into electrostatic energy.
Specifically, the proposed WEC is based on an existing tubular collector chamber of an OWC system designed by the company Sendekia, that is combined with an Inflatable Circular Diaphragm (ICD) DEG. This simplified design presents a very reduced number of moving parts showing potentially high efficiency, reliability and noise free operation.
A multiphysics dynamic model of the system is built using time domain linear hydrodynamics coupled with an analytical non-linear electro-hyperelastic model for the PTO based on Dielectric Elastomers. The power matrix of the system is calculated for both regular and irregular waves. Some design issues are introduced showing that the electro-elastic response of the DE membrane provides the system with an additional stiffness that adds up to the hydrostatic stiffness and affects the resonance of the WEC. As a consequence, the geometric shape/dimensions of the OWC chamber and the layout of the DE diaphragm should be chosen using an integrated procedure aimed at tuning the WEC with a reference wave climate.
INTRODUCTION
Introduced in the forties by Yoshio Masuda [1], the oscillating-water-column (OWC) is one the most extensively studied type of wave energy converter; in particular, one of the few to have reached the stage of full-sized prototype.
Shoreline OWCs, i.e. having their structure fixed on the shore, are the most investigated and developed ones [2]. Examples of shoreline OWC are the Limpet [3], a full-scale prototype installed in the Scottish island of Islay, and the Pico plant, that is a still active experimental OWC in the Azores Islands [4]. Moreover, OWC integrated in breakwaters structures have been installed in Sakata (Japan) [5], Mutriku (Spain) [6] and Civitavecchia (Italy) [7]. In addition to fixed OWC systems, several examples of offshore OWCs, i.e. with floating structure moored to the sea bottom, have also been studied and developed. In practice, examples of small scale floating OWC have been studied since the eighteen century as whistling navigation buoys, while more recently, devices like the OE-Buoy developed by Ocean Energy Ltd, or the Spar bouy [8] have been developed and tested.
An interesting OWC concept has been proposed by the Spanish company Sendekia S.L.. The Sendekia WEC is designed to be employed in three different contexts: floating and moored through an appropriate tension leg systems; attached to a larger floating platform; attached to a fixed structure such as breakwaters. The Sendekia WEC features a tubular collector with a particular shape that makes it possible to introduce an important gain in the value of added mass consequently setting the resonance frequency of the system to an appropriate value.
Generally, OWC devices are extremely interesting for their simplicity. They are composed by a collector chamber, which is a semi-closed structure with a submerged opening that is exposed to receive wave forces. As the waves impinge on the structure, the enclosed water mass is put into reciprocating motion which can then be used to perform work on a Power Take-Off (PTO) unit. OWCs can be equipped with different
PTO systems. In the most traditional embodiment, the reciprocating motion of the water column is used to compress and expand an air-pocket located at the top of the collector chamber, and the resulting pneumatic energy is used to drive a bidirectional air turbine that is placed in correspondence to an upper aperture of the collector chamber. Alternatively, as proposed by Sendekia S.L., the kinetic and potential energy stored in the water column motion can be converted into electricity via a water turbine located in correspondence of the submerged opening of the collector chamber. In this case, the ceiling of the collector chamber is completely opened so that the free surface of the water column remains at atmospheric pressure.
Very recently, researchers have proposed a novel polymeric PTO for OWC systems that is based on Dielectric Elastomer Generators (DEGs) [10]. DEGs are soft polymeric electro-mechanical transducers that make it possible to efficiently convert the mechanical energy that is employed for their deformation into electrostatic energy. Such a kind of devices present different interesting attributes such as high energy density, lightness, direct linear motion, flexibility in speed/frequency, and possibly good electro-elastic impedance matching which make them attractive for the wave energy sector. An onshore OWC collector chamber coupled with an Inflatable Circular Diaphragm Dielectric Elastomer Generator (ICD-DEG) has been theoretically studied in [9]-[11] and experimentally tested via a small-scale prototype in a wave-flume [12].
In this work, we propose and analyze a new WEC concept obtained by combining the tubular shaped collector developed by the company Sendekia and a PTO based on an ICD-DEG. Hereafter, this concept is identified under the name of Tubular Polymeric Oscilating Water Column (or T-Poly-OWC in short).
The paper is organized as follows. In the second section, a time domain model for predicting the hydrodynamics of the T-Poly-OWC collector is proposed. In the third section, we present the electro-hyperleastic model which has been employed for predicting the dynamic behavior of the ICD-DEG PTO. Successively, a section is dedicated to the integration of collector and PTO models and to the selection of a control scheme. Finally, we propose a case study of a device obtained with an ICD-DEG dimensioned for the existing full-scale OWC structure of the Sendekia concept. The power matrix of this device is calculated and presented.
HYDRODYNAMIC MODEL
The Sendekia OWC examined in this article is an axi-symmetric floating structure. The submerged part of the device ends with a peculiar bottom aperture to the sea, consisting in a properly shaped convergent-divergent duct, which affects and settles the added mass of the WEC.
The hydrodynamics of the Sendekia OWC is described using a simplified approach, based on linear waves and potential flows theory. An accurate investigation on the hydrodynamic should be carried out using more sophisticated tools such as CFD, but this would be more time-consuming.
Simplified potential hydrodynamics is considered accurate enough for the aim of this preliminary analysis of the T-Poly-OWC concept.
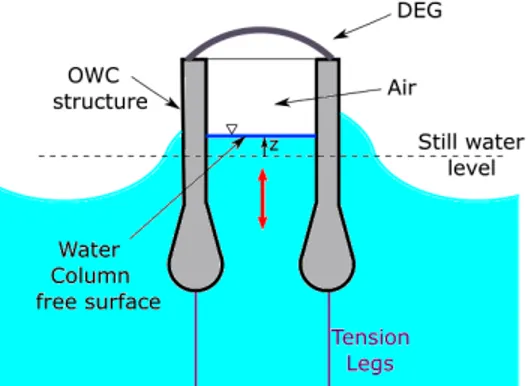
Figure 1. Scheme of the T-Poly-OWC composed by the Sendekia collector chamber and the ICD-DEG.
In this article, we assume that the OWC structure is installed near/off-shore, in deep water, and it is kept fixed by appropriately designed tension legs. We assume that the free surface of the water inside the OWC chamber is planar and horizontal, and it behaves as a rigid piston with infinitesimal thickness [13], [14].
Indicating with z the displacement of the free surface with respect to its equilibrium position (see Figure 1), in the hypothesis of small oscillations, the free surface dynamics is described by a single Degree of Freedom (DoF) equation, as follows:
M∞!!z+ K τ − ξ0
( )
!z ξ( )
dξt
∫
+ρgS ⋅ z = − pS + Fe( )
τ (1)Where
- M∞ is the water column added mass at infinite frequency; - the convolution integral accounts for the radiated waves generated by the water column oscillations, and it is a memory term which keeps into account the past history of the system;
- ρ is the water density, S is the area of the cross section of the OWC chamber, and the product ρgS is the hydrostatic stiffness associated with the free surface displacement. - p= pc− pa is the difference between the air pressure
inside the chamber (pc) and the atmospheric pressure (pa).
- Fe
( )
τ is the excitation force time-profile.The convolution kernel,
K
( )
τ , can be expressed in the frequency domain asKˆ
( )
ω = Br( )
ω + iω M(
add( )
ω − M∞)
, (2)where ω is the angular frequency and Br and Madd represent
the frequency dependent radiation damping and added mass respectively.
Real sea waves can be described as the linear composition of a spectrum of regular monochromatic waves. In presence of
irregular waves, the excitation force can be approximated as a finite sum of monochromatic terms, as follows [14]:
Fe= Γ
( )
ωii=1
n
∑
Aw,icos(
ωiτ +ϕi)
, (3)where Γ
( )
ω is a frequency-dependent wave excitation coefficient,ϕiare random numbers between 0 and 2π, and Aw,i are the amplitudes of the different monochromatic waves, related to the wave spectrum,
Sω
( )
ω , as follows:Aw,i= 2ΔωiSω
( )
ωi (4)where
Δωiis the step between two consecutive frequency values.
A Pierson-Moskowitz spectral distribution (see equation (5)) is adopted in this article. The distribution is uniquely defined by two parameters, describing a specific sea state: the significant wave height, Hs, and the energy period Te [14].
Sω
( )
ω = 262.9Hs 2T e −4ω−5exp −1054T e −4ω−4(
)
(5)In preliminary analyses of WEC concepts, regular monochromatic waves are often taken into account. In this framework, a given irregular sea state, identified by the parameters Hs and Te, can be described by means of an
energetically equivalent regular sea state with period Tm,
assumed equal to Te, and wave height Hm. The latter is obtained
calculating the power per unit crest width carried by the irregular wave, Pw, from the spectrum, and equaling it to the
wave power of a monochromatic wave [15]:
Hm= 32π Pw ρwg 2T e
(
)
(
)
1 2 (6) In presence of regular waves, equation (3) for the wave excitation force takes the following form:Fexc= Γ
( )
ω Hm 2cos( )
ωτ , (7) where the frequency isω =2π Teand the phase can be set to zero without loosing generality.
The presented hydrodynamic model involves a number of hydrodynamic parameters (M∞, Madd(ω), Br(ω) and Γ
( )
ω )which can been calculated using a frequency-domain Boundary Element Method (BEM) code. In this article, the commercial software WAMIT has been used for the BEM calculation.
If all the terms in equation (1) were linear, the free surface dynamics could be solved using analytic expressions in the frequency domain. For the specific case of T-Poly-OWC, due to the presence of the polymeric membrane, the time profile of the air pressure, p, is strongly linear. For this reason, a non-linear time-domain approach has to be followed, and a numerical solver of differential equations is needed.
In order to improve the computational efficiency of the numerical solver, the integral term in equation (1) has been replaced with a linear state-space model approximation. The
parameters of the state-space have been chosen with a frequency-domain identification procedure [16].
ICD-DEG MODEL
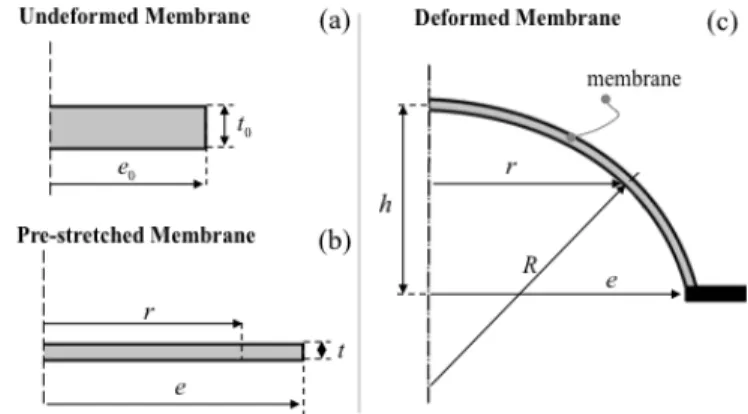
An ICD-DEG is depicted in Figure 2. It consists of an equi-biaxially pre-stretched planar circular Dielectric Elastomer (DE) Membrane (DEM) that is clamped along its perimeter to a fixed frame at radius e and with thickness t (whereas e0 and t0
indicate the radius and thickness of the DEM in its planar undeformed state). The ratio between the frame radius, e, and the membrane undeformed radius, e0, is referred to as
pre-stretch: λp=e/e0. The DEM in undeformed and pre-stretched
configuration is shown in Figure 2(a) and 2(b) respectively. The membrane is made of insulating material while its faces are covered by deformable electrodes, to form a variable capacitor. Alternatively, in order to limit the applied voltage and to make the electric field within the generator more homogeneous, the membrane can be split in a stack of parallel connected membranes, each coated by a couple of compliant electrodes.
The opposing sides of the ICD-DEG are subjected to the time variable differential pressure generated by the oscillating motion of the free water surface and the electromechanical loads determined by the electric potential difference (voltage) applied between the DEM electrodes. The ICD-DEG undergoes an out of plane axial-symmetric (bubble-like) deformation (area expansion). In Figure 2(c), h identifies the resultant displacement of the ICD-DEG tip.
Figure 2. Inflated Circular Diaphragm Dielectric Elastomer Generator (ICD-DEG): (a) ICD-DEG undeformed state, (b) ICD-DEG pre-stretched state with no differential pressure and electric potential, (c) ICD-DEG deformed state with differential pressure and/or electric potential.
In order to appropriately describe the interaction with the hydrodynamics of the OWC, a dynamic model of the ICD-DEG is developed. Specifically, a reduced lumped parameter model with one-degree-of-freedom is considered as in [11]. Such a simplified model can be used for fast design optimization, hardware-in-the-loop simulation and control. The following approximations are assumed:
- the ICD-DEG deforms as a perfect spherical shell segment with tip height h and radius R;
- the ICD-DEG deformation is prevalently equi-biaxial, with the amount of deformation depending on h and varying with the radial distance r;
- the ICD-DEG capacitance is assumed to be equivalent to that of a planar circular capacitor with variable thickness; - the DE material is assumed as an hyperelastic non-viscous
solid whose mechanical response is regulated by a Gent constitutive model [17];
- dynamic equilibrium equations are written at the tip (r=0) of the ICD-DEG and are assumed valid for the whole continuum domain.
These approximations have already been demonstrated to provide sufficiently accurate models for the electro-elastic response of pre-stretched ICD-DEGs featuring limited mass density (ρd ≈ 1000 kg⋅m-3), and working in the range |h| < e
with limited accelerations (
!!h < g , with g = 9.8 m⋅s -2) [9]. The variable h is taken as the independent variable, which univocally describe the geometric configuration of the ICD-DEG. With the above mentioned assumptions, the dynamic equation that describes the response of the system to a differential pressure p and to an imposed voltage V reads as
ρdt0λ −2
( )
g+ !!h +2tσ R = p(τ ), (8) whereλ
=λ
(
h,r= 0)
= h 2+ e2(
)
( )
ee0 , (9)is the stretch calculated at the tip,
σ = σel−σes, (10)
is the value of the stress divided in
σel= 2µ
λ2−λ−4
Im− 2λ2−λ−4 (11)
that is the elastic component of the stress and
σes=ελ4 V t0 ⎛ ⎝⎜ ⎞ ⎠⎟ 2 (12) that is the electrostatic component, and
2 2 2 h e R h + = , (13)
is the radius of the spherical shape assumed by the ICD-DEG. In equation (8), p is the differential pressure acting between the opposing sides of the DEM, whereas
ρd is the density of the considered dielectric material. In equation (11), µ and Im are the hyperelastic constitutive parameters of Gent model for the considered dielectric material. In equation (12), ε is the absolute dielectric constant of the considered dielectric material.
Equations (8-13) make it possible to study the time evolution of the ICD-DEG tip height h as function of the of the time-varying pressure p and voltage V. Evaluation of the amount of electrical
energy that can be generated by the ICD-DEG requires the additional knowledge of the variable ICD-DEG capacitance, as well as a suitable choice for the control law (namely, the energy generation cycle) which regulates V.
For example, in its simplest form, the generation cycle can be explained as follows: during this deformation the capacitance of the DEG increases; when its maximum is reached an electrical charge is supplied with an initial voltage
V0; the charging circuit is then opened leaving a constant charge
on the capacitor; the elastic/pressure forces recalls back the membrane bringing it back to a flat condition corresponding to a lower capacitance; since the charge is constant and the capacitance is reducing the voltage results amplified determining an increase of the electrostatic potential energy of the initial charge; the charge is then outputted to the electrical system achieving a positive energy balance.
Notice that, if the ICD-DEG is mounted on top of an OWC, its capacitance rises from the minimum value (that occurs in the flat configuration, h=0) to a maximum value (depending on the membrane tip oscillation amplitude) twice per wave period, i.e., the ICD-DEG performs two conversion cycles for any full oscillation of the free surface.
Failure mechanisms and operation constraints
This sub-section analyses failure mechanisms of the ICD-DEG in order to define feasible operating ranges of the generator. The considered constraints are: a) membrane rupture due to material overstretching; b) electrical break-down due to an excessive applied electric field; c) electro-mechanical buckling, that is, loss of tension of the DE membrane layers ([18], [19]). Condition a) represents a purely mechanical failure mechanism, condition b) is a purely electrostatic failure mechanism, while buckling c) is due to a combined electro-mechanical instability phenomenon.
a) Mechanical rupture
Mechanical rupture bounds the maximum deformation of the DE membrane. Kawabata's criterion is assumed [20], thus, in order to avoid mechanical rupture the following limit has to be imposed
λ<λu (14)
where the constant λu represents the the ultimate stretch
and is a property of the considered DE material. b) Electric break-down
The maximum electric field that can be applied in the dielectric material is limited by the dielectric breakdown phenomena, i.e. if the electric field exceeds a limit value, a permanent physical damage of the dielectric layer occurs. In order to avoid electric break-down, the following inequality must be respected
where EBD, the break-down electric field, is assumed to be
constant with value depending on the type of chosen dielectric material.
Expression (15) represents a simplified, but conservative, condition since dielectric strength may vary (increase) as the material is strained [19].
c) Electro-mechanical buckling
A further limit to the operation of the DEG membrane is imposed by the condition of buckling, i.e. the membrane must remain tensioned during its operation. If this limit is not respected, no permanent damage occurs on the DEG but the material wrinkles and the transduction mechanism fails. However, in certain circumstances a permanent damage may occur during buckling due to excessive stress concentration.
The buckling condition limit is found imposing a positive value to the total stress in a generic direction. The total stress is the sum of an elastic contribution, induced by the stretch, and an electrostatic contribution due to electric activation.
Loss of tension is avoided if
σ ≥ 0 (16)
GENERATION CYCLES AND CONTROLLER
This section introduces the control strategy that has been assumed for the evaluation of the T-Poly-OWC performances. In the first part we consider the maximum energy that can be produced in a deformation cycle of the membrane while it is loaded at its maximum electromechanical limits. In the second part, a more realistic control strategy is proposed which takes into account the deformation of the membrane in a cycle is limited and not known a priori.
Maximum energy generation
The operative working space of the ICD-DEG is limited, due to the mentioned failure mechanisms of the DEG. An efficient way to represent this operating space is using a charge-voltage Q-V diagram [18].
In order to trace the relevant curves, which limit the ICD-DEG operating space on the Q-V plane, the following equations must be taken into account. Equation (17) relates the DEG capacitance to its geometric configuration, identified by the stretch at the membrane tip. Equations (18) relate the charge Q on the DEG electrodes and the voltage, V, acting between them with the electric field E within the capacitor:
C=πεee0 3t0 λ λ 2+ e e0λ + e2 e02 ⎛ ⎝⎜ ⎞ ⎠⎟, (17) V = Et0λ −2 ; Q= CV =πεee0E 3 λ + e e0+ e2 e02λ −1 ⎛ ⎝⎜ ⎞ ⎠⎟ (18)
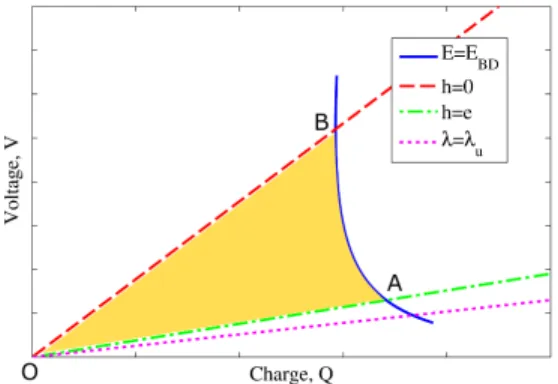
Figure 3 generically represents the operative limitations of an ICD-DEG on a Q-V plane.
Since the ratio of the charge, Q, over the voltage, V, gives, by definition, the capacitance of the DEG, straight lines passing through the origin of the Q-V plane are iso-capacitance lines, thus representing a given geometric configuration of the membrane, according to equation (17) and (18).
Figure 3. ICD-DEG operating space. The limiting curves define a cycle enclosing an area which represents the maximum energy converted in a cycle
The straight lines reported in Figure 3 correspond to the following relevant configurations:
- h = 0, which is the configuration where the membrane has minimum capacitance,
- | h | = e, i.e., the configuration in correspondence of which the DEG has the maximum allowed capacitance (note that if | h |> e,the considered simplified electro-mechanical model of the ICD-DEG does no longer apply).
-
λ = λu, which is the rupture condition.
The break-down curve can be easily identified by replacing
EBD in equations (18). Notice that, with regards to the buckling
limitation, we assumed that it can be avoided, in any configuration and for each value of the applied electric field, by setting the pre-stretch, λp, to a sufficiently high value.
The generic control pattern followed by the generator in a cycle is represented on the Q-V plane by any closed cycle, included within the physically allowable operating space. The area enclosed by the considered cycle is numerically proportional to the mechanical energy converted into electrical energy.
The limiting curves themselves define a cycle, which enclose an area equal to the maximum energy that can be converted in a single cycle by the DEG. With reference to Figure 3, such a control cycle is composed by the following sequence of electro-mechanical transformations:
- OA: when the generator capacitance is maximum (|h|=e), the generator is instantly charged up to the maximum allowed electric field.
- AB: as the capacitance decreases, the generator is then controlled following the break-down curve.
- BO: when the DEG capacitance is minimum (h=0), the charge is instantly removed.
- During the successive phase (as the DEG capacitance increases), no charge is present on the electrodes, otherwise the DEG would convert electrical energy into mechanical work, behaving as an actuator.
An ideal controller, able of reproducing this cycle, is quite difficult to implement in practice.
In [21], an alternative control method is described, which makes use of a capacitor with suitable size connected in parallel to the DEG electrodes. Such a method makes it possible to approximate the optimum cycle by simply performing energy harvesting cycles at constant total charge QTOT (with QTOT being
the sum of the charges acting on the ICD-DEG and on the in-parallel capacitance).
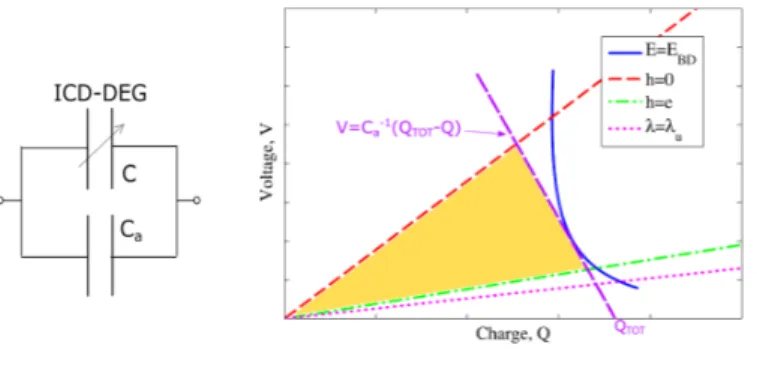
To show this, let us indicate with Ca the capacitance
connected in parallel to the DEG (see Figure 4(a)). It can be easily demonstrated that, if the system is provided with a charge QTOT, which is kept constant during the useful electric
activation phase (i.e., when the DEG capacitance decreases), Q and V on the ICD-DEG electrodes vary accordingly to the following linear relationship:
V = Ca
−1 Q
TOT− Q
(
)
(19)As shown in Figure 4(b), by properly choosing the parallel connected capacitance, Ca , and the total charge QTOT, a slightly
sub-optimal control cycle can be obtained. Since the overall charge on the two capacitances is constant, this control is easily implementable.
(a) (b)
Figure 4: (a) Electric scheme of the ICD-DEG with capacitance Ca in parallel; (b) Suboptimal energy conversion cycle.
Control strategy
In real applications, the amplitude of the oscillations of the membrane tip varies from cycle to cycle, due to the dynamic evolution of the system. Correspondingly, its capacitance can assume any value between its minimum value when it is flat and its maximum value for |h| = e. Accordingly, a control strategy has been designed for both the architectures presented above, i.e. the control at constant electric field and the control with additional in parallel capacitance. For both the cases, the electrical activation is decided on the basis of the instantaneous values of h and !h . In the case of constant electric field controller, an electric field E = EBD is imposed when h⋅ !h < 0 and E = 0 is set when h⋅ !h > 0 . Analogously, the second
controller sets the charge on the two in parallel capacitances to Q= QTOT (see Figure 4) when h⋅ !h < 0 ; the charge remains constant during the deformation of the DEG. The charge is set back to zero when the condition h⋅ !h > 0 is verified.
Both the controllers have been implemented in a Matlab/Simulink environment and are compared in the next section on a realistic case study.
SIMULATIONS
The models presented in the previous sections have been coupled to investigate a case study.
For what concerns the submerged geometry, we assumed a collector that is identical to the existing Sendekia prototype. The device has a tubular structure with an inner diameter Φ = 10 m and a draft d = 8.9 m and the patented shape of the submerged aperture.
An ICD-DEG is placed on top of such a tubular collector, assuming to have an emerged height, over the equilibrium free surface level, of L = 6 m.
The air enclosed in the OWC chamber is supposed to undergo adiabatic transformations, thus its pressure follows as
p
( )
τ = c0VOWC( )
τ−γ
(20) where VOWC is the air volume within the chamber, that depends
on the mutual position of the water free surface and on the deformed shape of the DE membrane; γ = 1.4 is the adiabatic compression-expansion coefficient of air and c0 is a constant
that identifies the steady condition (with no waves) of the air chamber.
The pressure within the chamber is chosen such that, in the steady condition, the membrane (subjected to the effect of its own weight, of the elastic forces and of the pressure forces) is in equilibrium in its flat horizontal configuration.
The widely employed [11,12] DE acrylic elastomer VHB-4910, commercialized by 3M® as an adhesive, has been used as reference material. Its relevant electro-mechanical properties are resumed in Table 1 [10].
Density ρd 960 kg/m3 Hyperelastic parameters µ 4.09 MPa Im 430 Rupture stretch λu 7 Electric properties ε 4.5x8.85e-12 F/m EBD 65 MV/m Table 1 - Acrylic VHB-4910 properties
In this paragraph, we report simulation results relative to the following choice of the ICD-DEG design parameters:
- Diameter of the stretched membrane, e = 6 m. - Pre-stretch, λp = 3.
- Overall thickness of the unstretched DEG, t0 = 3.6 m
(i.e., 0.4 m in the stretched plane configuration). This set of parameters realizes a good compromise between the overall DE volume and the extra stiffness
added by the membrane to the WEC, that, as it will be shown, influences the resonance of the system.
Notice that the outer diameter of the ICD-DEG is larger than the inner diameter of the OWC chamber. As a consequence, the upper emerged part of the structure must be provided with a properly designed profile in order to allow the correct downward expansion of the membrane.
Four different simulation scenarios have been considered:
- Simulations with regular and irregular sea states. In both cases, sea states are defined by means of the energy period, Te, and significant wave height, Hs, but,
for the monochromatic case, energetically equivalent waves are considered according to equation (6). - Simulations with two different control architectures:
1) constant electric field control (where E = EBD
during the electric activation phase); 2) constant overall charge (QTOT) control on a circuit where the
DEG is in parallel with a constant capacitance, Ca. In
this second case, the following parameters were assumed: Ca = 1 nF, QTOT = 0.31 C.
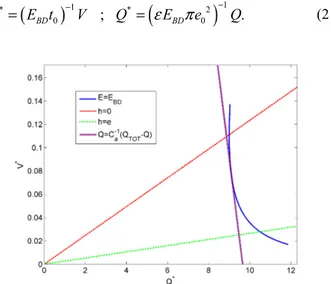
Figure 5 shows the limiting curves for the reference ICD-DEG on the dimensionless charge-voltage plane. Dimensionless variables are defined as follows:
(
)
1(
)
1* * 2
0 ; 0 .
BD BD
V = E t − V Q =
ε
Eπ
e − Q (21)Figure 5. Operating space of the reference ICD-DEG in the dimensionless charge-voltage plane. Notice that the straight line representing the charge-voltage relationship in presence of Ca is tangent to the electric break-down curve.
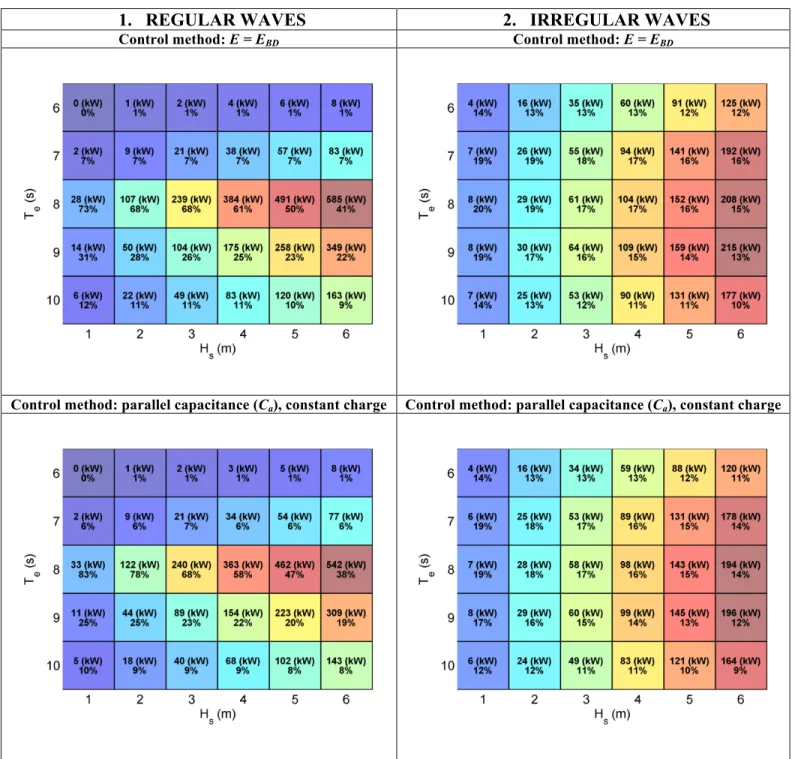
In Figure 6, we report the power matrices of the T-Poly-OWC for the different scenarios.
The matrices report the T-Poly-OWC power output (in kW) and its capture factor (defined as the ratio between the WEC power output and the power carried by a wave front with a width equal to the OWC diameter) for each different sea condition.
Simulations were restricted to a range of values for Hs and Te within which the WEC power output and capture factor
reach their peak values.
As expected, in presence of monochromatic (regular) waves, the system features visibly larger power outputs (over 500 kW). Nonetheless, in regular waves the device experiments maximum powers and capture factors in a very narrow band of sea conditions, i.e., where the WEC resonates, while it undergoes a dramatic performance loss out of the resonance range. In presence of irregular waves, the T-Poly-OWC features quite homogeneous power output in a wider set of sea conditions.
A comparison of the two different control strategies shows that, in general, the complex control with constant electric field provides larger power output than the simplified constant charge control. Nonetheless, the differences in the produced power is generally less than 15 %. We can conclude that using a constant charge control on a system composed by the DEG and a parallel constant capacitance provides a tremendous simplification of the control architecture, with acceptably low reductions in the energy productivity.
The peak powers and capture factors occur at wave periods around Te = 8 s.. Basing on the hydrodynamic parameters only,
the Sendekia prototype considered in this study is designed to resonate with waves with Te≃ 10 s (in fact, the maximum
energetic potential of ocean waves is typically associated to wave periods larger than 10 s [22]). The introduction of the polymeric membrane provokes a modification of the resonance condition of the WEC. The DE influences the free surface dynamics by affecting the air pressure variations within the chamber, and it provides an increase in the overall hydrostatic stiffness, with a resulting increase of the natural frequency of the system.
In order to get a T-Poly-OWC which resonates with typical ocean waves, it would be necessary to review the hydrodynamic design of the system and to properly adjust the geometry of the submerged part of the WEC.
However, the layout presented in this article, resulting from a retrofitting of an existent hydrodynamic design, appears to be very suitable to different wave climates than the oceanic one; in particular, it may be suited to operate in the Mediterranean sea, where the largest energy potential is associated to waves with energy period around 8 s [23], [24].
CONCLUSIONS
In this paper, we presented a novel Oscillating Water Column (OWC) Wave Energy Converter (WEC) that is obtained by combining a tubular shaped collector developed by the Spanish company Sendekia S.L. and a Power Take Off (PTO) unit based on a Dielectric Elastomer Generator (DEG).
A model that couples the hydrodynamics of the OWC with the electro-hyperelestic behavior of the DEG is provided together with a simple but effective control strategy.
1. REGULAR WAVES
2. IRREGULAR WAVES
Control method: E = EBD Control method: E = EBD
Control method: parallel capacitance (Ca), constant charge Control method: parallel capacitance (Ca), constant charge
Figure 6. T-Poly-OWC power matrices for equivalent regular and irregular sea states. Two control methods are considered: constant electric field control vs. constant charge control with a capacitance Ca in parallel to the DEG. Powers are expressed in kW, percentages into parentheses are the capture factors.
A numerical case study is developed by coupling an OWC collector that is identical in geometry and dimensions to the one proposed by Sendekia with an Inflated Circular Diaphragm DEG dimensioned in order to maximized the power performances of the overall device.
The obtained results in terms of power output are extremely promising, even if the coupling of the two systems has provided a WEC which has better performances in waves with lower energy periods with respect to the original Sendekia design. This makes the resulting device more suitable to Mediterranean areas such as the west coast of Sardinia. However, the original range of working frequencies, that are more typical of ocean sea-states, could be obtained by a proper redesign or adaptation of the collector geometry.
Future works may include a techno-economic assessment of the T-Poly_OWC concept, including also technical issues related to the dielectric polymeric material adaptability and survivability in the harsh aggressive marine environment.
ACKNOWLEDGMENTS
The work presented in this paper is developed in the context of the project PolyWEC (www.polywec.org), a FP7 FET- Energy project. The research leading to these results has received funding from the European Union Seventh Framework Programme [FP7/2007-2013] under grant agreement n° 309139.
REFERENCES
[1] Masuda, Y., and Miyazaki, T., “Wave power electric generation study in Japan,” in International Symposium on
Wave and Tidal Energy 1, 6 (1978).
[2] Heath, T. V. ,“A review of oscillating water columns”,
Phil. Trans. R. Soc. A 2012 370.
[3] Boake, C. B., Whittaker, T. J., Folley, M., Ellen, H.. “Overview and initial operational experience of the LIMPET wave energy plant”. In Proceedings of the 12th international
offshore and polar engineering conference, Vol. 1, pp. 26-31,
(2002, May).
[4] Falcão, A.F.O., “The shoreline OWC wave power plant at the Azores,” in Proceedings of the Fourth European
Wave Energy Conference, Aalborg, Denmark, 42–48, 2000.
[5] Takahashi, S., Nakada, H., Ohneda, H., and Shikamori, M., “Wave power conversion by a prototype wave power extracting caisson in Sakata port,” in Coastal
Engineering Conference 3, 3440 (1992).
[6] Torre-Enciso, Y., Ortubia, I., López de Aguileta, L. I., & Marqués, J. (2009, September). “Mutriku Wave Power Plant: from the thinking out to the reality”. In Proceedings of
the 8th European Wave and Tidal Energy Conference (pp.
319-329).
[7] Arena, F., Romolo, A., Malara, G., Ascanelli, A. (2013, June). “On design and building of a U-OWC wave energy converter in the Mediterranean sea: a case study”. In
ASME 2013 32nd International Conference on Ocean, Offshore and Arctic Engineering (pp.
V008T09A102-V008T09A102). American Society of Mechanical Engineers.
[8] Falcão, A. F., Henriques, J. C., & Cândido, J. J. (2012). “Dynamics and optimization of the OWC spar buoy wave energy converter”. Renewable Energy, 48, 369-381. [9] Rosati G. P., Vertechy R., Fontana M. (2013).
“Dynamic Model Of Dielectric Elastomer Diaphragm Generators For Oscillating Water Column Wave Energy Converters”. In Proceedings of the ASME 2013 Conference
on Smart Materials, Adaptive Structures and Intelligent Systems (SMASIS 2013), Snowbird, Utah, USA, September
16–18, 2013.
[10] Vertechy, R., Fontana, M., Papini, G. R., Bergamasco, M. (2013, April). “Oscillating-water-column wave-energy-converter based on dielectric elastomer generator”. In SPIE
Smart Structures and Materials+ Nondestructive Evaluation and Health Monitoring (pp. 86870I-86870I). International
Society for Optics and Photonics.
[11] Vertechy R., Rosati Papini G.P., Fontana M., “Reduced Model And Application Of Inflating Circular Diaphragm Dielectric Elastomer Generators For Wave Energy Harvesting”, ASME Journal of Vibration and Acoustics, vol.137, no.1, Feb 2015.
[12] Vertechy, R., Fontana, M., Papini, G. R., Forehand, D. (2014, March). “In-tank tests of a dielectric elastomer generator for wave energy harvesting”. In SPIE Smart
Structures and Materials+ Nondestructive Evaluation and Health Monitoring (pp. 90561G-90561G). International
Society for Optics and Photonics.
[13] Gomes, R. P. F., Henriques, J. C. C., Gato, L. M. C., & Falcao, A. F. O. (2012). “Hydrodynamic optimization of an axisymmetric floating oscillating water column for wave energy conversion”. Renewable Energy, 44, 328-339.
[14] Henriques, J. C., Chong, J. C., Falcão, A. F., Gomes, R. P. (2014). “Latching Control of a Floating Oscillating Water Column Wave Energy Converter in Irregular Waves”. In ASME 2014 33rd International Conference on Ocean,
Offshore and Arctic Engineering, OMAE 2014. American
Society of Mechanical Engineers.
[15] McCormick, M. E. (1973). Ocean engineering wave
mechanics. Wiley.
[16] Pérez, T., Fossen, T. I. (2008). “Time- vs. frequencydomain identification of parametric radiation force models for marine structures at zero speed”. Modeling,
Identification and Control, 29(1), 1-19.
[17] Gent, A.N., 1996, “A new constitutive relation for rubber”, Rubber Chemistry Tech., 69, pp. 59-61.
[18] Jin Adrian Koh, S., Keplinger, C., Li, T., Bauer, S., Suo, Z. (2011). “Dielectric elastomer generators: How much energy can be converted?”. Mechatronics, IEEE/ASME Transactions on, 16(1), 33-41.
[19] Moretti, G., Fontana, M., Vertechy, R. (2014). “Parallelogram-shaped dielectric elastomer generators: analytical model and experimental validation”. Journal of
Intelligent Material Systems and Structures, in press
(Manuscript ID JIM-14-054).
[20] Hamdi, A., NaïtAbdelaziz, M., Ait Hocine, N., Heuillet, P., Benseddiq, N. (2006). “A fracture criterion of
rubber-like materials under plane stress conditions”. Polymer
Testing, 25(8), 994-1005.
[21] Shian, S., Huang, J., Zhu, S., & Clarke, D. R. (2014). “Optimizing the Electrical Energy Conversion Cycle of Dielectric Elastomer Generators”. Advanced Materials,
26(38), 6617-6621.
[22] Gunnar M., Barstow S., Kabuth A., Pontes M.T. (2010); “Assessing the global Wave Energy Potential”;
Proceedings of 29th OMAE Conference.
[23] Vicinanza, D., Contestabile P., Ferrante, V. (2013). “Wave Energy Potential in the north-west of Sardinia (Italy)”.
Renewable Energy, 50, 506-521.
[24] Liberti, L., Carillo, A., Sannino, G. (2013). “Wave energy resource assessment in the Mediterranean, the Italian perspective”. Renewable Energy, 50, 938-949.