A
A
l
l
m
m
a
a
M
M
a
a
t
t
e
e
r
r
S
S
t
t
u
u
d
d
i
i
o
o
r
r
u
u
m
m
–
–
U
U
n
n
i
i
v
v
e
e
r
r
s
s
i
i
t
t
à
à
d
d
i
i
B
B
o
o
l
l
o
o
g
g
n
n
a
a
DOTTORATO DI RICERCA IN
Scienze ambientali: Tutela e Gestione delle Risorse
Naturali
Ciclo XXIII
Settore/i scientifico-disciplinare/i di afferenza: BIO/07 Ecologia
Spatial and temporal variability and ecological
processes in the epibenthic assemblages of the
Northern Adriatic Sea
Presentata da: Fava Federica
Coordinatore Dottorato:
Relatore:
Prof. Enrico Dinelli Prof. Marco Abbiati
Co-relatore:
Dottorato di ricerca in Scienze ambientali: Tutela e Gestione delle Risorse Naturali Ciclo XXIII
Presentata da: Federica Fava Relatore: Prof. Marco Abbiati Co-relatore: Dott. Massimo Ponti Coordinatore: Prof. Enrico Dinelli
Abstract della tesi di dottorato:
SPATIAL AND TEMPORAL VARIABILITY AND ECOLOGICAL PROCESSES IN THE
EPIBENTHIC ASSEMBLAGES OF THE NORTHERN ADRIATIC SEA
Several coralligenous reefs occur in the soft bottoms of the northern Adriatic continental shelf. Mediterranean coralligenous habitats are characterised by high species diversity and are intrinsically valuable for their biological diversity and for the ecological processes they support. The conservation and management of these habitats require quantifying spatial and temporal variability of their benthic assemblages. This PhD thesis aims to give a relevant contribution to the knowledge of the structure and dynamics of the epibenthic assemblages on the coralligenous subtidal reefs occurring in the northern Adriatic Sea.
The epibenthic assemblages showed a spatial variation larger compared to temporal changes, with a temporal persistence of reef-forming organisms. Assemblages spatial heterogeneity has been related to morphological features and geographical location of the reefs, together with variation in the hydrological conditions.
Manipulative experiments help to understand the ecological processes structuring the benthic assemblages and maintaining their diversity. In this regards a short and long term experiment on colonization patterns of artificial substrata over a 3-year period has been performed in three reefs, corresponding to the three main
depending by the different larval supply, played a key role in determining the heterogeneity of the assemblages in the early stage of colonisation. Lateral invasion, from the surrounding assemblages, was the driver in structuring the mature assemblages. These complex colonisation dynamics explained the high heterogeneity of the assemblages dwelling on the northern Adriatic biogenic reefs. The buildup of these coralligenous reefs mainly depends by the bioconstruction-erosion processes that has been analysed through a field experiment. Bioconstruction, largely due to serpulid polychaetes, prevailed on erosion processes and occurred at similar rates in all sites. Similarly, the total energy contents in the benthic communities do not differ among sites, despite being provided by different species. Therefore, we can hypothesise that both bioconstruction processes and energetic storage may be limited by the availability of resources. Finally the major contribution of the zoobenthos compared to the phytobenthos to the total energetic content of assemblages suggests that the energy flow in these benthic habitats is primarily supported by planktonic food web trough the filter feeding invertebrates.
Table of contents
Chapter 1. General Introduction ... 3
1.1. Epibenthic assemblages of the northern Adriatic Sea coralligenous reefs ... 3
1.2 Recruitment processes and their role in structuring the epibenthic assemblages... 4
1.3 Bioconstruction-erosion processes in coralligenous reefs ... 5
1.4 Possible species responses to environmental changes ... 6
Chapter 2. Manuscripts ... 9
Manuscript 1. Spatial-temporal variability of epibenthic assemblages on subtidal biogenic reefs in the northern Adriatic Sea ... 11
Manuscript 2. Short and long-term colonization patterns of coralligenous epibenthic assemblages of the northern Adriatic Sea... 33
Manuscript 3. Bioconstruction-erosion processes and biomass in the northern Adriatic coralligenous reefs ... 49
Short note. Effect of thermal stress on the zooxanthellate temperate octocoral Maasella edwarsi (De Lacaze-Duthiers, 1888) ... 65
Chapter 3. General Discussion ... 71
References... 74
Appendix. Publication on Marine Biology (Uncorrected proof of the 1st manuscript)... 87
Chapter 1. General Introduction
1.1. Epibenthic assemblages of the northern Adriatic Sea coralligenous reefs
Mediterranean coralligenous habitats are biogenic reefs mainly built by encrusting calcareous algae growing in dim light condition (Ballesteros 2006). Subtidal coralligenous reefs occur all around the Mediterranean coast and are characterised by a variety of morphologies. These habitats are included among the most important Mediterranean “hot spot” of species diversity (Boudouresque 2004) and they are intrinsically valuable for the biological diversity and for the ecological processes they support. The complex structure of these biogenic reefs supports a variety of species assemblages dominated by living algae, borers, and vagile species inhabiting holes and crevices (Ballesteros 2006). Growth and structure of the coralligenous reefs is affected by several environmental factors as light, temperature, nutrient concentrations and hydrodynamics. Unfortunately, little is known about the complex interaction between environmental variables and the structure of the assemblages, and its variation at different spatial and temporal scale (Ballesteros 2006).
Coralligenous reefs occur also in the silty-sand sedimentary bottoms of the northern Adriatic continental shelf. These reefs were recorded in the 18th century (Olivi 1792) while the first underwater exploration, mainly regarding their origins and geological features, goes back to ‘60s (Stefanon 1969; Braga and Stefanon 1969). Studies on the benthic assemblages of the Adriatic biogenic reefs started in the ‘90s, and only scattered descriptive data on few reefs are available.
Quantify spatial and temporal variability of the benthic assemblages is required for an appropriate management and for the conservation of the coralligenous habitats. Understanding patterns of variation can increase the precision of ecological predictions regarding, for example, the effectiveness of conservation strategies or the consequences of natural and anthropogenic disturbances (Levin 1992; Benedetti-Cecchi et al. 2000).
1.2 Recruitment processes and their role in structuring the epibenthic assemblages
Recruitment process in marine invertebrates entails different stages: larval dispersal, search of suitable substratum, aided by chemical and physical cues and settlement, in the case of sessile invertebrates attachment to the substratum, and metamorphosis when the animal becomes a juvenile and looks like a small adult (Keough and Downes 1982). Patterns of specie distribution in sessile marine invertebrates are controlled by several important factors: i) planktonic events (i.e. larval supplies, dispersal capability, mortality, etc.); ii) active larval choices during settlement, generally affected by water characteristics close to the substratum, larval behaviour, pre-emption of surface space, etc.; and iii) juveniles post-settlement mortality mainly due to biological interactions (Connell 1985).
Species distribution and abundance in benthic assemblages is strongly influenced by settlement and recruitment processes (Downes and Keough 1998) which change in relation to several biological and physical parameters operating over a range of temporal and spatial scale (Turner and Todd 1993). Regional recruitment variability mainly results from broad-scale hydrodynamics processes and shoreline configuration; while local variability is mainly affected by micro-scale heterogeneity, biotic interaction
and larval supply and behaviour. Quantifying regional and local spatial variability of recruitment could be useful to understand the structure of the assemblages and their temporal differentiation. The use of artificial substrata to carry out studies on the role of recruitment in structuring the assemblages, can be useful to minimize the influence of the habitat heterogeneity (Smith and Rule 2002; Glasby 1998).
1.3 Bioconstruction-erosion processes in coralligenous reefs
Biogenic reefs are built by the accumulation and cementation of calcareous skeleton of many marine organisms and other particles. These formations are very dynamic, involving accretion due to skeletal growth, biotic interaction among co-occurring species, and erosion due to physical and biological processes. They are very complex systems in term of physical structure, associated biota and ecological processes they support (Cocito 2004).
Biogenic carbonate structures assume an important ecological role especially in the northern Adriatic silty-sandy bottoms where they provide ‘island’ of hard substrate for the colonisation by benthic species, increasing habitat complexity and species diversity (Jones et al. 1994). Persistence of these biogenic structures depends on the interplay of the bioconstruction-erosion processes. The influence of both bioconstruction and bioerosion on carbonate budget and their dynamics have been extensively studied in coral reef environments (e.g.: Smith and Kinsey 1978); Le Campion-Alsumard et al. 1993). On the other hand, in Mediterranean coastal marine environments, where calcareous algae thrive and dominate in a large range of habitats (Canals and Ballesteros 1997; Cebrian et al. 2000; Garrabou and Ballesteros 2000), little is known about their
on carbonate content and production in benthic ecosystems have been carried out (Canals and Ballesteros 1997, Cebrian et al. 2000), and a better understanding of the role of macrophytobenthos and macrofauna in the carbon budget is needed.
1.4 Possible species responses to environmental changes
Marine biodiversity and ecosystems are responding to global climate change that involves global warming, reduction of seawater pH, sea level rise, increase of storms and extreme events frequency, occurring to both regional and local-scale (IPCC 2007).
Moreover, direct responses of biodiversity to global climate-driven change are superimposed to several smaller-scale processes (Hawkins et al. 2009). Due to global climate change and related issues, rapid variations are occurring in the distribution patterns of rocky intertidal species on a European scale ({Hawkins, Sugden, et al. 2009 #44280}). Historical data analyses suggest that southern species are advancing while northern species are likely retreating along the latitudinal gradient (Helmuth et al. 2006). In the Mediterranean and Black Sea, changes in the distribution of marine species are already observed (e.g.: Astraldi et al. 1995; Garrabou et al. 2009) and much more are expected for the forthcoming years (Bianchi 2007; Sezgin et al. 2010).
The geographical distribution of the benthic species living on the northern Adriatic biogenic reefs could be related to some environmental conditions (i.e. light, temperature, salinity, sedimentation rate, etc.) that are involved in structuring and maintaining the species diversity of these coralligenous assemblages (Ponti et al. 2011). The increased frequency of the summer thermocline deepening, due to climatic anomalies, and the consequent thermal stress, raise questions about the possible response of several species. Among them, the zooxanthellate octocoral Maasella
edwarsi (De Lacaze-Duthiers 1888), which is present in only one of the several
investigated reefs with a dense population, could be one of the most sensitive species.
Aims of the thesis
The first study of this thesis quantified the spatial variability of the northern Adriatic coralligenous assemblages and identified the major environmental factors shaping the observed patterns of distribution.
The second study focused on role of the settlement and recruitment processes in structuring the assemblages and maintaining their diversity, including either local and regional scales as well as short and long-term analysis.
The third study dealt with the analysis of the balance between bioconstruction and erosion processes occurring in the northern Adriatic coralligenous reefs. The study was carried out using calcareous tiles, which allowed to disentangle the role of endobionts and sessile and vagile epibionts.
Finally, a preliminary study on the responses of the zooxanthellate octocoral Maasella
edwarsi (De Lacaze-Duthiers 1888) to increasing temperature were carried out in order
improve our knowledge on possible future scenarios in relation to global climate change.
Manuscript 1. Spatial-temporal variability of epibenthic assemblages
on subtidal biogenic reefs in the northern Adriatic Sea
Introduction
Mediterranean coralligenous concretions are biogenic reefs formed mainly by the accumulation of calcareous encrusting algae growing in dim light conditions (sensu Ballesteros 2006). Their structure is shaped by the growth patterns of dominant algal species, together with lithification and erosion processes. Coralligenous reefs occur between 20 and 120 m in depth along the Mediterranean coast (Laborel 1987). Coralligenous rims grow on coastal rocks (e.g. vertical cliffs, overhangs and outer part of marine caves) while platform banks develop on the continental shelves over consolidated sediments, coalesced rhodoliths or pre-existing rocky outcrops (Laborel 1987). The latter generally presents biogenic flat reefs with a thickness varying from 0.5 to 4 m, often surrounded by sedimentary bottoms (Ballesteros 2006). Coralligenous assemblages include algal and animal builders, bioeroders, several epi- and endo-faunal species; moreover, they host a rich cryptofauna (Hong 1982). These habitats are considered a “hot spot” of species diversity in the Mediterranean sea (Boudouresque 2004), therefore these reefs are intrinsically valuable for their biological diversity and for the ecological processes that they can support (Ballesteros 2006). Mediterranean coralligenous assemblages are threatened by several sources of human disturbance (e.g. pollution, sediment deposition, recreational fishing and trawling, diving) (Hong 1983; Garrabou et al. 1998; Airoldi 2003 and reference therein; Balata et al. 2005). Global environmental changes, leading to mass mortality events (Cerrano et al. 2000; Linares
2007; Piazzi and Balata 2009), are an additional source of disturbance to these habitats. Other important causes of mortality for these benthic assemblages are bottom hypoxia/anoxia events (Ott 1992; Kollmann and Stachowitsch 2001; Zuschin and Stachowitsch 2009 and references therein), and suffocation by mucilaginous aggregates (Molin et al. 1992; Russo et al. 2005 and references therein). Both phenomena periodically happen in the northern Adriatic Sea.
Conservation and management of the Mediterranean coralligenous habitats require to quantify patterns of variability of the benthic assemblages at a range of spatial and temporal scales (Garrabou et al. 1998; Ferdeghini et al. 2000; Piazzi et al. 2002; Piazzi et al. 2004; Balata et al. 2006; Virgilio et al. 2006). Several studies have recently investigated spatial variability of coralligenous assemblages on coastal rocky cliffs, while structure and variability of platform banks have been rarely investigated.
Although northern Adriatic platform banks were firstly mentioned in the 18th century (Olivi 1792), to date, their benthic assemblages has been analysed only in few locations (Brunetti 1994; Gabriele et al. 1999; Mizzan 2000; Molin et al. 2003; Soresi et al. 2004) and their spatial and temporal variability remains little known (Fava et al. 2009a, Fava et al. 2009b). An approximate checklist of the benthic organisms living on these outcrops can be found in Casellato and Stefanon (2008).
The aim of this study was to investigate spatial and temporal variability of the species assemblages on the coralligenous reefs of the northern Adriatic platform at regional scale throughout four years. Moreover, possible correlations of the species assemblages with environmental variables, geo-morphological features and habitat complexity, were investigated.
Materials and methods
Study area
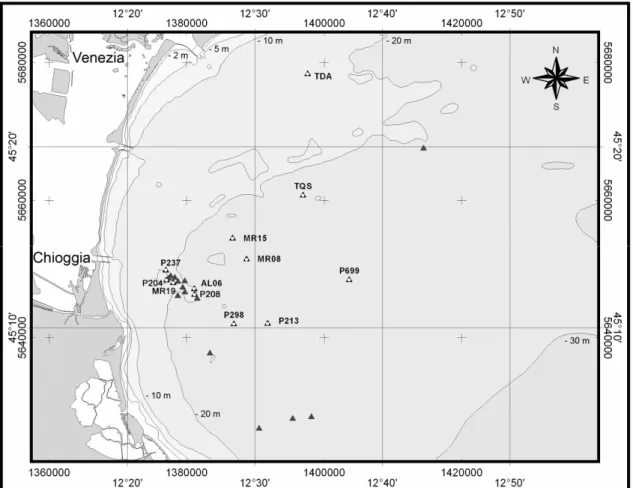
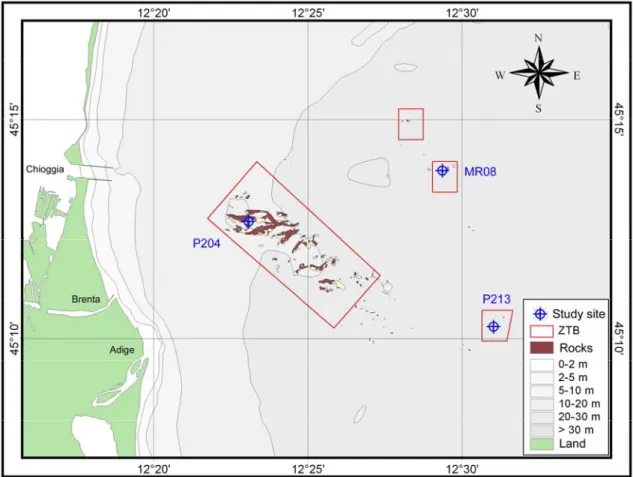
Coralligenous biogenic reefs of the northern Adriatic continental shelf, range from a few to several thousands square metres in size, and up to 4 metres in height from surrounding bottoms (Newton and Stefanon 1975). In the present study, 26 coralligenous reefs, locally named ‘tegnùe’, scattered over an area of about 500 km2, at a depth ranging between 18 and 30 m, and distant 6 to 24 km from the coast, were investigated (Fig. 1). Each outcrop was labelled in accordance with previous publications (e.g. Ponti and Mescalchin, 2008; Fava et al. 2009a). The sedimentary bottoms surrounding the outcrops were mainly characterised by terrigenous sediments superimposed to the Würmian glaciation continental deposits (10-7,000 years ago; Trincardi et al. 1994). Sea currents in the area are driven by the cyclonic geostrophic circulation and by its summertime baroclinic component (Artegiani et al. 1997a, Artegiani et al. 1997b). A strong seasonal halocline and thermocline are found in the area; light penetration to the bottom was strongly affected by fluvial runoff, current transport of sediments, and phytoplankton blooms (Bernardi Aubry et al. 2004 and references therein). Measures carried out in two stations at 25 m in depth indicated an irradiance of about 30-150 MJ m–2 yr–1 (Franco 1984), corresponding to a light attenuation of 1-2% of the mean surface irradiance, estimated in 5,800 MJ m-2 yr-1 (Bernardi Aubry et al. 2004).
Fig. 1. Map of study area, showing the explored rocky outcrops and the twelve randomly selected sampling sites (projection grid utm33 wgs84).
Table 1. Location (geographic coordinates, datum wgs84), geo-morphological features (depth, distance from the coast, extent and height of relief, habitat complexity), surrounding sediment and water characteristics (mud (i.e. silt + clay), organic matter, mean temperature and salinity) of the study sites.
Site Lat N Lon E Depth Coast
Dist . Extent Heig ht Ha bita t
complexity Mud Organic matter Mean T Aug Mean T (Jun-Aug) Mean S (Jun-Aug)
(m) (km) (m2) (m) (%) (% LOI) °C °C (psu) AL06 45° 12.188' 12° 25.258' 21.9 8.5 27,759 2.1 109.98 26.48 4.46 24.11 21.63 37.79 MR08 45° 13.831' 12° 29.354' 22.2 14.6 2,096 1.5 64.13 7.76 4.98 23.54 21.18 37.90 MR15 45° 14.978' 12° 28.258' 23.3 13.6 400 1.5 29.74 22.54 3.24 23.88 21.42 37.84 MR19 45° 12.519' 12° 23.598' 21.1 7.0 441,917 1.5 120.59 22.1 6.06 24.88 22.46 37.52 P204 45° 12.674' 12° 23.076' 20.2 6.6 276,297 2.2 234.54 38.79 4.46 24.88 22.45 37.52 P208 45° 11.877' 12° 25.260' 23.0 8.3 2,380 1.5 49.35 19.91 4.53 24.11 21.62 37.80 P213 45° 10.270' 12° 31.013' 25.4 15.0 1,288 1.2 44.70 19.37 1.82 23.09 20.86 37.95 P237 45° 13.218' 12° 23.020' 20.7 6.8 9,634 4.2 154.30 48.15 4.82 25.07 22.68 37.44 P298 45° 10.240' 12° 28.354' 24.3 11.5 489 0.8 18.47 32.34 3.34 23.02 20.74 37.98 P699 45° 12.683' 12° 37.406' 27.0 23.9 900 0.8 12.45 21.84 4.63 22.24 20.25 38.05 TDA 45° 24.040' 12° 34.150' 19.4 7.5 1,600 3.7 153.18 6.98 5.94 25.17 22.94 37.39 TQS 45° 17.355' 12° 33.792' 23.4 19.5 375 0.8 15.93 24.59 3.65 24.21 21.66 37.81
Sampling and laboratory analyses
Composition and abundances of the epibenthic assemblages were investigated annually, using a non-destructive photographic sampling method, on 12 randomly selected sites located on separated rocky outcrops some kilometres apart (Fig. 1 and Table 1). Photographic samples (17.0x22.6 cm, 0.0384 m2) were collected from 2003 to 2006 in August, using an Olympus Cammedia C-7070 WZ underwater digital camera (7 Mpixel) equipped with a TTL strobe and two 50 Watt halogen lights. A rigid spacer connected to the camera guaranteed constant distance and parallelism between focal plane and substrata. Ten random photo-quadrates were analysed at each sites for each sampling date. This photographic method could underestimate the abundance of some species, like the coralline algae, sometimes partially hidden by other organisms, but it has been widely used in study dealing with spatial and temporal variability of hard bottoms epibenthic assemblages because it allowed large-scale high replicated investigations (Bianchi et al. 2004). Sampling area and number of replicates were defined based on the size of the species occurring on the outcrops and in accordance with the methodologies commonly used on the Mediterranean hard bottoms (Bianchi et al. 2004). Species reference collection over the 26 investigated outcrops (Fig 1), was created by collecting voucher specimens, corresponding to field photographs collection, to allow the identification of the organisms to the lowest possible taxonomic level. Percent cover of sessile organisms was quantified by superimposing a grid of 100 equal sized squares and identifying all taxa visible within each quarters of these squares, i.e. ± 0.25% (Meese and Tomich 1992; Dethier et al. 1993). Percent cover was related to the total readable area of each image, obtained subtracting dark and blurred zone or portion covered by motile organisms. Organisms were identified in accordance with the species
endolithic bioeroder bivalve Gastrochaena dubia was identified and quantified by counting the siphon holes.
Location and morphology of each sampling site was obtained by DGPS and single beam sonar survey, which allowed the 3D GIS based mapping. Habitat complexity (Hci) was estimated linearly combining the rugosity index, height and extent of relief. The rugosity index was estimated as mean ratio between the contoured and straight length among two points (Brokovich et al. 2006) on a 10 metres cross section of the outcrop carried out from the digital bathymetries, replicated six time for each site.
Sediment samples were collected close to the outcrops. Sand and silt-clay content was measured as dry weight percentage after wet sieving (0.063 mm mesh), retaining the fine fraction by filter paper (particle retention 11µm), and drying at 90°C for 24 hours. Sediment organic content was determined as percent loss of weight of the dried samples at 90°C for 24 hours, after ignition (% LOI) at 500°C for 8 hours (King et al. 1998).
Hydrographical data were not available for the area, mean daily temperature (°C) and salinity (psu) near the bottom at each sampling site and for the whole study period were estimated using the ASHELF model. ASHELF is a numeric model developed within the ADRICOSM project (http://gnoo.bo.ingv.it/adricosm/), based on the Princeton Ocean Model (Zavatarelli and Pinardi 2003 and references therein) with data assimilation for the northern Adriatic basin with a 1.5 km grid.
Data analyses
Epibenthic assemblages were analysed in terms of percent cover. Species richness (number of taxa, S), species diversity (as Hill’s diversity number N1 = Exp H’,
where H’ is the Shannon’s index) and the corresponding evenness component (as N10 =
N1/S) were calculated for each replicate sample (Gray 2000). Two-way analysis of
variance (ANOVA) was applied to single taxon and to diversity indices to test for differences among years (4 levels, random) and sites (12 levels, random). The homogeneity of variances was assessed by Cochran’s C test and data were transformed if required. Only when data were distinctly binomially distributed, the arc-sin transformation was applied (Underwood 1997). Percentages of variance components (VC%) were calculated in order to estimate the magnitude of the variability attributable to spatial and temporal factors in comparison to the residual variations among replicates (Underwood 1997).
Spatial distribution and temporal variation of the assemblages were analysed using both principal coordinate analysis (PCO, i.e. metric multidimensional scaling) and cluster analysis (complete linkage method) based on Bray-Curtis similarity of square root transformed data (Gower, 1966; Clarke 1993). Each sampling site was represented on the PCO bi-dimensional ordination plot by the centroid of 10 replicates. Distance-based two-way permutational multivariate analysis of variance (PERMANOVA; Anderson 2001; Anderson and ter Braak 2003) was used to test for differences of epibenthic assemblages among the investigated years (4 levels, random) and sites (12 levels, random). The analysis was based on Bray-Curtis dissimilarities on squared root transformed data. Percentages of variance component (VC%) were calculated for each terms of the analysis.
Relationship between the similarity patterns of the assemblages and environmental variables were investigated by multivariate multiple regression using the DISTLM forward procedure that provided a selection of variables that better explain the
were extent (Log10 transformed) and height of relief, depth, habitat complexity, distance
from coast, longitude and latitude (UTM33 wgs84 coordinates), sediment mud (% silt + % clay) and organic matter (% LOI) content in the surrounding seabed, mean bottom temperature and salinity in August and during the summer (June-August) each year.
Possible linear correlations among the most abundant species percent cover and diversity indices with the environmental variables that better explain the assemblage’s similarity patterns have been investigated by linear regression. The probability that the fitting line slope differed from zero was investigated by ANOVA.
Results
Flora and Fauna
The epibenthic assemblages found on the investigated northern Adriatic coralligenous reefs were very heterogeneous in terms of percent cover of the most abundant taxa. The assemblages were characterised by algal turf (percent cover between 2.7% and 61.37%), calcareous red algae (0.2%-52.35%), encrusting sponges (0.07%-20.28%), massive sponges (0.07%-25.31%), boring sponges (0%-25.44%), colonial ascidians (0%-18.23%), tubular sponges (0%-9.5%), zoantharians (0%-22.8%).
The dominant reef-forming organisms were encrusting calcareous red algae that mostly consisted of Lithophyllum stictaeformae (Areschoug in J. Agardh) Hauck, 1978,
Lithothamnion minervae Basso, 1995 and Peyssonnelia polymorpha (Zanardini) F.
Schmitz, 1879, while other uncalcified red algae included Halymenia floresii (Clemente y Rubio) C. Agardh, 1817 and Botryocladia botryoides (Wulfen) Feldmann, 1941. Algal turf was mainly composed by the Rodophyta Polysiphonia sp., Antithamnion sp. and Rhodymenia sp. and by the Chlorophyta Cladophora sp. and Chaetomorpha sp. The main bioeroders were the boring sponges Cliona celata Grant,1826, Cliona rhodensis
Rützler & Bromley, 1981, Cliona thoosina Topsent, 1887, Cliona viridis (Schmidt, 1862), Pione vastifica (Hancock, 1849) and the endolithic bivalve Gastrochaena dubia (Pennant, 1777). In terms of trophic guilds, epibenthic invertebrates included filter feeders, among which the most common were the sponges Antho (Antho) inconstans (Topsent, 1925), Dictyonella incisa (Schmidt, 1880), Dysidea avara (Schmidt, 1862),
Phorbas fictitius (Bowerbank, 1866), Mycale (Mycale) massa (Schmidt, 1862), Tedania
(Tedania) anhelans (Lieberkühn, 1859), the zoantharian Epizoanthus spp. and the ascidian Polycitor adriaticus (Drasche, 1883). The most common species are described in Ponti and Mescalchin (2008). The species checklist included 14 new records for the northern Adriatic Sea (see Appendix).
Species spatial distribution and temporal variability
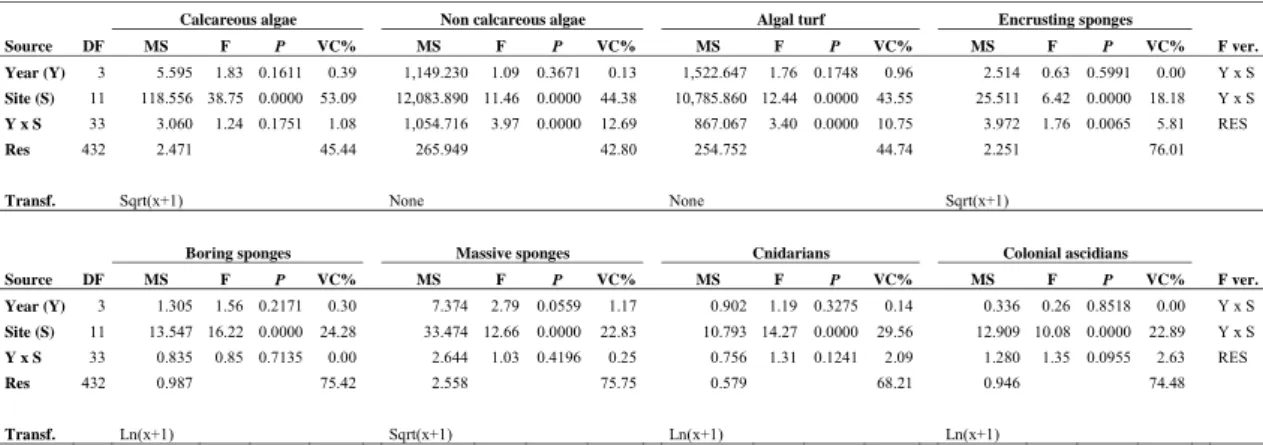
Overall, the percent cover of calcareous algae (Fig. 2a), boring sponges (Fig. 2b), massive sponges, cnidarians and colonial ascidians showed clear spatial distribution patterns with significant differences among sites, while these groups appeared quite steady in time (ANOVA Site: P < 0.01; Table 2). The magnitudes of the variability among sites were similar or lower than the residual variations among replicates, indicating a high heterogeneity at local spatial scale. The abundance of non-calcareous algae (including algal turf), algal turf (Fig. 2c) and encrusting sponges showed complex site-specific temporal trends. Their differences among sites varied annually (ANOVA Year x Site: P < 0.01; Table 2), even if most of the observed variability was associated to differences among sites and replicates.
Fig. 2. Spatial and temporal trends of some ecological group: a) calcareous algae, b) boring sponges, c) algal turf (mean values ± SE).
Table 2. Results from ANOVA on epibenthic percent cover data of the most important ecological groups (VC% = percentage of variance components).
Calcareous algae Non calcareous algae Algal turf Encrusting sponges
Source DF MS F P VC% MS F P VC% MS F P VC% MS F P VC% F ver. Year (Y) 3 5.595 1.83 0.1611 0.39 1,149.230 1.09 0.3671 0.13 1,522.647 1.76 0.1748 0.96 2.514 0.63 0.5991 0.00 Y x S Site (S) 11 118.556 38.75 0.0000 53.09 12,083.890 11.46 0.0000 44.38 10,785.860 12.44 0.0000 43.55 25.511 6.42 0.0000 18.18 Y x S Y x S 33 3.060 1.24 0.1751 1.08 1,054.716 3.97 0.0000 12.69 867.067 3.40 0.0000 10.75 3.972 1.76 0.0065 5.81 RES Res 432 2.471 45.44 265.949 42.80 254.752 44.74 2.251 76.01
Transf. Sqrt(x+1) None None Sqrt(x+1)
Boring sponges Massive sponges Cnidarians Colonial ascidians
Source DF MS F P VC% MS F P VC% MS F P VC% MS F P VC% F ver. Year (Y) 3 1.305 1.56 0.2171 0.30 7.374 2.79 0.0559 1.17 0.902 1.19 0.3275 0.14 0.336 0.26 0.8518 0.00 Y x S Site (S) 11 13.547 16.22 0.0000 24.28 33.474 12.66 0.0000 22.83 10.793 14.27 0.0000 29.56 12.909 10.08 0.0000 22.89 Y x S Y x S 33 0.835 0.85 0.7135 0.00 2.644 1.03 0.4196 0.25 0.756 1.31 0.1241 2.09 1.280 1.35 0.0955 2.63 RES Res 432 0.987 75.42 2.558 75.75 0.579 68.21 0.946 74.48 Transf. Ln(x+1) Sqrt(x+1) Ln(x+1) Ln(x+1)
Analysing the most abundant epibenthic species individually, the percent cover of the calcareous algae Lithothamnion minervae did not vary in time but differed among sites, dominating the deepest locations (Table 3). Most of the variability of L. minervae was due to variations among replicates, rather than to the difference among sites.
Table 3. Results from ANOVA on epibenthic percent cover data of the most abundant species (VC% = percentage of variance components).
Lithothamnion minervae Dictyonella incisa Antho incostans
Source DF MS F P VC% MS F P VC% MS F P VC% F ver. Year (Y) 3 667.936 2.46 0.0804 0.00 2.731 3.22 0.0353 1.29 4.246 3.09 0.0402 1.96 Y x S Site (S) 11 8,842.842 8.87 0.0000 0.35 21.482 25.29 0.0000 42.30 10.113 7.37 0.0000 17.93 Y x S Y x S 33 2,991.503 0.95 0.5558 0.00 0.849 1.27 0.1513 1.47 1.373 1.47 0.0472 3.62 RES Res 432 41,380.990 2.46 99.65 0.670 54.94 0.932 76.48 Transf. ArcSin(%) Ln(x+1) Ln(x+1)
Cliona viridis Gastrochaena dubia Polycitor adriaticus
Source DF MS F P VC% MS F P VC% MS F P VC% F ver. Year (Y) 3 1.596 1.67 0.1914 0.42 36.306 15.2 0.0000 19.26 0.323 0.31 0.8203 0.00 Y x S Site (S) 11 13.562 14.24 0.0000 24.77 13.016 5.45 0.0001 18.11 11.963 11.35 0.0000 23.93 Y x S Y x S 33 0.953 1.00 0.4693 0.01 2.388 3.16 0.0000 11.12 1.054 1.25 0.1694 1.83 RES Res 432 0.952 74.80 0.756 51.51 0.846 74.24 Transf. Ln(x+1) Ln(x+1) Ln(x+1)
The abundance of the encrusting sponges Dictyonella incisa and Antho (Antho)
incostans differed among sites. The first sponge exhibited a slightly decreasing
temporal trend and appeared abundant in shallower and wider outcrops near the coast (Table 3); the second showed a higher spatial-temporal heterogeneity and a general increasing trend with depth (Table 3). The boring sponge Cliona viridis showed a site-specific distribution with a high abundance in some small outcrops, in particular in the site TDA, located off the Venice town (Table 3). The colonial ascidian Polycitor
adriaticus was characterized by not significant variation among years and by high
spatial heterogeneity with higher abundance in small and deep outcrops far from the coast (Table 3). These four species showed most of their variability associated to the
sites and to the variation among replicates, indicating a greater importance of spatial variability compared to the temporal changes.
The abundance of the endolithic bivalve Gastrochaena dubia showed an extremely high variability in both space and time (Table 3).
Species richness (S), species diversity (N1) and evenness (N10) showed high significant differences in the interaction Year X Site confirming the great spatial and temporal heterogeneity of the assemblages (Table 4). In particular, at all sites the number of species seemed to follow a common decreasing temporal trend during the first two years, and a subsequent increase.
Table 4. Results from ANOVA on species diversity indices (VC% = percentage of variance components).
S N1 N10 Source DF MS F P VC% MS F P VC% MS F P VC% F ver. Year (Y) 3 48.424 5.19 0.0048 7.25 2.852 0.700 0.5615 0.00 0.154 4.71 0.0076 3.96 Y x S Site (S) 11 32.287 3.46 0.0028 12.78 19.835 4.840 0.0002 18.50 0.195 5.95 0.0000 15.91 Y x S Y x S 33 9.329 3.16 0.0000 14.19 4.102 2.790 0.0000 12.39 0.033 1.70 0.0101 5.50 RES Res 432 2.954 65.77 1.469 69.11 0.019 74.63
Transf. None None None
Spatial-temporal variability of the epibenthic assemblages
Epibenthic assemblages showed a high variability in terms of both space and time, as showed by the PCO ordination plot (Fig. 3a). The first two axes of the PCO explained 44.4% and 12.0% of the variability of epibenthic assemblages, respectively. The scatter plot discriminated the assemblages inhabiting different sites, as confirmed by PERMANOVA showing significant interaction between Year and Site (Table 5). In addition, variability among sites was greater compared to the temporal changes as showed by the percentages of the variance components (Table 5). The cluster analysis detected five main groups of assemblages represented by: i) four outcrops located near
the shore (AL06, MR19, P204, P237); ii) three small outcrops quite far from the coast (MR08, MR15, TQS); iii) three south-eastern outcrops (P213, P298, P699) and the site TDA in August 2004 and 2005; iv) the site TDA in August 2003 and 2006; v) the site P208 alone (Fig. 3a). These clusters seemed to reflect the geographical position of the outcrops. Similarity of the assemblages among years within each site were generally higher than the similarity among sites in the same year, therefore patterns of similarity were driven by spatial rather then temporal variability (Fig. 3a).
Table 5. Results from PERMANOVA on Bray-Curtis dissimilarities of square rout-transformed epibenthic percent cover data (VC% = percentage of variance components).
Source df SS MS Pseudo-F P (perm) Unique
perms VC% Year (Y) 3 35,886 11962 3.2911 0.0001 9,876 2.64 % Site (S) 11 358,100 32555 8.9567 0.0001 9,850 27.51 % Y x S 33 119,950 3634.7 2.2224 0.0001 9,655 7.61 % Res 432 706,530 1635.5 62.24 % Total 479 1,220,500
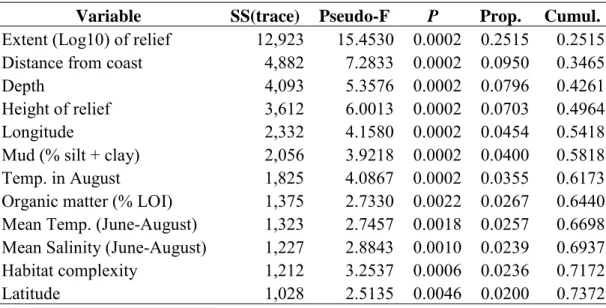
Table 6. Multivariate multiple regression (DISTLM forward procedure) between epibenthic assemblages similarity pattern and environmental variable.
Variable SS(trace) Pseudo-F P Prop. Cumul.
Extent (Log10) of relief 12,923 15.4530 0.0002 0.2515 0.2515 Distance from coast 4,882 7.2833 0.0002 0.0950 0.3465
Depth 4,093 5.3576 0.0002 0.0796 0.4261
Height of relief 3,612 6.0013 0.0002 0.0703 0.4964
Longitude 2,332 4.1580 0.0002 0.0454 0.5418
Mud (% silt + clay) 2,056 3.9218 0.0002 0.0400 0.5818 Temp. in August 1,825 4.0867 0.0002 0.0355 0.6173 Organic matter (% LOI) 1,375 2.7330 0.0022 0.0267 0.6440 Mean Temp. (June-August) 1,323 2.7457 0.0018 0.0257 0.6698 Mean Salinity (June-August) 1,227 2.8843 0.0010 0.0239 0.6937 Habitat complexity 1,212 3.2537 0.0006 0.0236 0.7172
Fig. 3. PCO unconstrained ordination plot (i.e. metric MDS) based on Bray-Curtis dissimilarities of square rout-transformed epibenthic assemblages percent cover data: a) symbols represent sampling sites while year are indicated by numbers, lines show clusters obtained at an arbitrary similarity level of 55%; b) correlation of environmental variable with PCO Axes, represented by superimposed vectors.
Correlation between epibenthic assemblages and environmental variables
Vectors superimposed on the PCO plot graphically represented the relationships between environmental variables and patterns of similarity of the epibenthic assemblages (Fig. 3b). Multivariate multiple regressions indicated that the environmental variables were significantly correlated with patterns of similarity of the benthic assemblages (Table 6). In particular, the cluster of assemblages located near the coast was related to an increase of mud, sediment organic matter, extent and height of relief and summer seawater temperature, while assemblages far from the shore were related to depth and summer salinity.
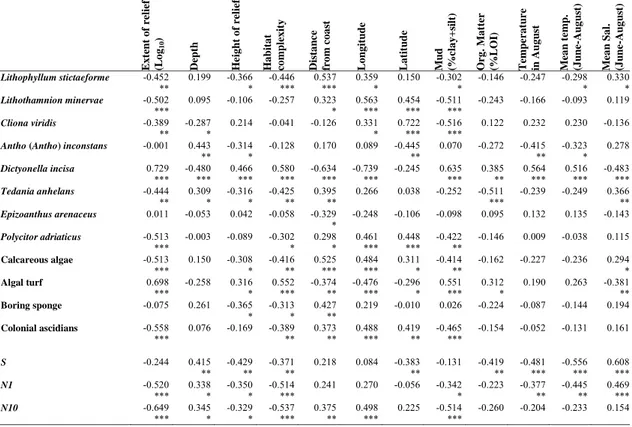
Abundance of algal turf and the encrusting sponge Dictyonella incisa, significantly increased with the extent and height of the outcrops as well as with mud and organic matter content of nearby sediment, while it decreased with the distance from the coast, longitude and salinity (Table 7). On the contrary, Lithophyllum
stictaeforme, Lithothamnion minervae, Cliona viridis and Polycitor adriaticus were
particularly abundant at sites far from the coast, and were negative correlated with mud sediment content and outcrops extent (Table 7). These results are in agreement with the features of the near shore outcrops, which were generally wider, more elevated from the surrounding bottoms, strongly influenced by fluvial inputs, water temperature and salinity.
Species richness and diversity increased with depth and salinity, and decreased with habitat complexity, height of relief, water temperature and organic and mud content in the nearby sediment respectively (Table 7).
Table 7. Correlation matrix displaying r-values among selected taxa, groups of taxa, diversity indices and habitat complexity with environmental variables (*** P < 0.001; ** P < 0.01; * P < 0.05).
Ext ent of r elie f (L o g10 ) Depth He ight o f r elief Ha bitat co mplex ity Dista n c e fr om co as t Long it ude L a ti tu d e Mu d (%cla y + si lt) Or g . Mat ter (%L O I) Temper at u r e in Aug u st Me an tem p . (J u n e-Au g u st ) Mea n Sal. (J u n e-Au g u st ) Lithophyllum stictaeforme -0.452 0.199 -0.366 -0.446 0.537 0.359 0.150 -0.302 -0.146 -0.247 -0.298 0.330 ** * *** *** * * * * Lithothamnion minervae -0.502 0.095 -0.106 -0.257 0.323 0.563 0.454 -0.511 -0.243 -0.166 -0.093 0.119 *** * *** *** *** Cliona viridis -0.389 -0.287 0.214 -0.041 -0.126 0.331 0.722 -0.516 0.122 0.232 0.230 -0.136 ** * * *** ***
Antho (Antho) inconstans -0.001 0.443 -0.314 -0.128 0.170 0.089 -0.445 0.070 -0.272 -0.415 -0.323 0.278
** * ** ** * Dictyonella incisa 0.729 -0.480 0.466 0.580 -0.634 -0.739 -0.245 0.635 0.385 0.564 0.516 -0.483 *** *** *** *** *** *** *** ** *** *** *** Tedania anhelans -0.444 0.309 -0.316 -0.425 0.395 0.266 0.038 -0.252 -0.511 -0.239 -0.249 0.366 ** * * ** ** *** ** Epizoanthus arenaceus 0.011 -0.053 0.042 -0.058 -0.329 -0.248 -0.106 -0.098 0.095 0.132 0.135 -0.143 * Polycitor adriaticus -0.513 -0.003 -0.089 -0.302 0.298 0.461 0.448 -0.422 -0.146 0.009 -0.038 0.115 *** * * *** *** ** Calcareous algae -0.513 0.150 -0.308 -0.416 0.525 0.484 0.311 -0.414 -0.162 -0.227 -0.236 0.294 *** * ** *** *** * ** * Algal turf 0.698 -0.258 0.316 0.552 -0.374 -0.476 -0.296 0.551 0.312 0.190 0.263 -0.381 *** * *** ** *** * *** * ** Boring sponge -0.075 0.261 -0.365 -0.313 0.427 0.219 -0.010 0.026 -0.224 -0.087 -0.144 0.194 * * ** Colonial ascidians -0.558 0.076 -0.169 -0.389 0.373 0.488 0.419 -0.465 -0.154 -0.052 -0.131 0.161 *** ** ** *** ** *** S -0.244 0.415 -0.429 -0.371 0.218 0.084 -0.383 -0.131 -0.419 -0.481 -0.556 0.608 ** ** ** ** ** *** *** *** N1 -0.520 0.338 -0.350 -0.514 0.241 0.270 -0.056 -0.342 -0.223 -0.377 -0.445 0.469 *** * * *** * ** ** *** N10 -0.649 0.345 -0.329 -0.537 0.375 0.498 0.225 -0.514 -0.260 -0.204 -0.233 0.154 *** * * *** ** *** ***
Discussion
The epibenthic assemblages of coralligenous outcrops were mainly composed, in terms of percent cover, by algal turf, calcareous algae and sponges. Results highlighted the importance and the structural role of macroalgal species (Curiel et al. 2010) that has been largely neglected by previous researches (Casellato et al. 2007; Gabriele et al. 1999). Similarly, sponges’ richness has been largely disregarded (5 taxa in Gabriele et al. 1999, 13 in Molin et al. 2003; 27 in Casellato et al. 2007). In the present study, 40 different species of sponges were found, including 8 new records for the Italian coast of the northern Adriatic Sea.
Distribution and abundance of the epibenthic assemblages among the investigated outcrops differed thorough years and sites, with a spatial heterogeneity
being larger than temporal changes. This pattern of variation was confirmed by the distribution of the most abundant taxa (e.g. Cliona viridis, Lithothamnion minervae,
Polycitor adriaticus), which varied among sites but were largely consistent in time.
These patterns indicated a great temporal persistence of the organisms that characterize the coralligenous communities, as also observed by Garrabou et al. (2002) in north-western Mediterranean coralligenous assemblages. Temporal fluctuations were mostly evident for non-reef forming organisms as algal turf and other non-calcareous algae.
The environmental factors in a heterogeneous system as coralligenous habitat could greatly change at local and geographical scale therefore their influence is little known and hard to quantify (Ballesteros 2006). Irradiance and sedimentation rate on the investigated outcrops can vary with their distance from coast and depth. Moreover, near shore outcrops were generally wider and more elevated from the surrounding bottoms. Morphological features and geographical location of the outcrops affected the spatial distribution of the assemblages, while hydrological conditions that changed over time were less relevant.
The irradiance values on sea bottom in the study area (Franco 1984) were comparable to those recorded in coralligenous concretions developed on horizontal surfaces in other Mediterranean continental shallow coastal waters (i.e. Tossa de Mar; Ballesteros 2006). Light availability in the study area decreased approaching the coast because of the presence of several fluvial inflows that deeply affect turbidity, sediment and nutrients supply and phytoplankton growth. Therefore, distance from the coast and river mouths could be included among the drivers of the spatial variability observed in the northern Adriatic epibenthic assemblages. As a result, algal turf was more abundant in the sites near the coast with high mud and organic matter contents in the surrounding
Lithothamnion minervae and the erect sponge Tedania anhelans were positively
correlated with distance from the coast and negatively correlated with mud contents in the surrounding bottoms. These patterns can be explained by the higher resistance to sedimentation and turbidity of algal turf compared to erect and encrusting organisms. Algal turf are known to be able to spread very quickly by vegetative reproduction, independently by the stress regime (Airoldi 1998; Gorgula and Connell 2004; Balata et al. 2005).
Habitat complexity could affect the distribution and abundance of some species, as well as species diversity (Archambault and Bourget 1996 and references therein). Morphologically complex habitat have been shown to be normally associated with a greater species richness (Bergeron and Bourget 1986; Johnson et al. 2003). These observations are in contrast with the present results that showed a negative correlation between habitat complexity and species richness and diversity. The relation between habitat complexity and diversity could be affected by the spatial scale considered here, as habitats could appear homogenous or heterogeneous depending on the spatial scale of observation (Kolasa and Rollo 1991). In the studied area, the most morphologically complex outcrops were located near the shore, where algal turf monopolized space under high sediment deposition, reducing local spatial scale species diversity.
Mediterranean coralligenous habitats showed large spatial and temporal variability at multiple scales. Natural variability of these systems could alter our ability to detect the effect of any natural or anthropogenic disturbance event, and to predict their ecological processes (Denny et al. 2004). In order to protect and manage this marine environment, comprehension of patterns and causes of its variability become a focal point. This regional scale study provides information on the spatial-temporal variability of epibenthic assemblages and on the distribution pattern of the main
organisms. This knowledge could be useful to develop effective growing indicators and ecological status indices for the northern Adriatic coralligenous outcrops based on the ratio between reef builders and bioeroders. The possible effects of some environmental factors have been underlined but further correlative and manipulative studies should be done to investigate the specific role of these factors.
Appendix: Epibenthic sessile flora and fauna reference collection (* new records for the northern Adriatic Sea).
Class Family Species
Florideophyceae Halymeniaceae Halymenia floresii (Clemente y Rubio) C. Agardh, 1817
* Halymenia latifolia P.L. Crouan & H.M. Crouan ex Kützing, 1866
Rhodymeniaceae Botryocladia botryoides (Wulfen) Feldmann, 1941
Peyssonneliaceae Peyssonnelia polymorpha (Zanardini) F. Schmitz, 1879
Corallinaceae * Lithothamnion minervae Basso, 1995
Lithophyllum stictaeforme (Areschoug in J. Agardh) Hauck, 1978
Ulvophyceae Ulvaceae Ulva laetevirens Areschoug, 1854
Demospongiae Plakinidae Oscarella lobularis (Schmidt, 1862)
Geodiidae Geodia cydonium Jamenson, 1811
Clionaidae Cliona celata Grant,1826
Cliona rhodensis Rützler & Bromley, 1981 Cliona viridis Schmidt, 1862
* Cliona thoosina Topsent, 1887
Pione vastifica (Hancock, 1849)
Tethydae Tethya aurantium (Pallas, 1766)
Polymastiidae Polymastia mamillaris (Müller, 1806)
Suberitidae * Pseudosuberites sulphureus (Bean in Bowerbank, 1866)
Suberites domuncula (Olivi, 1792)
Chondrillidae Chondrosia reniformis Nardo, 1847
Microcionidae * Antho (Antho) inconstans (Topsent, 1925)
Coelosphaeridae Lissodendroryx (Lissodendroryx) isodictyalis (Carter, 1882)
Microcionidae Clathria (Clathria) compressa (Schmidt, 1862)
Hymedesmiidae Phorbas tenacior (Topsent, 1925)
Phorbas fictitius Bowerbank, 1866
Tedaniidae Tedania (Tedania) anhelans Lieberkühn, 1849
Myxillidae Myxilla (Myxilla) rosacea (Lieberkühn, 1859)
Esperiopsidae * Ulosa stuposa Esper, 1794
Mycalidae Mycale (Mycale) massa (Schmidt, 1862)
Axinellidae Axinella damicornis (Esper, 1794)
Axinella polypoides Schmidt, 1862
Bubaridae * Bubaris vermiculata (Bowerbank, 1866)
Dictyonellidae Acanthella acuta Schmidt, 1862
* Dictyonella incisa (Schmidt, 1880)
Agelasidae Agelas oroides Schmidt, 1864
Chalinidae Haliclona (Haliclona) simulans (Johnston, 1842)
Haliclona (Reniera) mediterranea Griessinger, 1971
Chalinidae * Haliclona (Soestella) cfr. mamillata (Griessinger, 1971)
Petrosidae Petrosia (Petrosia) ficiformis (Poiret, 1789)
Irciniidae Sarcotragus spinosulus Schmidt, 1862
Ircinia variabilis (Pallas, 1766)
Spongiidae Spongia (Spongia) officinalis Linné, 1759
Dysideidae Dysidea fragilis (Montagu, 1818)
Dysidea avara (Schmidt, 1862)
Aplysinidae Aplysina aerophoba Nardo, 1843
Aplysina cavernicola Vacelet, 1959
Ianthellidae Hexadella racovitzai Topsent, 1896
Hydroidomedusae Eudendriidae Eudendrium spp. Ehrenberg, 1834
Tubulariidae Ectopleura crocea (L. Agassiz, 1832)
Anthozoa Hormathiidae Adamsia carciniopados (Otto, 1823)
Sagartiidae Cereus pedunculatus (Pennant, 1777)
Cornulariidae Cornularia cornucopiae (Pallas, 1766)
Aiptasiidae Aiptasia mutabilis (Gravenhorst, 1831)
Caryophyllidae Caryophyllia smithii Stockes e Broderip, 1828
Faviidae Cladocora caespitosa (Linnaeus, 1767)
Dendrophylliidae Leptopsammia pruvoti Lacaze-Duthiers, 1897
Epizoathidae Epizoanthus spp. Gray, 1867
Parazoanthidae Parazoanthus axinellae (Schmidt, 1862)
Cerianthidae Cerianthus membranaceus (Spallanzani, 1784)
Polychaeta Sabellidae Sabella spallanzanii (Claparède, 1868)
Bispira spp. Krøyer, 1856
Serpulidae Serpula vermicularis Linnaeus, 1767
Serpula concharum Largerhans 1880 Pomatoceros triqueter (Linnaeus, 1767)
Hydroides pseudouncinata pseudouncinata Zibrowius 1971
Polyplacophora Chitonidae Chiton olivaceus Spengler, 1797
Gastropoda (Prosobranchia) Vermetidae Serpulorbis arenarius (Linnaeus, 1767) Bivalvia (Pteromorphia) Anomiidae Anomia ephippium Linnaeus 1758
Arcidae Arca noae Linnaeus, 1758
Mytilidae Mytilus galloprovincialis Lamark, 1819
Pinnidae Pinna nobilis Linnaeus, 1758
Atrina pectinata (Linnaeus,1767)
Ostreidae Ostrea edulis (Linnaeus, 1758)
Bivalvia (Heterodonta) Gastrochaenidae Gastrochaena dubia (Pennant, 1777)
Gymnolaemata Phidoloporidae Rhynchozoon neapolitanum Gautier, 1962
Ascidiacea Pycnoclavellidae * Pycnoclavella cfr. taureanensis Brunetti, 1991
Polycitoridae Cystodytes dellechiajei (Della Valle, 1877)
Polycitor adriaticus (Drasche, 1883)
Polyclinidae Aplidium conicum (Olivi, 1792)
* Aplidium tabarquensis Ramos-Espla, 1991
* Aplidium cfr. densum (Giard, 1872)
Ascidiidae Phallusia mammillata (Cuvier, 1815)
Phallusia fumigata (Grube, 1864)
Styelidae Styela plicata (Lesueur, 1823)
Botryllus schlosseri (Pallas, 1776)
Pyuridae Microcosmus vulgaris Heller, 1877
Pyura microcosmus (Savigny, 1816)
Manuscript 2. Short and long-term colonization patterns of
coralligenous epibenthic assemblages of the northern Adriatic Sea
Introduction
The composition of epibenthic assemblages can be strongly influenced by the initial settlement and recruitment of individuals (Downes and Keough 1998, Glasby 1998). Local variation in the recruitment processes could be affected by micro-scale habitat heterogeneity (Bourget et al. 1994), biotic interactions (Osman and Whitlatch 1998, Hunt and Scheibling 1997, Smith and Witman 1999; Pawlik et al. 1991), larval supply (Underwood and Fairweather 1989, Bertness et al. 1996) and larval behaviour (Rodriguez et al. 1993). Artificial substrates have been largely used to study spatial and temporal variability of species recruitment (Keough and Downes 1982; Keought, 1983; Turner and Todd 1993; Glasby 1998; Watson and Barnes 2004; Rule and Smith 2005; Denitto et al. 2007) and the effect of biotic and abiotic factors on recruitment processes (Anderson and Underwood 1997; Osman and Whitlatch 2004; Krohling and Zalmon 2008; Cabanellas-Reboredo et al. 2009) even if several studies have revealed that complexity and materials of the substrata can affect the heterogeneity and diversity of assemblages (see Guarnieri et al. 2009).
Spatial distribution and temporal variation of epibenthic assemblages of coralligenous rocky outcrops occurring in the northern Adriatic Sea were investigated by Ponti et al. 2011). These assemblages were mainly composed, in terms of percent cover, by algal turf, calcareous algae and sponges. Spatial heterogeneity, at local and regional scale, prevailed over temporal variation and three main typologies of assemblages can be recognised (Ponti et al. 2011). This variability was related both to the geo-morphological features of the outcrops and to environmental variables but several
maintain their diversity. In order to assess the role of the short and long terms recruitment processes in determining such variability, patterns of substrate colonization have been investigated in a 3-years field experiment by means of travertine tiles placed in contact with the natural substrates in three different sites. Differences in composition and abundance of species colonising tiles in relation to local and regional spatial scale were quantified in both short-term (first year) and long-term (3-years) analysis. At the end of the experiment, assemblages colonising artificial substrates were compared with those observed in the natural surrounding rocky habitat.
Materials and methods
Study area
Several coralligenous subtidal reefs occur in soft silty-sandy sediments of the northern Adriatic continental shelf offshore Chioggia and Venice between 19 and 27 metres in depth, ranging in size from only a few to several thousands square metres, and up to 4 metres in height from surrounding bottoms (Ponti et al. 2011). According to previous studies, three main typologies of assemblages, in term of species composition and abundance, were detected: i) four outcrops located near the shore (AL06, MR19, P204, P237), dominated by algal turf and encrusting sponges; ii) three small outcrops quite far from the coast (MR08, MR15, TQS), characterised by red calcareous algae and colonial ascidians and iii) three south-eastern outcrops (P213, P298, P699), which showed intermediate abundances of algal turf and encrusting algae (Ponti et al. 2011). One site for each group of these northern Adriatic biogenic reefs was randomly chosen (Fig.1-Tab. 1).
Figure 1. Map of study area, showing the three investigated sites.
Table 1. Location (geographic coordinates, datum wgs84) and geo-morphological features (depth,
distance from the coast, extent and height of relief) of the study sites.
Site Lat N Lon E Depth Coast Dist. Extent Height
(m) (km) (m2) (m) MR08 45° 13.831' 12° 29.354' 22.2 14.6 2,096 1.5 P204 45° 12.674' 12° 23.076' 20.2 6.6 276,297 2.2 P213 45° 10.270' 12° 31.013' 25.4 15.0 1,288 1.2
Experimental set-up and data collection
Overall, 144 tiles were deployed in August 2005 at the three study sites. Three plots, some metres apart, were randomly selected at each site and 16 travertine tiles (15.0 x 11.5 x 1.0 cm) were located in each plot. Travertine is a form of natural limestone deposited by mineral springs, formed by a process of rapid precipitation of calcium carbonate. These features made it chemically similar to the natural carbonate substratum
of steel nails. Tiles were photographically sampled in January, June, August and October 2006, August 2007 and August 2008, which correspond to 5th, 10th, 12th, 14th, 24th, 36th month after the deployment, respectively. Natural assemblages were photographically sampled close to each experimental plot at each site in August 2008. All the photo-samples were collected using an Olympus Cammedia C-7070 WZ underwater digital camera (7 Mpixel) equipped with a TTL strobe and two 50 Watt halogen lights. Photographic samples of natural assemblages were carried out using a frame with dimension of 17.0 x 22.6 cm, 0.0384 m2. A rigid spacer connected to the camera guaranteed constant distance and parallelism between focal plane and bottom. Four random photo-samples of the tiles for each plot and sampling date and four random photo-samples of the natural assemblages in August 2008 for each plot, were analysed. Abundance of sessile species colonising tiles were estimated as percent cover, for the bivalves Anomia ephippium were also counted the number of specimens per sampled area. Percent cover of sessile organisms was quantified by superimposing a grid of 100 equal sized squares and identifying all taxa visible within each quarter of these squares, corresponding to 0.25% of the total sampled area (Meese and Tomich 1992; Dethier et al. 1993). Percent cover was related to the total readable area of each image, obtained subtracting dark and blurred zone or portion covered by motile organisms. Organisms were identified in accordance with a species reference collection, and assigned to morphological and ecological groups. The endolithic bioeroder bivalve
Gastrochaena dubia was identified and quantified by counting the siphon holes.
Experimental design and statistical analysis
Three different experimental designs were used to investigate the short-term colonisation patterns (i.e. intra-annual sampling within 14 months from tiles
positioning), the long-term settlement trends (i.e. inter-annual sampling for 3 years) and the differences in assemblages between artificial and natural substrates. Short term colonization patterns were analysed to test for differences among dates (4 random levels: January, June, August and October 2006), sites (3 fixed levels: P204, MR08, P213) and plots (3 levels, random, nested in sites).
Differences in the long-term temporal pattern were analysed among dates (3 random levels: 2006, 2007, 2008), sites (3 fixed levels: P204, MR08, P213) and plots (3 levels, random, nested in sites).
At the end of the experiment, assemblages were compared between substrate type (2 fixed levels: natural and artificial), sites (3 fixed levels: P204, MR08, P213) and plots (3 levels, random, nested in sites).
Epibenthic assemblages were analysed in terms of percent cover of the taxa found. Species diversity, in terms of Shannon index (H’, log 2 based) and its corresponding components: species richness (as number of taxa, S) and species evenness (as Pielou index, J’), were calculated for each replicate sample.
Distance-based three-way permutational analysis of variance (PERMANOVA; Anderson and ter Braak 2003) was applied to the three experimental designs to test for differences related to the investigated factors. Univariate analyses were based on the Euclidean distances on untransformed data, while multivariate tests were based on Bray-Curtis similarities on squared root transformed data. Similarities among assemblages were graphically represented by ordination plots obtained using the principal coordinate analysis (PCO, i.e. metric multidimensional scaling; Gower 1966). Relationship between the assemblage’s similarity patterns and the most abundant species were investigated by multivariate multiple regression using the DISTLM
forward procedure that gives a selection of the species that better explain the observed patterns (McArdle and Anderson 2001; Anderson 2004).
Results
Short-term colonization patterns
The recruited assemblages appeared heterogeneous at local scale and well differentiated among sites since the beginning. Analysing the recruited assemblages patterns in 4 dates within the first 14 months after the tiles deployment, PERMANOVA highlighted the significance of the interaction terms Da x Pl(Si) and Da x Si, indicating that differences between assemblages varied across time at the both spatial scale considered: sites and plots (Table 1). The sampling dates showed four different situations in the temporal succession of the assemblages structuring: i) an early period of high heterogeneity at small spatial scale (on January) ii) a time of high differences between assemblages of different sites (on June; pair-wise test: MR08 ≠≠ P204, MR08 ≠ P213, P204 ≠≠ P213) iii) a phase of homogeneity where differences between assemblages couldn’t be detected (on August; pair-wise test: MR08 = P204, MR08 = P213, P204 = P213); and iv) a final stage which showed differences among site P204 and the others two sites MR08 and P213 (on October; pair-wise test: MR08 ≠≠ P204, P213 ≠≠ P204). The temporal trends of the assemblages of the sites MR08 and P213 were very similar in term of direction even if the main differentiation occurred among June and August in P213 and among January and June in MR08. The site P204 displayed a lower general temporal variation in the opposite direction in comparison with the other sites (Fig. 2a).
Table 1. Results from PERMANOVA on Bray-Curtis similarities of square rout-transformed epibenthic percent cover data in the short-term analysis.
Unique
Source df SS MS Pseudo-F P(perm) perms
SI 2 23,693 11847.0 3.8881 0.0021 9,932 DA 3 18,838 6279.2 7.1891 0.0001 9,938 PL(SI) 6 9,338 1556.4 1.7819 0.0518 9,928 DAxSI 6 11,691 1948.5 2.2309 0.0215 9,931 DAxPL(SI) 15 13,101 873.4 2.9306 0.0001 9,856 Res 99 29,505 298.0 Total 131 111,310
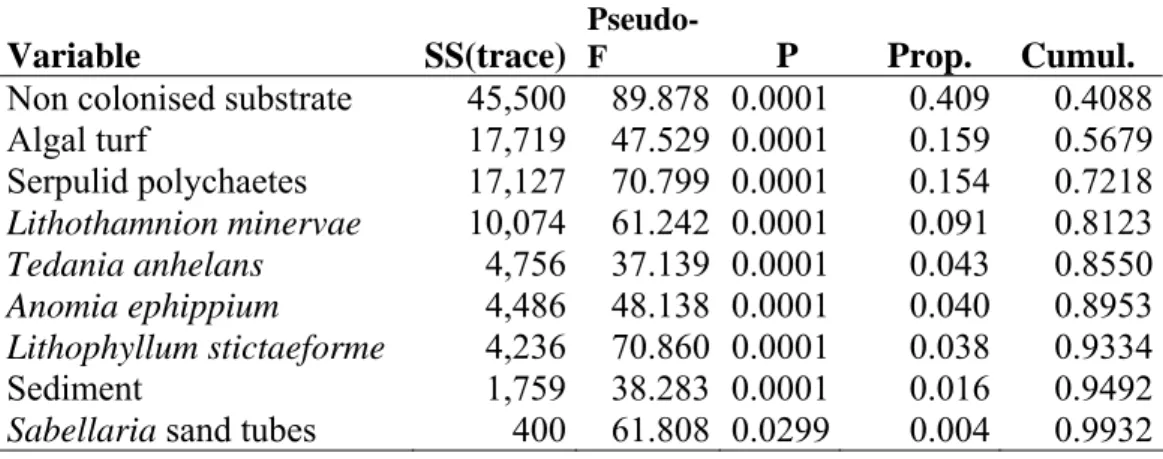
The relationships between single species and patterns of similarities of the epibenthic assemblages were graphically represented by correlation vectors superimposed on the PCO plot (Fig. 2b). Multivariate multiple regressions (DISTLM) indicated that non colonised substrate, algal turf, serpulids, Lithothamnion minervae, Tedania anhelans,
Anomia ephippium, Lithophyllum sticteformae, sediment and Policitor adriaticus
showed a significant correlation with patterns of similarity of the benthic assemblages (explained proportion of the assemblages variability according to the DISTLM forward procedure: 40.87%, 15.91%, 15.38%, 9.05%, 4.27%, 4.03%, 3.80%, 1.58%, 1.39% respectively) (Table 2). Patterns of similarity of MR08 and P213 assemblages in the first and second sampling dates were mainly explained by the non-colonised substrate, the bivalve Anomia ephippium and serpulid polychaetes while in the second and last sampling date by calcareous algae Lithothamnion minervae and Lithophyllum
stictaeforme and the sponge Tedania anhelans. The temporal and spatial differentiations
Table 2. Multivariate multiple regression (DISTLM forward procedure) between epibenthic assemblages similarity pattern and most abundant species.
Variable SS(trace)
Pseudo-F P Prop. Cumul.
Non colonised substrate 45,500 89.878 0.0001 0.409 0.4088
Algal turf 17,719 47.529 0.0001 0.159 0.5679 Serpulid polychaetes 17,127 70.799 0.0001 0.154 0.7218 Lithothamnion minervae 10,074 61.242 0.0001 0.091 0.8123 Tedania anhelans 4,756 37.139 0.0001 0.043 0.8550 Anomia ephippium 4,486 48.138 0.0001 0.040 0.8953 Lithophyllum stictaeforme 4,236 70.860 0.0001 0.038 0.9334 Sediment 1,759 38.283 0.0001 0.016 0.9492
Sabellaria sand tubes 400 61.808 0.0299 0.004 0.9932
At the first sampling date, 5 month after the beginning of the experiment, travertine tiles were mainly colonised by pioneer species like the bivalves Anomia ephippiumm and the serpulid polychaetes. The analysis of single taxa showed that the first colonisers varied across plots and sites, in particular, in the early recruitment phase the most abundant species was Anomia ephippium (PERMANOVA: Da x Pl(Si) p<0.01) in P213 and serpulid polychaetes (PERMANOVA: Si x Da p<0.01 ) in MR08 (Fig 3a-b).
The following recruits were red calcareous algae Lithothamnion minervae (PERMANOVA: Da x Pl(Si) p<0.01 and Si x Da 0.05<p<0.01) and Lithophyllum
stictaeforme (PERMANOVA: Da x Pl(Si) p<0.01 ) in MR08, the sponge Tedania anhelans (PERMANOVA: Si x Da and Pl(Si) p<0.01) in P213 and algal turf
Figure 2. PCO unconstrained ordination (i.e. metric MDS) based on Bray-Curtis similarities of square rout-transformed percent cover data: a) symbols represented sampling dates while colors indicated sites, each point represented the centroid of the observed similarity among the interaction DA x SI; b) each point were the centroid of the observed similarity among replicates and the superimposed vectors represented correlation of single taxa with
Anomia ephippium 0 4 8 12 16 20 24 28 32
January June August October
MR08 P204 P213 Serpulids 0 4 8 12 16 20
January June August October
% MR08 P204 P213 Lithothamnion minervae 0 4 8 12 16 20
January June August October
% MR08 P204 P213 Lithophyllum stictaeforme 0 2 4 6 8 10 12
January June August October
% MR08 P204 P213 Tedania anhelans 0 4 8 12 16
January June August October
% MR08 P204 P213 Algal turf 0 4 8 12 16 20
January June August October
% MR08
P204 P213
Figure 3. Spatial and temporal trends of the selected species: a) Anomia ephippium, b) serpulid polychaetes, c)
Lithothamnion minervae, d) Lithophyllum stictaeforme, e) Tedania anhelans f) algal turf (mean values ± SE).
Site-specific significant differences in term of species richness (S) (PERMANOVA: Da and Si p<0.01), evenness (J’) (PERMANOVA: Da x Pl(Si) p<0.01 and Si p<0.05) and heterogeneity (H’) (PERMANOVA: Da x Pl(Si) p<0.01 and Si p<0.01) among the pairs of site MR08 - P204 and P204 - P213 were detected. On overall MR08 and P213 showed higher value for all the diversity indices compared to P204 (Fig. 4).
S 0 1 2 3 4 5 6 7
January June August October
MR08 P204 P213 J' 0 0.1 0.2 0.3 0.4 0.5 0.6 0.7 0.8
January June August October
MR08 P204 P213 H'(log2) 0 0.2 0.4 0.6 0.8 1 1.2 1.4 1.6 1.8
January June August October
MR08 P204 P213
Fig. 4. Spatial and temporal trends of the diversity indices: a) species richness (S), b) species evenness (J’) and b) species diversity (H’) (mean values ± SE).
Long-term settlement trends