Composition of Arthropod Species Assemblages in Bt-expressing and
Near Isogenic Eggplants in Experimental Fields
SALVATORE ARPAIA,1GRAZIA M. DI LEO,2MARIA C. FIORE,2JO¨RG E. U. SCHMIDT,3 ANDMICHELE SCARDI4
Environ. Entomol. 36(1): 213Ð227 (2007)
ABSTRACT The environmental impact of genetically modiÞed (GM) plants in experimental Þelds has been examined in several ways, in particular with respect to the dynamics of speciÞc nontarget organisms. The approach of sampling for biodiversity in agroecosystems to compare complex patterns could also be useful in studying potential disruptions caused by GM crops. In this study, we set up replicated Þeld plots of Bt-expressing eggplants and near isogenic untransformed eggplants as a control. We monitored the presence and abundance of herbivore and predator arthropods in weekly visual samplings of the plant canopy for three growing seasons (2001Ð2003). Insect species were pooled in organismal taxonomic units (OTUs); three multivariate methods were used to compare species assemblage as an estimate of insect biodiversity. This multistep statistical approach proved to be efÞcient in recognizing association patterns, as evidenced by the data for the target species Lepti-notarsa decemlineataSay (Coleoptera: Chrysomelidae) clearly showing a signiÞcant association with the control plots. All the analyses indicate a comparable species assemblage between transgenic and near isogenic eggplant areas. Our results suggest that some taxa may warrant more speciÞc study. For example, Alticinae beetles (Coleoptera: Chrysomelidae) were alternatively more abundant in either of the two treatments, and their overall abundance was signiÞcantly higher on transgenic eggplants. In light of these results and because of their taxonomic proximity to the target species, these herbivores may represent an important nontarget group to be further studied. Moreover, some sap feeders (e.g., Homoptera: Cicadellidae) were more abundant on Bt-expressing plants in some samples in all 3 yr.
KEY WORDS biodiversity, biosafety, transgenic plants, multivariate analysis, Cry3Bb
The agricultural area that has been planted with ge-netically modiÞed (GM) crops has continuously in-creased since they became commercially available about a decade ago (James 2005). A signiÞcant portion of this area is covered by transgenic plants expressing toxins of the soil bacterium Bacillus thuringiensis Ber-liner (Bt crops) for insect pest control. These plants are frequently assumed to be speciÞc to a limited number of target pests, mainly Lepidoptera or Co-leoptera. However, concerns have been raised that extensive and long-term use of Bt crops especially could directly or indirectly affect the nontarget ar-thropod fauna (Agrawal 2000).
In the Þeld of applied ecology, the debate on “broad view of the ecosystem” versus “selection of a few key organisms or indicator species to test” is still open and ongoing. The “key species” approach attempts to put together a working system by a detailed analysis of single components. An alternative philosophy starts
with the “big picture” and subsequently zooms in to focus on some aspects or components of the system, but only if this is necessary.
Early studies on GM plants were devoted mainly to highlighting possible hazards and pathways of transgenic toxin exposure to higher trophic levels under controlled laboratory conditions and only for a limited period of time (Hilbeck et al. 1998, 1999, Birch et al. 1999, Losey et al. 1999). Subsequently, the analysis of potential risks by examining several components of the arthropod fauna along the food web under natural conditions has at-tracted more interest (Oberhauser and Rivers 2003, Cowgill et al. 2004, French et al. 2004).
Agroecosystems are simpliÞed but nevertheless com-plex ecosystems where, albeit temporarily, multitrophic interactions involving numerous species are established in communities and food webs. It is therefore clear that an ecological analysis based on one or a few precon-ceived key species, while economically and technically easier to conduct, may provide incomplete information about the complex interactions between GM crops and higher trophic levels. Agriculture depends on several ecological functions that are essential to soil fertility and crop productivity (e.g., microbial decomposition and nu-trient cycling, crop pollination by animals, food turn-over). All zoological groups that mediate these functions,
1Corresponding author: ENEAÐItalian National Agency for New Technologies, Energy, and the Environment, Research Centre Tri-saia, S.S. 106 Jonica, km 419.5, I-75026 Rotondella (MT), Italy (e-mail: [email protected]).
2Metapontum Agrobios, Metaponto, Italy.
3Institute of Integrative Biology, ETH Zurich, Switzerland. 4Universita` degli Studi “Tor Vergata,” Rome, Italy.
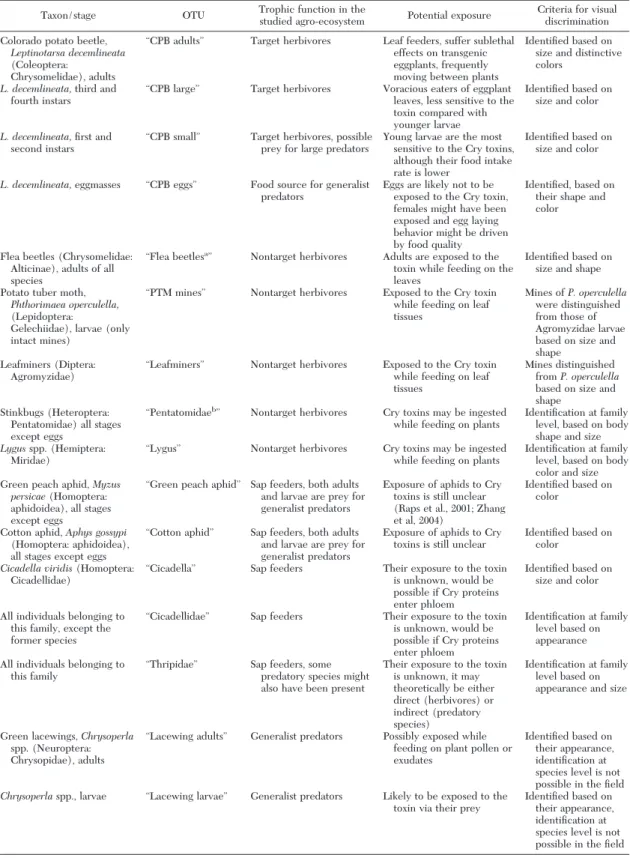
Table 1. Criteria for pooling taxonomic groups found in experimental eggplant fields (2001–2003) in OTUs
Taxon/stage OTU Trophic function in the
studied agro-ecosystem Potential exposure
Criteria for visual discrimination Colorado potato beetle,
Leptinotarsa decemlineata
(Coleoptera: Chrysomelidae), adults
“CPB adults” Target herbivores Leaf feeders, suffer sublethal effects on transgenic eggplants, frequently moving between plants
IdentiÞed based on size and distinctive colors
L. decemlineata,third and fourth instars
“CPB large” Target herbivores Voracious eaters of eggplant leaves, less sensitive to the toxin compared with younger larvae
IdentiÞed based on size and color
L. decemlineata,Þrst and second instars
“CPB small” Target herbivores, possible prey for large predators
Young larvae are the most sensitive to the Cry toxins, although their food intake rate is lower
IdentiÞed based on size and color
L. decemlineata,eggmasses “CPB eggs” Food source for generalist predators
Eggs are likely not to be exposed to the Cry toxin, females might have been exposed and egg laying behavior might be driven by food quality
IdentiÞed, based on their shape and color
Flea beetles (Chrysomelidae: Alticinae), adults of all species
“Flea beetlesa” Nontarget herbivores Adults are exposed to the toxin while feeding on the leaves
IdentiÞed based on size and shape Potato tuber moth,
Phthorimaea operculella,
(Lepidoptera:
Gelechiidae), larvae (only intact mines)
“PTM mines” Nontarget herbivores Exposed to the Cry toxin while feeding on leaf tissues
Mines of P. operculella were distinguished from those of Agromyzidae larvae based on size and shape
Leafminers (Diptera: Agromyzidae)
“Leafminers” Nontarget herbivores Exposed to the Cry toxin while feeding on leaf tissues
Mines distinguished from P. operculella based on size and shape
Stinkbugs (Heteroptera: Pentatomidae) all stages except eggs
“Pentatomidaeb” Nontarget herbivores Cry toxins may be ingested while feeding on plants
IdentiÞcation at family level, based on body shape and size
Lygusspp. (Hemiptera: Miridae)
“Lygus” Nontarget herbivores Cry toxins may be ingested while feeding on plants
IdentiÞcation at family level, based on body color and size Green peach aphid, Myzus
persicae(Homoptera: aphidoidea), all stages except eggs
“Green peach aphid” Sap feeders, both adults and larvae are prey for generalist predators
Exposure of aphids to Cry toxins is still unclear (Raps et al., 2001; Zhang et al, 2004)
IdentiÞed based on color
Cotton aphid, Aphys gossypi (Homoptera: aphidoidea), all stages except eggs
“Cotton aphid” Sap feeders, both adults and larvae are prey for generalist predators
Exposure of aphids to Cry toxins is still unclear
IdentiÞed based on color
Cicadella viridis(Homoptera: Cicadellidae)
“Cicadella” Sap feeders Their exposure to the toxin is unknown, would be possible if Cry proteins enter phloem
IdentiÞed based on size and color
All individuals belonging to this family, except the former species
“Cicadellidae” Sap feeders Their exposure to the toxin is unknown, would be possible if Cry proteins enter phloem
IdentiÞcation at family level based on appearance All individuals belonging to
this family
“Thripidae” Sap feeders, some predatory species might also have been present
Their exposure to the toxin is unknown, it may theoretically be either direct (herbivores) or indirect (predatory species) IdentiÞcation at family level based on appearance and size
Green lacewings, Chrysoperla spp. (Neuroptera: Chrysopidae), adults
“Lacewing adults” Generalist predators Possibly exposed while feeding on plant pollen or exudates
IdentiÞed based on their appearance, identiÞcation at species level is not possible in the Þeld
Chrysoperlaspp., larvae “Lacewing larvae” Generalist predators Likely to be exposed to the toxin via their prey
IdentiÞed based on their appearance, identiÞcation at species level is not possible in the Þeld
should therefore be considered to avoid a common in-tellectual shortcut that equates population density with function (Arpaia 2004).
The use of more realistic Þeld studies has been advocated as a fundamental requirement for the study of potential ecological impacts of GM crops (Firbank et al. 2005). The recently published series of Þeld studies in this section of Environmental Entomology has provided an avenue for improving our knowledge
of transgenic corn and cotton agroecosystems. A sig-niÞcant reduction in the populations of some taxa was detected in multi-year Þeld experiments (Daly and Buntin 2005, Dively 2005, Naranjo 2005a, Pilcher et al. 2005, Whitehouse et al. 2005). Nevertheless, these effects occurred only in a minority of sampled species and were of lesser magnitude than the effects of in-secticidal sprays (Bhatti et al. 2005a, b, Dively 2005, Naranjo 2005a, Whitehouse et al. 2005). Even in the Table 1. Continued
Taxon/stage OTU Trophic function in the
studied agro-ecosystem Potential exposure
Criteria for visual discrimination
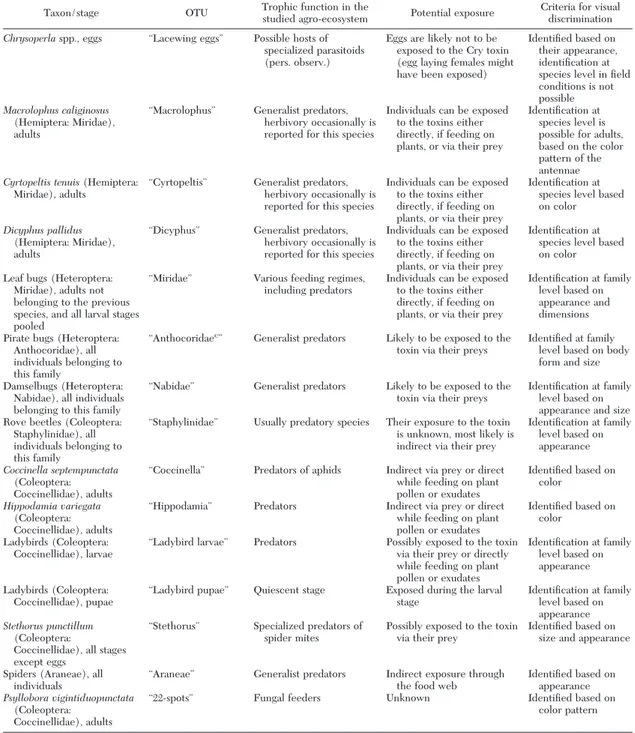
Chrysoperlaspp., eggs “Lacewing eggs” Possible hosts of specialized parasitoids (pers. observ.)
Eggs are likely not to be exposed to the Cry toxin (egg laying females might have been exposed)
IdentiÞed based on their appearance, identiÞcation at species level in Þeld conditions is not possible
Macrolophus caliginosus
(Hemiptera: Miridae), adults
“Macrolophus” Generalist predators, herbivory occasionally is reported for this species
Individuals can be exposed to the toxins either directly, if feeding on plants, or via their prey
IdentiÞcation at species level is possible for adults, based on the color pattern of the antennae
Cyrtopeltis tenuis(Hemiptera: Miridae), adults
“Cyrtopeltis” Generalist predators, herbivory occasionally is reported for this species
Individuals can be exposed to the toxins either directly, if feeding on plants, or via their prey
IdentiÞcation at species level based on color
Dicyphus pallidus
(Hemiptera: Miridae), adults
“Dicyphus” Generalist predators, herbivory occasionally is reported for this species
Individuals can be exposed to the toxins either directly, if feeding on plants, or via their prey
IdentiÞcation at species level based on color Leaf bugs (Heteroptera:
Miridae), adults not belonging to the previous species, and all larval stages pooled
“Miridae” Various feeding regimes, including predators
Individuals can be exposed to the toxins either directly, if feeding on plants, or via their prey
IdentiÞcation at family level based on appearance and dimensions Pirate bugs (Heteroptera:
Anthocoridae), all individuals belonging to this family
“Anthocoridaec” Generalist predators Likely to be exposed to the toxin via their preys
IdentiÞed at family level based on body form and size Damselbugs (Heteroptera:
Nabidae), all individuals belonging to this family
“Nabidae” Generalist predators Likely to be exposed to the toxin via their preys
IdentiÞcation at family level based on appearance and size Rove beetles (Coleoptera:
Staphylinidae), all individuals belonging to this family
“Staphylinidae” Usually predatory species Their exposure to the toxin is unknown, most likely is indirect via their prey
IdentiÞcation at family level based on appearance Coccinella septempunctata (Coleoptera: Coccinellidae), adults
“Coccinella” Predators of aphids Indirect via prey or direct while feeding on plant pollen or exudates IdentiÞed based on color Hippodamia variegata (Coleoptera: Coccinellidae), adults
“Hippodamia” Predators Indirect via prey or direct while feeding on plant pollen or exudates
IdentiÞed based on color
Ladybirds (Coleoptera: Coccinellidae), larvae
“Ladybird larvae” Predators Possibly exposed to the toxin via their prey or directly while feeding on plant pollen or exudates IdentiÞcation at family level based on appearance Ladybirds (Coleoptera: Coccinellidae), pupae
“Ladybird pupae” Quiescent stage Exposed during the larval stage IdentiÞcation at family level based on appearance Stethorus punctillum (Coleoptera:
Coccinellidae), all stages except eggs
“Stethorus” Specialized predators of spider mites
Possibly exposed to the toxin via their prey
IdentiÞed based on size and appearance
Spiders (Araneae), all individuals
“Araneae” Generalist predators Indirect exposure through the food web
IdentiÞed based on appearance
Psyllobora vigintiduopunctata
(Coleoptera: Coccinellidae), adults
“22-spots” Fungal feeders Unknown IdentiÞed based on
Table 2. Mean no. of individuals per plant (ⴞ SE) recorded in eggplant field sampling in Southern Italy during the growing season 2001 OTU 26 July 2 Aug. 9 Aug. 13 Aug. 21 Aug. 24 Aug. Bt Control Bt Control Bt Control Bt Control Bt Control Bt Control CPB adults 0 0000 0 0 0 0 0 0 0 Flea beetles 0.33 ⫾ 0.07 0.45 ⫾ 0.13 0.13 ⫾ 0.05 0.35 ⫾ 0.08 0.62 ⫾ 0.12 0.48 ⫾ 0.10 1.33 ⫾ 0.24 0.97 ⫾ 0.20 2.75 ⫾ 0.40 3.77 ⫾ 0.47 5.78 ⫾ 0.60 4.40 ⫾ 0.53 PTM mines 0.17 ⫾ 0.07 0.25 ⫾ 0.07 0.37 ⫾ 0.10 0.18 ⫾ 0.06 0.40 ⫾ 0.12 0.33 ⫾ 0.08 0.28 ⫾ 0.09 0.18 ⫾ 0.05 0.52 ⫾ 0.11 0.32 ⫾ 0.09 0.55 ⫾ 0.12 0.37 ⫾ 0.11 Green peach aphid 0 0000 0 0.45 ⫾ 0.26 1.05 ⫾ 0.55 0 0.02 ⫾ 0.02 0 0 Cotton aphid 0 0.02 ⫾ 0.02 0.02 ⫾ 0.02 0 0 0 0 0.02 ⫾ 0.02 0 0.05 ⫾ 0.03 0 1.95 ⫾ 1.95 Cicadellidae 0.42 ⫾ 0.10 0.67 ⫾ 0.12 0.70 ⫾ 0.12 0.67 ⫾ 0.11 0.40 ⫾ 0.08 0.30 ⫾ 0.06 3.90 ⫾ 0.64 3.49 ⫾ 0.50 3.87 ⫾ 0.61 2.83 ⫾ 0.42 3.37 ⫾ 0.43 3.55 ⫾ 0.53 Thripidae 0.03 ⫾ 0.02 0.07 ⫾ 0.03 0.07 ⫾ 0.03 0.02 ⫾ 0.02 0.05 ⫾ 0.03 0.05 ⫾ 0.03 0.20 ⫾ 0.06 0.25 ⫾ 0.09 0.13 ⫾ 0.08 0.18 ⫾ 0.09 2.40 ⫾ 0.30 1.55 ⫾ 0.24 Lacewing larvae 0 0000 0 0.05 ⫾ 0.03 0.02 ⫾ 0.02 0 0.05 ⫾ 0.04 0.18 ⫾ 0.09 0 Lacewing eggs 0.07 ⫾ 0.03 0.03 ⫾ 0.02 0.15 ⫾ 0.05 0.17 ⫾ 0.05 0.47 ⫾ 0.08 0.43 ⫾ 0.06 1.35 ⫾ 0.25 1.55 ⫾ 0.24 2.25 ⫾ 0.21 2.45 ⫾ 0.21 0.88 ⫾ 0.20 1.25 ⫾ 0.27 Miridae 0 0000 0 0.13 ⫾ 0.05 0.18 ⫾ 0.13 0.40 ⫾ 0.13 0.53 ⫾ 0.14 0.97 ⫾ 0.11 0.78 ⫾ 0.14 Anthocoridae 0 0 0.05 ⫾ 0.03 0.02 ⫾ 0.02 0.18 ⫾ 0.05 0.10 ⫾ 0.04 0.30 ⫾ 0.08 0.25 ⫾ 0.09 0.28 ⫾ 0.11 0.35 ⫾ 0.09 0.57 ⫾ 0.12 0.65 ⫾ 0.12 Nabidae 0.02 ⫾ 0.02 0.03 ⫾ 0.02 0.03 ⫾ 0.02 0.08 ⫾ 0.04 0.17 ⫾ 0.05 0.30 ⫾ 0.06 0.15 ⫾ 0.05 0.03 ⫾ 0.02 0.27 ⫾ 0.06 0.18 ⫾ 0.06 0.18 ⫾ 0.05 0.12 ⫾ 0.04 Staphylinidae 0 0000 0 0.05 ⫾ 0.04 0.08 ⫾ 0.04 1.07 ⫾ 0.23 0.28 ⫾ 0.12 0.13 ⫾ 0.05 0.07 ⫾ 0.03 Coccinella 0 0 0.02 ⫾ 0.02 0 0 0 0.02 ⫾ 0.02 0 0 0 0 0 Ladybird larvae 0 0000 0 0.20 ⫾ 0.13 0.38 ⫾ 0.30 0 0 0 0 Araneae 0.07 ⫾ 0.03 0.10 ⫾ 0.05 0.02 ⫾ 0.02 0 0.02 ⫾ 0.02 0.02 ⫾ 0.02 0.10 ⫾ 0.04 0.02 ⫾ 0.02 0 0.18 ⫾ 0.06 0.03 ⫾ 0.02 0 22-spots 0 0000 0 0 0 0.02 ⫾ 0.02 0.03 ⫾ 0.02 0 0 OTU 28 Aug. 31 Aug. 4 Sept. 7 Sept. 11 Sept. 14 Sept. Bt Control Bt Control Bt Control Bt Control Bt Control Bt Control CPB adults 0 0.02 ⫾ 0.02 0 0 0.05 ⫾ 0.03 0.02 ⫾ 0.02 0.03 ⫾ 0.02 0.05 ⫾ 0.03 0 0 0 0.02 ⫾ 0.02 Flea beetles 11.25 ⫾ 1.28 10.12 ⫾ 0.87 15.85 ⫾ 0.95 13.63 ⫾ 1.26 25.03 ⫾ 2.67 18.10 ⫾ 1.63 20.22 ⫾ 1.34 17.23 ⫾ 1.22 15.05 ⫾ 0.88 14.32 ⫾ 1.16 20.95 ⫾ 1.05 17.68 ⫾ 1.11 PTM mines 0.32 ⫾ 0.11 0.27 ⫾ 0.09 0.28 ⫾ 0.09 0.50 ⫾ 0.12 0.20 ⫾ 0.07 0.38 ⫾ 0.12 0.10 ⫾ 0.05 0.13 ⫾ 0.06 0.13 ⫾ 0.06 0.12 ⫾ 0.07 0.07 ⫾ 0.03 0.05 ⫾ 0.03 Green peach aphid 0.07 ⫾ 0.04 0 0 0.02 ⫾ 0.02 0.02 ⫾ 0.02 0.10 ⫾ 0.05 0.02 ⫾ 0.02 0.02 ⫾ 0.02 0.07 ⫾ 0.05 0 0 0 Cotton aphid 0 0.03 ⫾ 0.02 0.32 ⫾ 0.10 0.17 ⫾ 0.07 0.07 ⫾ 0.03 0.07 ⫾ 0.05 0.12 ⫾ 0.05 0.03 ⫾ 0.02 0 0.02 ⫾ 0.02 0.03 ⫾ 0.02 0.05 ⫾ 0.03 Cicadellidae 4.28 ⫾ 0.43 3.18 ⫾ 0.46 6.42 ⫾ 0.53 5.83 ⫾ 0.61 6.17 ⫾ 0.59 3.97 ⫾ 0.51 6.55 ⫾ 0.66 4.65 ⫾ 0.43 1.33 ⫾ 0.26 1.62 ⫾ 0.27 3.67 ⫾ 0.43 3.30 ⫾ 0.47 Thripidae 0.20 ⫾ 0.11 0.15 ⫾ 0.06 0.18 ⫾ 0.07 0.05 ⫾ 0.03 0.03 ⫾ 0.02 0.12 ⫾ 0.05 0.25 ⫾ 0.10 0.08 ⫾ 0.06 0.02 ⫾ 0.02 0.02 ⫾ 0.02 0.03 ⫾ 0.02 0.07 ⫾ 0.04 Lacewing larvae 0.07 ⫾ 0.03 0.08 ⫾ 0.07 0.05 ⫾ 0.03 0.02 ⫾ 0.02 0.07 ⫾ 0.04 0.02 ⫾ 0.02 0.03 ⫾ 0.02 0.03 ⫾ 0.02 0 0 0.02 ⫾ 0.02 0 Lacewing eggs 1.60 ⫾ 0.17 1.10 ⫾ 0.16 1.25 ⫾ 0.24 2.25 ⫾ 0.22 2.58 ⫾ 0.24 2.02 ⫾ 0.25 2.28 ⫾ 0.23 2.92 ⫾ 0.25 2.30 ⫾ 0.28 2.45 ⫾ 0.25 5.08 ⫾ 0.32 4.93 ⫾ 0.29 Miridae 0.68 ⫾ 0.14 1.15 ⫾ 0.28 1.40 ⫾ 0.18 1.00 ⫾ 0.19 0.87 ⫾ 0.14 0.97 ⫾ 0.21 0.77 ⫾ 0.13 0.50 ⫾ 0.11 0.15 ⫾ 0.05 0.08 ⫾ 0.04 0.10 ⫾ 0.05 0.08 ⫾ 0.07 Anthocoridae 0.23 ⫾ 0.07 0.32 ⫾ 0.08 0.52 ⫾ 0.13 0.25 ⫾ 0.07 0.32 ⫾ 0.11 0.28 ⫾ 0.08 0 0.02 ⫾ 0.02 0.07 ⫾ 0.03 0.12 ⫾ 0.05 0 0 Nabidae 0.30 ⫾ 0.07 0.42 ⫾ 0.10 0.52 ⫾ 0.09 0.47 ⫾ 0.10 0.37 ⫾ 0.08 0.35 ⫾ 0.09 0.30 ⫾ 0.08 0.15 ⫾ 0.05 0.42 ⫾ 0.07 0.33 ⫾ 0.07 0.15 ⫾ 0.06 0.05 ⫾ 0.03 Staphylinidae 1.53 ⫾ 0.28 0.67 ⫾ 0.16 0.40 ⫾ 0.15 0.47 ⫾ 0.13 0.40 ⫾ 0.10 0.13 ⫾ 0.06 0.40 ⫾ 0.10 0.15 ⫾ 0.05 0.02 ⫾ 0.02 0 0 0 Coccinella 0.03 ⫾ 0.02 0.05 ⫾ 0.03 0 0 0 0 0 0.05 ⫾ 0.03 0 0 0 0 Ladybird larvae 0 0000 0 0 0 0 0 0 0 Araneae 0.15 ⫾ 0.05 0.05 ⫾ 0.04 0.13 ⫾ 0.05 0.25 ⫾ 0.08 0.17 ⫾ 0.05 0.12 ⫾ 0.04 0.17 ⫾ 0.05 0.17 ⫾ 0.05 0.08 ⫾ 0.04 0.05 ⫾ 0.03 0.10 ⫾ 0.05 0.03 ⫾ 0.02 22-spots 0 0.017 ⫾ 0.017 0.083 ⫾ 0.036 0.017 ⫾ 0.017 0.017 ⫾ 0.017 0.05 ⫾ 0.028 0 0 0 0 0.017 ⫾ 0.017 0 OTU 18 Sept. 21 Sept. 25 Sept. 28 Sept. 2 Oct. 5 Oct. Bt Control Bt Control Bt Control Bt Control Bt Control Bt Control CPB adults 0 0 0 0 0.02 ⫾ 0.02 0 0 0 0 0 0 0 Flea beetles 32.90 ⫾ 3.43 17.90 ⫾ 2.25 36.78 ⫾ 2.85 25.25 ⫾ 1.94 35.05 ⫾ 2.73 30.68 ⫾ 3.16 24.75 ⫾ 1.63 26.15 ⫾ 1.65 32.25 ⫾ 2.03 30.13 ⫾ 1.61 35.58 ⫾ 1.95 39.10 ⫾ 1.71 PTM mines 0.10 ⫾ 0.06 0.30 ⫾ 0.13 0 0.13 ⫾ 0.06 0.08 ⫾ 0.04 0.10 ⫾ 0.06 0.15 ⫾ 0.06 0.07 ⫾ 0.04 0.35 ⫾ 0.08 0.10 ⫾ 0.04 0.07 ⫾ 0.05 0.20 ⫾ 0.07 Green peach aphid 0.03 ⫾ 0.03 0.03 ⫾ 0.02 0.07 ⫾ 0.05 0.05 ⫾ 0.03 0 0.05 ⫾ 0.04 0 0 0 0.08 ⫾ 0.04 0 0 Cotton aphid 0.02 ⫾ 0.02 0.15 ⫾ 0.05 0.15 ⫾ 0.08 0.42 ⫾ 0.24 0.25 ⫾ 0.10 0.07 ⫾ 0.05 0 0 0.35 ⫾ 0.09 0 0.17 ⫾ 0.06 0.15 ⫾ 0.06 Cicadellidae 4.02 ⫾ 0.43 2.67 ⫾ 0.36 4.28 ⫾ 0.41 3.93 ⫾ 0.38 4.22 ⫾ 0.47 3.77 ⫾ 0.42 1.85 ⫾ 0.19 1.88 ⫾ 0.15 4.37 ⫾ 0.28 2.73 ⫾ 0.29 3.23 ⫾ 0.31 3.02 ⫾ 0.29 Thripidae 0 0 0.12 ⫾ 0.05 0.12 ⫾ 0.05 0.35 ⫾ 0.12 0.10 ⫾ 0.05 0 0 0.67 ⫾ 0.17 0.37 ⫾ 0.15 0.48 ⫾ 0.16 0.62 ⫾ 0.16 Lacewing larvae 0.02 ⫾ 0.02 0.08 ⫾ 0.04 0.08 ⫾ 0.04 0 0.10 ⫾ 0.70 0.02 ⫾ 0.02 0 0 0.02 ⫾ 0.02 0 0.03 ⫾ 0.02 0
case of reduced abundance of some generalist pred-ators, Naranjo (2005b) found no difference in the overall intensity of natural predation. Potential haz-ards for some nontarget species interacting with GM plants were found in laboratory conditions (Lovei and Arpaia 2005), but no ecological impacts have been veriÞed speciÞcally in the Þeld.
This study has two objectives: Þrst, we aimed at de-tecting the potential impact of growing transgenic egg-plants (Solanum melongena L.) expressing Cry3Bb toxin on nontarget herbivores and on generalist predators. Transgenic eggplants were tested in the Þeld for their resistance to Coleoptera (Acciarri et al. 2000), but only limited information about nontarget insects was col-lected. The second goal is the use of community ecology methods for evaluating detectable changes in the struc-ture of arthropod assemblages as a proxy for the overall change in biotic communities associated with these plants. We therefore propose the use of a multistep approach, based on multivariate tests.
Materials and Methods
Plants. The transgenic eggplant line 9 Ð 8 expressing
the Bt toxin Cry3Bb for the control of Colorado potato beetle was obtained by genetic transformation of the eggplant line DR2 (Arpaia et al. 1997). These trans-formed and control plants were used for the Þrst Þeld trial in 2001. In the two following cropping seasons (2002 and 2003), F1 hybrid progeny were used for Þeld experiments to use more productive plants. The hybrids were derived from the transgenic line 9 Ð 8 used as a female parent, whereas near isogenic con-trols were obtained from the DR2 line as a female parent. To test for the presence of the transgene, all seedlings were selected in vivo by spraying them with a kanamicin solution according to the protocol of Sunseri et al. (1993) before transplanting them in the Þeld. In addition, a polymerase chain reaction (PCR) analysis was performed with 20 randomly chosen transgenic eggplants. Genomic DNA was extracted from young leaves and ampliÞed using the speciÞc Cry3Bb primers: seven forward (5 ⬘-GTGC-CACAGGATTCTATCGAC-3⬘) and four reverse (5⬘-GATATCGTTGCAACAAGGCA-3⬘).
Transgenic plants were tested for toxin expression in previous Þeld studies (Acciarri et al. 2000) and showed expression in all above-ground plant tissues (young and old leaves, ßowers, fruits) as expected when using a 35S promoter. The same plants were previously assessed for several years in Þeld trials and evidenced higher yield compared with their isolines under heavy herbivore pressure caused by L. decem-lineata(Acciarri et al. 2000, Mennella et al. 2005).
Experimental Design. Three Þeld trials were
car-ried out in Metaponto (Southern Italy) from 2001 to 2003. Restrictions imposed by the local government obliged us to change the site of the deliberate Þeld release in every cropping season; therefore, eggplant Þelds were alternately prepared in two different ex-perimental stations in the same area (Pantanello and Campo 7). The chosen Þelds are usually cultivated
Lacewing eggs 4.92 ⫾ 0.44 4.08 ⫾ 0.45 4.95 ⫾ 0.32 4.63 ⫾ 0.44 3.95 ⫾ 0.41 3.52 ⫾ 0.32 1.52 ⫾ 0.15 1.73 ⫾ 0.17 3.10 ⫾ 0.37 2.37 ⫾ 0.21 2.17 ⫾ 0.24 3.37 ⫾ 0.30 Miridae 0.57 ⫾ 0.11 0.38 ⫾ 0.11 0.38 ⫾ 0.09 0.38 ⫾ 0.10 1.17 ⫾ 0.23 0.43 ⫾ 0.13 0.45 ⫾ 0.08 0.52 ⫾ 0.09 0.20 ⫾ 0.07 0.17 ⫾ 0.06 0.20 ⫾ 0.06 0.25 ⫾ 0.07 Anthocoridae 0.28 ⫾ 0.13 0.22 ⫾ 0.07 0.08 ⫾ 0.04 0.25 ⫾ 0.08 0.15 ⫾ 0.05 0.12 ⫾ 0.06 0.12 ⫾ 0.04 0.10 ⫾ 0.04 0.22 ⫾ 0.06 0.22 ⫾ 0.06 0.18 ⫾ 0.06 0.13 ⫾ 0.05 Nabidae 0.20 ⫾ 0.08 0.17 ⫾ 0.05 0.37 ⫾ 0.08 0.15 ⫾ 0.05 0.50 ⫾ 0.09 0.58 ⫾ 0.12 0.08 ⫾ 0.04 0.20 ⫾ 0.05 0.25 ⫾ 0.07 0.42 ⫾ 0.08 0.15 ⫾ 0.05 0.10 ⫾ 0.04 Staphylinidae 0.02 ⫾ 0.02 0.07 ⫾ 0.03 1.03 ⫾ 0.24 0.57 ⫾ 0.16 0.47 ⫾ 0.14 0.13 ⫾ 0.07 0.17 ⫾ 0.05 0.20 ⫾ 0.06 0.53 ⫾ 0.10 0.20 ⫾ 0.05 0.15 ⫾ 0.06 0.15 ⫾ 0.06 Coccinella 0.02 ⫹ 0.02 0.03 ⫹ 0.02 0 0 0 0 0 0 0.02 ⫹ 0.02 0 0.03 ⫹ 0.02 0.02 ⫹ 0.02 Ladybird larvae 0.02 ⫾ 0.02 0.03 ⫾ 0.02 0 0 0 0 0 0 0.02 ⫾ 0.02 0 0.03 ⫾ 0.02 0.02 ⫾ 0.02 Araneae 0.22 ⫾ 0.06 0.12 ⫾ 0.05 0.23 ⫾ 0.06 0.28 ⫾ 0.08 0.18 ⫾ 0.06 0.10 ⫾ 0.04 0.07 ⫾ 0.03 0.02 ⫾ 0.02 0.18 ⫾ 0.06 0 0.12 ⫾ 0.05 0.12 ⫾ 0.05 22-spots 0.03 ⫾ 0.02 0.03 ⫾ 0.02 0.03 ⫾ 0.02 0.03 ⫾ 0.03 0 0 0 0 0 0 0.02 ⫾ 0.02 0
Table 3. Mean no. of individuals per plant (ⴞ SE) recorded in eggplant field sampling in Southern Italy during the growing season 2002 OTU 7 Aug. 13 Aug. 21 Aug. 5 Sept. 19 Sept. Bt Control Bt Control Bt Control Bt Control Bt Control CPB adults 0.23 ⫾ 0.07 0.22 ⫾ 0.06 0.32 ⫾ 0.09 0.15 ⫾ 0.05 0.10 ⫾ 0.05 0.08 ⫾ 0.05 0.40 ⫾ 0.09 1.70 ⫾ 0.32 0.20 ⫾ 0.06 1.52 ⫾ 0.28 CPB large 0 0 0.07 ⫾ 0.05 1.55 ⫾ 0.81 0.23 ⫾ 0.11 1.05 ⫾ 0.51 0 0 .57 ⫾ 0.20 0.03 ⫾ 0.03 0.30 ⫾ 0.10 CPB small 0 .28 ⫾ 0.28 1.02 ⫾ 0.91 0.48 ⫾ 0.25 3.97 ⫾ 1.52 0.30 ⫾ 0.30 1.85 ⫾ 0.82 0.25 ⫾ 0.25 0.12 ⫾ 0.12 0 0 .02 ⫾ 0.02 CPB eggs 0.10 ⫾ 0.05 0.25 ⫾ 0.08 0.32 ⫾ 0.28 0.30 ⫾ 0.09 0 0 .08 ⫾ 0.85 0 0 .02 ⫾ 0.02 0 0 Flea beetles 0.65 ⫾ 0.11 0.98 ⫾ 0.19 3.45 ⫾ 0.40 0.95 ⫾ 0.18 7.27 ⫾ 0.96 4.33 ⫾ 0.57 6.57 ⫾ 0.51 5.98 ⫾ 0.56 11.58 ⫾ 0.65 11.18 ⫾ 0.72 PTM mines 0.22 ⫾ 0.07 0.48 ⫾ 0.12 0.72 ⫾ 0.13 0.73 ⫾ 0.15 1.55 ⫹ 0.27 2.13 ⫹ 0.32 0.37 ⫾ 0.09 0.37 ⫾ 0.109 0.97 ⫾ 0.13 0.77 ⫾ 0.20 Green peach aphid 0.70 ⫾ 0.23 0.27 ⫾ 0.18 7.85 ⫾ 4.69 1.27 ⫾ 0.44 2.77 ⫾ 0.70 1.82 ⫾ 0.50 0.07 ⫾ 0.04 0.07 ⫾ 0.07 0.03 ⫾ 0.02 0.03 ⫾ 0.03 Cotton aphid 0 .25 ⫾ 0.08 0.75 ⫾ 0.44 0.47 ⫾ 0.10 3.68 ⫾ 2.02 7.02 ⫾ 1.41 15.25 ⫾ 6.37 0.65 ⫾ 0.17 0.05 ⫾ 0.03 0.18 ⫾ 0.07 0.20 ⫾ 0.06 Cicadellidae 2.75 ⫾ 0.44 1.78 ⫾ 0.33 5.85 ⫾ 0.55 4.33 ⫾ 0.63 3.05 ⫾ 0.36 1.62 ⫾ 0.22 4.95 ⫾ 0.47 1.75 ⫾ 0.34 6.55 ⫾ 0.45 7.92 ⫾ 0.81 Thripidae 0.02 ⫾ 0.02 0 0 .20 ⫾ 0.07 0 0 .32 ⫾ 0.15 0.03 ⫾ 0.02 0.43 ⫾ 0.15 0.17 ⫾ 0.06 0.35 ⫾ 0.16 0 Lacewing larvae 0 0 0.02 ⫾ 0.02 0 1 .55 ⫾ 0.27 2.13 ⫾ 0.32 0.03 ⫾ 0.02 0.02 ⫾ 0.02 0 0 .95 ⫾ 0.29 Lacewing eggs 0.07 ⫾ 0.03 0 0 .27 ⫾ 0.09 0.05 ⫾ 0.03 0.03 ⫾ 0.02 0.13 ⫾ 0.08 1.52 ⫾ 0.16 0.87 ⫾ 0.22 2.73 ⫾ 0.28 1.22 ⫾ 0.18 Macrolophus 0.02 ⫾ 0.02 0 0 .02 ⫾ 0.02 0.08 ⫾ 0.04 0.08 ⫾ 0.04 0 0 .20 ⫾ 0.05 0.03 ⫾ 0.02 0.50 ⫾ 0.09 0.32 ⫾ 0.06 Cyrtopeltis 0 0 0.07 ⫾ 0.04 0 0 .27 ⫾ 0.08 0 0 .32 ⫾ 0.08 0.02 ⫾ 0.02 0.13 ⫾ 0.04 0.03 ⫾ 0.02 Dicyphus 0 0 0.02 ⫾ 0.02 0 0 .12 ⫾ 0.04 0.18 ⫾ 0.05 0.10 ⫾ 0.06 0.22 ⫾ 0.08 0.38 ⫾ 0.10 0.52 ⫾ 0.09 Miridae 0 0 0 0 0 .10 ⫾ 0.06 0.13 ⫾ 0.07 0.25 ⫾ 0.07 0.22 ⫾ 0.09 0 0 Anthocoridae 0.02 ⫾ 0.02 0 0 .10 ⫾ 0.07 0 0 0.08 ⫾ 0.04 0.03 ⫾ 0.02 0.17 ⫾ 0.05 0.22 ⫾ 0.11 0.05 ⫾ 0.03 Nabidae 0.02 ⫾ 0.02 0 0 .05 ⫾ 0.04 0.08 ⫾ 0.03 0.05 ⫾ 0.03 0.08 ⫾ 0.06 0.03 ⫾ 0.02 0.10 ⫾ 0.05 0.12 ⫾ 0.05 0.10 ⫾ 0.04 Staphylinidae 0 0 0 0.03 ⫾ 0.02 0.05 ⫾ 0.03 0 0 .22 ⫾ 0.11 0.20 ⫾ 0.07 0.20 ⫾ 0.05 0.27 ⫾ 0.08 Coccinella 0 0 0 0.03 ⫾ 0.02 0.12 ⫾ 0.05 0.22 ⫾ 0.10 0.75 ⫾ 0.14 0.12 ⫾ 0.05 0.18 ⫾ 0.06 0.05 ⫾ 0.03 Ladybird larvae 0.02 ⫾ 0.02 0 0 0.07 ⫾ 0.03 0 0 0.55 ⫾ 0.12 0.13 ⫾ 0.06 0.03 ⫾ 0.02 0.03 ⫾ 0.02 Ladybird pupae 0 0 .02 ⫾ 0.02 0.07 ⫾ 0.04 0.02 ⫾ 0.02 0 0 0.05 ⫾ 0.03 0 0 .02 ⫾ 0.02 0.07 ⫾ 0.05 Stethorus 0.05 ⫾ 0.03 0.05 ⫾ 0.03 0.15 ⫾ 0.07 0.10 ⫾ 0.04 4.30 ⫾ 1.35 3.97 ⫾ 1.22 0.03 ⫾ 0.02 0.12 ⫾ 0.05 0.02 ⫾ 0.02 0.02 ⫾ 0.02 Araneae 0.03 ⫾ 0.02 0.02 ⫾ 0.02 0.08 ⫾ 0.04 0.10 ⫾ 0.04 0.02 ⫾ 0.02 0.02 ⫾ 0.02 0 0 0.17 ⫾ 0.05 0.07 ⫾ 0.04 22-spots 0 0 0 0.02 ⫾ 0.02 0 0 .02 ⫾ 0.02 0.03 ⫾ 0.02 0.05 ⫾ 0.03 0.03 ⫾ 0.02 0.08 ⫾ 0.04 OTU 26 Sept. 4 Oct. Bt Control Bt Control CPB adults 0.39 ⫾ 0.22 0.68 ⫾ 0.15 0.70 ⫾ 0.54 0.53 ⫾ 0.12 CPB large 0.03 ⫾ 0.02 0.08 ⫾ 0.04 0.25 ⫾ 0.25 0.25 ⫾ 0.11 CPB small 0 .03 ⫾ 0.02 0.07 ⫾ 0.04 0.12 ⫾ 0.12 0.12 ⫾ 0.08 CPB eggs 0 0 0 0 Flea beetles 14.03 ⫾ 1.30 10.95 ⫾ 0.75 14.67 ⫾ 6.24 6.35 ⫾ 0.54 PTM mines 0.90 ⫹ 0.15 0.52 ⫹ 0.11 0.90 ⫾ 0.36 0.35 ⫾ 0.08 Green peach aphid 0.05 ⫾ 0.03 0.07 ⫾ 0.03 0.12 ⫾ 0.12 0.12 ⫾ 0.06 Cotton aphid 0 .15 ⫾ 0.06 0.15 ⫾ 0.05 0.33 ⫾ 0.13 0.05 ⫾ 0.03 Cicadellidae 4.50 ⫾ 0.54 3.17 ⫾ 0.032 3.72 ⫾ 2.17 2.17 ⫾ 0.31 Thripidae 0.17 ⫾ 0.07 0.05 ⫾ 0.03 0.03 ⫾ 0.03 0.03 ⫾ 0.03 Lacewing larvae 0.90 ⫾ 0.15 0.52 ⫾ 0.11 0.02 ⫾ 0.02 0.02 ⫾ 0.02 Lacewing eggs 0.42 ⫾ 0.13 0 1 .55 ⫾ 0.67 0.63 ⫾ 0.12 Macrolophus 1.71 ⫾ 0.51 0.17 ⫾ 0.05 0.32 ⫾ 0.16 0.15 ⫾ 0.05 Cyrtopeltis 0.25 ⫾ 0.07 0.18 ⫾ 0.05 0.18 ⫾ 0.11 0.10 ⫾ 0.04 Dicyphus 0.58 ⫾ 0.15 0.33 ⫾ 0.11 0.30 ⫾ 0.23 0.23 ⫾ 0.06 Miridae 0 0 0.10 ⫾ 0.04 0 Anthocoridae 0.63 ⫾ 0.12 0.43 ⫾ 0.12 0.20 ⫾ 0.15 0.15 ⫾ 0.07 Nabidae 0.58 ⫾ 0.24 0.20 ⫾ 0.05 0.25 ⫾ 0.19 0.18 ⫾ 0.06 Staphylinidae 0.07 ⫾ 0.03 0.03 ⫾ 0.02 0.07 ⫾ 0.04 0 Coccinella 0 .08 ⫾ 0.04 0.03 ⫾ 0.02 0.10 ⫾ 0.04 0.08 ⫾ 0.04 Ladybird larvae 0.02 ⫾ 0.02 0 0 .03 ⫾ 0.02 0.02 ⫾ 0.02 Ladybird pupae 0 0 .02 ⫾ 0.02 0.02 ⫾ 0.02 0.02 ⫾ 0.02 Stethorus 0.07 ⫾ 0.03 0.02 ⫾ 0.02 0.03 ⫾ 0.02 0.02 ⫾ 0.02 Araneae 0.07 ⫾ 0.04 0 0 .03 ⫾ 0.02 0.65 ⫾ 0.04 22-spots 0.03 ⫾ 0.02 0.02 ⫾ 0.02 0 0
Table 4. Mean no. of individuals per plant (ⴞ SE) recorded in eggplant field sampling in Southern Italy during the growing season 2003 OTU 17 July 23 July 7 Aug. 13 Aug. 20 Aug. 28 Aug. Bt Control Bt Control Bt Control Bt Control Bt Control Bt Control CPB adults 0.03 ⫾ 0.02 0 0.25 ⫾ 0.07 0.50 ⫾ 0.09 0.95 ⫾ 0.13 0.58 ⫾ 0.15 0.45 ⫾ 0.10 0.30 ⫾ 0.06 0.55 ⫾ 0.12 0.97 ⫾ 0.17 0.63 ⫾ 0.12 0.68 ⫾ 0.10 CPB large 0 0 0 0 0 0 0 0.07 ⫾ 0.07 1.72 ⫾ 0.52 0.81 ⫾ 0.29 5.42 ⫾ 1.01 2.52 ⫾ 0.60 CPB small 0 0 0 0 2.55 ⫾ 1.02 2.88 ⫾ 0.68 12.42 ⫾ 2.66 7.82 ⫾ 1.91 10.00 ⫾ 2.42 6.07 ⫾ 1.08 7.59 ⫾ 1.07 5.23 ⫾ 1.04 CPB eggs 0 0 0.42 ⫾ 0.15 0.30 ⫾ 0.09 1.02 ⫾ 0.15 0.87 ⫾ 0.12 2.05 ⫾ 0.22 0.98 ⫾ 0.18 1.28 ⫾ 0.17 0.95 ⫾ 0.29 1.05 ⫾ 0.43 0.32 ⫾ 0.07 Flea beetles 0.35 ⫾ 0.13 0.57 ⫾ 0.16 2.02 ⫾ 0.19 2.33 ⫾ 0.23 0.85 ⫾ 0.15 1.55 ⫾ 0.21 3.48 ⫾ 0.62 1.12 ⫾ 0.16 0.57 ⫾ 0.22 3.00 ⫾ 0.37 3.59 ⫾ 0.47 4.77 ⫾ 0.57 PTM mines 0.23 ⫾ 0.08 0.18 ⫾ 0.06 0.10 ⫾ 0.04 0.73 ⫾ 0.18 1.38 ⫾ 0.17 0.40 ⫾ 0.10 1.18 ⫾ 0.24 0.084 ⫾ 0.04 0.82 ⫾ 0.15 0.68 ⫾ 0.10 0.27 ⫾ 0.07 0.23 ⫾ 0.06 Green peach aphid 0.12 ⫾ 0.07 0.02 ⫾ 0.02 0.18 ⫾ 0.06 0.22 ⫾ 0.06 0.92 ⫾ 0.20 0.28 ⫾ 0.11 0.07 ⫾ 0.04 0 0.02 ⫾ 0.02 0 0.36 ⫾ 0.14 0.67 ⫾ 0.16 Cotton aphid 0.07 ⫾ 0.04 0.05 ⫾ 0.03 0.13 ⫾ 0.07 0.17 ⫾ 0.07 0.02 ⫾ 0.02 0.03 ⫾ 0.02 0.02 ⫾ 0.02 0 0.05 ⫾ 0.04 0.02 ⫾ 0.02 0.02 ⫾ 0.02 0.02 ⫾ 0.02 Cicadella viridis 0 0.18 ⫾ 0.07 0.18 ⫾ 0.06 0.23 ⫾ 0.06 0.07 ⫾ 0.04 0.08 ⫾ 0.04 0.20 ⫾ 0.07 0.17 ⫾ 0.07 0 0.07 ⫾ 0.03 0 0 Cicadellidae 0.03 ⫾ 0.02 0.18 ⫾ 0.08 0.37 ⫾ 0.08 0.55 ⫾ 0.09 0.53 ⫾ 0.11 0.82 ⫾ 0.31 0.67 ⫾ 0.16 1.37 ⫾ 0.23 0.83 ⫾ 0.18 3.14 ⫾ 0.31 2.34 ⫾ 0.32 1.60 ⫾ 0.20 Thripidae 0 0.03 ⫾ 0.02 0.02 ⫾ 0.02 1.38 ⫾ 0.38 0.80 ⫾ 0.23 0.03 ⫾ 0.02 0.17 ⫾ 0.05 0.03 ⫾ 0.02 0 0.14 ⫾ 0.06 0.12 ⫾ 0.06 0 Lygus 0 0 0.07 ⫾ 0.03 0.12 ⫾ 0.05 0 0.10 ⫾ 0.05 0 0.03 ⫾ 0.02 0 0 0 0.02 ⫾ 0.02 Pentatomidae 0 0 0 0 0.17 ⫾ 0.05 0.05 ⫾ 0.03 0.10 ⫾ 0.05 0.08 ⫾ 0.04 0.13 ⫾ 0.06 0.19 ⫾ 0.07 0.14 ⫾ 0.05 0.15 ⫾ 0.05 Agromyzidae 0 0.03 ⫾ 0.03 0.02 ⫾ 0.02 0 0.10 ⫾ 0.04 0.33 ⫾ 0.13 0.47 ⫾ 0.09 0.10 ⫾ 0.04 0.23 ⫾ 0.06 0.35 ⫾ 0.13 0 0.15 ⫾ 0.05 Lacewing adults 0 0 0 0 0.10 ⫾ 0.04 0.17 ⫾ 0.05 0.42 ⫾ 0.10 0.03 ⫾ 0.08 0.18 ⫾ 0.05 0.31 ⫾ 0.09 0.09 ⫾ 0.04 0.03 ⫾ 0.02 Lacewing larvae 0 0 0.10 ⫾ 0.04 0.22 ⫾ 0.06 0.15 ⫾ 0.05 0 0.07 ⫾ 0.03 0.03 ⫾ 0.02 0.20 ⫾ 0.06 0.14 ⫾ 0.05 0.07 ⫾ 0.03 0.10 ⫾ 0.04 Lacewing eggs 0.43 ⫾ 0.14 0.72 ⫾ 0.16 1.25 ⫾ 0.19 1.73 ⫾ 0.28 7.22 ⫾ 0.88 3.65 ⫾ 0.41 5.00 ⫾ 0.67 4.57 ⫾ 0.46 5.23 ⫾ 0.53 6.64 ⫾ 0.63 1.88 ⫾ 0.21 2.48 ⫾ 0.35 Macrolophus 0.10 ⫾ 0.039 0 0.20 ⫾ 0.06 0.32 ⫾ 0.07 0.05 ⫾ 0.03 0 0 0.03 ⫾ 0.02 0 0.45 ⫾ 0.11 0.25 ⫾ 0.06 0.30 ⫾ 0.06 Cyrtopeltis 0 0 0.52 ⫾ 0.14 0 0 0.07 ⫾ 0.03 0 0.13 ⫾ 0.06 0.13 ⫾ 0.05 0.32 ⫾ 0.11 0.27 ⫾ 0.09 0.07 ⫾ 0.04 Dicyphus 0 0 0.03 ⫾ 0.02 0.05 ⫾ 0.04 0 0 0.13 ⫾ 0.05 0.07 ⫾ 0.03 0.03 ⫾ 0.02 0 0 0 Miridae 0.10 ⫾ 0.04 0 0.82 ⫾ 0.17 0.48 ⫾ 0.10 0.05 ⫾ 0.03 0.43 ⫾ 0.10 0.13 ⫾ 0.05 0.27 ⫾ 0.08 0.17 ⫾ 0.05 1.34 ⫾ 0.25 0.51 ⫾ 0.10 1.02 ⫾ 0.21 Anthocoridae 0.25 ⫾ 0.16 0.27 ⫾ 0.16 0 0 0.55 ⫾ 0.13 0.98 ⫾ 0.22 0.53 ⫾ 0.09 0.17 ⫾ 0.05 0.18 ⫾ 0.06 0.70 ⫾ 0.18 1.66 ⫾ 0.21 2.10 ⫾ 0.25 Nabidae 0.02 ⫾ 0.02 0.03 ⫾ 0.03 0.02 ⫾ 0.02 0.18 ⫾ 0.07 0.27 ⫾ 0.07 0.08 ⫾ 0.036 1.02 ⫾ 0.21 0.07 ⫾ 0.03 0.32 ⫾ 0.09 0.31 ⫾ 0.22 0.02 ⫾ 0.02 0.03 ⫾ 0.02 Staphylinidae 0.02 ⫾ 0.02 0 0.08 ⫾ 0.04 0.33 ⫾ 0.09 0.03 ⫾ 0.02 0.07 ⫾ 0.03 0.12 ⫾ 0.05 0 0 0.03 ⫾ 0.02 0 0.03 ⫾ 0.02 Coccinella 0 0 0.03 ⫾ 0.02 0.03 ⫾ 0.02 0.25 ⫾ 0.06 0.12 ⫾ 0.04 0.02 ⫾ 0.02 0.02 ⫾ 0.02 0.03 ⫾ 0.02 0.12 ⫾ 0.04 0.22 ⫾ 0.05 0.20 ⫾ 0.05 Hippodamia 0 0 0.22 ⫾ 0.05 0.20 ⫾ 0.052 0.18 ⫾ 0.05 0.33 ⫾ 0.06 0.18 ⫾ 0.05 0.25 ⫾ 0.06 0.23 ⫾ 0.06 0.15 ⫾ 0.05 0.02 ⫾ 0.02 0.03 ⫾ 0.02 Ladybird larvae 0 0 0 0 0 0000 0.02 ⫾ 0.02 0.03 ⫾ 0.03 0.12 ⫾ 0.12 Stethorus 0.05 ⫾ 0.03 0.02 ⫾ 0.02 0 0 0.05 ⫾ 0.04 0.13 ⫾ 0.09 0.08 ⫾ 0.04 0.05 ⫾ 0.03 0.03 ⫾ 0.02 0.09 ⫾ 0.04 0 0.07 ⫾ 0.032 Araneae 0.017 ⫾ 0.017 0.07 ⫾ 0.03 0.18 ⫾ 0.06 0.47 ⫾ 0.10 0.53 ⫾ 0.09 0.25 ⫾ 0.07 1.00 ⫾ 0.16 0.30 ⫾ 0.06 1.02 ⫾ 0.13 0.70 ⫾ 0.13 0.63 ⫾ 0.12 0.47 ⫾ 0.09 22-spots 0 0 0.13 ⫾ 0.04 0.03 ⫾ 0.02 0.15 ⫾ 0.05 0.42 ⫾ 0.06 0.28 ⫾ 0.06 0.37 ⫾ 0.06 0.22 ⫾ 0.05 0.22 ⫾ 0.05 0.12 ⫾ 0.04 0.15 ⫾ 0.05 OTU 5 Sept. 17 Sept. 25 Sept. 2 Oct. Bt Control Bt Control Bt Control Bt Control CPB adults 0.23 ⫹ 0.08 0.22 ⫹ 0.10 1.50 ⫹ 0.22 2.10 ⫹ 0.37 1.88 ⫹ 0.23 2.30 ⫹ 0.29 5.18 ⫹ 0.60 3.00 ⫹ 0.34 CPB large 5.40 ⫹ 0.68 2.83 ⫹ 0.60 2.20 ⫹ 0.30 4.73 ⫹ 0.67 2.30 ⫹ 0.44 3.18 ⫹ 0.59 0.65 ⫹ 0.19 2.58 ⫹ 0.49 CPB small 6.03 ⫹ 1.09 4.72 ⫹ 1.43 1.23 ⫹ 0.25 4.47 ⫹ 0.73 0.22 ⫹ 0.14 0.98 ⫹ 0.33 0.32 ⫹ 0.27 1.37 ⫹ 0.41 CPB eggs 0.13 ⫹ 0.05 0.13 ⫹ 0.04 0.07 ⫹ 0.03 0.07 ⫹ 0.03 0.02 ⫹ 0.02 0.03 ⫹ 0.02 0.02 ⫹ 0.02 0.03 ⫹ 0.02 Flea beetles 5.57 ⫹ 0.76 5.52 ⫹ 0.63 5.97 ⫹ 0.68 6.25 ⫹ 0.76 8.47 ⫹ 1.02 4.25 ⫹ 0.43 9.42 ⫹ 0.73 4.30 ⫹ 0.61 PTM mines 0.27 ⫾ 0.13 0.18 ⫾ 0.07 0.30 ⫾ 0.09 0.38 ⫾ 0.09 0.10 ⫾ 0.05 0.20 ⫾ 0.07 0.03 ⫾ 0.02 0.28 ⫾ 0.07 Green peach aphid 0 0 0 0 0 0 0 0 Cotton aphid 0 0 0 0 0.02 ⫾ 0.02 0 0 0 Cicadella viridis 0 0.02 ⫾ 0.02 0 0.02 ⫾ 0.02 0 0 0 0 Cicadellidae 1.65 ⫾ 0.21 0.47 ⫾ 0.10 0.57 ⫾ 0.14 0.67 ⫾ 0.11 0.40 ⫾ 0.09 0.85 ⫾ 0.12 0.57 ⫾ 0.12 0.45 ⫾ 0.09 Thripidae 0 0.05 ⫾ 0.03 0 0 0 0.58 ⫾ 0.15 0 0 Lygus 0 0 0.02 ⫾ 0.02 0 0.02 ⫾ 0.02 0 0 0 Pentatomidae 0.10 ⫾ 0.04 0 0.10 ⫾ 0.05 0.03 ⫾ 0.02 0.15 ⫾ 0.05 0.10 ⫾ 0.05 0.07 ⫾ 0.03 0.13 ⫾ 0.06 Continued on following page
with wheat and various vegetables. Six 200-m2plots were prepared in each year, three of which were planted with transgenic eggplants and three with their near isogenic control, according to a completely ran-domized design. Eggplants were mulched and placed in paired rows spaced 2 m apart. The distance between rows in each pair and between plants along rows was 50 cm. Plant density was 2 plants/m2; therefore, a total number of 1,200 plants were placed per treatment in each Þeld experiment. Eggplants were cultivated fol-lowing traditional cultural practices (La Malfa 1990). No pesticides were sprayed. Biosafety measures were adopted according to EU legislation for the deliberate environmental release of genetically modiÞed organ-isms.
Species Sampling Procedures. Information was
col-lected on the arthropod assemblages by making weekly visual observations of the plant canopy. All aerial parts of 20 randomly selected plants per plot were carefully checked for arthropods. Leaves were checked on both sides, but insects were not removed from leaves. Observations started at 0800 hours, and all sampling was completed in⬃3 h. All specimens found on the plants were recorded, and data were pooled in organismal taxonomic units (OTUs) based on (1) their ecological role in the food web, (2) their poten-tial exposure to the Cry3Bb toxin expressed in plants, and (3) feasibility of visual identiÞcation on plants. The complete list of OTUs is given in Table 1.
Community Analysis. Species assemblages were
compared between treatments by means of correspon-dence analysis (CA; Benze´cri 1973), whereas differences between treatments were tested using the multi-re-sponse permutation procedure (MRPP; Zimmerman et al. 1985). Associations between taxa and treatments were deÞned on the basis of using an indicator species analysis (ISA; Dufrene and Legendre 1997).
Ordination techniques are widely used for summa-rizing species responses to environmental factors, both along gradients (thus analyzing coenoclines) and through time (thus analyzing ecological successions). They can be divided into two broad categories relative to the way environmental information is considered. In cases where environmental data are explicitly in-cluded in the analysis, usually constraining the ordi-nation of species, a “direct gradient analysis” is per-formed. An “indirect gradient analysis” is performed in cases where only species composition is considered, and relationships with environmental variables are inferred based on patterns in species distribution. Nonmetric multidimensional scaling (Kruskal 1964) and correspondence analysis (Benze´cri 1973) are the most widely used indirect gradient analysis methods. Each method has its own strengths and weaknesses, but when species count data are considered, and uni-modal species responses are assumed, CA is the most suited ordination technique, and this is the reason why it was selected for this study. Unlike many other or-dination techniques, CA is aimed at maximizing a weighted correlation between species scores and sam-ple scores, the weight being the abundance of the species. Therefore, the eigenvalue of the Þrst CA axis
Table 4. Continued OTU 5 Sept. 17 Sept. 25 Sept. 2 Oct. Bt Control Bt Control Bt Control Bt Control Agromyzidae 0.45 ⫾ 0.09 0 0 0.17 ⫾ 0.08 0.02 ⫾ 0.02 0 0.02 ⫾ 0.02 0 Lacewing adults 0.23 ⫾ 0.07 0.07 ⫾ 0.03 0.17 ⫾ 0.05 0.12 ⫾ 0.05 0 0.02 ⫾ 0.02 0.13 ⫾ 0.04 0.02 ⫾ 0.02 Lacewing larvae 0.07 ⫾ 0.03 0.20 ⫾ 0.06 0.05 ⫾ 0.03 0.02 ⫾ 0.02 0.02 ⫾ 0.02 0 0.08 ⫾ 0.04 0.07 ⫾ 0.03 Lacewing eggs 2.33 ⫾ 0.27 1.98 ⫾ 0.26 0.77 ⫾ 0.12 1.30 ⫾ 0.18 0.40 ⫾ 0.08 0.83 ⫾ 0.12 0.32 ⫾ 0.08 0.55 ⫾ 0.09 Macrolophus 0 0 0.12 ⫾ 0.04 0.70 ⫾ 0.21 1.17 ⫾ 0.06 0.15 ⫾ 0.05 0.17 ⫾ 0.05 0.13 ⫾ 0.04 Cyrtopeltis 1.24 ⫾ 0.19 0.48 ⫾ 0.13 0.05 ⫾ 0.05 0.02 ⫾ 0.02 0.13 ⫾ 0.07 0 0.12 ⫾ 0.04 0.13 ⫾ 0.04 Dicyphus 0 0.18 ⫾ 0.08 0.10 ⫾ 0.05 0 0 0.05 ⫾ 0.03 0 0 Miridae 2.48 ⫾ 0.78 0.70 ⫾ 0.17 0.48 ⫾ 0.11 1.00 ⫾ 0.27 0.40 ⫾ 0.10 0.27 ⫾ 0.07 0.32 ⫾ 0.07 0.28 ⫾ 0.06 Anthocoridae 1.93 ⫾ 0.34 0.55 ⫾ 0.19 0.13 ⫾ 0.04 0.55 ⫾ 0.14 0.80 ⫾ 0.16 0.48 ⫾ 0.09 0.43 ⫾ 0.10 0.08 ⫾ 0.04 Nabidae 0.02 ⫾ 0.02 0.18 ⫾ 0.06 0.07 ⫾ 0.03 0.03 ⫾ 0.02 0 0.05 ⫾ 0.03 0.03 ⫾ 0.02 0.12 ⫾ 0.04 Staphylinidae 0 0 0 0.02 ⫾ 0.02 0 0 0 0 Coccinella 0 0 0 0.02 ⫾ 0.02 0 0.10 ⫾ 0.04 0 0.12 ⫾ 0.04 Hippodamia 0.07 ⫾ 0.034 0.02 ⫾ 0.02 0.02 ⫾ 0.02 0.02 ⫾ 0.02 0.02 ⫾ 0.02 0 0 0 Ladybird larvae 0 0 0 0.02 ⫾ 0.02 0 0.10 ⫾ 0.04 0 0.12 ⫾ 0.04 Stethorus 0 0 0 0.02 ⫾ 0.02 0 0.10 ⫾ 0.04 0 0.12 ⫾ 0.04 Araneae 0.87 ⫾ 0.13 0.58 ⫾ 0.11 1.13 ⫾ 0.28 0.52 ⫾ 0.20 0.87 ⫾ 0.15 0.72 ⫾ 0.12 0.58 ⫾ 0.10 0.65 ⫾ 0.11 22-spots 0.03 ⫾ 0.02 0.05 ⫾ 0.03 0 0 0.02 ⫾ 0.02 0 0 0
is equivalent to the correlation coefÞcient between species scores and sample scores (Gauch 1982, Pielou 1984). The second and higher axes also maximize the correlation between species scores and sample scores, but they are constrained to be uncorrelated with (or-thogonal to) the previous axes. In CA ordinations, each species is represented by a point, which can be regarded as an estimate of the species optimum rela-tive to the environmental features of samples.
The MRPP was Þrst introduced by Mielke et al. (1976) as a technique for detecting the difference between a priori classiÞed groups. It turned out to be an extremely versatile data-analytic framework from which a number of applications are spin-offs, such as the measurement of agreement, multivariate correla-tion and associacorrela-tion coefÞcients, and the deteccorrela-tion of autocorrelation (see Mielke and Berry 2001 for a com-plete coverage of applications of the MRPP frame-work). MRPP is often analogous to parametric tests such as the t-test or analysis of variance (ANOVA).
Indeed, it has been shown that many “classical” tests are special cases of MRPP. For instance, Mielke and Berry (1994) showed the equivalence between mem-bers of the MRPP family of statistics and the ANOVA/ MANOVA test statistics. What makes MRPP more attractive than the parametric counterparts is its ro-bustness under violations of the parametric assump-tions (Mielke and Berry 1994), which are the rule in community ecology data sets. The MRPP statistic is a weighted average of within-group distances, where the weights are determined by the group sizes. The MRPP statistics can be tested either by means of an exact procedure based on permutations of the data set or by means of an approximated procedure, which can be applied when dealing with very large data sets.
To detect and describe the association between spe-cies and treatments, ISA (Dufrene and Legendre 1997) was applied. This is a very common goal in community analysis when groups of samples are deÞned either a priori or after a classiÞcation procedure. ISA provides a straightforward solution for deÞning species properties
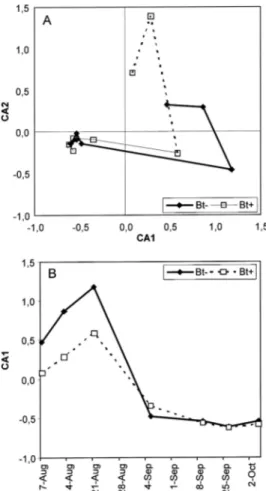
Fig. 1. Correspondence analysis ordination of 2001 Þeld observations. (A) Ordination of arthropod samples from
transgenic (Bt⫹) and control (Bt⫺) eggplant plots in the
space deÞned by the Þrst two axes (CA1 and CA2). (B) Successional dynamics of species assemblage in transgenic
(Bt⫹) and control (Bt⫺) plots as summarized by CA1 scores.
Fig. 2. Correspondence analysis ordination of 2002 Þeld observations. (A) Ordination of arthropod samples from
transgenic (Bt⫹) and control (Bt⫺) eggplant plots in the
space deÞned by the Þrst two axes (CA1 and CA2). (B) Successional dynamics of species assemblage in transgenic
by combining information on the abundance and fre-quency of occurrence of species in different groups. On this basis, an indicator value can be obtained for each species, and these values can be tested for statistical signiÞcance using a Monte Carlo technique.
Although each one of the above-mentioned meth-ods has its own strengths, when combined into a single data analysis procedure, they are even more effective in summarizing the overall pattern of species distri-butions relative to treatments and time, in testing differences between groups of samples, and in iden-tifying species that are signiÞcantly associated with groups of samples (e.g., treatments).
Results
Community Analysis. The mean number of
indi-viduals sampled is given in Tables 2Ð 4. A taxon was retained for analysis if an individual was found on at least three different sampling dates.
Fig. 3. Correspondence analysis ordination of 2003 Þeld observations. (A) Ordination of arthropod samples from
transgenic (Bt⫹) and control (Bt⫺) eggplant plots in the
space deÞned by the Þrst two axes (CA1 and CA2). (B) Successional dynamics of species assemblage in transgenic
(Bt⫹) and control (Bt⫺) plots as summarized by CA1 scores.
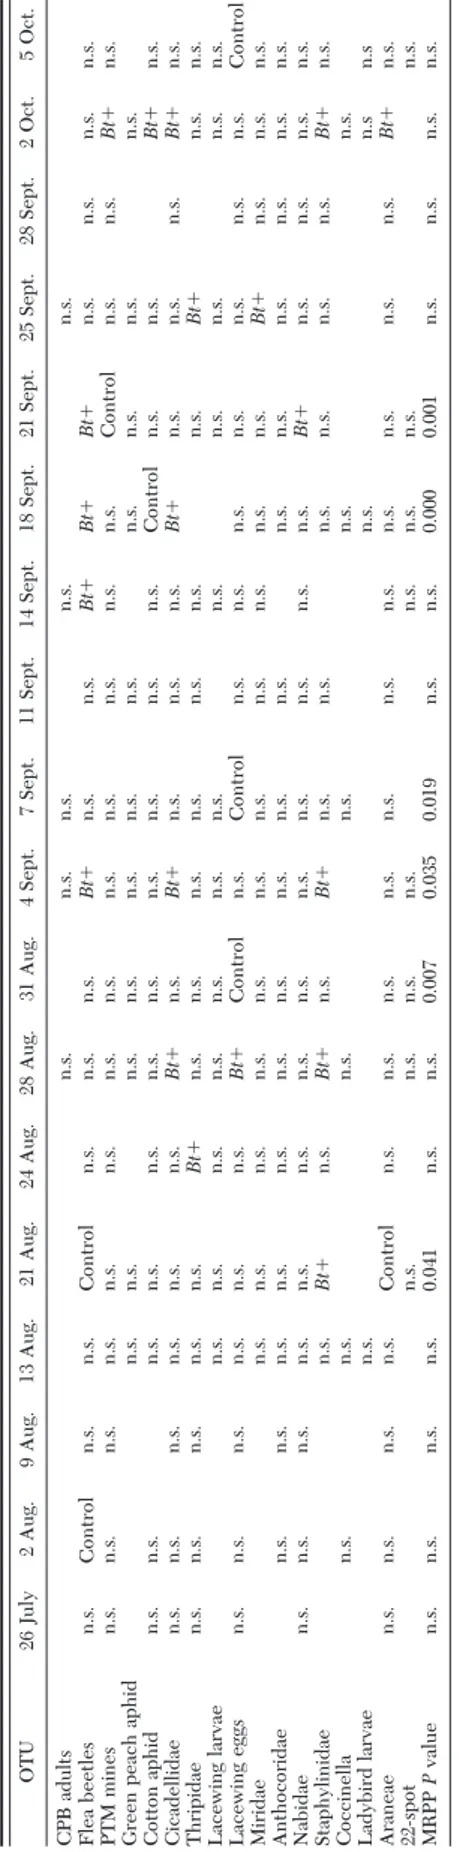
Table 5. Results of ISA and MRPP on the data from eggplant field season 2001 OTU 26 July 2 Aug. 9 Aug. 13 Aug. 21 Aug. 24 Aug. 28 Aug. 31 Aug. 4 Sept. 7 Sept. 11 Sept. 1 4 Sept. 1 8 Sept. 2 1 Sept. 25 Sept. 28 Sept. 2 Oct. 5 Oct. CPB adults n.s. n.s. n.s. n.s. n.s. Flea beetles n.s. Control n.s. n.s. Control n.s. n.s. n.s. Bt ⫹ n.s. n.s. Bt ⫹ Bt ⫹ Bt ⫹ n.s. n.s. n.s. n.s. PTM mines n.s. n.s. n.s. n.s. n.s. n.s. n.s. n.s. n.s. n.s. n.s. n.s. n.s. Control n.s. n.s. Bt ⫹ n.s. Green peach aphid n .s. n .s. n .s. n .s. n .s. n .s. n .s. n .s. n .s. n .s. n .s. Cotton aphid n.s. n.s. n.s. n.s. n.s. n.s. n.s. n.s. n.s. n.s. n.s. Control n.s. n.s. Bt ⫹ n.s. Cicadellidae n.s. n.s. n.s. n.s. n.s. n.s. Bt ⫹ n.s. Bt ⫹ n.s. n.s. n.s. Bt ⫹ n.s. n.s. n.s. Bt ⫹ n.s. Thripidae n.s. n.s. n.s. n.s. n.s. Bt ⫹ n.s. n.s. n.s. n.s. n.s. n.s. n.s. Bt ⫹ n.s. n.s. Lacewing larvae n.s. n.s. n.s. n.s. n.s. n.s. n.s. n.s. n.s. n.s. n.s. n.s. Lacewing eggs n.s. n.s. n.s. n.s. n.s. n.s. Bt ⫹ Control n.s. Control n.s. n.s. n.s. n.s. n.s. n.s. n.s. Control Miridae n.s. n.s. n.s. n.s. n.s. n.s. n.s. n.s. n.s. n.s. n.s. Bt ⫹ n.s. n.s. n.s. Anthocoridae n.s. n.s. n.s. n.s. n.s. n.s. n.s. n.s. n.s. n.s. n.s. n.s. n.s. n.s. n.s. n.s. Nabidae n.s. n.s. n.s. n.s. n.s. n.s. n.s. n.s. n.s. n.s. n.s. n.s. n.s. Bt ⫹ n.s. n.s. n.s. n.s. Staphylinidae n.s. Bt ⫹ n.s. Bt ⫹ n.s. Bt ⫹ n.s. n.s. n.s. n.s. n.s. n.s. Bt ⫹ n.s. Coccinella n.s. n.s. n.s. n.s. n.s. n.s. Ladybird larvae n.s. n.s. n.s n .s Araneae n.s. n.s. n.s. n.s. Control n.s. n.s. n.s. n.s. n.s. n.s. n.s. n.s. n.s. n.s. n.s. Bt ⫹ n.s. 22-spot n.s. n.s. n.s. n.s. n.s. n.s. n.s. n.s. MRPP P value n.s. n.s. n.s. n.s. 0.041 n.s. n.s. 0.007 0.035 0.019 n.s. n.s. 0.000 0.001 n.s. n.s. n.s. n.s. OTUs that were present on a given sampling date have n.s., or Bt ⫹ , o r Control in the corresponding column. While n.s., which stands for not signiÞcant, indicates the lack of association between a taxon and a group of samples ( Bt ⫹ or Control), a cell with “Bt ⫹ ” or “Control ” indicates a signiÞcant association between a taxon and the displayed treatment. In the last row, the results of MRPP are indicated. Probability levels are only shown for signiÞcant values.
The degree of infestation by the target insect pest, L. decemlineata,increased each year, and during 2003, the action threshold for their control was reached in the nontransgenic plots. Among the nontarget herbi-vores, the Chrysomelidae, Alticinae, and Cicadellidae were always very abundant. With regard to generalist predators, the eggs laid by Chrysopidae were always abundant, whereas the density of Coccinellidae was variable between years, being the most abundant and diverse in terms of populations during the 2003 Þeld season. A fungivore species, Psyllobora vigintid-uopunctataL. (Coleoptera:Coccinellidae), was com-monly found in the experimental Þelds.
Correspondence Analysis. The results are separately
presented for each Þeld season in Figs. 1Ð3. The ordina-tion in the space deÞned by the Þrst two axes is displayed. Sample scores relative to the Þrst axis, which condense the most relevant features in community structure changes, also are shown against time in a separate plot, aimed at summarizing successional patterns.
In Fig. 1A, samples are plotted in the space deÞned by the Þrst two axes, which explain 39.85 and 19.11% of the total variance, respectively. For data collected in 2001, the observations in the left part of the ordi-nation are very close to the Þrst axis. They are much more scattered at the opposite end of this axis, where the Þrst samples in the time series are located. How-ever, there is no clear separation between the treat-ments. The successional pattern in species assem-blages, obtained by plotting the Þrst axis score of samples against time (Fig. 1B), clearly shows similar trends for transgenic and control samples, especially
in the last section of the time series, where the curves tend to overlap.
Analysis of the 2002 Þeld data (Fig. 2) shows a similar situation, although somewhat simpliÞed in terms of successional dynamics. As in the previous case, the Þrst axis is related to temporal changes in community structure, whereas no major differences exist between treatments.
The ordination of Þeld data collected in the 2003 growing season is shown in Fig. 3. Again, there is no clear-cut separation between the two treatments, and positive coordinates along the Þrst axis are observed for early samples.
MRPP and ISA. For each sampling date throughout
the 3 yr of Þeld studies, species distribution relative to treatments and differences between treatments were analyzed by means of ISA and MRPP, respectively. The results of these statistical tests are shown in Tables 5Ð7, in which each column corresponds to a sampling date, i.e., to a set of samples collected in both treatment and control plots. For each sampling date and OTU, signiÞ-cant association with either of the treatments are indi-cated. In the last row, P values are given for comparisons in which the within-group variability was signiÞcantly lower than expected, thus suggesting that differences between arthropod assemblage structure in Bt⫹ and control plots were not observed by chance.
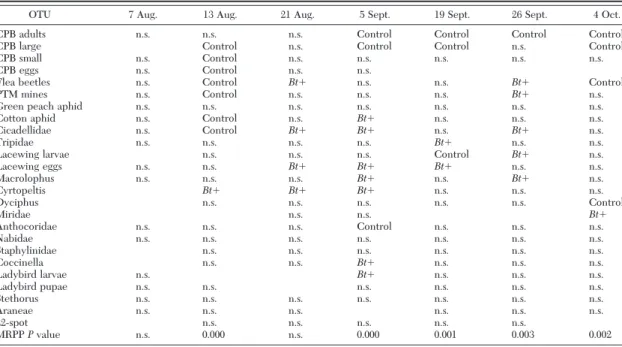
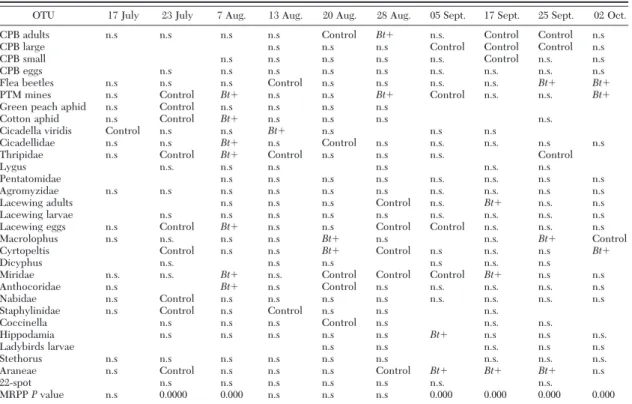
Years 2002 and 2003, in which the target insect was abundant, have a higher number of signiÞcant values in the MRPP test during late season, when CPB is almost constantly associated with control plots. Apart from the target species, some groups are signiÞcantly Table 6. Results of ISA and MRPP on data from eggplant field season 2002
OTU 7 Aug. 13 Aug. 21 Aug. 5 Sept. 19 Sept. 26 Sept. 4 Oct.
CPB adults n.s. n.s. n.s. Control Control Control Control
CPB large Control n.s. Control Control n.s. Control
CPB small n.s. Control n.s. n.s. n.s. n.s. n.s.
CPB eggs n.s. Control n.s. n.s.
Flea beetles n.s. Control Bt⫹ n.s. n.s. Bt⫹ Control
PTM mines n.s. Control n.s. n.s. n.s. Bt⫹ n.s.
Green peach aphid n.s. n.s. n.s. n.s. n.s. n.s. n.s.
Cotton aphid n.s. Control n.s. Bt⫹ n.s. n.s. n.s.
Cicadellidae n.s. Control Bt⫹ Bt⫹ n.s. Bt⫹ n.s.
Tripidae n.s. n.s. n.s. n.s. Bt⫹ n.s. n.s.
Lacewing larvae n.s. n.s. n.s. Control Bt⫹ n.s.
Lacewing eggs n.s. n.s. Bt⫹ Bt⫹ Bt⫹ n.s. n.s. Macrolophus n.s. n.s. n.s. Bt⫹ n.s. Bt⫹ n.s. Cyrtopeltis Bt⫹ Bt⫹ Bt⫹ n.s. n.s. n.s. Dyciphus n.s. n.s. n.s. n.s. n.s. Control Miridae n.s. n.s. Bt⫹ Anthocoridae n.s. n.s. n.s. Control n.s. n.s. n.s. Nabidae n.s. n.s. n.s. n.s. n.s. n.s. n.s. Staphylinidae n.s. n.s. n.s. n.s. n.s. n.s. Coccinella n.s. n.s. Bt⫹ n.s. n.s. n.s. Ladybird larvae n.s. Bt⫹ n.s. n.s. n.s. Ladybird pupae n.s. n.s. n.s. n.s. n.s. n.s. Stethorus n.s. n.s. n.s. n.s. n.s. n.s. n.s. Araneae n.s. n.s. n.s. n.s. n.s. n.s. 22-spot n.s. n.s. n.s. n.s. n.s. MRPP P value n.s. 0.000 n.s. 0.000 0.001 0.003 0.002
OTUs that were present on a given sampling date have n.s., Bt⫹, or Control in the corresponding column. While n.s., which stands for not signiÞcant, indicates the lack of association between a taxon and a group of samples (Bt⫹ or Control), a cell with Bt⫹ or Control indicates a signiÞcant association between a taxon and the displayed treatment. In the last row, the results of MRPP are indicated. Probability levels are only shown for signiÞcant values.
associated with either of the treatments at speciÞc dates. Groups that are consistently associated with the same treatment in more than a single instance suggest group-speciÞc biotic responses. However, these re-sults are not independent of the abundance of each group throughout the sampling season, and therefore, they have to be regarded as clues rather than as evi-dence for treatment effects.
The results of the ISA reinforce the above reported Þndings about the role of Alticinae in explaining the difference between the treatments. The seasonal vari-ation of ßea beetle populvari-ations in the two plot types is shown in Fig. 4. None of the other taxa showed such a signiÞcant difference in terms of abundance in any Þeld season (data not shown).
Some other groups (Staphylinidae, Cicadellidae, Aphis gossypiiGlover) also showed an interesting pat-tern of association (Tables 5Ð7). These groups were subjected to exploratory data analyses to seek possible indications of their spatial structure under the two experimental conditions. As a general trend, when a signiÞcant association was found, three criteria were always met (data not shown): Þrst, the species were distributed in the Þeld according to a contagious model, their variances being much larger than their means; second, when means were signiÞcantly larger in one of the two treatments, variances and median values were proportionally higher, so that not much
difference in aggregation patterns is to be expected; Þnally, the differences appeared more often during peaks of populations.
Discussion
The main goal of sampling for biodiversity in agro-ecosystems is recognizing, characterizing, and com-paring patterns in speciÞc habitats. Species-based biodiversity has been extensively studied, categorized, evaluated, and reviewed (Magurran 1988); a large array of biodiversity indices exists, along with several attempts to compare them. In the last decades, there have been signiÞcant developments in community ecology, and effective protocols based on this faunistic approach were established, for instance, in the recent Water Framework Directive (EU 2000). In this study, we aimed at detecting possible effects of Cry3Bb-expressing eggplants on selected groups of nontarget insects using a community approach.
In the Þrst step, we analyzed the spatial and tem-poral structure of the arthropod fauna by means of CA, which proved to be a very useful tool for summarizing successional patterns in the species assemblage. Fur-ther details about species composition and differences between treatments were obtained from multivariate methods based on distance measures and permutation statistics (ISA and MRPP). These methods are com-Table 7. Results of ISA and MRPP on the data from eggplant field season 2003
OTU 17 July 23 July 7 Aug. 13 Aug. 20 Aug. 28 Aug. 05 Sept. 17 Sept. 25 Sept. 02 Oct.
CPB adults n.s n.s n.s n.s Control Bt⫹ n.s. Control Control n.s
CPB large n.s n.s n.s Control Control Control n.s
CPB small n.s n.s n.s n.s n.s. Control n.s. n.s
CPB eggs n.s n.s n.s n.s n.s n.s. n.s. n.s. n.s
Flea beetles n.s n.s n.s Control n.s n.s n.s. n.s. Bt⫹ Bt⫹
PTM mines n.s Control Bt⫹ n.s n.s Bt⫹ Control n.s. n.s. Bt⫹
Green peach aphid n.s Control n.s n.s n.s n.s
Cotton aphid n.s Control Bt⫹ n.s n.s n.s n.s.
Cicadella viridis Control n.s n.s Bt⫹ n.s n.s n.s
Cicadellidae n.s n.s Bt⫹ n.s Control n.s n.s. n.s. n.s n.s
Thripidae n.s Control Bt⫹ Control n.s n.s n.s. Control
Lygus n.s. n.s n.s n.s n.s. n.s
Pentatomidae n.s n.s n.s n.s n.s. n.s. n.s n.s
Agromyzidae n.s n.s n.s n.s n.s n.s n.s. n.s. n.s n.s
Lacewing adults n.s n.s n.s Control n.s. Bt⫹ n.s. n.s
Lacewing larvae n.s n.s n.s n.s n.s n.s. n.s. n.s. n.s
Lacewing eggs n.s Control Bt⫹ n.s n.s Control Control n.s. n.s. n.s
Macrolophus n.s n.s. n.s n.s Bt⫹ n.s n.s. Bt⫹ Control
Cyrtopeltis Control n.s n.s Bt⫹ Control n.s n.s. n.s Bt⫹
Dicyphus n.s. n.s n.s n.s n.s. n.s
Miridae n.s. n.s. Bt⫹ n.s. Control Control Control Bt⫹ n.s n.s
Anthocoridae n.s Bt⫹ n.s Control n.s n.s. n.s. n.s. n.s
Nabidae n.s Control n.s n.s n.s n.s n.s. n.s. n.s. n.s
Staphylinidae n.s Control n.s Control n.s n.s n.s.
Coccinella n.s n.s n.s Control n.s n.s. n.s.
Hippodamia n.s n.s n.s n.s n.s Bt⫹ n.s n.s n.s.
Ladybirds larvae n.s n.s n.s. n.s n.s
Stethorus n.s n.s n.s n.s n.s n.s n.s. n.s. n.s.
Araneae n.s Control n.s n.s n.s Control Bt⫹ Bt⫹ Bt⫹ n.s
22-spot n.s n.s n.s n.s n.s n.s. n.s.
MRPP P value n.s 0.0000 0.000 n.s n.s n.s 0.000 0.000 0.000 0.000
OTUs that were present in a given sampling date have n.s., Bt⫹, or Control in the corresponding column. While n.s., which stands for not signiÞcant, indicates the lack of association between a taxon and a group of samples (Bt⫹ or Control), a cell with Bt⫹ or Control indicates a signiÞcant association between a taxon and the displayed treatment. In the last row, the results of MRPP are indicated. Probability levels are only shown for signiÞcant values.
pletely independent of those assumptions that limit the application of parametric statistics in ecological research (e.g., normal distribution of species abun-dances). In particular, ISA provides an effective non-parametric way for identifying taxa that are signiÞcantly associated with one among several previously deÞned groups (treatments). This method has been applied re-cently in different ecological Þelds (Morgan et al. 2003) to study the change in community composition in
rela-tion to common environmental variables. The combined use of MRPP and ISA provided dependable results about species assemblage composition and biotic response to different treatments while allowing the identiÞcation of species that can be used as effective indicators for further biological monitoring.
One major concern in planning surveys is that tax-onomic knowledge is often partial and imperfect. Therefore, the use of organismal taxonomic units is acceptable and is preferred to lumping species into larger units (orders, families). The use of families of higher taxonomic units is not appropriate because there are few families and even fewer orders where the constituent species have the same ecological role, belong to the same guild, or have the same feeding habits. Moreover, it is likely that technicians or para-taxonomists will sometimes conduct monitoring; in such situations, recognizing distinct taxonomic units will usually be reliable, but the allocation to higher taxonomic units will not.
As a prerequisite for indicating the validity of our multistep numerical approach, Leptinotarsa decemlin-eata, the target insect for the crop used, is clearly recognizable as being associated to the control plots. The comparative study of arthropod biodiversity gen-erally indicated a similar species assemblage between the two treatments (Bt-expressing and near isogenic eggplants) in our experimental Þelds for each of the 3 yr. Pooling species together may potentially obscure any existing effects of a Bt crop on single species (cf. Naranjo, 2005b). However, the results obtained with this simpliÞed sampling technique also agree with the outcome of a parallel study (Schmidt 2006), where a faunal list was obtained by identifying, in the labora-tory, specimens collected with plant eclector traps.
The group of Coleoptera Alticinae (mainly Chaetoc-nema tibialis Illiger and Epitrix hirtipennis Melshei-mer) was associated on different dates with either of the two treatments. Their overall abundance, how-ever, was signiÞcantly higher on transgenic eggplants compared with control plots. Our results correspond with the study of Daly and Buntin (2005), who found a higher abundance of the ßea beetle Chaetocnema pulicariaMelsheimer on Bt-expressing corn compared with the control. One possible explanation for this Þnding is that transgenic eggplants were much health-ier later in the season than control plants because of their resistance to L. decemlineata attack. This might allow other herbivores to feed on plants where there is less competition for the same resources. The Altici-nae are coleopterans in the family Chrysomelidae; therefore, they have a taxonomic proximity to the target species (the Colorado potato beetle) of Cry3Bb-express-ing eggplants. This suggests these herbivores are impor-tant nontarget species that should be further studied.
This paper is the Þrst report of a speciÞc study on the biosafety of a GM horticultural crop, whose Þeld management is very different in terms of area planted, agricultural practices, and resistance management from that of the more commonly studied commodity crops (corn, cotton, canola). In agreement with Þeld studies on Bt-expressing cotton and corn (Daly and
Fig. 4. Population dynamics of ßea beetles in transgenic
Buntin 2005, Naranjo 2005b), we found no major ef-fects on selected nontarget species caused by the presence of Cry toxins in crop plants.
The analysis of Þeld results over a 3-yr period seems adequate to guarantee a generally acceptable sensi-tivity to detect the effects expected from the use of GM crops (Naranjo 2005a). Our Þeld size, while not very different from what small farmers may devote to single horticultural crops, may have been a limitation for detecting effects on very mobile organisms (e.g., adult lacewings). Nevertheless, the size of our plots was larger than the critical minimal size indicated for Þeld studies in corn (9 m width; Prasifka et al. 2005). The use of a faunistic approach has been applied only recently in the fast growing literature on the biosafety of GM crops (Naranjo et al. 2005). We believe that, with a reasonably limited effort, this approach might furnish valuable ecological data about these particular agroeco-systems, where the most common or abundant species might not always be the ones potentially affected by the new cropping system (Jasinski et al. 2003). Moreover, only explicit consideration of the matricial nature of food webs can avoid gross underestimates of type I errors committed while isolating one organismÕs dynamics from that of other co-occurring and competing taxa. This ap-proach may also prove helpful in postrelease monitoring designs, where no case-speciÞc monitoring is planned, but rather a general surveillance of long-term effects is requested.
Acknowledgments
This work was supported by a grant from the EU (contract QLK3-CT-2000-00547) for the research project “Effects and mechanisms of Bt transgenes on biodiversity of nontarget insects: pollinators, herbivores and their natural enemies.” J.E.U.S. was supported by a grant from the ESF-AIGM pro-gram in 2001. We thank the technical staff at Metapontum Agrobios s.r.l. for assistance in Þeld observations. We also thank S. Summerer for linguistic advice. Eggplant seeds were kindly provided by G. Rotino (Istituto Sperimentale per lÕOrticoltura, Montanaso Lombardo, Italy). We thank four anonymous reviewers whose comments helped to improve the manuscript.
References Cited
Acciarri, N., S. Arpaia, G. Mennella, G. Vitelli, F. Sunseri, and G. L. Rotino. 2000. Transgenic resistance to the
Colo-rado potato beetle in Bt-expressing eggplant Þelds. Hor-tic. Sci. 35: 722Ð725.
Agrawal, A. 2000. Mechanisms, ecological consequences
and agricultural implications of tri-trophic interactions. Curr. Opin. Plant Biol. 3: 329 Ð335.
Arpaia, S. 2004. Workshop
reportÑmonitoring/bioindica-tors. IOBC-WPRS Bull. 27: 205Ð208.
Arpaia, S., G. Mennella, V. Onofaro, E. Perri, F. Sunseri, and G. L. Rotino. 1997. Production of transgenic eggplant
(Solanum melongena L.) resistant to Colorado potato bee-tle (Leptinotarsa decemlineata Say). Theor. Appl. Gen. 95: 329 Ð334.
Benze´cri, J. P. 1973. LÕAnalyse des Donne´es. vol. 2:
LÕAnalyse des Correspondances. Dunod, Paris, France.
Bhatti, M. A., J. Duan, G. Head, C. Jiang, M. J. McKee, T. E. Nickson, C. L. Pilcher, and C. D. Pilcher. 2005a. Field
evaluation of the impact of corn rootworm (Coleoptera: Chrysomelidae)-protected Bt corn on ground-dwelling invertebrates. Environ. Entomol. 34: 1325Ð1335.
Bhatti, M. A., J. Duan, G. Head, C. Jiang, M. J. McKee, T. E. Nickson, C. L. Pilcher, and C. D. Pilcher. 2005b. Field
evaluation of the impact of corn rootworm (Coleoptera: Chrysomelidae)-protected Bt corn on foliage-dwelling arthropods. Environ. Entomol. 34: 1336 Ð1345.
Birch, A. N. E., I. E. Geoghegan, M. E. N. Majerus, J. W. McNicol, C. A. Hackett, A. M. R. Gatehouse, and J. Gate-house. 1999. Tritrophic interactions involving pest aphids, predatory 2-spot ladybirds and transgenic pota-toes expressing snowdrop lectin for aphid resistance. Molec. Breed. 5: 75Ð 83.
Cowgill, S. E., C. Danks, and H. J. Atkinson. 2004.
Multitro-phic interactions involving genetically modiÞed potatoes, nontarget aphids, natural enemies and hyperparasitoids. Molec. Ecol. 13: 639 Ð 647.
Daly, T., and G. D. Buntin. 2005. Effect of Bacillus
thurin-giensistransgenic corn for lepidopteran control on non-target arthropods. Environ. Entomol. 34: 1292Ð1301.
Dively, G. P. 2005. Impact of transgenic VIP3A⫻ Cry1Ab
lepidopteran-resistant Þeld corn on the nontarget arthro-pod community. Environ. Entomol. 34: 1267Ð1291.
Dufrene, M., and P. Legendre. 1997. Species assemblages
and indicator species: the need for a ßexible asymmetrical approach. Ecol. Monogr. 67: 345Ð366.
European Union [EU]. 2000. European Union Parliament
and Council Directive 2000/60/EC of 23rd October 2000. Establishing a framework for community action in the Þeld of water policy. OfÞcial Journal PE-CONS, Brussels, Belgium.
Firbank, L., M. Lonsdale, and G. Poppy. 2005. Reassessing
the environmental risks of GM crops. Nat. Biotech. 23: 1475Ð1476.
French, B. W., L. D. Chandler, M. M. Ellsbury, B. W. Fuller, and M. West. 2004. Ground beetle (Coleoptera:
Cara-bidae) assemblages in a transgenic corn-soybean crop-ping system. Environ. Entomol. 33: 554 Ð563.
Gauch, H. G., Jr. 1982. Multivariate analysis in community
structure. Cambridge University Press, Cambridge, UK.
Hilbeck, A., M. Baumgartner, P. M. Fried, and F. Bigler. 1998. Effects of Bacillus thuringiensis corn-fed prey on
mortality and development time of immature Chrysoperla
carnea(Neuroptera:Chrysopidae). Environ. Entomol. 27: 480 Ð 487.
Hilbeck, A., W. J. Moar, M. Pusztai-Carey, A. Filippini, and F. Bigler. 1999. Prey-mediated effects of Cry1Ab toxin
and protoxin and Cry2A protoxin on the predator
Chry-soperla carnea.Entomol. Exp. Appl. 91: 305Ð316.
James, C. 2005. Global Status of Biotech/GM Crops in 2005.
ISAAA Briefs No. 34. ISAAA: Ithaca, NY.
Jasinski, J. R., J. B. Eisley, C. E. Young, J. Kovach, and H. Willson. 2003. Select nontarget arthropod abundance in
transgenic and nontransgenic Þeld crops in Ohio. Envi-ron. Entomol. 32: 407Ð 413.
Kruskal, J. B. 1964. Nonmetric multidimensional scaling: a
numerical method. Psychometrika 29: 115Ð129.
La Malfa, G. 1990. Melanzana (Solanum melongena L.), pp.
793Ð 810. In V. Bianco and F. Pimpini (eds.), Orticoltura. Patron Editore, Bologna, Italy.
Losey, J. E., L. S. Rayor, and M. E. Carter. 1999. Transgenic
pollen harms monarch larvae. Nature (Lond.) 399: 214.
Lovei, G. L., and S. Arpaia. 2005. The impact of transgenic
plants on natural enemies: a critical review of laboratory studies. Entomol. Exp. Appl. 14: 1Ð14.
Magurran, A. E. 1988. Ecological diversity and its
measure-ment. Princeton University Press, Princeton, NJ.
Mennella, G., N. Acciarri, A. D’Alessandro, D. Perrone, S. Arpaia, F. Sunseri, and G. L. Rotino. 2005. Mixed
de-ployment of Bt-expressing eggplant hybrids as reliable method to manage resistance to Colorado potato beetle. Sci. Horticult. 104: 127Ð135.
Mielke, P. W., and K. J. Berry. 1994. Permutation tests for
common locations among samples with unequal vari-ances. J. Educ. Behav. Stat. 19: 217Ð236.
Mielke, P. W., and K. J. Berry. 2001. Permutation methods:
a distance function approach. Springer, New York.
Mielke, P. W., K. J. Berry, and E. S. Johnson. 1976.
Multi-response permutation procedures for a priori classiÞca-tions. Commun. Stat. Theory Methods. 5: 1409 Ð1424.
Morgan, C. A., W. T. Peterson, and R. L. Emmett. 2003.
Onshore-offshore variations in copepod community structure off the Oregon coast during the summer up-welling season. Mar. Ecol. Prog. Ser. 249: 223Ð236.
Naranjo, S. E. 2005a. Long-term assessment of the effects of
transgenic Bt cotton on the abundance of nontarget ar-thropod natural enemies. Environ. Entomol. 34: 1193Ð 1210.
Naranjo, S. E. 2005b. Long-term assessment of the effects of
transgenic Bt cotton on the function of the natural enemy community. Environ. Entomol. 34: 1211Ð1223.
Naranjo, S. E., G. Head, and G. P. Dively. 2005. Field studies
assessing arthropod nontarget effects in Bt transgenic crops: introduction. Environ. Entomol. 34: 1178 Ð1180.
Oberhauser, K. S., and E.R.L. Rivers. 2003. Monarch
but-terßy (Danaus plexippus) larvae and Bt maize pollen: a review of ecological risk assessment for a non-target spe-cies. AgBiotechNet. 5: 1Ð7.
Pielou, E. C. 1984. The interpretation of ecological data: a
primer on classiÞcation and ordination. Wiley, New York.
Pilcher, C. D., M. E. Rice, and J. J. Obrycki. 2005. Impact of
transgenic Bacillus thuringiensis corn and crop phenology
on Þve nontarget arthropods. Environ. Entomol. 34: 1302Ð 1316.
Prasifka, J. R., R. L. Hellmich, G. P. Dively, and L. C. Lewis. 2005. Assessing the effects of pest management on
non-target arthropods: the inßuence of plot size and isolation. Environ. Entomol. 34: 1181Ð1192.
Raps, A., J. Kehr, P. Gugerli, W. J. Moar, F. Bigler, and A. Hilbeck. 2001. Immunological analysis of phloem sap of
Bacillus thuringiensiscorn and of the nontarget herbivore
Rhopalosiphum padi (Homoptera: Aphididae) for the presence of Cry1Ab. Mol. Ecol. 10: 525Ð533.
Schmidt, J. E. U. 2006. The inßuence of transgenic plants
expressing Bacillus thuringiensis␦-endotoxins on
arthro-pod diversity and trophic interactions in crop ecosystems. PhD dissertation, Swiss Federal Institute of Technology, Zurich, Switzerland.
Sunseri, F., M. C. Fiore, F. Mastrovito, E. Tramontano, and G. L. Rotino. 1993. In vivo selection and genetic analysis
for kanamycin resistance in transgenic eggplant (Solanum
melongenaL.). J. Genet. Breed. 47: 299 Ð306.
Whitehouse, M. E. A., L. J. Wilson, and G. P. Fitt. 2005. A
comparison of arthropod communities in transgenic Bt and conventional cotton in Australia. Environ. Entomol. 34: 224 Ð1241.
Zhang, G., F. Wan, G. L. Lo¨vei, W. Liu, and J. Guo. 2006.
Transmission of Bt toxin to the predator Propylaea
ja-ponica (Coleoptera: Coccinellidae) through its aphid prey feeding on transgenic Bt cotton. Environ. Entomol. 35: 143Ð150.
Zimmerman, G. M., H. Goetz, and P. W. Mielke, Jr. 1985.
Use of an improved statistical method for group compar-isons to study effects of prairie Þre. Ecology 66: 606 Ð 611.
Received for publication 21 May 2006; accepted 9 October 2006.