A Contingency Based Approach To Green Supply
Chain Management: How Contextual Factors
Influence Practices and Performance
Guido Regaldo ([email protected])Politecnico di Milano
Abstract
This paper investigates the adoption of Green Supply Chain Management (GSCM) by manufacturing companies operating in Italy. Taking cue from the contingency theory, are analyzed behaviors and outcomes of Italian companies in different contexts. Results reveal that the contexts in same cases have a relevant influence on the quantity and typology of GSCM practices adopted and also in their relation with environmental performance. Differently from previous results, have also been discovered clusters of companies that manage to have significant better environmental performance even if with a lower practices adoption. Results have implication for Italian companies that could find the best environmental solutions relating to the particular business and pressure contexts in which they operate.
Keywords:
Green Supply Chain Management, Contingency Theory, PerformanceIntroduction
A number of authors have referred to the green supply chain over the past decade due to emerging environmental management topics.
The growth in this green supply chain literature extends back to the early 1990s with the advent of corporate environmental management, environmentally conscious manufacturing strategy and supply chain management literature (Zhu & Sarkis, 2006). To simply understand Green Supply Chain Management (GSCM) issue, can be useful to go through the answer of the five Ws and one H (What, When, Where, Who, Why and How).
Figure 1: GSCM five Ws and one H
Through a review of the most used GSCM definitions is possible to have a look at What GSCM is and to understand how its interpretation has changed over the years.
One of first definitions is by Green et al. (1996) that wrote: “green supply refers to the way in which innovations in supply chain management and industrial purchasing may be considered in the context of the environment”.
In 2007 Srivastava explained GSCM as “integrating environmental thinking into supply chain management, including product design, material sourcing and selection, manufacturing processes, delivery of the final products to the consumers, and end of life management of the product after its useful life”.
In a more wide perspective, GSCM is a fundamental part of Sustainable Supply Chain Management (SSCM), defined by Carter & Rogers (2008) as “the strategic, transparent integration and achievement of an organization’s social, environmental, and economic goals in the systemic coordination of key inter-organizational business processes for improving the long-term economic performance of the individual company and its supply chains”. This definition focuses the attention not only on environmental but also on social and economic issues, forming the three recognized dimensions of sustainability also referred as the Triple Bottom Line (3BL) (Sharfman et al., 2009). The concept of sustainability was defined in the 1987 by the World Commission on Environment and Development (WCED) as “development which meets the needs of the present without compromising the ability of future generations to meet their own needs”.
Looking at the evolution of the GSCM definitions we can see that through the years there has been an increasing focus on the explanation of where and when GSCM has to be applied, as on its integration with the other two sides of sustainability.
WHAT?
WHERE? WHEN? HOW?
WHO? WHY?
Trying to give an answer to When GSCM apply is useful to see its time dependency. In particular, starting from GSCM definitions, is possible to outline two types of time dependency.
The first relate to the product/service and Srivastava (2007) explains it well because GSCM does not concentrate only on a particular point during the life of the product but starts before the product is even born, with “design practices”, and continues also after the product has finished its life with “end of life management”.
The second type of time dependency regards the kind of relationship necessary to develop a successful GSCM. As Carter & Rogers (2008) suggest the aim is to build long term cooperations with the other shareholders via long term contracts. To assist such a long time cooperation is necessary to establish different and enhanced way of communications and knowledge sharing throughout the chain, as different forms of collaborations (three C’s) like cross-functional teams and suppliers and customers development (Beske, 2012; Seuring & Muller, 2008; Ellinger, 2000).
To understand Where GSCM applies is necessary to recall the definitions of Supply Chain (SC). La Londe & Masters (1994) proposed that a supply chain is a set of firms that passes materials forward. These firms are responsible in manufacturing a product and placing it in the hands of the end user in the supply chain. Raw materials and components producers, products assemblers, wholesalers, retailer merchants, transportation companies and final consumers are all members of a supply chain.
In 2001 Mentzer et al. defined the supply chain as a set of three or more entities (organizations or individuals) directly involved in the upstream and downstream flows of products, services, finances, and/or information from a source to a customer.
After recalling some of the supply chain definitions is possible to conclude that GSCM can applies at any firm along the supply chain, starting upstream with raw materials producers and arriving downstream with final consumers. If thinking at the supply chain as a river, any point of this river may be subject of practices designed to improve the flowing of the water.
The stakeholder theory can help to answer the question of Who can apply GSCM. In the older view, there were only four parties which wishes and desires the company had to satisfy: investors, employees, suppliers and customers (Clarkson, 1995).
The stakeholder theory instead argues that there are also others actors linked with the company that can, in some way, influence its initiatives. These other stakeholders are communities, political groups, governmental bodies, prospective customers, etc. (Carter & Easton, 2011; Phillips & Freeman, 2003). All these stakeholders are involved in GSCM, directly or indirectly. Studies as that of Sarkis et al. (2010) have established the influence of stakeholder pressures on the adoption of environmental practices.
After a short briefing on GSCM meaning, answer to the question of Why to implement GSCM is both fundamental and very simple.
Global warming, pollution, depletion of natural resources, biodiversity extinction and expected population grow should be enough reasons to deal urgently with environmental issues. During the last years governments, companies and communities have increased their commitment but, often, the problem is not seen as urgent as it is and many objectives that could be immediately pursued are procrastinated to future generations.
The link between nature and companies was clear to Hart that in 1995 developed the “Natural Resource Based” view, a theory of competitive advantage based upon the firm’s relationship with the natural environment. According to Hart in the future would have been inevitable that business (market) would have become constrained by and dependent upon ecosystems (nature). To succeed in such a context, so, would have been always more important to develop environmentally sustainable economies activities (Hart, 1995).
To achieve such objectives the company can not work alone because, If we look only at the single company, it could be theoretically possible to become totally carbon free by outsourcing all the production. Clearly, this quite adopted practice among some companies, does not resolve the problem but just shifts it up or down the supply chain leaving to other actors the responsibility. So a wider and long term application of green practices has become fundamental and in this context GSCM finds its natural place (Emmett & Sood, 2010).
As has been said before, many actors have the power to influence companies to adopt green practices but, when it comes the time to chose what to do, a big problem arise. In fact considering the great amount of practices available, is normal to assume that companies will not be able to implement all of them or to find by themselves the “locus of investment” (Narasimhan et al., 2008).
The aim of this paper is, so, to contribute to answer the last important question: “How to positively apply GSCM through an ad hoc green practices implementation”.
Background and Research Objectives
During the last thirty years some events have radically changed the vision of the company and of its integration in the surrounding environment.
Significant was the quality revolution of 1980s and the supply chain revolution of 1990s, during which individual enterprises became members of larger networks that evolved from “standalone” units to integrated supply chains (Vachon & Mao, 2008). This integration led first to supply chain concerns that subsequently merged with sustainability needs into the concept of GSCM (Caniato et al., 2011). Carter & Roger (2008) suggested that engaging in sustainability, and SSCM in particular, was not discretionary, but rather a requirement. According to the work of Seuring & Muller (2008), the first papers regarding sustainable development along the supply chain have
seen publication in 1994 and during the following years the rate of publications has gradually increased. Among these works, is possible to see different research methodologies: theoretical and conceptual papers, case studies, surveys, modeling papers and literature reviews.
Either methodology is used, the research focus on one or more of these subjects: • Pressure/Drivers to adopt green practices;
• Barriers that hinder green practices implementation; • Practices implemented;
• Performance gained;
Figure 2: Path from pressure/drivers to performance through practice implementation
The logic of GSCM practices implementation is described in Figure 2. The first input is any sort of pressure/driver the company receives. The pressure/driver makes the company think to adopt certain practices and this usually can lead to face some barriers that hinder the implementation. After overcoming the barriers the practices can finally be realized and their performance evaluated. It can also happen that the barriers are not present or are easily overcome, allowing an immediate transition from pressure/drivers to practices implementation.
In this paper the focus is on environmental performance gained from green practices adoption, so has been done the hypothesis that barriers are not present or have been already overcome. Looking at Figure 2 it is clear that to implement a green practice the barriers can no longer exist, otherwise the GSCM process will stop immediately.
When a company decides to implement a green practice this is always a consequence of a particular driver and/or pressure. The word “pressure” is often used more when referring to something that is imposed to the company and that forces it to implement particular green practices, independently of their efficiency and impact on company performance. So an example of pressure could be the environmental policies established by the European Union, as RoHS (the restricted use of hazardous substances in electrical and electronic equipment) and WEEE (waste electronics and electrical equipment) directives. The word “driver” is instead used more when referring to some actions or conditions that lead the company to adopt a particular green practice, considered to be related to some sort of efficiency and increase in performance.
In other words, usually, “pressure” lead to a passive adoption while “drivers” lead to a proactive adoption of green practices. Sousa & Voss (2008) distinguished between these efficiency and non-efficiency factors identified as drivers of adoption of OM practices
in manufacturing operations. In the following of this paper will refer to pressure or to driver basing on the particular context.
One of the most used classification is reported by Walker et al. (2008), dividing the drivers between internal and external ones. This distinction refers to where the drivers come from, if within the organization or outside it. The drivers coming from outside the organization are further divided in: regulatory, customers, competition, society and suppliers. This distinction is however not exhaustive because it focuses mainly on the source of the pressure and not on its typology. Starting from this gap the institutional theory perspective (Meyer & Rowan, 1977) comes in help. According to DiMaggio & Powell (1983) the business choices are not all the result of rational economic decisions but are influenced by external norms, values and traditions, resulting in three institutional pressures: coercive, mimetic and normative. Coercive pressures are formal or informal pressures applied by an organization on organizations upon which they are dependent, via governmental legislation and cultural expectations within society. Normative pressures stem from professionalization and these pressures manifest themselves in the form of organizations following an industry norm. Finally, Mimetic isomorphism is a response to ambiguous situations and result from organizations mimic the responses of other organizations (DiMaggio & Powell, 1983).
In response to these pressure, companies apply certain practices to achieve objectives and performance required. To choose the right practice is so a fundamental step in GSCM and can make the difference between a successful or disastrous green practices implementation, even more if considering that the results will reflect on the entire supply chain. In the research by Hervani et al. (2005) the practices are divided on the basis of GSCM definition, where the “green” component has been added to the supply chain management. Zhu & Sarkis have realized many research on this subject and in particular in Zhu & Sarkis (2006) have been studied the level of practices implementation in chinese industries and have been grouped the practices in green purchasing, cooperation with customers including environmental requirements, investment recovery, eco design and internal management. Another perspective, that can help dividing the practices in clusters, is the one used by Klassen & Vachon (2003). In their study on GSCM, they decided to concentrate the attention on two dimensions of green supply chain activities: collaboration and evaluation. Collaborative practices are the ones that require some interaction with suppliers and/or customers to achieve sustained improvements in environmental performance, while evaluative practices concern information gathering to assess and to monitor environmental management and performance of suppliers. This different perspective is particularly useful because it focuses more on the types of interactions between Who along the supply chain can implement green practices, while Zhu & Sarkis (2006) focus more on Where and When to apply them.
The implementation of practices leads to performance that are the core objective of any company. Economical performance is the essential one because no company can bear, on long-term, to spend more than what it earns. Environmental performance instead is the crucial future performance with objectives far more big than the survival of a single company. Performance evaluation becomes so a crucial step with precise objectives. The first one is to assess what has been done so to learn, both from successful and unsuccessful implementation. Only through an assessment of the results gained is possible to decide what to do next. The last objective of performance evaluation is to motivate people and organizations involved, so to obtain even more commitment for current and future aims.
Usually researchers, after individually evaluated pressure, practices and performance, work at the most challenging aim that is to find the right interpretation of the relationships between pressure and practices and between practices and performance. Only understanding the link between them is possible to give a real contribution to GSCM subject. Examples of the latest efforts in this direction are the works of Micheli
et al. (2011) and of Azevedo et al. (2011).
A conclusion that has been verified many times is that, on average, companies implementing more practices obtain better performance (e.g., Zhu et al., 2011). Based on these analysis, companies could be brought to think that the key to obtain better environmental performance is just to implement more practices as possible or just chose from the ones that are the most implemented or considered the best performance carrier. However it happens that companies doing this does not achieve the performance expected, or happens that the same practices lead to different results in different companies. So, what is missing in GSCM research, is a comprehensive study on the possible reasons of this mismatch between research results and companies results.
To do this come in help the contingency approach, based on contingency theory.
According to this theory there is a shift in interest from the justification of the value of “best” practices to the understanding of the contextual conditions under which they are effective (Sousa & Voss, 2008). Contingency approach has been already used in different topics as in Bozarth & Chapman (1996), where have been studied time-based competition (TBC), or in Sousa & Voss (2008), where have been investigated operation management (OM) best practices.
Based on the analysis above, the Research Objectives (ROs) are the following: • RO1. To apply Contingency analysis to GSCM, choosing the most relevant
contexts;
• RO2. To explore the level of adoption of GSCM practices in different contexts; • RO3. To explore to which degree GSCM practices can lead to environmental
• RO4. To understand how strong is the relationships between GSCM practices and environmental performance in different contexts.
Research Model and Methodology
The data have been taken from a cross-sectorial survey, regarding GSCM, that was conducted from September to December 2009. The survey, inspired by the works of Joseph Sarkis (Zhu & Sarkis, 2006; Hervani et al., 2005; Zhu & Sarkis, 2004), consists of 111 questions divided in four sections:
• Section 1: Business information of the companies and supply chain; • Section 2: GSCM pressure and drivers;
• Section 3: GSCM practices; • Section 4: GSCM performance.
The first section contains 34 questions regarding general informations of the company and of its business. These informations are the ground above which apply the contingency theory because, starting from these data, is possible to divide the companies in clusters based on the same particular context.
The other 3 sections regard GSCM pressure, GSCM practices and GSCM performance and the framework is shown in Figure 3.
Figure 3: Research model
In December 2009 were been received a total of 100 responses for a total survey rate of 10,14%. The respondents had to answer using a 5-point Likert scale to determine: the level of GSCM pressure, the level of implementation of GSCM practices and the change in performance related to GSCM practices adoption.
PRESSURES
(33 items) GSCM PRACTICES(23 items)
PERFORMANCE (21 items)
Regulatory
Customer and Community
Suppliers Competitors Internal Factors Customer Cooperation Green Purchasing Investment Recovery Eco-Design Internal Management Environmental Economic Operational
Starting from these data, validated in Micheli et al. (2011), the first objective has been to chose the most relevant contexts (RO1) to be used in this contingency analysis. To do this has been made a literature review and have been selected 19 significant contexts from the information within the survey. They are summarized in Table 1.
Table 1: Different levels of the 19 contexts studied
Regarding RO2, a descriptive analysis has been performed, with the hypothesis: • H2.1 Companies in different contexts apply different typology of GSCM
practices;
• H2.2 Companies in different contexts apply different quantity of GSCM practices;
Context Levels
1. Company dimension Small; Medium; Medium-large; Large 2. Belonging to a group Yes; No
3. Production strategy MTS; MTO-ATO; ETO; ITO 4. Prospective supply chain No; Yes
5. Number of supply chain served One; More than one
6. Role in the supply chain First-tier supplier; Second-tier supplier; OEM contractor
7. Way of interaction with other actors Receiving directions; Passive cooperation; Peer to peer cooperation; Active cooperation; Dictating directions
8. Replaceability Low; Medium; High
9. Green image pressure Not relevant; Relevant 10. Product and internal processes
pressure
Not relevant; Relevant
11. Non local customer pressure Not relevant; Relevant 12. Community pressure Not relevant; Relevant 13. Supply chain pressure Not relevant; Relevant 14. Internal factors pressure Not relevant; Relevant 15. Competitors pressure Not relevant; Relevant 16. Regulatory pressure Not relevant; Relevant 17. Company performance versus
competitors’
Poorer; The same; Better
18.Supply chain performance versus competitors’
Poorer; The same; Better
19. Performance trend of the last 3 years versus competitors’
For RO3 in particular has been done the following hypothesis, to be tested with empirical data:
• H3.1 Companies in different contexts achieve different level of environmental performance;
• H3.2 In some contexts companies with lower level of GSCM practices adoption achieve better environmental performance;
Finally, to understand how strong is the relationship between GSCM practices and environmental performance in different contexts (RO4), has been conducted a correlation analysis. Other performance have been deliberately excluded from this analysis because the idea is not to find practices that provide a compromise between different performance, but to find the best solutions in environmental area. According to this, the future important question will not be if these solutions are also sustainable in an economic and social way but how to make this possible.
Looking at the visual representation of the 3BL in Figure 4, the logic is to move the social and economic circles towards the environmental performance circle, ideally making the 3 circles overlap. This, passing the static vision that wants to see the 3 circles fixed with only a small central area of intersection where to find the sustainability.
Figure 4: The triple bottom line of sustainability revisited
Figure 5 shows the framework of how the results are presented and how they are used to answer the ROs and the linked Hs.
Environmental Performance Social Performance Economic Performance Sustainability
Figure 5: Framework of the analysis
In the analysis of the typology and quantity of GSCM practices adopted, have been taken into account only the ones already full implemented or at least with some activities in execution (in the 5-point Likert scale this correspond to a value of 5 and 4 respectively). This decision is consistent because, for RO3 and RO4 to be analyzed, is necessary that at least the GSCM practices are partially implemented.
To evaluate H2.1, practices have been sorted from the most to the less partially or fully implemented and are considered relevant differences between clusters of more than 2 practices out of the 5 most adopted. Hypothesis H2.2 is instead assessed through the analysis of the average of practices adopted by companies in each cluster and is considered relevant a difference of 10% or more. Table 2 is an example of how the informations are collected to answer these first 2 hypothesis.
TYPOLOGY QUANTITY AVERAGE H3.2 H2.1 CORRELATION RO4 input output output H2.2 PRACTICES (23 items) ENVIRONMENTAL PERFORMANCE (6 items) H3.1
Table 2: (excerpt of) Practices implemented based on “Company Dimension” context
Objective RO3 reckons on the study of descriptive statistics of environmental performance and on its comparison with informations about GSCM practices. To verify H3.1 and H3.2 has been considered the average of all environmental performance. Differences in performance between different clusters are considered relevant if there is a gap of more than 10%.
In particular to verify H3.2 the condition is that companies belonging to a cluster have implemented or partially implemented at least 10% less practices and have gained at least 10% more environmental performance compared to other clusters. In Table 3 there is an example, always for the “Company Dimension” context, of the data used to answer H3.1 and H3.2.
practice n° Small company (N=41) # 4 # 5 #4-5 %4-5 %5 8 10 20 17 9 Design'of'products'for'reduced'consumption'of'material/energy 18 10 28 68 24 Design'of'products'to'avoid'or'reduce'use'of'hazardous'products' 20 7 27 66 17 Support'for'GSCM'from'midClevel'managers 16 11 27 66 27 Environmental'Management'Systems'exist' 13 10 23 56 24 Design'of'products'for'reuse,'recycle,'recovery'of'material,'component'parts 18 2 20 49 5
[...] Average = Average = Average = 38 11 practice n° Medium company (N=20) # 4 # 5 #4-5 %4-5 %5
8 20 18 22 23 Design'of'products'for'reduced'consumption'of'material/energy 7 8 15 75 40 Support'for'GSCM'from'midClevel'managers 9 4 13 65 20 Measurement'and'monitoring'of'environmental'performance 9 3 12 60 15 Sale'of'scrap'and'used'materials' 8 4 12 60 20 Sale'of'excess'capital'equipment 8 4 12 60 20
[...] Average =Average =Average = 46 16 practice n° Medium-large company (N=20) # 4 # 5 #4-5 %4-5 %5
8 17 5 9 10 Design'of'products'for'reduced'consumption'of'material/energy 11 4 15 75 20 Environmental'Management'Systems'exist' 5 9 14 70 45 Cooperation'with'customers'for'cleaner'production 11 2 13 65 10 Design'of'products'for'reuse,'recycle,'recovery'of'material,'component'parts 11 2 13 65 10 Design'of'products'to'avoid'or'reduce'use'of'hazardous'products' 7 5 12 60 25
[...] Average =Average =Average = 44 12 practice n° Large company (N=19) # 4 # 5 #4-5 %4-5 %5
8 1 16 17 18 Design'of'products'for'reduced'consumption'of'material/energy 9 7 16 84 37 'Providing'design'specification'to'suppliers'that'include'environmental' requirements'for'purchased'items 3 12 15 79 63 ISO'14000'certification' 2 13 15 79 68 Environmental'Management'Systems'exist' 2 13 15 79 68 Measurement'and'monitoring'of'environmental'performance 5 10 15 79 53
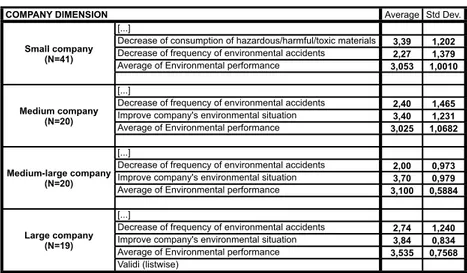
Table 3: (excerpt of) Environmental performance based on “Company Dimension” context
RO4 is performed through a correlation analysis and, among significant correlations, data are highlighted as follow:
Table 4: Framework of colors used to highlight the correlations
An excerpt of the correlation analysis between the 23 practices and the 6 environmental performance in the “Company Dimension” context is presented in table 5.
Table 5: (excerpt of) Correlations based on “Company Dimension” context
COMPANY DIMENSION
COMPANY DIMENSION Average Std Dev.
Small company (N=41)
[...]
Small company (N=41)
Decrease of consumption of hazardous/harmful/toxic materials 3,39 1,202 Small company
(N=41) Decrease of frequency of environmental accidents 2,27 1,379 Small company
(N=41)
Average of Environmental performance 3,053 1,0010 Small company (N=41) Medium company (N=20) [...] Medium company (N=20)
Decrease of frequency of environmental accidents 2,40 1,465 Medium company
(N=20) Improve company's environmental situation 3,40 1,231 Medium company
(N=20)
Average of Environmental performance 3,025 1,0682 Medium company (N=20) Medium-large company (N=20) [...] Medium-large company (N=20)
Decrease of frequency of environmental accidents 2,00 0,973 Medium-large company
(N=20) Improve company's environmental situation 3,70 0,979 Medium-large company
(N=20)
Average of Environmental performance 3,100 0,5884 Medium-large company (N=20) Large company (N=19) [...] Large company (N=19)
Decrease of frequency of environmental accidents 2,74 1,240 Large company
(N=19) Improve company's environmental situation 3,84 0,834 Large company
(N=19)
Average of Environmental performance 3,535 0,7568 Large company (N=19) Validi (listwise) Pearson’s coefficent Color x<#0,4 negative.correlated 0,600<x<0,699 well.correlated 0,700<x<0,799 highly.correlated x>0,800 very.highly.correlated COMPANY DIMENSION COMPANY DIMENSION
COMPANY DIMENSION Reduction of air emission
Reduction of liquid
wastes Reduction of solid wastes
Decrease of consumption of hazardous/harmful/ toxic materials Decrease of frequency of environmental accidents Improve a company's environmental situation Small company (N=41)
Design of products to avoid or reduce use of
hazardous products Pearson Correlation .267
* .312* 0,038 .680** .425** .287*
Small company (N=41)
Design of products to avoid or reduce use of
hazardous products Sig. (1-tailed) 0,045 0,024 0,406 0,000 0,003 0,034
Small company (N=41)
Environmental compliance and auditing programs
Pearson Correlation .577** .496** .467** .387** .272* .608**
Small company (N=41)
Environmental compliance and auditing
programs Sig. (1-tailed) 0,000 0,000 0,001 0,006 0,043 0,000
Small company (N=41) [...] Small company (N=41) [...] Medium company (N=20)
Cooperation with suppliers for environmental
objectives Pearson Correlation .792** .622** .668** .683** .672** .655**
Medium company (N=20)
Cooperation with suppliers for environmental
objectives Sig. (1-tailed) 0,000 0,002 0,001 0,000 0,001 0,001
Medium company (N=20) [...] Medium company (N=20) [...] Medium company
(N=20) Environmental Management Systems exist Pearson Correlation .523** .619** .535** .429* 0,361 .549**
Medium company
(N=20) Environmental Management Systems exist
Sig. (1-tailed) 0,009 0,002 0,007 0,030 0,059 0,006
Medium company (N=20)
Measurement and monitoring of
environmental performance Pearson Correlation .669
** .687** .645** .454* .498* .654**
Medium company (N=20)
Measurement and monitoring of
environmental performance Sig. (1-tailed) 0,001 0,000 0,001 0,022 0,013 0,001
Medium-large company (N=20)
Design of products for reduced consumption of material/energy
Pearson Correlation 0,378 0,203 .742** 0,338 0,000 -0,024
Medium-large company (N=20)
Design of products for reduced consumption
of material/energy Sig. (1-tailed) 0,050 0,196 0,000 0,073 0,500 0,461
Medium-large company (N=20)
Design of products to avoid or reduce use of hazardous products
Pearson Correlation 0,009 -0,306 .522** .793** 0,150 0,010
Medium-large company (N=20)
Design of products to avoid or reduce use of
hazardous products Sig. (1-tailed) 0,485 0,095 0,009 0,000 0,264 0,483
Medium-large company (N=20) [...] Medium-large company (N=20) [...] Medium-large company (N=20)
Investment recovery (sale) of excess
inventories/materials Pearson Correlation -.471
* -0,125 0,333 0,217 -0,046 0,023
Medium-large company (N=20)
Investment recovery (sale) of excess
inventories/materials Sig. (1-tailed) 0,018 0,300 0,076 0,179 0,423 0,462
Medium-large company (N=20)
Sale of excess capital equipment Pearson Correlation -.400* -0,173 0,243 0,143 0,103 -0,072
Medium-large company (N=20)
Sale of excess capital equipment
Sig. (1-tailed) 0,040 0,232 0,151 0,274 0,332 0,382
Large company (N=19)
Providing design specification to suppliers that include environmental requirements for purchased items
Pearson Correlation 0,319 .440* .775** 0,226 -0,242 .565**
Large company (N=19)
Providing design specification to suppliers that include environmental requirements for
purchased items Sig. (1-tailed) 0,092 0,030 0,000 0,176 0,159 0,006
Large company (N=19) [...] Large company (N=19) [...] Large company
(N=19) Design of products for reduced consumption of material/energy Pearson Correlation 0,261 .402
* .728** 0,279 -0,011 .597**
Large company
(N=19) Design of products for reduced consumption of material/energy Sig. (1-tailed) 0,140 0,044 0,000 0,124 0,482 0,004
Large company (N=19)
Investment recovery (sale) of excess
inventories/materials Pearson Correlation 0,016 -.402
* -0,285 -0,271 -0,017 -.412*
Large company (N=19)
Investment recovery (sale) of excess
inventories/materials Sig. (1-tailed) 0,474 0,044 0,118 0,131 0,472 0,040
Large company (N=19)
Sale of excess capital equipment Pearson Correlation -0,024 -.434* -0,352 -0,245 0,021 -0,387
Large company (N=19)
Sale of excess capital equipment
Sig. (1-tailed) 0,462 0,032 0,070 0,156 0,467 0,051
**. Correlation is significant at the 0,01 level (1-tailed) **. Correlation is significant at the 0,01 level (1-tailed) **. Correlation is significant at the 0,01 level (1-tailed) **. Correlation is significant at the 0,01 level (1-tailed) **. Correlation is significant at the 0,01 level (1-tailed) **. Correlation is significant at the 0,01 level (1-tailed) **. Correlation is significant at the 0,01 level (1-tailed) **. Correlation is significant at the 0,01 level (1-tailed) **. Correlation is significant at the 0,01 level (1-tailed) *. Correlation is significant at the 0,05 level (1-tailed) *. Correlation is significant at the 0,05 level (1-tailed) *. Correlation is significant at the 0,05 level (1-tailed) *. Correlation is significant at the 0,05 level (1-tailed) *. Correlation is significant at the 0,05 level (1-tailed) *. Correlation is significant at the 0,05 level (1-tailed) *. Correlation is significant at the 0,05 level (1-tailed) *. Correlation is significant at the 0,05 level (1-tailed) *. Correlation is significant at the 0,05 level (1-tailed)
Discussion of Main Results
The analysis have been repeated for every one of the 19 contexts to find relevant ones according to the ROs.
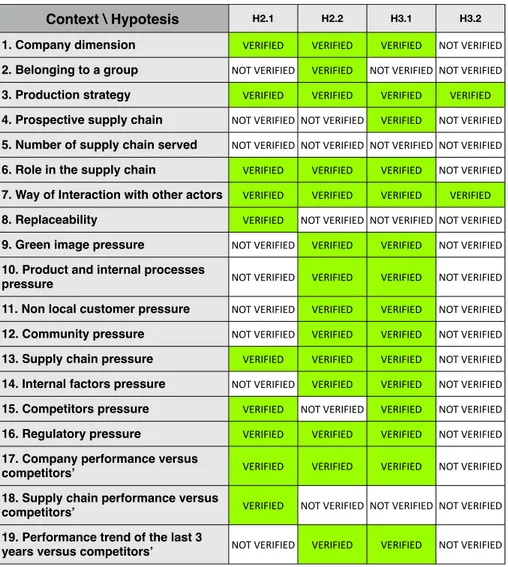
Table 6 highlights, for each context studied, the hypothesis that have been verified, while Figure 6 compare their number pointing out the most relevant contexts.
Table 6: Validity of the four hypothesis in each context
Context \ Hypotesis H2.1 H2.2 H3.1 H3.2
1. Company dimension 2. Belonging to a group 3. Production strategy 4. Prospective supply chain 5. Number of supply chain served 6. Role in the supply chain
7. Way of Interaction with other actors 8. Replaceability
9. Green image pressure
10. Product and internal processes pressure
11. Non local customer pressure 12. Community pressure 13. Supply chain pressure 14. Internal factors pressure 15. Competitors pressure 16. Regulatory pressure
17. Company performance versus competitors’
18. Supply chain performance versus competitors’
19. Performance trend of the last 3 years versus competitors’
VERIFIED VERIFIED VERIFIED NOT*VERIFIED NOT*VERIFIED VERIFIED NOT*VERIFIED NOT*VERIFIED VERIFIED VERIFIED VERIFIED VERIFIED NOT*VERIFIED NOT*VERIFIED VERIFIED NOT*VERIFIED NOT*VERIFIED NOT*VERIFIED NOT*VERIFIED NOT*VERIFIED VERIFIED VERIFIED VERIFIED NOT*VERIFIED VERIFIED VERIFIED VERIFIED VERIFIED VERIFIED NOT*VERIFIED NOT*VERIFIED NOT*VERIFIED NOT*VERIFIED VERIFIED VERIFIED NOT*VERIFIED
NOT*VERIFIED VERIFIED VERIFIED NOT*VERIFIED
NOT*VERIFIED VERIFIED VERIFIED NOT*VERIFIED NOT*VERIFIED VERIFIED VERIFIED NOT*VERIFIED VERIFIED VERIFIED VERIFIED NOT*VERIFIED NOT*VERIFIED VERIFIED VERIFIED NOT*VERIFIED VERIFIED NOT*VERIFIED VERIFIED NOT*VERIFIED VERIFIED VERIFIED VERIFIED NOT*VERIFIED
VERIFIED VERIFIED VERIFIED NOT*VERIFIED
VERIFIED NOT*VERIFIED NOT*VERIFIED NOT*VERIFIED
Figure 6: Summary of the n° of hypothesis verified in each context
The first overview of Table 6 shows that all the contexts studied, except for “Number of supply chain served”, divide the sample in clusters with a significative difference in GSCM practices implemented and/or environmental performance gained. This seems to justify the importance of this contingency analysis and the relevance of the contexts selected. However, the hypothesis investigated are not verified with the same frequency among the 19 contexts studied.
H3.1, i.e. companies in different context achieve different level of environmental performance, is the most verified (15 times) followed by H2.2, i.e. companies in different context apply different quantity of GSCM practices, that is verified 14 times. H2.1, i.e. companies in different contexts apply different typology of practices, is instead verified 10 times while H3.2, i.e. in some contexts companies with lower level
Business context
Performance context Pressure context
Typology of context N° of hypothesis verified
4 3 1 0 Context 3. Production strategy
7. Way of Interaction with other actors
1. Company dimension 6. Role in the supply chain
2. Belonging to a group 4. Prospective supply chain 8. Replaceability
5. Number of supply chain served
3
13. Supply chain pressure 16. Regulatory pressure
2
9. Green image pressure
10. Product and internal processes pressure
11. Non local customer pressure 12. Community pressure 14. Internal factors pressure 15. Competitors pressure
3
2
1
17. Company performance versus competitors’
18. Supply chain performance versus competitors’
19. Performance trend of the last 3 years versus competitors’
of GSCM practices adoption achieve better environmental performance, is the less verified (only 2 times). Interesting to notice that in the 2 contexts in which H3.2 has been verified, all other hypothesis have been too, almost as if H3.2 would require all other hypothesis to be verified. Figure 6 is even more clear to point out that only in “Production strategy” and in “Way of interaction with other actors” contexts all the hypothesis are verified. These 2 business contexts seems to have the highest influence on GSCM practices and environmental performance. Different clusters of companies based on these 2 contexts implement different typology of practices, in a different quantity and achieve different and sometimes opposite performance, compared to what would be supposed if looking at their adoption efforts.
Starting from the “Production strategy” context, very interesting is the behavior of Innovate To Order (ITO) companies. As the ETO firms, they implement only operational practices. However the ITO firms have the lowest level of GSCM practices adoption (31%) together with the best environmental performance (3,426), significantly higher than that of MTO-ATO firms (3,076). Previous researches on GSCM, as Zhu et al. (2011), have verified that usually higher level of practices adoption leads to higher environmental performance but, for this particular cluster of companies, does not seem to be true.
Looking at the correlation analysis, ITO companies have 20 GSCM practices significantly related with environmental performance, among which there are all the 5 most implemented. Can be suggested that these firms know how to correctly apply the practices so to obtain the best improvement and that they know which are the best practices to be implemented in their context. This unpredicted result can be explained looking at the nature of ITO firms. In fact, as explained in Wadhwa and Rao (2003) in relation to the ITO firms, the future of competitiveness will involve both variety and responsiveness challenges with an increasing focus on proactive knowledge and innovation management. Considering this and the high technology of products/services the ITO companies can offer, can be plausible that these companies have the knowledge, competence and willingness to find the best practices and the right way to implement them in relation to their context. In any case ITO companies demonstrate that is possible to achieve great environmental beneficial effect without a “quantity approach” but with a “quality approach” to GSCM practices.
The “Way of interaction with other actors” context is the other one in which H3.2 is verified. In this context company receiving directions obtain significantly better performance of firms doing passive cooperation, respectively 2.972 and 2.563, and this despite a lower practice adoption. This could be explained considering that companies receiving directions do not lose any time thinking on what to do and how to properly do it but just apply the practices imposed by firms dictating directions and in the way they say it has to be done. Conversely, companies doing passive cooperation are probably
involved in an activity that they are not interested in and this could affect the overall environmental performance gained.
Always in this context is clear that the best environmental performance are obtained by companies doing peer-to-peer or active cooperation, that apply a significant more quantity of practices. This to confirm that a real involvement of the firms along the supply chain is required to obtain beneficial effects on supply chain environmental performance.
The clusters based on the “Company dimension” context show that companies with an increasing dimension tend to apply more practices and to shift their attention from operational to managerial ones. Also the environmental performance have this positive trend going from small to large firms. H2.1, H2.2 and H3.1 are so verified.
H3.2 is the only not verified and, instead, is clear that large companies obtain significant better environmental performance than all others. Looking at the correlations analysis appears that the 2 most implemented practices by large companies are also high correlated. This context confirm that the dimension of the companies and and the quantity of practices implemented can have a great impact on environmental performance. This for sure is related to the different level of material, human and financial resources that large companies can exploit towards environmental objectives. Significant also the results of the 2 clusters based on “Prospective supply chain” context. Companies with a prospective supply chain adopt quite the same practices and in the same quantity but achieve significant better performance than companies without a prospective supply chain. So it seems that in this cluster companies are able to apply in a better way the same practices. This seems to be confirmed also looking at the correlation analysis in which 10 practices show a significant positive relation with environmental performance and between them there are all the most implemented. Companies without a prospective supply chain instead have only 2 practices significantly related. The reasons of this difference could be explained considering that companies with a prospective supply chain have necessarily a proactive attitude because they are searching for new opportunities. This mentality could help them to positively apply the practices, confirming that a “quality approach” to GSCM practices can lead to significant superior results.
Regard to the contexts based on the different levels of pressure perceived by the companies, from Table 6 is possible to outline a common behavior: all the firms receiving a relevant pressure are also the ones with relevant better environmental performance. Except for “Competitor pressure” context, all other reveal also that firms with a relevant pressure apply significant more GSCM practices.
For 5 out of the 8 different types of pressure, firms receiving a relevant pressure tend to apply significant more practices achieving better environmental performance, this without changing the type of practices most adopted. This suggests that in the majority
of the cases companies respond to a pressure just applying more practices. To better interpret the data is useful to look at Table 7.
Table 7: Impact of different pressure on the sample
From Table 7 results that the distribution of the sample, varying the type of pressure, is not always the same. In only 3 pressure, out of the 8, there are more companies receiving a relevant pressure. These pressure are: “Green image”, “Non local customer” and “Regulatory”. At the extreme there are “Community” and “Regulatory” pressure. Considering “Community” pressure 84 firms do not receive a relevant pressure, while instead 91 firms receive a relevant “Regulatory” pressure.
Looking at the increase in environmental performance derived from a relevant pressure the values go from a 15% of companies receiving a relevant “Competitors” pressure to the 36% of companies receiving an “Internal factors” pressure. “Regulatory” pressure, that is without doubt the more widespread among the firms, stops at 27%.
Interesting the result of the 16 firms receiving a relevant “Community” pressure that achieve a 35% increase in environmental performance. Looking at the quantity of practices implemented they do significantly more and are the only ones to achieve an average of all environmental performance above 4,00 (4,042). This is achieved through very high values in “Reduction of air emission” (4,50), “Reduction of liquid wastes” (4,06), “Decrease of consumption of hazardous/harmful/toxic materials” (4,19) and “Improve company’s environmental situation” (4,50).
Looking at the correlations analysis, in this case the results are quite different from what expected. In fact only in “Decrease of consumption of hazardous/harmful/toxic materials” there are GSCM practices significantly related. Can suppose that in this case no practices are significantly related with the other single environmental performance but the high beneficial effects on environmental performance for this case derive more from the quantity of practices implemented as a whole.
PRESSURE N° of Not Relevant N° of Relavant Increase in environmental performance 12. Community 15. Competitors 14. Internal factors 10. Product and internal processes 13. Supply chain 9. Green image 11. Non local customers 16. Regulatory 84 16 35% 79 21 15% 61 39 36% 60 40 24% 55 45 33% 45 55 26% 44 56 18% 9 91 27%
The “Regulatory pressure” context reveals that the 9 companies do not receiving a relevant pressure are the less active with an average of only 17% of practices adopted. It seems so that this cluster of companies is the less stimulated to adopt GSCM practices. In this context, besides H2.2 and H3.1, H2.1 is also verified and this can be justified considering that regulatory pressure often forces firms to apply specific practices, different from what they would have applied by their own.
In the last 3 contexts based on the perceived level of performance compared to competitors’, in particular has been assessed the perceived performance of the companies, of their supply chain and the trend in the last 3 years. The results visible in Table 6 show that there is not a similarity, concerning the hypothesis verified, between these 3 contexts. The only similarity is in the distribution of the sample between the 3 clusters in each context, with always very few companies perceiving a poorer performance. This can be explained with the consideration that the answers to this survey could have arrived principally from companies with an interest in GSCM issues and with a positive consideration of their overall performance compared to competitors’. The “Performance of supply chain versus competitors” context shows some contradictions because, despite the performance perceived, companies with poorer performance show slight better values of the average of all environmental performance. This difference is however not enough to be considered relevant but show some discrepancy between the perceived performance of the supply chain and the environmental performance of the company. Would be interesting to explore through further researches the reasons of this result.
Conclusions
This paper has had the aim to apply the contingency theory to GSCM and, through a contingency approach, to study the impact of different contexts on GSCM practices implemented and environmental performance gained. Many contexts have been demonstrated to be relevant, affecting in a significative way behaviors and outcomes of the firms. Correlation analysis, through an evaluation of relationships between practices and performance, have helped to justify differences between different contexts and clusters. In 2 clusters has also been verified that companies adopting fewer practices manage to obtain better environmental performance than other clusters, and this despite many research often conclude that adopting more generally lead to better performance (e.g., Zhu et al., 2011).
The results of this paper so confirm that a contingency approach to GSCM is useful to not lose the unicity of the contexts in which companies operate and to give them the right advices regarding the best practices to adopt, so to achieve greater sustainability. The fact that all data comes from Italian companies is the major limitation of this paper, because results could differ in other countries. Also the dimension of the sample is
another limitation because in few cases this leads to clusters of less than 10 companies. However the research methodology applied and the main results are not affected by this, but further analysis with a bigger sample size could be appreciated to confirm these results. Further research also could, through case studies, focus on the most interesting clusters of companies, so to continue with the explanation of the most interesting results obtained in this paper.
Bibliography
Azevedo, S.G., Carvalho, H.V., and Machado, V.C. (2011), “The influence of green practices on supply chain performance: A case study approach”, Transportation research part E: Logistics and Transportation Review, Volume 47, Issue 6, pp. 850-871.
Bai, C., and Sarkis, J. (2010), “Green supplier development: Analytical evaluation using rough set theory”, Journal of Cleaner Production, 18(12), pp. 1200-1210.
Basil, D., Runte, M., Basil, M., and Usher, J. (2011), “Company support for employee volunteerism: Does size matter?”, Journal of Business Research 64 (1) (1), pp. 61-66. Beske, P. (2012) "Dynamic capabilities and sustainable supply chain management",
International Journal of Physical Distribution & Logistics Management, Vol. 42 Iss: 4, pp. 372 - 387.
Bozarth, C., and Chapman, S. (1996). “A contingency view of time-based competition for manufacturers”, International Journal of Operations & Production Management, Vol. 16 Iss: 6 pp. 56 - 67.
Caniato, F., et al. (2011) “Environmental sustainability in fashion supply chains: An exploratory case based research”, International Journal of Production Economics. Carter, C.R., and Easton, P.L. (2011), "Sustainable supply chain management: evolution and
future directions", International Journal of Physical Distribution & Logistics Management, Vol. 41 Iss: 1 pp. 46 - 62.
Carter, C.R., and Rogers, D.S. (2008), “A framework of sustainable supply chain management: moving toward new theory”, International Journal of Physical Distribution & Logistics Management, Vol.38 No.5, pp. 360-387.
Clarkson, M. (1995) “A stakeholder framework for analyzing and evaluating corporate social performance”, Academy of Management Review 20: pp.92-117.
DiMaggio, P.J., and Powell, W.W. (1983), ‘‘The Iron Cage Revisited: Institutional Isomorphism and Collective Rationality.’’, American Sociological Review 48(2), pp. 147–60.
Ellinger, E.A., (2000) "Improving marketing/logistics cross-functional collaboration in the supply chain", Industry Marketing Management, vol. 29, pp. 85-96.
Emmett, S., and Sood, V. (2010), “Green supply chain management: an action manifesto”, Wiley.
Evangelista, R., Perani, G., Rapiti, F., and Archibugi, D. (1997), “Nature and impact of innovation in manufacturing industry: Some evidence from the italian innovation survey”, Research Policy 26 (4–5) (12), pp. 521-536.
Fawcett, S.E., and Magnan, G.M. (2002), "The rhetoric and reality of supply chain integration", International Journal of Physical Distribution & Logistics Management, Vol. 32 Iss: 5 pp. 339 - 361.
Gilbert ,S. (2001), “Greening supply chain: enhancing competitiveness through green productivity”, Tapei, Taiwan, pp. 1–6.
Green, K., Morton, B., and New, S. (1996) “Purchasing and environmental management: interaction, policies and opportunities”, Business Strategy and the Environment 5, pp. 188– 197.
Hart, S.L. (1995), “A natural-resource-based view of the firm”, Academy of Management Review, Vol. 20 No. 4, pp. 986-1014.
Hau L. Lee, (2004), “The triple-A supply chain”, Harvard Business Review.
Hervani, A.A., Helms, M.M., and Sarkis, J. (2005), “Performance measurement for green supply chain management”, Benchmarking: An International Journal 12 (4), pp. 330–353.
Hofmann, P., and Reiner, G. (2006), “Drivers for improving supply chain performance: An empirical study”, International Journal of Integrated Supply Management 2 (3), p. 214–230.
Karjalainen, K., and Kemppainen, K. (2008), “The involvement of small- and medium-sized enterprises in public procurement: Impact of resource perceptions, electronic systems and enterprise size”, Journal of Purchasing and Supply Management 14 (4) (12), pp. 230-240.
Klassen, R.D., and Vachon, S. (2003), “Collaboration and evaluation in the supply chain: the impact on plant-level environmental investment”, Production and Operations Management 12 (3), pp. 336–352.
La Londe, B.J., and Masters, J.M. (1994), "Emerging Logistics Strategies: Blueprints for the Next Century", International Journal of Physical Distribution & Logistics Management, Vol. 24 Iss: 7 pp. 35-47.
Mentzer, J.T., DeWitt, W., Keebler, J.S., Min, S., Nix, N.W., Smith, C.D., and Zacharia, Z.G. (2001). “Defining supply chain management”, Journal of Business Logistics, 22(2), pp. 1-25.
Meqdadi, O., Johnsen, T., Johnsen, R., Sauvage, T., and Miemczyk, J. (2011) “Improving sustainability performance in the supply chain: drivers and barriers to engaging SME suppliers”, 18th European Operations Management Association, University of Cambridge.
Meyer, J.W., and Rowan, B. (1977), ‘‘Institutionalized Organizations: Formal Structure as Myth and Ceremony.’’, American Journal of Sociology 83(2), pp. 340–63.
Micheli ,G.J.L., Cagno, E., Zorzini, M., Sarkis J., and Perotti S., (2011) “Green Supply Chain Management in Italy: Pressures, Practices and Performance”, European Operations Management Association (EurOMA) Conference, Cambridge, UK, July 2011, pp. 1-8, p 38 in the Book of Abstracts.
Moyer, M., and Storrs, C. (2010), “How much is left? The limits of the earth’s resources”, Scientific American Magazine, september 2010 issue.
Narasimhan, R., Mahapatra, S., and Arlbjørn, J. (2008), “Impact of relational norms, supplier development and trust on supplier performance”, Operations Management Research 1 (1), pp. 24–30.
New, S., Green, K., and Morton, B. (2000) “Buying the environment: the multiple meanings of green supply”, In: Fineman, S. (Ed.), The Business of Greening. Routledge, London, pp. 33–53.
Palevich, R. (2012), “The lean and sustainable supply chain: how to create a green infrastructure with lean technologies”, Financial Times Prentice Hall.
Phillips, R.R., and Freeman, E. (2003), “Stakeholder Theory and Organizational Ethics”, Berrett-Koehler Publishers.
Rahman Abdul Rahim, A., and Shariff Nabi Baksh, M. (2003), “The need for a n e w p ro d u c t development framework for engineer-to-order products”, European Journal of Innovation Management, Vol. 6 Iss: 3 pp. 182 - 196.
Rao, P. (2002), “Greening the supply chain: a new initiative in South East Asia”, International Journal of Operations & Production Management, Vol. 22 No. 6, pp. 632-655.
Sarkis, J., Gonzalez-Torre, P., and Adenso-Diaz, B. (2010), “Stakeholder pressure and the adoption of environmental practices: the mediating effect of training”, Journal of Operations Management 28 (2), pp. 163-176.
Schmenner, R.W., and Swink, M.L. (1998) “On theory in operations management”, Journal of Operations Management 17 (1), p. 97–113.
Seuring, S. (2009), “The product-relationship-matrix as framework for strategic supply chain design based on operations theory” International Journal of Production Economics, 120(1), p. 221-232.
Seuring, S., and Müller, M. (2008), “From a literature review to a conceptual framework for sustainable supply chain management”, Journal of Cleaner Production, 16(15), pp. 1699-1710.
Sharfman, M. P., Shaft, T. M., and Anex JR., R. P. (2009), “The Road to Cooperative Supply- Chain Environmental Management: Trust and Uncertainty Among Pro-Active Firms”, Business Strategy and the Environment, 18, pp. 1-13.
Sousa, R., and Voss, C. A. (2008), “Contingency research in operations m a n a g e m e n t practices”, Journal of Operations Management, 26(6), pp. 697-713.
Srivastava, K.S. (2007), “Green supply chain management: a state-of-the-art literature review”, International Journal of Management Reviews, 9(1), pp. 53–80.
Sterlacchini, A. (1999), “Do innovative activities matter to small firms in non R&D-intensive industries? an application to export performance”, Research Policy 28 (8) (11), pp. 819-832.
Suh, T., and Kwon, I. W. G. (2002), “The role of bilateral asset specificity and replaceability on trust in supply chain partner”, Working Paper, Boeing Institute of International Business, Saint Louis University.
Turnbull, P., Ford, P., and Cunningham, M. (1996), "Interaction, relationships and networks in business markets: an evolving perspective", Journal of B u s i n e s s & I n d u s t r i a l Marketing, Vol. 11 Iss: 3 pp. 44 - 62.
Vachon, S., and Mao, Z. (2008), “Linking supply chain strength to sustainable development: a country-level analysis”, Journal of Cleaner Production 16 (15), pp.1552–1560.
Wadhwa, S., and Rao, K.S. (2003), “Flexibility and agility for enterprise synchronization: knowledge and innovation management towards flexagility”, Studies in information and control 12, pp. 111-128.
Walker, H., Di Sisto, L., and McBain, D. (2008), “Drivers and barriers to environmental supply chain management practices: Lessons from the public and private sectors”, Journal of Purchasing and Supply Management, 14(1), pp. 69-85.
Zhu, Q., and Sarkis, J. (2004), “Relationships between operational practices and performance among early adopters of green supply chain management p r a c t i c e s i n chinese manufacturing enterprises”, Journal of Operations Management, 22(3), pp. 265-289.
Zhu, Q., Sarkis, J. and Geng, Y. (2005), “Green Supply Chain Management in China: Pressures, practices and performance”, International Journal of Operations and Production Management, Vol. 25, No. 5, pp. 449-468.
Zhu, Q., and Sarkis, J. (2006), “An inter-sectoral comparison of green supply chain management in China: drivers and practices”, Journal of Cleaner Production 14 (5), pp. 472-486.
Zhu, Q., and Geng, Y., (2010), “Drivers and barriers of extended supply chain practices for energy saving and emission reduction among chinese manufacturers”. Journal of Cleaner Production.
Zhu, Q., Geng, Y., Sarkis, J., and Lai, K. (2011), “Evaluating green supply chain management among Chinese manufacturers from the ecological modernization perspective”, Transportation Research Part E: Logistics and Transportation Review, Volume 47, Issue 6, pp. 808-821.
Zirpoli, F., and Caputo, M. (2002), "The nature of buyer-supplier relationships in co-design activities: The Italian auto industry case", International Journal of Operations & Production Management, Vol. 22 Iss: 12 pp. 1389-1410.
Zsidisin, G.A., and Siferd S.P. (2001), “Environmental purchasing: a framework for theory development”, European Journal of Purchasing and Supply Management, 7(1), pp. 61-73.