- UNIVERSITA’ DEGLI STUDI DI PISA -
FACOLTA’ DI MEDICINA E CHIRURGIA
DOTTORATO DI RICERCA IN SCIENZE ENDOCRINE E METABOLICHE DIRETTORE: PROF. P. VITTI
TESI DI DOTTORATO (SSD:MED/13)
Sleep disturbances, daytime sleepiness and quality of life in
adults with growth hormone deficiency
Relatori
Prof. Enio Martino
Prof. Eve Van Cauter
Candidato
Dr.ssa Lisa Linda Morselli
Table of Contents
ABSTRACT... 4
INTRODUCTION ... 6
Growth hormone deficiency ... 6
Clinical picture... 7
Diagnosis... 8
Quality of life in adult GHD patients... 9
Sleep... 11
Neurophysiological basis of sleep ... 13
Power spectral analysis of the EEG ... 13
Relationships between the somatotropic axis and sleep ... 14
GH secretion and sleep ... 14
Circadian influences... 20
Molecular and neural mechanisms underlying the relationship between GH release and sleep... 21
Exogenous GH and sleep... 27
Sleep in GHD patients ... 28
AIM OF THE STUDY... 30
SUBJECTS AND METHODS ... 31
Patients... 31 Diagnosis of GHD... 31 Exclusion criteria ... 32 Patients characteristics ... 32 Controls... 37 Experimental protocol... 37
Objective sleep analysis... 41
Statistical analysis... 42
RESULTS ... 44
Study A ... 44
Objective sleep quality... 45
Subjective sleep quality and daytime sleepiness ... 48
Quality of Life... 49
Impact of etiology of GHD on objective sleep variables, subjective sleep quality and quality of life... 51
Study B... 53
Impact of rhGH treatment on anthropometric measures... 53
Objective sleep quality... 54
Subjective sleep quality and daytime sleepiness ... 59
Quality of life... 60
DISCUSSION ... 61
CONCLUSION... 68
ACKNOWLEDGMENTS ... 69
Appendix A: Quality of life Assessment of Growth Hormone Deficiency in Adults (QoL-AGHDA)... 89 Appendix B: Pittsburgh Sleep Quality Index questionnaire ... 92 Appendix C: Karolinska Sleep Log ... 93
ABSTRACT
Low energy and fatigue are frequent complaints in subjects with GH deficiency (GHD). Since interrelations between sleep and GH regulation are well documented, these complaints could partly reflect alterations of sleep quality. Therefore we sought to determine objective and subjective sleep quality and daytime sleepiness in adult GHD patients compared to age, gender and BMI-matched controls, and in a subset of these GHD patients undergoing recombinant human GH (rhGH) therapy compared to placebo.
Thirty patients, aged 19-74 yr, with untreated GHD (primary pituitary defects confirmed or likely in 26 patients, hypothalamic origin in 4 patients), and 30 healthy controls individually matched for gender, age and body mass index were enrolled in the study. Patients with associated pituitary hormonal deficiencies were on appropriate replacement therapy. Polygraphic sleep recordings were performed at baseline and after 4 months on recombinant human GH or placebo. Subjective sleep quality and quality of life were evaluated by means of the Pittsburgh Sleep Quality Index (PSQI) and Quality of Life-Assessment for GHD in Adults (QoL-AGHDA). Irrespective of etiology, GHD patients had a PSQI score above the clinical cut-off for poor sleep and lower QoL-AGHDA scores than controls, with tiredness being the most affected domain. Patients with pituitary GHD spent more time in slow-wave sleep (SWS) and had a higher intensity of SWS than their controls. Amongst these patients, older individuals obtained less total sleep than controls and their late sleep was more fragmented. Contrasting with pituitary GHD,
the 4 patients with hypothalamic GHD had lower intensity of SWS than their controls. Thirteen patients were reevaluated after 4 months rhGH and 4 months placebo. Compared to placebo, SWS duration was decreased in younger patients after rhGH, and a trend for a decrease in SWS intensity was observed in the whole group. PSQI scores decreased, while QoL ratings improved. In conclusion, GHD is associated with sleep disorders that may be caused by specific hormonal alterations, as well as with poor subjective sleep quality and daytime sleepiness. Disturbed sleep is likely to be partly responsible for increased tiredness, a major component of QoL in GHD. Partial reversal of the sleep alterations was observed after 4 months of rhGH treatment, which was paralleled by an improvement in QoL and reports of tiredness, as well as subjective sleep quality.
INTRODUCTION
Growth hormone deficiency
Growth hormone (GH) is secreted by the pituitary somatotrophs under the stimulatory influence of hypothalamic GH-releasing hormone (GHRH). Acylated ghrelin, a peptide produced mainly by the stomach, is another potent endogenous GH secretagogue, but its contribution to the control of spontaneous GH secretion under physiological conditions has not been fully clarified yet 1-3. GH secretion is inhibited by somatostatin, and by negative feedback from IGF-I and GH itself. Recently, the orexin/hypocretin system, initially identified as a regulator of food intake, and subsequently as a key modulator of the sleep-wake cycle, was also implicated in the control of the somatotropic system 4-5. Finally, GH secretion is influenced by a variety of other metabolic, neural and hormonal factors (reviewed in 5). GH exerts a broad spectrum of effects, either directly or via the stimulation of the release of insulin-like growth factor-I (IGF-I) from the liver. These effects include the promotion of linear growth in children, and the regulation of carbohydrate, protein, lipid, and mineral metabolism throughout the lifetime.
Adult GH deficiency (aGHD) was recognized as a distinct syndrome in the late 1980s 6-8. While childhood-onset GHD is more frequently due to genetic causes or idiopathic, aGHD is usually a consequence of a pituitary or sellar insult (pituitary adenoma, craniopharyngioma, neurosarcoidosis) or their treatment (surgery, radiation therapy). Other, less frequent but increasingly recognized, causes of aGHD are traumatic brain injury, empty sella syndrome, and lymphocytic
hypophysitis. At variance with childhood-onset cases, in adults, GHD, because of its etiology, is frequently associated to other pituitary hormone deficiencies, while it is more frequently isolated in children 9-11
Clinical picture
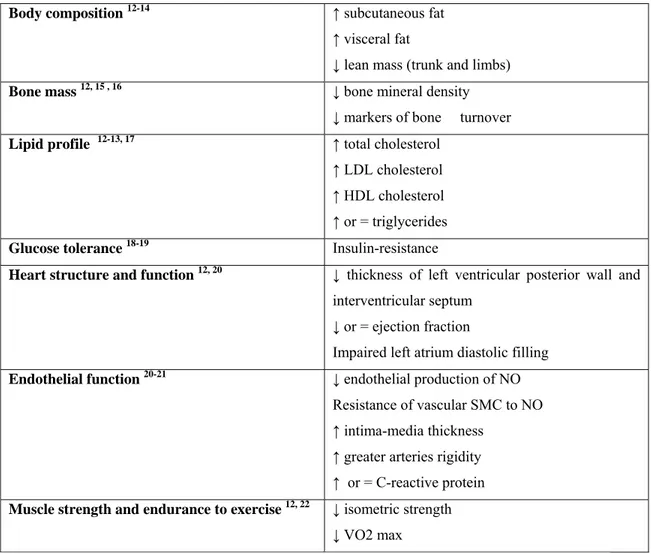
From a clinical point of view, adults with GHD present with alterations of:
Table 1: Clinical picture of the adult GH deficiency syndrome (NO nitric oxide, SMC smooth muscle
cells, VO2max aerobic capacity).
Body composition 12-14 ↑ subcutaneous fat
↑ visceral fat
↓ lean mass (trunk and limbs)
Bone mass 12, 15 , 16 ↓ bone mineral density
↓ markers of bone turnover
Lipid profile 12-13, 17 ↑ total cholesterol
↑ LDL cholesterol ↑ HDL cholesterol ↑ or = triglycerides
Glucose tolerance 18-19 Insulin-resistance
Heart structure and function 12, 20 ↓ thickness of left ventricular posterior wall and
interventricular septum ↓ or = ejection fraction
Impaired left atrium diastolic filling
Endothelial function 20-21 ↓ endothelial production of NO
Resistance of vascular SMC to NO ↑ intima-media thickness
↑ greater arteries rigidity ↑ or = C-reactive protein
Muscle strength and endurance to exercise 12, 22 ↓ isometric strength
Diagnosis
The diagnosis of GHD is based on the clinical history, clinical picture and provocative tests of somatotropic function 23-24. The gold standard is the insulin tolerance test (ITT) which investigates the integrity of the hypothalamic-pituitary axis. The glucagon test relies on a similar mechanism. Other tests, such as the combined GHRH+arginine test or the GHRH+growth hormone releasing peptide test, are based on the administration of compounds that maximally stimulate the GH secretory reserve of the pituitary. The ITT can be contraindicated in patients with ischemic heart disease, seizures and elderly. In adults, one provocative test is usually sufficient to establish the presence of GHD. The cut-off for the diagnosis of GHD varies with the test used. For the ITT the validated cut-off for GHD in adults is a peak GH response of <3 mg/l 25. The following cut-off levels have been validated for GHRH+arginine: for those with a body mass index (BMI) <25 kg/m2, a peak GH <11 mg/l; for BMI between 25 and 30 kg/m2, a peak GH<8 mg/l; and for BMI >30 kg/m2, a peak GH<4 mg/l 26. Of note, the latest clinical practice guidelines published by the Endocrine Society 27 report the results of a study comparing 6 different provocative tests for the diagnosis of adult GHD, in which the cut-off for peak GH response to GHRH+arginine with highest sensitivity (95%) and specificity (91%) was found to be 4.1 mg/l 28.
IGF-I is also an indicator of GH status; however, in adults, normal levels do not rule out GHD since only approximately 50% of middle-aged adults with severe GHD defined by GH tests have a pathologically low IGF-I level (below –2 SDS). IGF-I measurement, however, was proven to be a more sensitive marker of severe GHD in
young adults compared with middle-aged adults, being especially sensitive in young adults with childhood onset GHD 29. Attention must be paid to other factors that can influence IGF-I levels, such as obesity, malnutrition, hepatic diseases, hypothyroidism. In the appropriate clinical context, very low IGF-I levels are nevertheless considered indicative of severe GHD and do not require further investigation with provocative testing 23.
Quality of life in adult GHD patients
As more and more patients were evaluated, another significant aspect of the syndrome emerged: aGHD patients frequently complained of reduced quality of life (QoL), the most consistent complaints being related to energy levels, vitality, mental fatigue and emotional reactions, as well as social isolation, anxiety, reduced self-confidence, dissatisfaction with body image and poor memory 30. In 1999 a specific questionnaire was developed, based on interviews with patients from 5 different European countries (United Kingdom, Germany, Italy, Spain, Sweden). The interviews investigated the following topics: work, household chores, sleep, hobbies, leisure time pursuits, family life, intimate relationships, sex, memory and concentration, mood, energy, body image, self confidence and self-esteem, social activities, friendships, expectations and hopes. Twenty-five statements were selected that best described issues experienced by patients. The possible answers were yes or no, and scores ranged from 0 (best) to 25 (worst) 31. This questionnaire, called “Quality of Life Assessment of Growth Hormone Deficiency in Adults” (QoL-AGHDA) was validated against previously available, generic, quality of life
questionnaires, and in several languages, and subsequently used in several clinical studies evaluating the effect of recombinant human GH (rhGH) treatment. Murray et al. 32 studied 65 patients with aGHD at baseline, and after 3 and 8 months of rhGH treatment, and reported a significant improvement of QoL scores during treatment, particularly in males. A significant correlation was demonstrated between the impairment of QoL at baseline and its improvement during rhGH therapy. Similar results were obtained by other authors in patients on rhGH for up to 8 years 33-38; most authors observed a greater improvement in the first year of follow-up, but the improvement was sustained in the following years. Koltowska-Haggstrom et al. 37, using data from the KIMS database, reported that QoL scores, after long-term rhGH treatment, approximated those of the general population, in 4 different European countries. Normalization of QoL as determined by using the QoL-AGHDA questionnaire was also observed by the same group in German patients after 12 months treatment 38. Conversely, Malik et al.39 compared QoL scores of 89 aGHD patients on rhGH treatment for an average of 3 years with those obtained from 83 age- and gender-matched healthy control subjects from the general population, and reported significantly higher scores in patients despite therapy. These conflicting results could be linked to the different duration of follow-up, etiology of GHD, and scores obtained in the general population 37. There also appears to be a chronology in the improvement of the different dimensions explored by the questionnaire, the least affected (socializing issues) improving earlier than the most affected (tiredness, memory and concentration) 37. Maiter et al. 40 looked at the impact of previous radiation therapy and found that the
improvement in QoL scores was similar in irradiated and non-irradiated aGHD patients.
Sleep
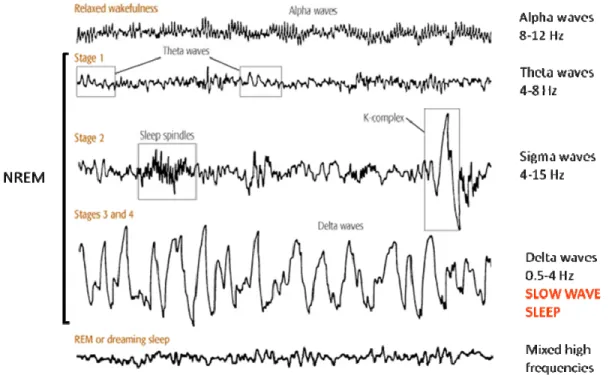
Sleep is divided into two distinct states of brain activity which are defined based on the appearance of specific features in the electroencephalogram (EEG), the electrooculogram and the electromyogram: rapid eye movement (REM) sleep, characterized by mixed low-amplitude high frequency EEG activity, muscle atonia and rapid eye movements, and non-REM (NREM) sleep. During the deeper stages of NREM sleep, EEG frequency becomes progressively slower and well-defined high amplitude slow waves appear (Fig. 1).
Fig. 1: brain waves recorded by EEG during relaxed wakefulness and sleep.
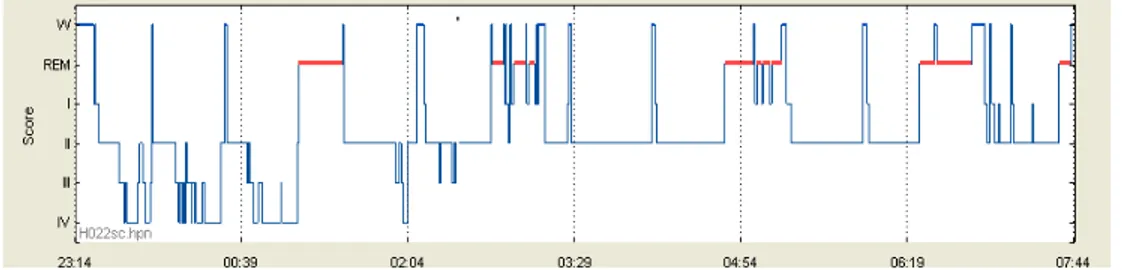
NREM sleep and REM sleep alternate cyclically, with a periodicity of about 90 minutes, and a typical night comprises 4 to 6 of such NREM-REM cycles (Fig. 2).
NREM sleep is more prevalent in the first half the night, while REM sleep episodes are more represented in the second half. NREM sleep is subdivided into four stages: I, II, III, IV; stages III and IV are also called slow-wave sleep (SWS) because of the prevalence of low frequency, high-amplitude “delta” waves 41. In young people, SWS represents about 20% of sleep duration, stages I and II about 50% and REM about 25%. Older individuals display an increased number and duration of awakenings and decreased amounts of SWS, while REM sleep appears to be relatively preserved 42.
Fig. 2: Hypnogram of a typical night recorded in a young subject.
The timing, duration and quality of sleep during any given 24-hour period ultimately results from the activity of two interacting time-keeping mechanisms in the central nervous system: endogenous circadian rhythmicity and sleep-wake homeostasis; the former is generated by a feedback loop of gene transcription/translation in the suprachiasmatic nuclei of the hypothalamus that results in a self-sustained near 24-hour oscillation, while the latter relates the timing and intensity of sleep to the duration of prior wakefulness 43-45.
Neurophysiological basis of sleep
From a neurophysiological point of view, normal waking is associated with neuronal activity in several chemically defined ascending arousal systems, including monoaminergic neurons in the brainstem and posterior hypothalamus, cholinergic neurons in the brainstem and basal forebrain, and hypocretin (orexin) neurons in the lateral hypothalamus. The activity of these neuronal populations is reflected in the low-voltage fast-frequency EEG pattern of wakefulness, and declines rapidly at sleep onset 46. Non-rapid eye movement (NREM) sleep is generated by neurons located in the preoptic region of the hypothalamus and adjacent basal forebrain. These so-called “sleep-active neurons” have been shown to be gamma-aminobutyric acid (GABA)-ergic neurons which have direct projections to the “wake-active” areas and most likely inhibit them by releasing GABA 47, resulting in a progressive slowing of EEG frequencies. When the firing activity of the sleep-active neurons is synchronized, delta (slow) waves, which are considered a marker of sleep depth, appear on the EEG. Finally, REM sleep is generated by the activation of neurons in the pons and adjacent portions of the midbrain 46-47.
Power spectral analysis of the EEG
Power spectral analysis, a methodology that describes how the power of a signal or time series is distributed across frequencies is used to further characterize sleep and gives information about the quality of sleep. It is based on the assumption that the EEG can be mathematically decomposed into an infinite number of pure sinusoidal
components, each of a different frequency, which when added together yield the original signal. Applying a Fast Fourier Transform to the EEG signal allows to obtain an approximation of these frequency components separately 48. The most investigated frequency band is the delta band (0.75-4 Hz), which reflects the low-frequency waves typically observed in SWS. Delta power is normally highest at the beginning of the sleep period and subsequently decreases throughout the night 44, 49. Delta power, also referred to as “slow-wave activity” (SWA), is considered as a marker of sleep pressure 43, 49-50 and is highly reproducible in the same individual 51-52, although it decreases with age 53. The other frequency bands are theta (4-7 Hz), alpha (7-12 Hz), sigma (12-15 Hz), beta (15-30 Hz) and gamma (>30 Hz). Sigma power is generated by the occurrence of sleep spindles, alpha power is a marker of the synchronization of cortical oscillations in high frequency ranges, and beta and gamma power reflect intra-sleep arousal.
Relationships between the somatotropic axis and sleep
GH secretion and sleep
In healthy young men, the major GH secretory episode occurs after sleep onset, and may account for as much as 70% of the total 24-hr GH secretion. Daytime GH levels are generally low, with few bursts of secretion that can be associated with post-prandial periods, exercise or stress 54-55. In contrast, in healthy young women, daytime pulses are more frequent and the sleep onset-associated surge, although consistently present, does not generally represent the majority of the 24-hr GH secretion 56-57 (Fig. 3).
Fig. 3: 24-hour plasma GH concentrations profiles in a healthy young male (left) and a healthy
young female (right) 56-57
Average 24-hour GH concentrations, as well as trough (interpulse) levels, are higher in women compared to men 58-60. Some authors have described an increase in pulse amplitude and mass secreted per burst 60-62 in women while others observed an increase in pulse frequency 59, 63. However, few studies have focused on gender differences in nighttime GH secretion; either a greater nocturnal GH production in men compared to age- and BMI-matched women 59, 62, or no difference in integrated GH concentrations 63 were reported. In the latter study women displayed a different secretory pattern, with a pre-sleep pulse and at least one more pulse during the night. The lower nocturnal GH release in women as compared to men could in fact be related to a higher GH secretory activity before sleep onset, reflecting a negative feedback inhibition of GH itself. The sexual dimorphism in the pattern of GH secretion is thought to be related to sex differences in GHRHergic 60, 64-66, somatostatinergic 59-60, 67 and/or ghrelinergic 68 tone; however, no consensus has been reached so far. A role for sex steroids in the feedback mechanisms controlling
GH secretion at the pituitary level has also been hypothesized 59, 69-70. To our knowledge only one study 65 looked into the mechanisms underlying sex differences in nocturnal GH secretion and the results suggest a lower endogenous GHRH tone in women.
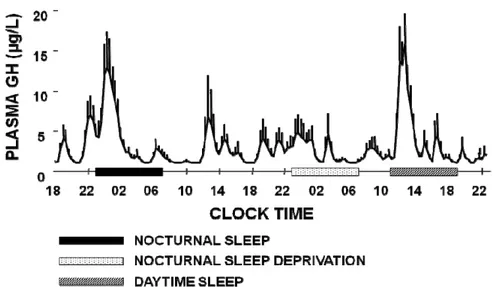
Fig. 4: Plasma GH profile during normal nocturnal sleep, sleep deprivation and daytime recovery
sleep 71
The sleep-onset-associated GH surge is mostly maintained and in subjects living in free-running conditions, i.e. without any time cues 72, as well as in subjects exposed to a 3-hour sleep-wake cycle for 10 days 73. Similarly, night shift workers exhibit a GH secretory peak in the first half of their daytime sleep period 74. These results were confirmed by delaying sleep by 8 or 12 hours in young, healthy, day-active men 74-75 (Fig. 4).
Conversely, awakenings interrupting sleep appear to interrupt GH release. Indeed, two independent studies have found that the GH response to GHRH administration is inhibited when sleep is interrupted, either spontaneously or experimentally 76-77. This inhibition of GHRH-stimulated GH release by awakening could be linked to a
concomitant pulse in cortisol secretion, which occurs consistently during full nighttime awakenings, as CRH administration has been shown to inhibit the GH response to GHRH 76.
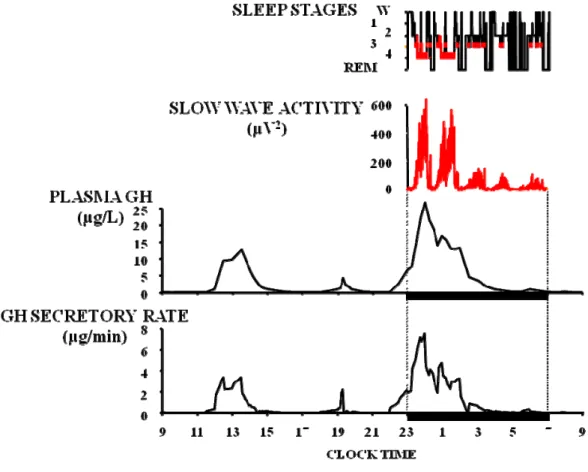
More in particular, sleep-onset GH release appears consistently associated with SWS. The temporal coincidence between the onset of SWS and increasing concentrations of GH was already noted in the late 1960s 55, 78-79. A remarkable study published in 1991 showed that, when plasma GH levels are sampled at very frequent intervals (30 seconds), the release of GH immediately follows the appearance of delta waves in the EEG 80. Subsequently, a direct and robust correlation between the amount of GH secreted and the duration of SWS episodes was reported 81, as well as between pulses of GH secretion and “pulses” of SWA 82. The latter relationship is best evidenced when GH secretory rates are estimated by mathematical deconvolution of GH concentrations, as illustrated in Fig. 5. Indeed, a close temporal concomitance between GH secretory pulses and peaks of SWA becomes apparent.
Fig. 5: temporal concomitance between GH secretory pulses and peaks of SWA in a young healthy
subject (unpublished data).
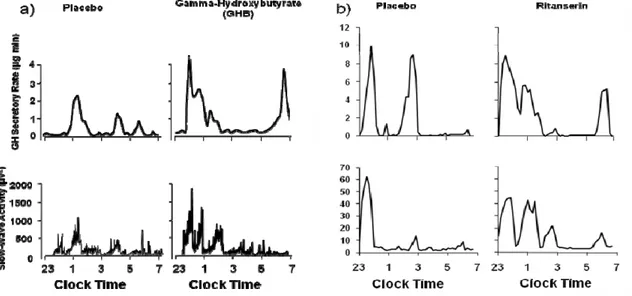
Pharmacological interventions that increase SWS and SWA also increase GH release, thus demonstrating the existence of common underlying mechanisms. Figure 6 illustrates the findings from two separate placebo-controlled studies which involved administration of a drug enhancing SWS/SWA at bedtime ( a) gamma-hydroxybutyrate, b) ritanserin). In both studies, GH secretory pulses were coincident with peaks of SWA in the majority of the subjects, both in the placebo and in the active drug conditions 82-83. Further, in both studies, there were significant correlations between the increase in SWS/SWA and the increase in GH release. The findings are consistent in indicating that the drug-induced increase in
SWA is associated with increased GH release, even though these two drugs have very different mechanisms of action.
Fig. 6: profiles of SWA and GH secretory rate under placebo and a) gamma-hydroxybutyrate, b)
ritanserin (adapted from 82-83). The differences in the SWA scale between the 2 studies are due to
different amplifier settings.
Lastly, GH release is observed more frequently during daytime naps when they occur in the afternoon, a time when SWS propensity is higher, than when they occur in the early part of the day 84-85.
Despite the strong evidence for a link between SWS regulation and nocturnal GH release, several authors have reported significant elevations of GH levels prior to sleep onset or during other stages of sleep 86-88 in men as well as in women. Such pre-sleep GH pulses could reflect the presence of a sleep debt 71 and/or a circadian effect (see below). Dissociations between SWS and nocturnal GH release have also
sleep-onset GH pulse 89. In another study, in which nocturnal GH secretion was correlated to EEG delta power, about 50% of the subjects displayed increased GH secretion before sleep onset or in absence of concomitant delta activity 88. As discussed below, the association between GH release and SWS appears to be primarily mediated by GHRH. However, because GH secretion is also under the control of multiple negatve regulatory mechanisms, occasional dissociations between pulses of GH levels and SWS are not unexpected.
Circadian influences
Although GH secretion is consistently stimulated by sleep onset and SWS, it is also under the influence of circadian rhythmicity, as demonstrated by several studies in which the sleep-wake cycle was manipulated: a higher propensity for GH secretion was observed when sleep occurred in the afternoon and evening 73-74, 81, 90. However, careful experiments conducted in a “forced desynchrony protocol” where subjects lived on a 28-hr sleep-wake and light-dark cycle (9h20:18h40 dark:light) only revealed a minimal non-significant circadian modulation of SWA 91.
The higher propensity for GH secretion in the late evening and early night could also be related to the circadian nocturnal decline in somatostatin secretion. In rats, a circadian rhythm of somatostatin has been observed, with higher levels during the dark (active) phase compared to the light (inactive) phase 92 and a similar trend was inferred for humans. However, peripheral somatostatin levels are difficult to measure in humans and may not reflect somatostatin concentrations in the hypophysial portal blood. The role of this peptide in the generation of GH pulses in
humans is suggested by experiments showing the persistence of GH pulses during continuous GHRH infusion 93; furthermore, repeated boluses of GHRH produced a greater GH response to GHRH starting from the late afternoon hours, suggesting a decline in somatostatin action before habitual bedtime 94. However the same group later reported the persistence of daytime and nighttime GH pulses during continuous octreotide infusion 95-96, and argued that a decline in somatostatin levels is not the initiating event of GH pulses. Nevertheless, these findings do not exclude the possibility of a declining somatostatinergic tone at the time of GH pulses, since the amplitude of the GH increments was lower under octreotide infusion 96.
Molecular and neural mechanisms underlying the relationship between GH release and sleep
Rodent and human studies have identified GHRH as the primary factor underlying sleep-associated GH secretion.
In rats, hypothalamic GHRH mRNA expression exhibits a circadian rhythm with maximum levels at the onset of the light period (i.e. the sleep period), followed by a progressive decrease to reach a nadir at the beginning of the dark (i.e. active) period 97. An opposite pattern was described for hypothalamic GHRH protein content 98. Injection of GHRH in rodents, either intracerebroventricularly (i.c.v.), into the medial preoptic area or intravenously, increases the duration of SWS 99-101. Consistent with these observations, administration of a GHRH receptor antagonist or of anti-GHRH antibodies decreases NREM sleep 102-103. Furthermore, mice and rats with nonfunctional GHRH receptor (lit/lit mice and dw/dw rats) have lower
amounts of spontaneous NREM sleep than wild types 104-105. Conversely, spontaneous dwarf rats, characterized by GH deficiency due to a mutation of the GH gene, have a longer duration of spontaneous NREM sleep, as well as a higher hypothalamic GHRH mRNA content compared to control rats 106, consistent with increased central GHRH tone due to the absence of feedback inhibition of GH. The majority of GHRH-producing neurons are located in the arcuate nucleus of the hypothalamus but another, smaller, GHRHergic neuronal population is present in the ventromedial nucleus and in the parvicellular portion of the paraventricular nucleus. These neurons have been shown to project to the anterior hypothalamus/preoptic area, and in particular to the ventrolateral preoptic (VLPO) nucleus, which is very active during SWS 57, 107. Recently, Peterfi et al. 108 evaluated the effect of i.c.v. GHRH, octreotide or GHRH antagonist administration, on sleep patterns and activation of sleep-active neurons in the hypothalamus in male rats. GHRH given at the beginning of the dark period, i.e. the active period, increased the duration of NREM sleep and SWA; immunohistochemistry staining of hypothalamic sections showed an increased activation of GABAergic neurons (Fos+GAD-positive cells) in the VLPO and in the median preoptic nucleus (MnPN), which is consistent with the sleep-related activity of these areas. Similar immunohistochemistry results were observed when the animals underwent sleep deprivation. Conversely, octreotide and the GHRH antagonist injected i.c.v. at the beginning of the light phase (i.e. the resting period), decreased the duration of NREM sleep and SWA, as well as the number of Fos+GAD-positive cells. These
data provide functional and anatomical evidence for a role of GHRH in the regulation of NREM sleep.
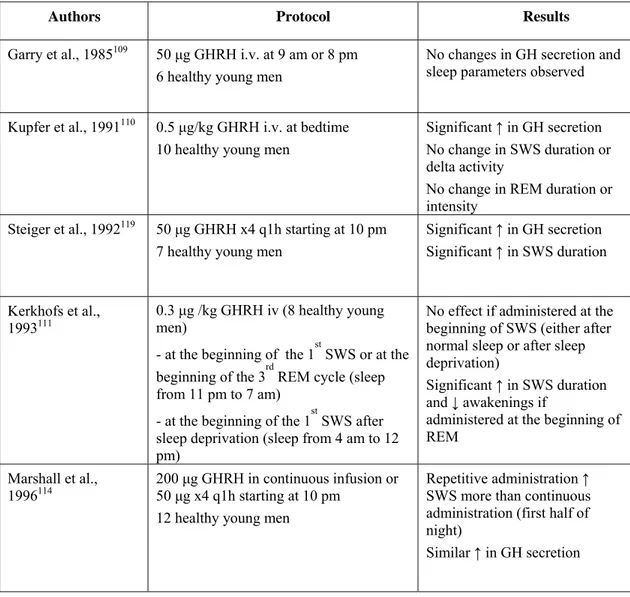
Results of studies performed in humans are summarized in Table 2. The first study in which GHRH was administered to human subjects involved an i.v. injection in the morning or in the evening, one hour prior to bedtime; no change in sleep parameters was reported 109. Another group administered a single dose of GHRH to healthy male volunteers at sleep onset and did not observe any change in sleep architecture 110. In these 2 experiments, GH levels increased in response to GHRH administration. Several subsequent studies in humans have shown that single intravenous boluses of GHRH produce an increase in both GH and SWS or SWA. In one study the stimulation of SWS became apparent only at a time when the physiological propensity for SWS was low, i.e. in the second half of the night 111. Other authors did observe an increase in SWS after a single bolus of GHRH, however the dose administered was higher than in the latter report 112. In a few studies, GHRH was injected in a repetitive fashion starting before sleep onset, and a stimulatory effect of GHRH on SWS was observed in men 112-114, but not in women in whom GHRH had instead sleep-impairing effects consisting in a decrease of stage IV sleep and of REM sleep during the first half of the night 115-116. One group evaluated the effect of intranasal administration of GHRH, as little is known about the ability of GHRH to cross the blood-brain barrier, and the intranasal route bypasses the blood-brain barrier; an increase in SWS duration was observed as well, which was significant over the second half of the night, again at a time of lower SWS propensity. Surprisingly, GH concentrations were decreased after GHRH, an
effect that the authors attribute to direct GHRH action on the CNS 117. Contrasting with the evidence in support of a role of GHRH in both SWS and GH stimulation, a study in healthy young men showed that the blockade of endogenous GHRH receptors by continuous i.v. infusion of a selective GHRH antagonist had no effect on sleep parameters, and in particular on SWS, while it did suppress GH response to GHRH stimulation 118. However, it was not clear whether this GHRH antagonist could cross the blood-brain barrier.
Table 2: Human studies about the effect of exogenous GHRH on sleep.
Authors Protocol Results
Garry et al., 1985109 50 μg GHRH i.v. at 9 am or 8 pm
6 healthy young men
No changes in GH secretion and sleep parameters observed Kupfer et al., 1991110 0.5 μg/kg GHRH i.v. at bedtime
10 healthy young men
Significant ↑ in GH secretion No change in SWS duration or delta activity
No change in REM duration or intensity
Steiger et al., 1992119 50 μg GHRH x4 q1h starting at 10 pm
7 healthy young men
Significant ↑ in GH secretion Significant ↑ in SWS duration
Kerkhofs et al.,
1993111 0.3 μg /kg GHRH iv (8 healthy young men)
- at the beginning of the 1st SWS or at the beginning of the 3rd REM cycle (sleep from 11 pm to 7 am)
- at the beginning of the 1st SWS after sleep deprivation (sleep from 4 am to 12 pm)
No effect if administered at the beginning of SWS (either after normal sleep or after sleep deprivation)
Significant ↑ in SWS duration and ↓ awakenings if
administered at the beginning of REM
Marshall et al.,
1996114 200 μg GHRH in continuous infusion or 50 μg x4 q1h starting at 10 pm
12 healthy young men
Repetitive administration ↑ SWS more than continuous administration (first half of night)
Authors Protocol Results
Marshall et al.,
1999112 50 μg GHRH in i.v. bolus or
10 μg x4 q15 min starting at 10 pm 16 young and middle-aged healthy subjects
Trend for ↑ SWS after single bolus
No change in sleep parameters after repetitive administration ↑ in GH secretion (more after single bolus)
Perras et al., 1999117 300 μg GHRH intranasally before
bedtime
12 young healthy and 12 old healthy subjects
↑ SWS duration in the second half of the night
↓ GH secretion Jessup et al., 2004118 GHRH antagonist 33 μg/kg/hr 9 pm- 9am
+ GHRH 0.33 μg/kg at 7 am i.v. 11 healthy young men
↓ GH secretion (spontaneous nocturnal and after GHRH) No changes in sleep parameters Mathias et al.,2007
116
25 or 50 μg GHRH x4 q1h starting at 10 pm
8 healthy premenopausal women
↓ SWS with 50 μg GHRH x4 ↓ REM with 25 μg GHRH x4 (first half of night)
Ghrelin has been identified as a potent GH secretagogue based on the effects of exogenous administration. However, so far, studies attempting to evaluate the physiological relationship of endogenous ghrelin levels to spontaneous GH secretion have yielded inconsistent results 1, 120-125. A large body of evidence supports the notion that ghrelin acts on GH secretion at least in part via a stimulation of GHRH 126-129 and thus a positive interaction between central ghrelinergic activity and SWS/SWA should be expected. Additionally, ghrelin acts as a functional somatostatin antagonist at both the pituitary and the hypothalamic level 127, 130. Nevertheless, the interaction between ghrelin and sleep regulation is still poorly understood. Intracerebroventricular administration of ghrelin in rats was shown to increase arousal and food intake 131-133. However, systemic administration of ghrelin in mice had clear somnogenic effects, and ghrelin-KO mice display decreased NREM sleep, increased REM sleep and wakefulness 134. In humans,
systemic ghrelin administration at sleep onset was reported to promote SWS, as well as nocturnal GH secretion, in healthy young men 135. These findings were reproduced in 2 later studies in young and elderly men 136-137, but not young and elderly women 137-138. At the moment little is known about the molecular mechanisms underlying the modulatory effects of ghrelin on the sleep-wake cycle; the effects of systemic ghrelin could be mediated by the GHRH circuitry, while centrally administered ghrelin could act on different hypothalamic systems 139. The orexin/hypocretin system is another newly identified player in the complex mechanisms underlying the relationship between sleep and GH secretion. Orexins/hypocretins, produced by neurons in the lateral hypothalamic area, were originally thought to be regulators of food intake 140-141. However, it emerged from subsequent studies that these peptides were also involved in the modulation of the sleep-wake cycle 142-144 as an orexin deficiency is underlying most cases of animal and human narcolepsy 145. Orexins also appear to be participating in the control of all of the endocrine axes 4. In particular, orexinergic projections have been identified in the arcuate nucleus and the periventricular nucleus, where neuronal populations express orexin receptors 144. Interconnections between ghrelinergic and orexinergic neurons in the hypothalamus have also been reported 146. The somatotrophs express both orexin-A and the orexin-receptor 1 4. In rats, i.c.v. orexin-A administration was found to decrease both GH secretion and pulsatility, an effect thought to be due to either inhibition of GHRH tone and/or increasing somatostatinergic tone in the hypothalamus 4, 147-148. Although early reports suggested that spontaneous GH secretion might be blunted in narcoleptics, these
were either not case-control studies, or patients and controls were not matched for age and BMI. A recent study by Overeem et al. 149, in which patients and controls were carefully matched for age, gender, BMI and body fat, found that narcoleptic patients with CSF orexin deficiency are not GH deficient. Furthermore, the patients maintained a temporal relationship between GH release and SWS episodes, although the proportion of GH secreted during daytime was increased, as compared to controls. This altered circadian distribution of GH secretory events could be due to the lack of modulatory effect normally exerted by the orexin system on GHRH secretion during the daytime.
Exogenous GH and sleep
The impact of GH administration on sleep was evaluated in several animal studies: in mice, rats and cats, exogenous GH increases REM sleep duration 150-151.
In the first study performed in humans 152, human GH obtained from pituitary extracts was administered intramuscularly (i.m.) to healthy volunteers 15 minutes before bedtime. Compared to saline, 2 UI of hGH i.m. did not alter sleep parameters, while at higher doses (5 UI) a significant increase in REM duration and a significant reduction in SWS duration were observed. The same authors failed to reproduce these results in a later study, in which, however, hGH (2UI i.m.) was administered twice daily (8 am and 5 pm) for 3 days before sleep was recorded; the lack of impact of GH on sleep might be related to the time lapse between the last administration and bedtime 153. Kern et al. 154 administered rhGH (either 5 UI i.m. before bedtime or in continous i.v. infusion overnight, or 48 UI i.v. over 30 minutes
at bedtime) to healthy male volunteers: no changes in sleep parameters were observed.
Sleep in GHD patients
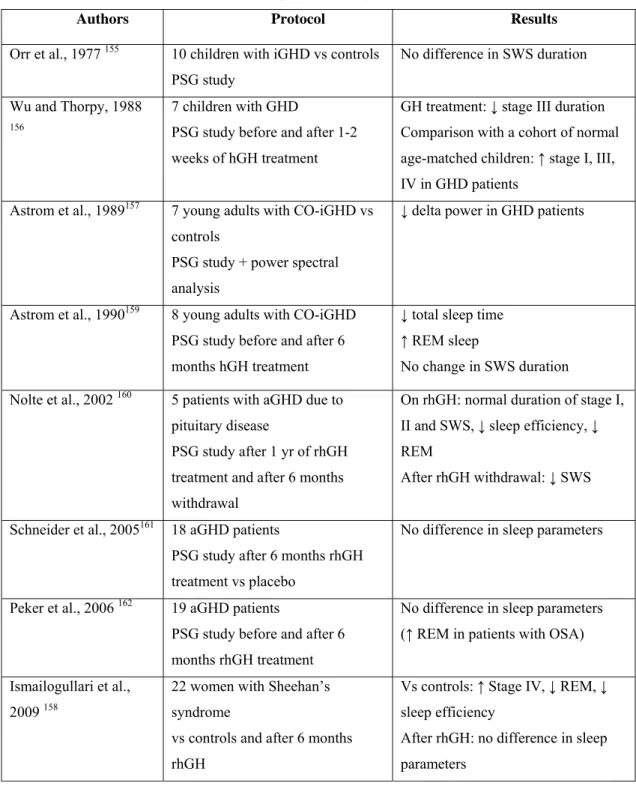
Very few studies have objectively characterized sleep in GHD patients and the results, summarized in Table 3, have been inconclusive. The first ones were carried out in children: Orr et al. evaluated 10 children with isolated GHD, who displayed similar sleep parameters as their age-matched controls, except for REM sleep that was significantly shorter in the younger age group 155. Wu and Thorpy observed an increase in stage 1 and SWS in children with isolated GHD compared to an age-matched control cohort taken from literature 156. One later study involved young adults with childhood-onset isolated GHD and a decrease in SWA was reported in the patients 157. Finally, a study on women with Sheehan’s syndrome showed an increase in SWS duration in the patients compared to controls matched for age, BMI and menopausal status 158.
Sleep characteristics in GH deficient patients have also been studied during GH replacement therapy. Wu and Thorpy observed a decreased duration of stage 3 in children with isolated GHD treated for 1 to 2 weeks 156. In adults, SWS duration was reported to be shorter after 6 months on rhGH in young adult patients with isolated GHD 159, increased in middle-aged patients with GHD of variable origin 160; or unchanged, compared to placebo 158, 161-162.
Table 3: studies evaluating sleep in GHD patients published in literature (CO childhood-onset,
aGHD adult GHD, iGHD isolated GHD, PSG polysomnography).
Authors Protocol Results
Orr et al., 1977 155 10 children with iGHD vs controls
PSG study
No difference in SWS duration Wu and Thorpy, 1988
156
7 children with GHD
PSG study before and after 1-2 weeks of hGH treatment
GH treatment: ↓ stage III duration Comparison with a cohort of normal age-matched children: ↑ stage I, III, IV in GHD patients
Astrom et al., 1989157 7 young adults with CO-iGHD vs
controls
PSG study + power spectral analysis
↓ delta power in GHD patients
Astrom et al., 1990159 8 young adults with CO-iGHD
PSG study before and after 6 months hGH treatment
↓ total sleep time ↑ REM sleep
No change in SWS duration Nolte et al., 2002 160 5 patients with aGHD due to
pituitary disease
PSG study after 1 yr of rhGH treatment and after 6 months withdrawal
On rhGH: normal duration of stage I, II and SWS, ↓ sleep efficiency, ↓ REM
After rhGH withdrawal: ↓ SWS Schneider et al., 2005161 18 aGHD patients
PSG study after 6 months rhGH treatment vs placebo
No difference in sleep parameters
Peker et al., 2006 162 19 aGHD patients
PSG study before and after 6 months rhGH treatment
No difference in sleep parameters (↑ REM in patients with OSA) Ismailogullari et al.,
2009 158
22 women with Sheehan’s syndrome
vs controls and after 6 months rhGH
Vs controls: ↑ Stage IV, ↓ REM, ↓ sleep efficiency
After rhGH: no difference in sleep parameters
AIM OF THE STUDY
Not a single study has assessed subjective sleep quality or daytime sleepiness in GHD as compared with normal controls. Furthermore, the studies looking at the impact of rhGH administration on sleep architecture and quality have yielded inconclusive results. The purpose of our study was therefore to:
1. characterize objective sleep quality, as well as subjective sleep quality, daytime sleepiness and QoL in a large cohort of untreated adult patients with GHD, individually matched for gender, age and body mass index (BMI) with control subjects.
2. assess the impact on sleep and subjective sleepiness of a 4-month period of rhGH treatment in aGHD patients, as compared to placebo, in a single-blind placebo-controlled design.
SUBJECTS AND METHODS
Patients
Thirty adults with GHD (26 males, 6 females), aged 45±18 years (19-74) and with a BMI of 27.4±1 kg/m2 were enrolled in the study. These patients were recruited in four centers:
a. Sleep, Chronobiology and Neuroendocrinology Research Laboratory, Department of Medicine University of Chicago, USA;
b. Department of Endocrinology and Centre d’Etude des Rythmes Biologiques, Université Libre de Bruxelles, Belgium;
c. Department of Endocrinology, Université de Liège, Belgium; d. Department of Endocrinology, Università di Pisa, Italy.
Diagnosis of GHD
The diagnosis of GHD was based on an intravenous insulin tolerance test or a GHRH+arginine test performed within the last 5 years, with a maximum GH response <3 ng/ml for ITT or according to BMI for GHRH+arginine (BMI <25 kg/m2, peak GH <11 mg/l; 25≤BMI<30 kg/m2, peak GH<8 mg/l; BMI ≥30 kg/m2, peak GH<4 mg/l 26). GHD was present for at least 1 year.
Exclusion criteria
Screening included a clinical examination and routine laboratory measurements. Patients with evidence of substance abuse, liver disease, renal insufficiency, heart failure, malignant disease, chronic infectious disease, neurological or psychiatric disease, clinically significant hyperprolactinemia, or diabetes requiring administration of insulin or sulfonylurea, were excluded from the study. Individuals employed as shift workers within the last 3 months and subjects having traveled across more than 2 time zones within the last 2 weeks were not included. All subjects were off hypnotic drugs for at least 3 months.
Patients characteristics
Six patients had childhood onset idiopathic GHD, while the remaining 24 patients had an adult onset GHD. The patients had either never received GH therapy or were off GH treatment for at least 6 months at the time of enrollment.
The individual diagnoses and additional pituitary hormone deficiencies, as well as treatment, are presented in Table 4.
In 12 of the 30 patients, the origin of the adult onset GHD was a primary pituitary defect without supra-pituitary involvement: surgical removal of a pituitary tumor without radiotherapy (10 patients); spontaneous necrosis of a pituitary tumor (1 patient); pituitary stalk section (1 patient). None of these patients presented with diabetes insipidus.
In 6 additional patients, the existence of primary pituitary lesions was confirmed but a supra-pituitary involvement could not be excluded: surgical removal of a pituitary
tumor with diabetes insipidus (2 patients); radiotherapy for a pituitary tumor (1 patient); surgical removal of a craniopharyngioma, without any adherence to the hypothalamus or the optic chiasm, with presence of diabetes insipidus (2 patients); spontaneous necrosis of a pituitary tumor with diabetes insipidus (1 patient). Both pituitary and hypothalamic lesions were possible in two other patients (1 neurosarcoidosis, 1 histiocytosis).
Consistent with known genetic causes for “idiopathic” pituitary deficiencies 163, a primary pituitary origin of GHD was considered very likely in the 6 patients with childhood-onset idiopathic GHD. A primary pituitary defect was excluded in the remainder 4 patients (referred to as “hypothalamic”): 1 brain tumor (surgery and radiotherapy, diabetes insipidus), 1 cerebral trunk thrombosis, 1 olfactory duct tumor (surgery), 1 pineal gland tumor (radiotherapy, diabetes insipidus). Based on these considerations, patients were divided into 3 categories according to the origin of the GH deficit:
- pure pituitary (n=18),
- pituitary with likely hypothalamic involvement (n=8), - hypothalamic (n=4).
Twenty-eight of the 30 patients had associated pituitary hormonal deficiencies and were on appropriate and stable replacement therapy, as assessed by at least two clinical and biological evaluations performed at intervals of at least 3 months. All 6 female patients were on estrogen (4 also on progesterone/progestagen) replacement therapy; 16 male patients with gonadal insufficiency were treated with testosterone (intramuscular injections of 200-250 mg every 2-3 weeks or transdermal
applications of 50 mg/day); 21 patients with thyroid insufficiency received oral L-thyroxine (50-250 μg/day); 24 patients with adrenal insufficiency received oral hydrocortisone (20-30 mg/day), or cortisone acetate (25-37.5 mg/day), averaging 12.0±0.7 mg/m2/day hydrocortisone or the
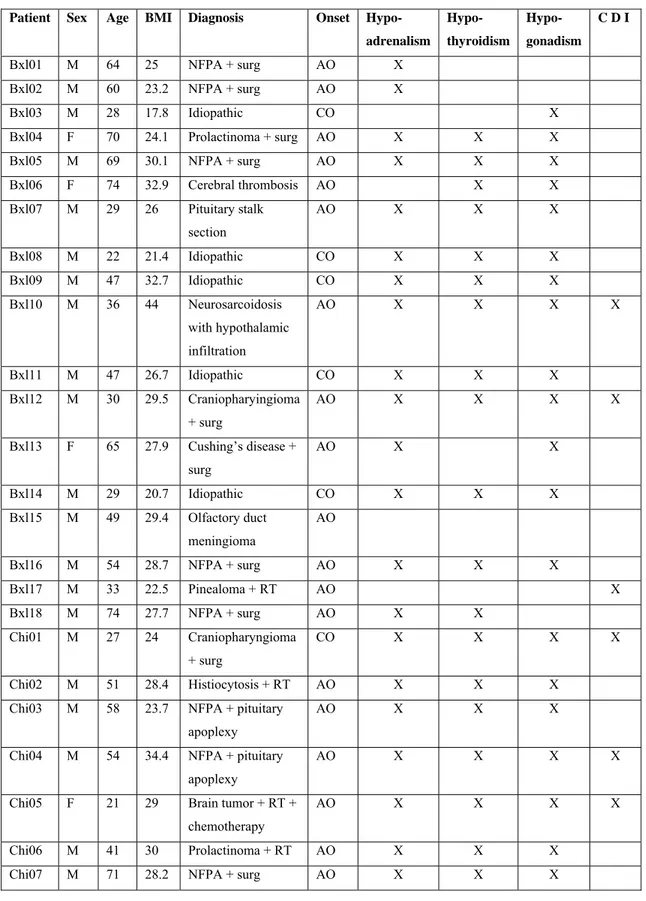
Table 4: Clinical characteristics of the patients (NFPA non functioning pituitary adenoma, surg
surgery, RT radiotherapy, AO adult-onset, CO childhood-onset, CDI central diabetes insipidus)
Patient Sex Age BMI Diagnosis Onset Hypo-
adrenalism Hypo- thyroidism Hypo- gonadism C D I Bxl01 M 64 25 NFPA + surg AO X Bxl02 M 60 23.2 NFPA + surg AO X Bxl03 M 28 17.8 Idiopathic CO X Bxl04 F 70 24.1 Prolactinoma + surg AO X X X Bxl05 M 69 30.1 NFPA + surg AO X X X Bxl06 F 74 32.9 Cerebral thrombosis AO X X Bxl07 M 29 26 Pituitary stalk section AO X X X Bxl08 M 22 21.4 Idiopathic CO X X X Bxl09 M 47 32.7 Idiopathic CO X X X Bxl10 M 36 44 Neurosarcoidosis with hypothalamic infiltration AO X X X X Bxl11 M 47 26.7 Idiopathic CO X X X Bxl12 M 30 29.5 Craniopharyingioma + surg AO X X X X Bxl13 F 65 27.9 Cushing’s disease + surg AO X X Bxl14 M 29 20.7 Idiopathic CO X X X Bxl15 M 49 29.4 Olfactory duct meningioma AO Bxl16 M 54 28.7 NFPA + surg AO X X X Bxl17 M 33 22.5 Pinealoma + RT AO X Bxl18 M 74 27.7 NFPA + surg AO X X Chi01 M 27 24 Craniopharyngioma + surg CO X X X X Chi02 M 51 28.4 Histiocytosis + RT AO X X X
Chi03 M 58 23.7 NFPA + pituitary apoplexy
AO X X X
Chi04 M 54 34.4 NFPA + pituitary apoplexy
AO X X X X
Chi05 F 21 29 Brain tumor + RT +
chemotherapy
AO X X X X
Patient Sex Age BMI Diagnosis Onset Hypo- adrenalism Hypo- thyroidism Hypo- gonadism C D I
Chi08 F 21 25.1 NFPA + surg AO X X X X
Chi09 M 19 21.9 NFPA + surg AO X
Chi10 M 24 36.2 Idiopathic CO
Chi11 F 32 21.9 NFPA + surg AO X X
equipotent dose of cortisone; 7 patients with diabetes insipidus were treated with desmopressin.
Controls
Thirty healthy controls were individually matched with the patients for gender, age and BMI. Women were also matched for formulations of estrogens and progesterone/progestagens. Whenever applicable, inclusion criteria were the same as for the patients.
Experimental protocol
The protocol was approved by the Institutional Review Boards of all participating universities. Written informed consent was obtained from all participants.
The protocol is illustrated in Fig. 7 and consisted of:
a first 4-month phase during which either rhGH or placebo were administered to the GHD patients; objective and subjective sleep quality, as well as quality of life, were evaluated at baseline in patients and controls (study A) and at the end of the 4 months in patients (study B1)
a 3-month wash-out period
a second 4-month phase during which either placebo or rhGH were administered to the GHD patients; objective and subjective sleep quality, as well as quality of life, were evaluated at the end of the 4 months (study B2).
Fig. 7: outline of the procotocol (PSQI Pittsburgh Sleep Quality index, QoL-AGHDA Quality of
Life Assessment of Growth Hormone Deficiency in Adults, EEG electroencephalogram)
The outpatient visit and the inpatient study were performed in laboratories at the Universities of Chicago, Brussels (including the patients recruited at the University of Liege) and Pisa. The same equipment, instruments and recording techniques were used at each site.
Outpatient visit
All GHD patients and control subjects had an initial outpatient admission. This visit included:
- physical examination;
- administration of the QoL scale (QoL-AGHDA): 25 “yes or no” questions relative to specific complaints commonly reported by GHD patients. A higher score corresponds to lower QoL. The 25 complaints may be clustered in five domains: tiredness (7 questions), memory and concentration (6 questions), tenseness (3 questions), social isolation (5 questions), and self-confidence (4 questions) 30, 37. For each domain, the mean score per question was calculated.
- administration of the Pittsburgh Sleep Quality Index questionnaire (PSQI): a validated 19-item questionnaire that investigates subjective sleep quality, as well as subjective sleep latency, subjective sleep duration, subjective sleep efficiency, presence of sleep disturbances, use of hypnotic drugs and daytime sleepiness; scores can range from 0 and 21 and a score > 5 is indicative of impaired sleep 164. - determination of plasma levels of IGF-I, free T4 (FT4), Na, K, and fasting blood
glucose.
Ambulatory monitoring
Patients and controls underwent 6 days of ambulatory sleep monitoring by wrist actigraphy (Actiwatch, Philips Respironics, Bend, OR), a method providing accurate estimations of sleep onset and offset 165-166. The median habitual bedtimes from these recordings were used to individually design the bedtime schedule during the inpatient study. Patients and controls also had to fill a questionnaire about the subjective quality of their sleep every morning (Karolinska Sleep Log) and keep a log of their caffeine and alcohol intake for those 6 days.
Inpatient study
The outline of the inpatient study is shown in Fig. 8. Within one week after the end of ambulatory monitoring, the subjects were admitted to the laboratory between 1700 h and 1900 h on day 1, and remained in the laboratory until discharge in the morning of day 3. Regular hospital meals were served at 08h00, 12h30 and 19h0. Lights were turned off 5 min before scheduled bedtime and turned on 5 min after scheduled wake time. During bedtimes, sleep was polygraphically recorded (DigiTrace Care Services, Boston, MA).
Upon awakening on day 2, a blood sample was taken for measurement of plasma IGF-I. Thereafter, subjects were maintained under normal indoor light (± 300 lux) until bedtime. During waking hours, they had sedentary activities (reading, watching TV and simple neurobehavioral tests) and were free to ambulate around the unit. Naps were not allowed.
During the second night, all experimental conditions were identical to those in the first night.
Monitoring of rhGH treatment in patients
Recombinant human GH (Genotropin, Pfizer, Inc, New York, USA) was administered as follows:
Table 5: rhGH dosage instructions according to age and gender.
Men <45 y.o. Men >45 y.o. Women <45 y.o. Women > 45 y.o. Initial dose (mg/day) 0.2 0.1 0.3 0.3 Increments (mg/day) 0.2 0.1 0.2 0.1 Max. dose (mg/day) 0.6 0.4 0.7 0.6
Patients were instructed to inject rhGH subcutaneously approximately 30 minutes before bedtime. IGF-I levels were monitored monthly and rhGH dosage was titrated accordingly.
Objective sleep analysis
Polygraphic recordings were visually scored at 30-sec intervals in stages wake, I, II, III, IV and REM using standardized criteria 41 by the same experienced scorer who was blind to the subject’s condition. Sleep onset and morning awakening were defined as, respectively, the times of the first and last 30-sec intervals scored II, III, IV, or REM. The sleep period was defined as the time separating sleep onset from final morning awakening. Total sleep time was defined as the sleep period minus the total duration of wake after sleep onset (WASO). Sleep latency was defined as the time from lights off until sleep onset (Fig. 9). Sleep efficiency was calculated as the total sleep time, expressed as percentage of the time allocated to sleep. A spectral analysis on the central EEG lead was performed (PRANA, PhiTools, Strasbourg, France) 167. Muscular, ocular and movement artifacts were eliminated prior to spectral analysis. Delta, theta, and alpha activities were calculated as the absolute spectral power in the frequency bands 0.5-4 Hz, 4.5-8 Hz, and 8.5-12 Hz, respectively. Mean power per 30-sec epoch was calculated for each band. Mean delta power in non-REM sleep quantifies the intensity of SWS. For illustrative purposes, the durations of NREM/REM cycles were also normalized to account for individual differences 168.
Fig.9: sleep parameters recorded during each night.
For study A, technical artifacts prevented sleep scoring for 3 of the 120 nights of recordings and spectral analysis for 9 of the 120 nights. All of the 52 nights recorded for study B were scored; technical artifacts prevented spectral analysis for 5 of them. With very few exceptions due to technical failures, comparisons between patients and controls used the second, rather than the first night of polysomnography, because all patients and controls were habituated to the experimental procedures and spent the preceding day in the same standardized and controlled environment.
Statistical analysis
For study A, the analysis principally compares the 26 GHD patients with confirmed or likely pituitary defects, and their individually matched controls. Because sleep quality changes in the course of normal aging42, we performed a median split of this group according to age (younger: 29±2 years, range 19-43 years, n=13; older: 60±3 years, range: 47–74 years, n=13) and compared patients and controls by ANOVA for repeated measures with age group as a between-subject factor. Differences in the prevalence of QoL symptoms were tested by the Chi-Square test with Yates’
correction for continuity. Correlations were explored using the Spearman coefficient.
We also compared the 12 patients with pure primary pituitary GHD, the 8 patients classified as pituitary GHD with possible hypothalamic involvement, the 6 patients with childhood onset idiopathic GHD and the 4 hypothalamic GHD patients. Differences between patients and their individually matched controls were compared by ANOVA with etiology of GHD as factor and age group as covariate. For study B, differences between the 2 treatment periods were compared by ANOVA for repeated measures with treatment as a factor and age group as covariate.
RESULTS
Study A
Clinical characteristics for each GHD group and for matched controls are shown in Table 6.IGF-I values were lower in all GHD patients than in individually matched controls, averaging 72±7 ng/ml vs 194±11 ng/ml (p<0.001). GHD patients had normal plasma levels of fasting glucose, sodium and potassium. Plasma fT4 levels averaged 86±5 % of the median value of the normal range.
Table 6: Demographics of GHD patients and their age, gender and BMI-matched controls.
GHD patients Controls
Associated deficits (% patients) Groups M/F Age (yr) BMI (kg/m2) TSH ACTH LH/FSH ADH Age (yr) BMI (kg/m2) Pure pituitary (12) 9/3 55±5 26±1 67 67 92 0 54±5 25±1 Pituitary + possible hypothalamic (8) 7/1 39±5 31±2 100 100 100 63 39±5 31±2 Idiopathic (6) 6/0 33±5 26±3 67 67 67 0 33±5 25±3 Hypothalamic (4) 2/2 44±11 28±2 50 25 50 25 45±11 26±2
We first present detailed analyses for the 26 patients with pure pituitary defects, pituitary defects with possible hypothalamic involvement, or likely pituitary defects. An exploratory analysis of differences with patients with hypothalamic GHD follows.
Objective sleep quality
Table 7 presents the sleep parameters recorded in the 26 patients with pure pituitary defects, pituitary defects with possible hypothalamic involvement, and idiopathic GHD, and their gender, age and BMI-matched controls.
Table 7: Sleep variables recorded in 26 patients with pure pituitary defects, pituitary defects with
possible hypothalamic involvement, and childhood-onset idiopathic GHD, and their individually matched controls (mean±SEM; SPT sleep period time, TST total sleep time, WASO wake after sleep onset). GHD patients Controls Condition GHD vs controls p level Age young vs older p level Age x condition interaction p level SPT (min) 488±12 482±11 0.75 0.77 0.83 Sleep latency (min) 32±7 27±4 0.46 0.59 0.94 TST (min) 432±11 477±9 0.14 0.004 0.01
Sleep efficiency (%)
83±2 88±1 0.05 0.001 0.03
WASO (min) 51±11 28±5 0.05 0.002 0.04
REM sleep (min) 91±7 100±5 0.28 0.002 0.05
Stages I+II (min) 220±11 267±14 0.02 0.93 0.70
Stage III (min) 47±5 37±4 0.06 0.67 0.17 Stage IV (min) 68±7 44±6 0.01 0.02 0.58
Bedtimes, sleep period and sleep latencies were similar in GHD patients with primary pituitary lesions and controls, irrespective of age. While total duration of NREM sleep was not modified, GHD patients presented a shift of NREM sleep towards deeper stages, with lower amounts of stages I+II, and a more than 50% increase in the duration of stage IV. Differences between GHD patients and controls for total sleep time, sleep efficiency, WASO and REM were dependent on age (as revealed by a significant interaction between age and condition). Figure 10
illustrates the differences between GHD patients and controls for the sleep variables and the two age groups. The elevation in SWS (stages III+IV) relative to controls was significant in the entire group of GHD patients and in the younger group, but failed to reach statistical significance in the older group. Total sleep time was decreased and sleep fragmentation (as quantified by sleep efficiency and WASO) was increased in older, but not in younger GHD patients, as compared to controls. The increase in WASO in older subjects was not significant during the first 3 hours of sleep (GHD patients: 23±7 min; controls: 16±6 min; p=0.39) and reflected mainly sleep fragmentation during the later part of the night (hours 3-6 of sleep: 39±9 min vs 13±2 min, p=0.009). The reduction in total sleep time in older GHD patients was associated with lower amounts of REM sleep.
Fig. 10: Differences (mean±SEM) in total sleep time, sleep stages and delta activity between 26
GHD patients with pure pituitary defects, pituitary defects with possible hypothalamic involvement, or childhood onset idiopathic GHD, and their pair-matched healthy controls for the younger (n=13) and the older (n= 13) age groups. Positive values indicate higher levels in GHD patients, negative values lower levels in GHD patients.
Mean profiles of delta, theta and alpha activities in both groups of 26 subjects are shown in Fig. 11. The normal homeostatic decline of delta activity occurred across the night in both groups. However, delta and theta activities were markedly higher in GHD patients than in controls.
Fig. 11: Mean profiles (+SEM) of absolute EEG spectral power in the delta, theta and alpha ranges
during the first four NREM-REM cycles in GHD patients with pure pituitary defects, pituitary defects with possible hypothalamic involvement, or childhood-onset idiopathic GHD (left), and in their healthy controls (right).
Throughout the first 6 hours after sleep onset, mean delta activity in NREM sleep was increased by more than 50% in GHD patients as compared to controls. Theta power was also increased in patients compared to controls (Table 8). The elevation in delta power relative to controls was significant in the entire group of GHD patients and in the younger group, but failed to reach statistical significance in the
older group. EEG spectral power in the alpha range was not affected by GH deficiency.
Table 8: Mean spectral power levels in the delta, theta and alpha power, in GHD patients with pure
pituitary defects, pituitary defects with possible hypothalamic involvement, or childhood-onset idiopathic GHD and in their healthy controls, over the first 6 hours of sleep.
GHD patients Controls Condition GHD vs controls p level Age young vs older p level Age x condition interaction p level Mean delta power
(µV2)
1284±227 837±99 0.03 0.01 0.23 Mean theta power
(µV2)
146±27 96±12 0.05 0.47 0.94 Mean alpha power
(µV2)
58±9 51±6 0.53 0.95 0.27
Subjective sleep quality and daytime sleepiness
On average, the global PSQI was indicative of poor sleep (i.e. above the clinical cut-off of 5) in the 26 GHD patients with primary pituitary lesions while it was consistent with normal sleep in their controls (6.6±0.7 vs 3.6±0.5, p=0.04). The component assessing daytime sleepiness was also elevated in these patients as compared to their controls (1.1±0.2 vs 0.5±0.1, p=0.03 by paired Wilcoxon test). No significant correlations were found between the global PSQI score and polysomnography-derived sleep variables. However, the daytime sleepiness component of the PSQI was associated with reduced sleep efficiency (rs=-0.55, p=0.006) and longer WASO (rs=0.47, p=0.02).
Quality of Life
Group data for QoL variables for the 26 patients with primary pituitary lesions and their matched controls are given in Table 8.
QoL scores were similar in U.S. and European patients. GHD patients had significantly higher total QoL-AGHDA scores than their controls, irrespective of age, but the scores were not indicative of a major impairment. Tiredness was the most frequent complaint and reached the highest score in both age groups. Only 30% of patients (8/26), as compared to 73% of controls (19/26), did not report any tiredness complaint (negative answer to each of the 7 questions; p<0.01). Memory problems were also more frequent in GHD patients than in controls.
Table 9: Global quality of life scores and scores for the different domains explored by the
QoL-AGHDA questionnaire, in GHD patients with pure pituitary defects, pituitary defects with possible hypothalamic involvement, or childhood onset idiopathic GHD, and in their healthy controls. For each domain, the mean score per question was calculated.
GHD patients Controls Condition
GHD vs controls p level Age young vs older p level Age x condition interaction p level Global score 6.85±1.24 2.85±0.85 0.006 0.93 0.49 Tiredness 0.31±0.06 0.07±0.03 0.001 0.94 0.93 Memory and concentration 0.30±0.07 0.15±0.05 0.0 0.81 0.11 Tenseness 0.39±0.07 0.22±0.07 0.08 0.29 0.48 Social isolation 0.20±0.06 0.08±0.03 0.07 0.51 0.48 Self-confidence 0.18±0.05 0.11±0.05 0.26 0.43 0.57
Figure 12 illustrates the differences between GHD patients and controls for the five domains of QoL and the two age groups. When each age group was analyzed
separately, tiredness was the only domain significantly affected in young patients, while deficits in memory and concentration, and a trend for more social problems were also found in older patients.
Fig. 12: Differences (mean+SEM) in quality of life scores for the five domains of the QoL-AGHDA
scale between GHD patients with pure pituitary defects, pituitary defects with possible hypothalamic involvement, or childhood onset idiopathic GHD, and their pair-matched healthy controls for the younger (n = 13) and older (n = 13) age groups. Positive values indicate higher levels in GHD patients.
In the entire group of 26 patients, the score on the tiredness domain of QoL was associated with the daytime sleepiness component of the PSQI (rs=0.41, p=0.04). In younger patients (n=13), a trend for a correlation between the tiredness score and the amount of SWS was detectable (rs=0.51, p<0.08) (Fig. 13). No other correlations between sleep variables and global or partial QoL scores were found.
Fig.13: correlation between QoL-AGHDA tiredness score and SWS duration in younger patients
Impact of etiology of GHD on objective sleep variables, subjective sleep quality and quality of life
Irrespective of GHD etiology (i.e. pure pituitary, pituitary with possible hypothalamic involvement, idiopathic childhood onset, hypothalamic), differences between patients and controls were qualitatively similar for all sleep variables derived from sleep staging as well as for subjective sleep quality and QoL. However, EEG spectral analysis revealed striking differences in the microarchitecture of non-REM sleep in patients with hypothalamic GHD as compared to those with pituitary GHD.
Fig. 14: Mean (+SEM) of absolute EEG spectral power in the delta range during the first four
NREM-REM cycles in GHD patients as compared to their matched controls for the four diagnostic categories. From top to bottom: pure pituitary GHD (n=12), pituitary GHD with possible hypothalamic involvement (n=7), childhood onset idiopathic GHD (n=6), hypothalamic GHD patients (n=4). Differences in levels of delta activity across the four control groups are due to differences in sex, age and BMI distribution. For each diagnostic category, patients and controls are pair-matched for sex, age and BMI.
Indeed, as illustrated in Figure 15, the etiology of GHD was a significant predictor of the difference in delta activity between patients and controls after adjusting for age (p=0.05). In patients with hypothalamic GHD, the findings regarding delta activity were opposite from those observed in patients with “pure pituitary” GHD (p=0.005) or patients with childhood onset idiopathic GHD (p=0.05), with markedly decreased, rather than increased, delta activity in patients as compared to controls.
Fig: 15: Differences (mean±SEM) between patients and controls in total delta activity during the
first 6 hours of sleep for: patients with pure pituitary GHD (n=12); patients with pituitary GHD with possible hypothalamic involvement (n=7; spectral analysis could not be performed for one patient); patients with childhood-onset idiopathic GHD (n=6); patients with hypothalamic GHD (n=4). Positive values indicate higher levels in GHD patients, negative values lower levels in GHD patients. ** p<0.005 for difference between pure pituitary GHD and hypothalamic GHD, after controlling for age; * p=0.05 for difference between idiopathic GHD and hypothalamic GHD, after controlling for age.
Study B
13 patients completed phase B of the study (11M, 2F, age 465 years). Six patients were part of the “young” category and 7 were part of the “older” group. The average dose of rhGH was 0.40.1 mg/day. At the end of the rhGH period, average IGF-I was 22730 ng/ml, vs 9415 ng/ml at the end of the placebo period (p=0.001). Five patients started with the placebo phase, and 8 started with the rhGH phase. No side-effects were reported during rhGH replacement.
Impact of rhGH treatment on anthropometric measures
As shown in Table 10, no difference was observed in BMI at the end of the 4-months rhGH period, after controlling for the age group, compared to values obtained at the end of the placebo period. For the waist-to-hip ratio, data is available in both sessions for 9 patients. A trend for improvement was evident in this measure (p=0.10). Differences in body composition measures did not reach statistical significance, probably because data is available only for 6 patients; however the lean mass, and therefore the lean/fat ratio, increased with treatment.
Table 10: Anthropometric and body composition measures obtained for GHD patients after 4
months placebo or rhGH treatment (meanSEM). Placebo GH Treatment GH vs PL p level Age group young vs older p level
Treatment x age group interaction p level BMI n=13 25.81.8 261.6 0.52 0.28 0.74 WHR n=9 0.920.02 0.900.02 0.10 0.45 0.13 Fat mass (kg) 32.78.4 32.28.4 0.98 0.61 0.41