Politecnico Di Milano
School of arquitecture urban planning and construction engineering Master of Science in Building and Architectural Engineering
BOND BEHAVIOR OF FIBER REINFORCED CEMENTITIOUS MATRIX (FRCM) COMPOSITES: EFFECT OF THE STRESS REDISTRIBUTION
Professor Carlos Poggi Tutor: Tommaso D´Antino
Elaborated by Carlos Hidalgo – 862789
Academic Year 2017/2018
0
Building green in a developing country – Case
study analysis of high performance commercial
buildings in Brazil
TUTOR: PROF. GIULIANNA IANNACCONE MARTHA HAJJAR FARAH - 853536
POLITECNICO DI MILANO |
SCHOOL OF ARCHITECTURE URBAN PLANNING AND CONSTRUCTION ENGINEERING – MI | MASTER OF SCIENCE IN BUILDING AND ARCHITECTURAL ENGINEERING |
Acknowledgements
Throughout the human history, the continuous improvement and important achievements towards the development of us as a society, have been carried out thanks to the continuous learning process linked to the different demands and needs during the human existence. Nowadays, I strongly believe that the constant learning motivated and addressed to a common end is the way how we, as a collective force, can developed ourselves. Reason why I want to acknowledge the different people who during the last time were enhancing and driving this process alongside with me, being the necessary support to reach a successful ending. Regarding the academic field, I would like to express my special gratefulness to Professor Carlos Poggi and Tommaso D´Antino, who continuously coached me and helped me on every single step taken making possible this final achievement.
My family, on the other hand, has played a special and underlying role being the driving force carrying with it the energy source during this personal and professional process, belonging to them the major part of this final achievement. Not forgetting of course, my sentimental partner, person who has been playing as my teammate, backing me up when was necessary reaching the end together.
Abstract
Lately Fiber Reinforced Cementitious Materials (FRCM) have been widely spread within seismic-resistant reinforced techniques, in which its applicability due to its compatibility with various substrates is one of its outstanding features. This retrofitting technique consists of certain dry fibers embedded in an inorganic matrix, gaining with this a raise in the ultimate tension strength. Its applicability regarding the historical buildings, carrying with it an important heritage value, entails considerable advantages such as reversibility, compatibility with both masonry and concrete substrates and high corrosion resistance.
Within the present job parameters such as the impact on the final strength changing the way of casting, being in some cases done from the top of the specimens and others from the bottom, load distribution among the different bundles of the textile and bond behavior of FRCM in different specimens are studied and furtherly discussed. To do so, two methods were carried out, contact measurement and a non-contact technique being in this case Digital Image Correlation (DIC). The set-up used for this job was shear-bonding test where a tension load is applied on the specimen until the failure, occurring due to the debonding.
The present experimental campaign consists to test six PBO-FRCM specimens and others six using Steel-FRCM, performing the contact measurement analysis for both and DIC only for PBO-FRCM. The final part of the job consists of the discussion of the results and their corresponding comparison, stablishing some considerations for further jobs and guidelines based on the performance observed, leading to the possible generalization of its applicability on field.
Abstract (Italiano)
I materiali cementizi fibrorinforzati (FRCM) hanno avuto un’ampia diffusione nel corso degli ultimi anni come tecnica di rinforzo sismo-resistente; una delle loro caratteristiche più importanti è rappresentata dalla vasta applicabilità dovuta all'elevata compatibilità con vari substrati. Questa tecnica di retrofit consiste nell’incorporare delle fibre secche in una matrice inorganica, ottenendo così un aumento della resistenza a trazione finale. La loro applicabilità ad edifici antichi, che hanno un’importante valore storico, è basata su notevoli vantaggi come la reversibilità, la compatibilità con substrati sia in muratura sia in calcestruzzo ed un'elevata resistenza alla corrosione. In questo lavoro di ricerca vengono analizzati parametri quali l'impatto sulla forza finale del metodo di posa dei campioni, essendo alcuni posati dall'alto ed altri dal basso, la distribuzione di carico tra i diversi fasci di tessuto ed il modo in cui gli FRCM legano nei diversi campioni. Sono state eseguite due tipologie di indagini: la prima è una misurazione a contatto e la seconda è invece una tecnica senza contatto, la correlazione dell'immagine digitale (DIC). Il set-up utilizzato per questa ricerca è rappresentato da prove di taglio in cui viene applicato un carico di tensione sul provino fino al cedimento, che si verifica a causa del distacco della fibra dalla matrice, debonding.
Questa campagna di esperimenti è stata effettuata su sei campioni di tipo PBO-FRCM e su altri sei campioni di Acciaio-FRCM; l'analisi della misurazione a contatto è stata eseguita per entrambe le tipologie di campioni, la DIC solo per i campioni PBO-FRCM. Al termine della presentazione degli esperimenti, segue una discussione sui risultati e vengono tratte alcune considerazioni generali su ulteriori possibili lavori di ricerca e sulla definizione di linee guida per l'eventuale generalizzazione della loro applicabilità in campo.
Table of Contents ... i Acknowledgements ... ii Abstract ... iii Abstract (Italiano) ... iv 1. INTRODUCTION AND STATE OF THE ART ... 1 1.1. FRCM materials ... 1
1.1.1. Composites materials for strengthening ... 1
1.1.2. Materials used ... 3
1.2. Mechanical Characterization ... 8
1.2.1. Tensile Test ... 8
1.2.2. Shear Bond Test ... 10
1.3. Behavior of Strengthened Concrete Elements ... 12 1.4. Design and characterization guidelines ... 15 1.5. Scope of the thesis ... 16 2. EXPERIMENTAL TESTS. ... 17 2.1. Introduction. ... 17 2.2. FRCM materials characterization ... 18
2.2.1. (P, 2013) (Hadigheh SA, 2015) (Ascione L, 2015) (Pellegrino C, 2013)PBO ... 18
2.2.2. Steel. ... 18
2.3. Behavior of the FRCM materials under tension. ... 18
2.3.1. Mechanical performance of FRCM (PBO) under tension. ... 19
2.3.2. Mechanical performance of FRCM (steel) under tension. ... 30
3. ANALYSIS OF THE LOAD DISTRIBUTION IN PBO FRCM COMPOSITES ... 41 3.1. Introduction ... 41 3.2. Procedure ... 42 3.3. Results ... 46 4. DISCUSSION OF THE RESULTS ... 64 5. CONCLUSIONS ... 73 Bibliography ... 74
Table of figures
FIGURE 1 A,B) WOVEN YARNS; C) BONDED YARNS.TAKEN FROM (CAROZZI,2016) ...3
FIGURE 2 A)PBO FIBERS;B) STEEL FIBERS ...4
FIGURE 3.FRCM IMPACT IN TERMS OF FI/FU AND FCC/FCO .TAKEN FROM (TRAPKO,2014) ...5
FIGURE 4 IMPACT OF THE PBO IN TERMS OF STRAIN.TAKEN FROM (TRAPKO,2014) ...6
FIGURE 5EXPERIMENTAL RESULTS.TAKEN FROM (TRAPKO,2014) ...7
FIGURE 6.STRESS-STRAIN BEHAVIOR.TAKEN FROM (PILLA,2017) ...8
FIGURE 7CLAMPING SET UP.TAKEN FROM (C.CARLONI,2014) ...9
FIGURE 8. SINGLE-LAP SHEAR SET UP.TAKEN FROM (PILLA,2017) ...10
FIGURE 9 DOUBLE-LAP SHEAR SET UP.TAKEN FROM (ADEL YOUNIS,2018) ...11
FIGURE 10DIFFERENT FAILURE MODES.TAKEN FROM (PILLA,2017) ...11
FIGURE 11 SHEAR-BOND TEST.TAKEN FROM (F.CERONI) ...12
FIGURE 12 DIFFERENT LOCATIONS OF THE FRCM AND LENGTHS.TAKEN FROM (F.CERONI) ...12
FIGURE 13DISTRIBUTION OF DIFFERENT FAILURE MODES.TAKEN FROM (F.CERONI) ...13
FIGURE 14DEBONDING AND SLIPPAGE FAILURE RESULTS.TAKEN FROM (F.CERONI) ...14
FIGURE 15 RESULTS FOR DIFFERENT LENGTHS.TAKEN FROM (F.CERONI) ...15
FIGURE 16 A,B) DEBONDING TEST SET UP ...19
FIGURE 17 POSITIONING OF THE LVDTS ...20
FIGURE 18STRESS-SLIP RESULTS (LOADED AND FREE END) ...21
FIGURE 19STRESS-SLIP RESULTS OF THE FOUR LVDTS ...21
FIGURE 20STRESS-SLIP RESULTS (LOADED AND FREE END) ...22
FIGURE 21STRESS-SLIP RESULTS OF THE FOUR LVDTS ...23
FIGURE 22 STRESS-SLIP RESULTS (LOADED AND FREE END) ...23
FIGURE 23STRESS-SLIP RESULTS OF THE FOUR LVDTS ...24
FIGURE 24 STRESS-SLIP RESULTS (LOADED AND FREE END) ...24
FIGURE 25STRESS-SLIP RESULTS OF THE FOUR LVDTS ...25
FIGURE 26STRESS-SLIP RESULTS (LOADED AND FREE END) ...25
FIGURE 27STRESS-SLIP RESULTS OF THE FOUR LVDTS ...26
FIGURE 28STRESS-SLIP RESULTS (LOADED AND FREE END) ...26
FIGURE 29STRESS-SLIP RESULTS OF THE FOUR LVDTS ...27
FIGURE 30 A)STRESS-SLIP RESULTS OF THE FOUR LVDTS; B) NOMENCLATURE FOR THE LVDTS POSITION ...28
FIGURE 31 OVERALL RESULTS OF THE SIX SPECIMENS ...28
FIGURE 32GENERAL BEHAVIOR OF PBO-FRCM ...30
FIGURE 33 A,B) SET-UP FOR STEEL-FRCM ...31
FIGURE 34STRESS-SLIP RESULTS (LOADED AND FREE END) ...32
FIGURE 35STRESS-SLIP RESULTS OF THE FOUR LVDTS ...32
FIGURE 36STRESS-SLIP RESULTS (LOADED AND FREE END) ...33
FIGURE 37STRESS-SLIP RESULTS OF THE FOUR LVDTS ...33
FIGURE 38STRESS-SLIP RESULTS (LOADED AND FREE END) ...34
FIGURE 39 STRESS-SLIP RESULTS OF THE FOUR LVDTS ...34
FIGURE 40STRESS-SLIP RESULTS (LOADED AND FREE END) ...35
FIGURE 41STRESS-SLIP RESULTS OF THE FOUR LVDTS ...35
FIGURE 42STRESS-SLIP RESULTS (LOADED AND FREE END) ...36
FIGURE 43STRESS-SLIP RESULTS OF THE FOUR LVDTS ...36
FIGURE 44STRESS-SLIP RESULTS (LOADED AND FREE END) ...37
FIGURE 45STRESS-SLIP RESULTS OF THE FOUR LVDTS ...37
FIGURE 46 A)STRESS-SLIP RESULTS OF THE FOUR LVDTS; B) NOMENCLATURE FOR THE LVDTS POSITION ...38
FIGURE 47 OVERALL RESULTS OF THE SIX SPECIMENS ...39
FIGURE 48GENERAL STEEL-FRCM BEHAVIOR ...40
FIGURE 49PRINCIPLE OF THE IMAGE CORRELATION SYSTEM A,C) SKETCH OF THE SUBSET; A,B) BEFORE AND C,D) AFTER DEFORMATION.TAKEN FROM (MARCIN TEKIELI,2016) ...42
FIGURE 50GENERAL SET-UP FOR THE DIC ANALYSIS.WHITE PAINT WAS SPRAYED ON THE TEXTILE ...43
FIGURE 51DEFINITION OF THE SUBSETS ON THE PICTURES TAKEN DURING THE TEST EXECUTION ...43
FIGURE 53NOMENCLATURE FOR THE DIFFERENT BUNDLES ...46
FIGURE 54STREES-SLIP RELATION AMONG THE BUNDLES ...47
FIGURE 55TOP AND BOTTOM SLIP ...48
FIGURE 56 LOAD-DISTRIBUTION IN TERMS OF STRAIN ...49
FIGURE 57 LOAD DISTRIBUTION IN TERMS OF STRESS ...50
FIGURE 58SLIP OF THE TOP PART OF THE TEXTILE ...50
FIGURE 59SLIP OF THE BOTTOM PART OF THE TEXTILE ...51
FIGURE 60 STRESS-SLIP RELATION AMONG THE BUNDLES ...51
FIGURE 61STRESS-SLIP RELATION AMONG THE BUNDLES ...52
FIGURE 62TOP AND BOTTOM SLIP ...53
FIGURE 63LOAD DISTRIBUTION IN TERMS OF STRESS ...54
FIGURE 64SLIP OF THE TOP PART OF THE TEXTILE ...54
FIGURE 65SLIP OF THE BOTTOM PART OF THE TEXTILE ...55
FIGURE 66STRESS-SLIP RELATION AMONG THE BUNDLES ...55
FIGURE 67TOP AND BOTTOM SLIP ...56
FIGURE 68LOAD DISTRIBUTION IN TERMS OF STRESS AMONG THE BUNDLES ...57
FIGURE 69SLIP OF THE TOP PART OF THE TEXTILE ...57
FIGURE 70.SLIP OF THE TOP PART OF THE TEXTILE ...58
FIGURE 71STRESS-SLIP RELATION AMONG THE BUNDLES ...58
FIGURE 72TOP AND BOTTOM SLIP ...59
FIGURE 73LOAD DISTRIBUTION IN TERMS OF STRESS AMONG THE BUNDLES ...60
FIGURE 74SLIP OF THE TOP PART OF THE TEXTILE ...61
FIGURE 75SLIP OF THE BOTTOM PART OF THE TEXTILE ...61
FIGURE 76FINAL COMPARISON AMONG THE DIFFERENT SPECIMENS (BUNDLE BY BUNDLE) IN TERMS OF STRESS ...62
FIGURE 77FINAL COMPARISON AMONG THE DIFFERENT SPECIMENS (BUNDLE BY BUNDLE) IN TERMS OF STRESS AT THE TOP OF THE EXTILE ...63
FIGURE 78FINAL COMPARISON AMONG THE DIFFERENT SPECIMENS (BUNDLE BY BUNDLE) IN TERMS OF STRESS AT THE TOP OF THE EXTILE ...63
FIGURE 79FINAL COMPARISON BETWEEN THE DISPLACEMENTS REGISTERED AT THE TOP AND BOTTOM OF THE DIFFERENT SPECIMENS ...67
FIGURE 80SLIP AT THE TOP OF THE TEXTILE OF ALL THE SPECIMENS, HIGHLIGHTING THE MAXIMUMS AND MINIMUMS ...68
FIGURE 81SLIP AT THE BOTTOM OF THE TEXTILE OF ALL THE SPECIMENS, HIGHLIGHTING THE MAXIMUMS AND MINIMUMS ...68
FIGURE 82FINAL COMPARISON BETWEEN ALL THE SPECIMENS IN TERMS OF STRESS-DISTRIBUTION ...70
List of tables
TABLE 1.FEATURES OF DIFFERENT TEXTILES USED FOR FRCM.TAKEN FROM (BIANCHI) ...2
TABLE 2RESULTS IN TERMS OF ULTIMATE STRENGTH ...29
TABLE 3 RESULTS IN TERMS OF ULTIMATE STRENGTH AND STRAIN ...29
TABLE 4RESULTS IN TERMS OF ULTIMATE STRENGTH ...39
TABLE 5RESULTS IN TERMS OF ULTIMATE STRENGTH AND STRAIN ...40
TABLE 6COMPARISON BETWEEN DIC AND LVDTS RESULTS ...64
TABLE 7DISPLACEMENTS REGISTERED AT THE TOP OF THE TEXTILE ...65
TABLE 8DISPLACEMENTS REGISTERED AT THE BOTTOM OF THE TEXTILE ...65
TABLE 9DIFFERENCE BETWEEN THE MAXIMUM AND MINIMUM SLIP REGISTERED AT THE TOP OF THE TEXTILE ...69
1. INTRODUCTION AND STATE OF THE ART
1.1. FRCM materials
During the last decades, and due to the number of a considerably earthquakes that took place at center of Italy, the retrofitting and structural rehabilitation have gained important attention, especially in Italy that due to its width spread arquitecture richness, has become susceptible to important structural damages.
The cement-based materials such as concrete due to its nature, has a very low tensile capacity as well as its ductile behaviour, reason why, especially for historical and preserved buildings, exists the imminent need to carry out a strengthening intervention.
Lately, the use of Fiber Reinforced Cementitious Matrix (FRCM) has become popular and well used to fulfill this current aim.
The FRCM can be defined as a structural planar grid composed by a certain number of filaments forming the yarns, constituting the structure able to provide the structural stability intended. Usually the filaments are made mainly by, glass, PBO, carbon or steel.
In addition, FRCM has gained especial attention as a strengthening technique due to its numerous advantages such as physical and chemical compatibility, reversibility, cost and time of installation, especially when the surface to be retrofitted is an irregular building. Therefore, for the specific case of Italy, in which a major percentage of buildings has a valuable historical value, the update process to the current seismic design code is necessary using strengthening techniques having low visible impact.
However, the limited data due to its complex mechanical behaviour, the generalization of the FRCM´s use at a bigger scale has not been possible.
Currently exist an American strengthening guideline titled “Acceptance criteria for cement-based
matrix Fabric Composite System for Reinforced and Unreinforced masonry” (AC218), “guide to design and construction of externally bonded fabric reinforced cementitious matrix (FRCM) systems for repair and strengthening of concrete and masonry structures” (AC1549.4R-13),
which provides certain statements to evaluate and characterize the FRCM systems. Moreover, depending on the substrate which will be retrofitted, a different design should be carry out (e.g. clay brick, concrete, etc). thus, the generalization and worldwide application of FRCM as a strengthening technique is still in progress.
Composites materials can be defined as the combinations of two or more different materials, and for the specific case of buildings strengthening, the most common used material and well known currently within the engineering field are the fiber composite products. These materials are mainly obtained by embedding or impregnating high strength fibers in an inorganic or organic matrix.
As well as the matrix, the fibers can be organic or inorganic. Currently within the market, inorganic fibers can be made of:
• Glass • Carbon
While organic fibers are made of: • Aramid
• Polyvinyalcohol. • Others.
Despite the wide variety of fibers, for retrofitting interventions, the most commonly type of fibers used are: carbon (CFRP), Aramid (AFRP) and glass (GFRP). The final form of these fibers is according to the final aim and the applicability of each one depending upon the material on which the retrofitting will be made. Additionally, CFRP, AFRP, and GFRP comparing to the steel performance for such purposes, clearly indicate considerable advantages over the use of steel (table 1)
Considering the table 1, paying special attention to the corrosion resistance, the field of applicability of the FRCM will go further than the steel´s one, independently for instance of the place where the intervention is needed and its aggressiveness.
Table 1. Features of different textiles used for FRCM. Taken from (Bianchi)
The strength of the fibers used, depend mainly upon the type of fiber and its content in the matrix. For retrofitting purposes and such, the desirable mechanical features are:
• High tensile strength. • High elastic modulus.
• Stability at ambient temperature.
These materials present a set of advantages compared to the traditional strengthening techniques as: lightweight, speed of execution, worthy mechanical characteristics and good performance at failure (Carozzi, 2016).
For the current purpose, the work developed was based on the evaluation of Fabric Reinforced Cementitious Matrix (FRCM), which is a particular type within the textile reinforced concrete. FRCM is constituted by dry-fibers in textile form which are embedded of impregnated in a cementitious mortar. The mortar used, usually has a low content of organic polymers. Although the bonding interaction at mortar/fiber interface and at mortar/substrate interface limits in some cases the intervention, advantages as reversibility of the intervention and durability to external agents enhance its applicability, especially on historical buildings (mostly masonry buildings), due to its compatibility between the substrate and the FRCM.
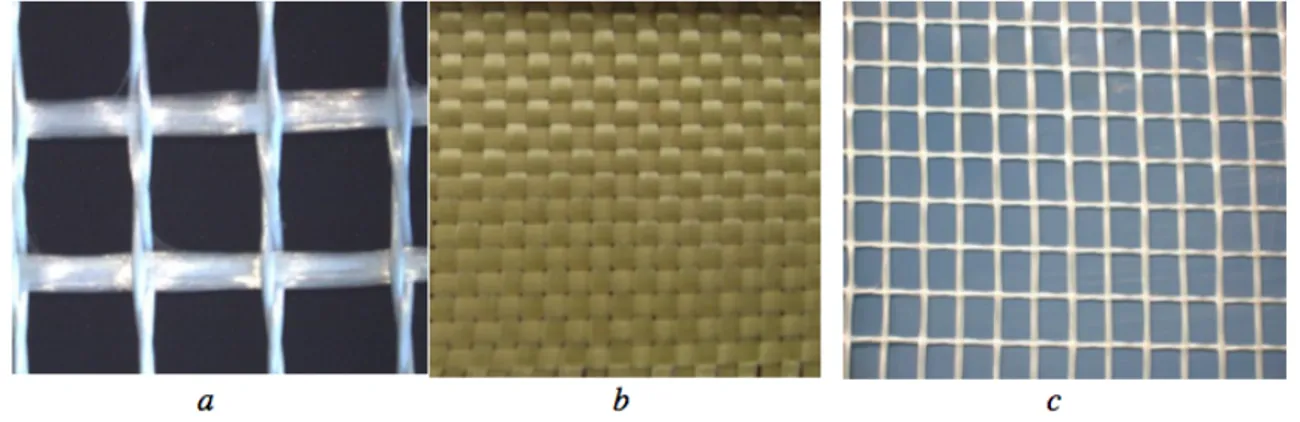
To carry out a retrofitting intervention, the most commonly fabric used is woven textile composed by yarns passing under and over each other connected by friction (figure 1). However, exist bonded yarns as well.
1.1.2. Materials used
During the characterization of the FRCM systems were tested twelve specimens in total, six using a strengthening material made of Poliparaphenylene benzobisoxazole (PBO) fiber with the
fibers addressed along two orthogonal directions (Fig. 1), and 6 using steel fibers disposed in the same way as the PBO fibers were (Fig. 2).
a) B)
PBO
The recently increase of use of this materials is owing to their advantages in which the high
tensile strength, low weight, high resistance to corrosion and an easy application on field are outstanding features capable of performing a desire retrofitting intervention on masonry and concrete buildings.
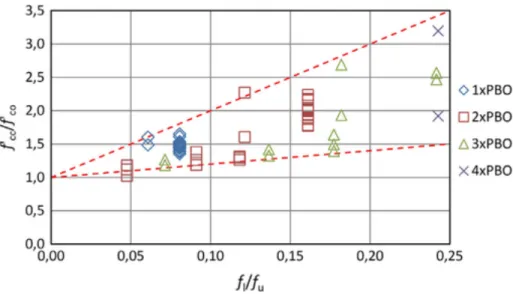
The combination of a dry mortar and such performing material as PBO is, result in a raise of the ultimate compressive capacity of the intervened structural element. According to different studies, its results concur demonstrating that the effectiveness of the intervention and application of PBO-FRCM composites is clearly evident on concretes of lower compressive strength. Hence, with the raise of concrete strength, the strengthening effectiveness decreases. According to the results obtained by (Trapko, 2014), the ultimate strength value, once the intervention is carried out, considers the elongation capacity of the PBO fibers. In the figure 3 the results obtained by the author are exposed, showing the impact of the intervention in terms of fi/fu and fcc/fco ratio, where the rise is clearly linear.
Where: Fcc is the compressive strength of confined concrete, Mpa.
Fco is the compressive strength of unconfined concrete, Mpa. F1 is the ultimate lateral confining stress, Mpa.
Fu is the ultimate tensile strength of PBO-FCRM, Mpa.
In addition, since the PBO mesh is a material made of bundles of fibers, which its tensile strength in the lateral direction to the wrapping direction is void and its way of works is totally linear and elastically, the activity of the composite jacket varies closely to the variation of the elastic modulus of the concrete Ec and its transveral deformability n (Poisson´s rastio). In the figure 4 can be identified clearly the variation of n once the application of the different PBO layers were performed,
In addition, is important keeping in mind that within the measurement of the longitudinal and
transversal deformation is not being considered the concrete core or the PBO mesh independently, but as a no-homogeneous material made by concrete and the composite. According to the figure 4, where the red dash line is marked as a reference value considering an unconfined concrete core, increasing the number of layers of PBO, the effectiveness of the transverse strengthening is evident, making the specimen capable of higher transversal deformation. Higher transversal deformations than longitudinal were recorded by the author.
Steel
As well as PBO-FRCM, the use of steel fibers embedded within a dry mortar has been studied,
representing an important alternative to retrofitting purposes, showing after its application an increase of the flexural strength of the elements intervened. Although the use of this composite materials has shown promising results, the debonding of the composite tends to limit the effectiveness, except in the case where the fibers used have relatively low density, occurring the rupture. (Lesley H. Sneed, 2016).
The experimental campaign carried out by the author consisted in testing 7 specimens using single-lap shear test set-up and five RC beam specimens.
Regarding to the seven specimens tested using shear test set-up, the failure mode was the same experimented using PBO fibers, was due to composite debonding. The behaviour at the failure point was characterized by a brittle detachment at matrix/steel fiber interface and interfacial and surface cracks were observed.
The crack formation starts normally at the loaded end expanding then progressively towards the free end. This phenomenon happens due to the raise of the interfacial shear stresses, having a
relative slip between the internal layers, which is bonded to the concrete substrate, and the external one interacting with the fibers.
On the figure 5 the results obtained by the author are shown, in which the results of the specimens with external matrix layer (DS_K_330_50 series) and without external matrix layer (DS_K_330_50_L) are similar.
Based on the experimental results obtained, it suggests that the initial part of the load response can be approximated as a linear branch corresponding to an elastic behaviour of the bond between the matrix and the fibers (Lesley H. Sneed, 2016). Afterwards, a slight reduction of stiffness is evidenced due to the damage at matrix/fiber interface. Further, the maximum P load is reached increasing the global slip, that can be approximated as a constant until the end with the no distinguished softening phase.
Observing the behaviour obtained by the author, the debonding observed was characterized by
a fiber slippage and fracture of the matrix layer at inter matrix/fiber interface (Lesley H. Sneed, 2016).
A post-peak softening response was not observed having a brittle debonding phenomenon, unlike the behaviour observed in different PBO-FRCM composite tests.
8 1.2. Mechanical Characterization
In order to carry out the structural strengthening, the bonding and mechanical characterization of the materials involved has to be known. This process is implemented through direct tensile and shear bond tests, which its results will define the structural and mechanical parameters to be used towards the strengthening intervention. To guarantee the intended performance of the FRCM system, the bonding behaviour at any interface is of primary importance, influencing in a great manner the final result.
1.2.1. Tensile Test
Factors such specimen production and load application may influence in a great manner the stress-strain behaviour of the tested materials.
A characteristic stress-strain behaviour during a tensile test is shown in the figure 6. The curve can be distinguished as a tri-linear function where: the first zone represents the un-cracked state in which the slope corresponds to the elastic modulus of the matrix. The exceeding of the tensile strength of the matrix is represented in the second zone, where the formation of the cracks starts and the progressive loss of the matrix´s stiffness start occurring. Regarding to the last branch of the curve, the matrix is unable to allow additional cracks and the applied load is sustained only by the fibers.
Having this behaviour, the outstanding parameters to be considered to characterize the tensile behaviour of FRCM, are the stresses and strains at the transitions points and the ultimate stress and strain.
Regarding to the set-up, the same test can be carried out differently using for instance different clamping methods and measurement methods.
Chapter 2 – State of the Art
Figure 4 – Theoretical stress-strain curve for fabric reinforced cementitious matrix with perfect bond
The literature research highlighted that even if the apparent uniaxial tensile behaviour of the FRCM materials is greatly influenced by several factors such as the load transfer mechanism, specimen geometry and axial deformation measurement techniques [22], these factors have not been completely standardized yet. Moreover, the tensile behaviour is affected by the presence of in-plane and out-of-plane bending moments, fabrication defects and measurement techniques employed [23]. This brief literature review lists the plethora of the proposed set-ups for FRCM tensile test, which differs in specimen morphology, clamping methods and measurement techniques [24]. Although all the tests are useful and interesting, they present some drawbacks and results obtained by different set-ups are not easily comparable.
Regarding the geometry of the sample four shapes were identified [23]: the rectangular prism, the dumbbell with a gradually increased section at its ends and a perforated metal plate placed at mid-thickness, the bone-shaped specimen and the V-notched parallelepiped (see Figure 5). The first one is the easiest to implement thanks to the regularity of the shape, the dumbbell configuration helps in overcoming the effect of differential shrinkage between the sides of the plate, but the perfect positioning of the perforated plate requires particular care and time. The third shape entails expensive formworks while the V-notched parallelepiped causes fractures in a pre-set location and may be useful for evaluating the strength of the FRCM but not the overall behaviour, limiting the scope of the results. Two main methods have been designed to transfer tensile load from the machine to specimens. The direct clamping of the specimen by hydraulic or pneumatic wedges, called clamping grip, uses a compressive force normal to the plane of the specimens to transfer the tensile load by friction. Another way is the direct transfer of shear stresses between the grip and the specimen. This last mechanism is realized by clamping the specimen ends by through-bolted steel plates connected via hinge joints to the machine, bonding of metal plates to the specimen ends and connecting the plates to the machines through hinge joints (called clevis grip) or by drilling of holes in the specimen ends and clamping of the inserted steel rods. Finally, particular clamps were adopted to directly transfer the uniaxial load to the edges of bone-shaped samples (see Figure 6) that consist of steel flanges located in the curved paths of the specimens over a rubber sheet to avoid stress concentrations [25].
Figure 6. Stress-Strain behavior. Taken from (Pilla, 2017)
There are two main methods to develop the tensile test and transfer the tensile force to the specimen. The first consist in the direct clamping of the specimen by pneumatic wedges applying a normal force to the plane of the specimen, transmitting in this way the tensile force by friction. The second is called clevis Crip (figure 7), which is the method used for this work, consisting of bonding the metals plates to the specimen ends, which are going to be directed connected to the machine. This clamping method develop a load-bearing behaviour more closely to the field intended conditions.
Regarding to the geometry of the specimen there are 4 mains shapes to be tested: • Rectangular shape
• Dumbbell shape (increased section at its ends) • Bone shape
• V- notched parallelepiped.
Due to the shapes, the first one is the easiest to place thanks to the lack of irregularities. The other geometries can encounter difficulties at the placing stage in the machine, demanding special care.
Figure 7 Clamping set up. Taken from (C. Carloni, 2014)
1.2.2. Shear Bond Test
As well as the mechanical properties of the composite material to be used, the knowledge about the bonding resistance is crucial to the correct characterization in order to predict more precisely the load carrying capacity and the failure mode of FRCM/concrete (Adel Younis, 2018).
Due to the importance regarding to the bonding performance at both FRCM/concrete bond and fabric/matrix interface, several studies have revealed that the most commonly failure occurs at fabric/matrix interface, by means of the fabric slippage within the mortar. The other possible failure modes as can be the fabric rupture or debonding at concrete/matrix interface were rarely occurred.
To test the bonding behaviour at any interface, a certain number of test can be carried out. A single-lap shear test due to its simplicity is commonly performed. The concrete rectangular prism, representing the substrate, is constrained by means of a steel frame and the fabric coming out from the FRCM directed bonded to the prism is pulled out (Figure 8.) (Pilla, 2017). The test is conduced under displacement control.
Nevertheless, the design process regarding to the steel structure acting as a constrain of the substrate can encounter difficulties in terms of eccentricities between the pulling and restraining forces. (Pilla, 2017)
On the other hand, the double-lap shear test consists mainly of two rectangular concrete blocks in which FRCM are applied symmetrically. The two fabrics are stretching by the use of a hydraulic jack (Figure 9). A steel plate is placed at the top-end of the fabric between the hydraulic jack and the stretched fabric to guarantee the uniform distribution of the load.
Finally, depending on the properties of the substrate, the tensile strength of the textile, the textile-matrix bond, the substrate-textile-matrix bond and shear strength of the textile-matrix, different failure modes can be observed during the different tests (Figure 10 ).
Where:
• The mode A represents the debonding due to a cohesive failure in the substrate • The mode B represents the debonding at the substrate-composite interface. • The mode C represents a debonding at fabric-matrix interface.
• The mode D represents a slippage of the matrix within the mortar. • The mode E represents a rupture of the fabric.
• The mode F represents a rupture of the fabric within the mortar. Figure 9 double-lap shear set up. Taken from (Adel Younis, 2018)
1.3. Behavior of Strengthened Concrete Elements
For a correct and precise design of the strengthening technique, is the vital importance the complete understanding of the behaviour of each of the components of the FRP. The bond between the concrete substrate and FRP may play a key role in the final evaluation of the overall structure´s performance and its reliability once the strengthening intervention is carried out.
To characterize the bonding behaviour, many models have been studied and developed, and the stress state may be simulated by means of performing a shear-bond test (Figure 8.) with the FRP lamina externally bonded.
The experimental program heading by Kostiantyn Protchenko, Maria Wlodarczyk and Elzbieta Szmigiera proposes a behaviour analysis of the different solutions to strengthen concrete elements by FRP externally bonded.
During the experimental study, a beam is analysed varying the FRP plate width and thickness as well as varying the plate location, this with the purpose to determine the optimal location where the FRP plate can be placed under the same loads, making possible the measurement of maximum deflection and carrying capacity of each configuration. The set-up is schematized in figure 11 and figure 12.
Figure 11 shear-bond test. Taken from (F. Ceroni)
The analysis was performed in LIRA, which is used to finite element analysis. Within the analysis different features as degradability of the glue and thermal load for contraction of the material were considered (Kostiantyn Protchenko, 2015). Among the different results, the best out-put in terms of maximum load applied and midspan deflection was obtained gluing the plates at the edges of the beam. Despite 1 was the best configuration according to the results, 2 and S-4 configuration showed a similar performance, unlike S-3 which its maximum load was considerable lower than the exposed by the rest of configurations.
Besides, due to the recent events which took place in Italy, the high vulnerability of its buildings and its imminent need to implement a retrofit was exposed, showing a typical shear damage in concrete elements (F. Ceroni). Hence, FRCM has gained a special interest during the last decades as an alternative retrofit technique rather than traditional strengthening methods, especially when heritage buildings are involved.
Considering the needs, near to 856 shear bond test results, performed by different researchers, can be collected within the literature. Within the 856 shear bond test results, 347 were related to FRCM applied on a concrete substrate.
Examining the extensive data collected during the recent times, three failure modes were repetitively observed among the different performed tests. Thus, the data obtained was gathered depending upon the failure mode:
• Debonding (include debonding at the mortar/fibers interface and substrate/mortar interface).
• Slippage (refers to movements of the fibers within the mortar). • Tensile rupture of the fibers. (F. Ceroni)
The distribution of the different failures modes on concrete elements, as it shown in the figure 13, was mainly due to debonding, assuming a main role in the FRCM behaviour as a retrofit intervention.
Figure 13 Distribution of different failure modes. Taken from (F. Ceroni)
Besides, a poor quality of the mortar can lead to a poor bond strength at mortar/fiber interface, inducing a slippage of the fibers.
Within the data base, a considerable high number of concrete substrates with different strength and different reinforcement strength were tested, reason why the effective length, length greater than the effective one when the debonding load should remain constant without any further increase, [ (F. Ceroni)] is different. For the most rigid reinforcements the effective length can be individuated in 150-200 mm, while for the most deformable ones can be in 250-300 mm. (figure 15)
On the other hand, was intended to evaluate the influence of the mortar strength, 𝑓".$, on the debonding and slippage failure (figure 14). for both cases the data was highly scattered and clear correlation between the mortar´s quality and the failure mode cannot be determined. The figure of the left refers to the specimens´ failure due to slippage, while the figure on the right refers to debonding failure.
Therefore, the outcome provided by F. Ceroni and P. Salzano in their study using the existing data, can be summarized as:
• Deboding was the most common failure.
• There is no a clear correlation between the quality of the mortar and the strain measured of the strengthen concrete substrate.
• In case of debonding, the maximum strain can be increased by means of increasing the mechanical characteristics of the concrete.
• Increasing the rigidity of the FRCM systems, the effective length decreases.
1.4. Design and characterization guidelines
Currently in Europe there is no a guideline or technical specification in which is consigned the corresponding procedure to carry out the different tests and implement the mechanical characterization to implement the strengthening technique to existing buildings through the application of FRCM. Nevertheless, in United States there are some developed codes in which define the design criteria for the reinforcement of the concrete and masonry buildings using FRCM.
The first document is ICC-ES- AC434, developed to provide the necessary guidelines for the evaluation of the FRCM used to carry out strengthening interventions on masonry and concrete buildings. The AC434 establishes requirements for testing and calculations which may lead to the
issuance of a product under research by ICC-ES. (Nanni, 2014). Those reports pass under the evaluation by code officials compiled in the section 104.11.1 of the international building code. The other document regarding to the characterization and implementation of FRCM is ACI 9.4R-13 in which is consigned the history, material properties and recommendations on their use. Within the AC434 is defined the material and test methods and structural performance test
methods. In these sections the mechanical properties of the materials involved and the
recommended tests to characterize the system (tensile test, orthogonal bond test and durability resistance) are described, respectively.
On the other hand, within the ACI 9.4R-13 is described the general considerations for the reinforce procedure to perform on masonry and concrete buildings.
In Italy, currently the guideline is still in process, in which the results and different experimental campaigns heading by different researchers are being studied aiming to the standardization of the use of FRCM as a reinforce technique along the territory.
1.5. Scope of the thesis
The main objective of the present job is the study and the understanding of the bonding behavior on FRCMs. To carry it out, an experimental campaign was developed where parameters such the way of casting were considered, being some FRCMs casted from the top of the specimens and others from the bottom. The material used for the substrates was concrete.
Besides, an important part of the thesis is dedicated to the study of the load distribution among the bundles within the textile, evaluating as well its impact in terms of ultimate strength.
In the last part of the job, the discussion of the results was developed, where the parameters considered are evaluated, obtaining the corresponding outcome.
Currently in Europe there is no a specific guideline which can be followed, and the academic material is very limited, reason why this thesis is looking forward to stablish some basic considerations for the future jobs, providing experimental data and its corresponding analysis.
2. EXPERIMENTAL TESTS.
2.1. Introduction.
Fiber Reinforced Cementitious Matrix (FRCM) during the last decades has gained special attention within the engineering field, due to its wide application for retrofitting purposes. However, as well as its wide applicability, its behaviour is extremely complex due mainly to the heterogeneity of the constitutive materials. The interaction between the fibers embedded and the matrix, having both a different mechanical behaviour, can lead to different failure modes, which should be analysed and evaluated for each specific case.
During the study of the FRCM behaviour for its further implementation, researches have idealized is behaviour as a tri-linear behaviour. In the first phase the behaviour observed can be described as an elastic performance, depending in the major part upon the matrix properties. The second phase is governed by the cracks-initiation phenomenon and its propagation and finally in the third phase the matrix is completely cracked and the applied load in supported only by the textile.
During the experimental tests, was evident that the impregnation and behaviour of the embedded textile within the matrix was different for the different specimens tested. Hence, the overall tensile strength achieved for the different cases was naturally different.
Twelve concrete specimens were tested, in which six the fiber used to carry out the strengthening was PBO, and the others six were steel. The experimental data can lead to some recommendations for the further application on field.
An important and substantial feature of the set-up is the bond behaviour at the different interfaces, feature which governs in a great manner the overall performance. Reason why the well understanding of the interfacial behaviour has a special impact on the final result. Hence, the mortar capability to penetrate the grid can lead to better results.
On the other hand, is important to highlight the different procedures to measure the deformation, some more precise than others. Nowadays there are a great variety and methods to asses this variable. The use, for instance, of strain gauges can lead to an accurate local information, but is inadequate in the specific case of multi cracking behaviour. The use of extensometers is reliable in terms of alignment and avoid possible out of plane bending moment. A very precise set-up providing accurate information include LVDTs place on opposite sides of the specimens. On the other hand, a photogrammetry is an innovative method, which can provide a more precise information in terms of load distribution among the different bundles of the textile (Carozzi, 2016). For the present job, the tools used to perform the distinct analyses were LVDTs and photogrammetry.
2.2. FRCM materials characterization
The analysed system consisted in a PBO and steel fiber embedded in a mortar. The mortar used for the different tests was the same, making possible the comparison among the PBO and steel results. The six PBO textiles have the same features as well as the six steel textiles, however, the way how they were applied on the concrete prisms was different, being some of them cast from top and the others from bottom of the specimens.
For the mechanical characterization of the twelve different specimens, the image correlation (IC) method was used, comparing the results obtained with the results obtained using a conventional method.
2.2.1. (P, 2013) (Hadigheh SA, 2015) (Ascione L, 2015) (Pellegrino C, 2013)PBO
The nominal width b and average thickness t of one longitudinal fiber bundle were 5 and 0.0092 mm, respectively. The t defined in this job differs from the equivalent thickness provided by the manufacturer. The equivalent thickness provided by the manufacturer assumes that the fibers are spread evenly over the entire width of the composite instead of bundled. Hence, the t used for the present job represents the thickness of the fiber bundled, having a cross section of with b. (C. Carloni, 2014)
2.2.2. Steel.
On the following table are presented the mechanical properties provided by the manufacturer,
Property
Low density
Number of cords/mm 0.157 Tensile Strength [Mpa] >3000
Elastic Modulus [Gpa] >190 Break Deformation [%] >2
Equivalent thickness
[mm] 0.084
Table 2 Mechanical properties of the steel fibers
2.3. Behavior of the FRCM materials under tension.
In the following section the behaviour of the FRCM materials under a tension load application is studied, analysing the influence of different parameters as the way how the specimens were cast.
A comparison between the different results between PBO and steel is reported as well as the results obtained among the six PBO reinforced specimens and six steel reinforced specimens.
2.3.1. Mechanical performance of FRCM (PBO) under tension.
For the purpose of the present job, the strengthening techniques were carried out using PBO-FRCM and STEEL-PBO-FRCM, having both different mechanical properties and applicability fields. The results exposed by (Trapko, 2014) have shown that the PBO-FRCM system turned out to be an effective method to increase the bearing capacity of compressed concrete elements through the confinement using PBO-FRCM systems. This method raises its efficiency as lower the concrete class is, having the strengthening technique a more overall significant impact. Due to its impact on low-concrete class, its applicability on weak constructions (old construction) has a considerable effect on its ultimate capacity. But still the main parameter to be considered and evaluated regarding to the use of FRCM is the bond behaviour at all the interfaces.
Finally, the tests performed to the six different specimens were carried out implementing the same clamping method, showed in the figure 16 consisting in a steel plates glued to the free end of the fibers. Therefore, the main load transfer mechanism between the clamping and the specimen is adhesion tension and shear, avoiding with this the slip phenomena that may occur between the clamping and the specimen.
a) B) Figure 16 a,b) debonding test set up
Four LDVTs were placed along the FRCM, two at the loaded end and two at the bottom, registering with this the overall displacement experimenting by the textile at its two ends during the test execution. The LVDT was momentaneously glued at both ends using a steel plate fixed to the specimen (figure 16).
2.3.1.1. Results
In the following section, the results obtained during the test execution for the six different specimens are presented, in which the overall displacement is registered. The displacement showed corresponds to the loaded and free end measured by the use of LVDTs.
Initially, one of the assumptions and hypothesis to corroborate was the load distribution among the bundles before the debonding phenomenon start occurring, reason why the use of LVDTs at different locations along the specimen was required, to register the possible rotation of the textile in case where the load distribution start becoming non-uniform.
The nomenclature used to distinguish the different specimens is DS_300_60_X, where 300 represents the length of the specimen in millimetres, while 60 represents the width and X refers to the specimen´s number.
Referring to the four LVDTs used at top and bottom, their measures are discretized using the nomenclature showed in the figure 17.
• DS_300_60_1
The blue line describes the measures registered by the LVDTs placed on the loaded end (top part of the specimen) corresponding to the A and B points highlighted on the picture, while the green line represents the displacement experimented at the free end of the textile, C and D points.
A B
C D
Initially only the loaded end is supporting completely the load and when the debonding start occurring, the free end start to support partially the load, hence, start its displacement.
As it was explained before, four LVDTs were used in total, using two at the top and two at the bottom. The blue line in this case represents the average of the displacement measured by the two LVDTs on the top, and the green line the average measure at the bottom (figure 18).
It is worth to highlight that once the peak load is reached, the PBO fiber starts its softening phase, exposing with it its ductile behaviour.
Additionally, the individual data corresponding to each of the LVDTs was plotted (figure 19) observing the difference among them. This difference lead to the non-uniform load transfer assumption. On the top part, the LVDTs lectures are different, having a higher displacement the right part of the textile before debonding (B higher than A). The same behaviour was observed on the bottom part, assuring that the transmission of the load within the textile is non-uniform, being some bundles supporting a higher part of the load than others.
0 500 1000 1500 2000 2500 3000 0.00 2.00 4.00 6.00 8.00 A ppl ie d st re ss s [M Pa ] Global slip g [mm] DS_300_60_1 sf 0 500 1000 1500 2000 2500 3000 -1.00 1.00 3.00 5.00 7.00 9.00 A ppl ie d st re ss s [M Pa ] Global slip g [mm] LVDTa LVDTb LVDTc LVDTd Figure 18 Stress-Slip results (loaded and free end) Figure 19 Stress-Slip results of the four LVDTs
Some LVDT data, specifically the one corresponding to the bottom part (C and D), have at certain point negative values, and it is due to the reference plane and the way how the LVDTs were placed. Despite the negative values observed along the C and D line, their trend is the same observed along the A and B, where the displacement registered for both was not equal.
• DS_300_60_2
The methodology used for the execution of the test of the first specimen was the same used for the present one, observing and evidencing the behaviour mentioned previously, where the load initially is fully supported by the top end, and near to the peak load, a displacement at the bottom start to be slightly present due to the debonding initiation.
Regarding to the behaviour reported in the figure 20, the differentiation among the displacement lectures are evident, exposing the same behaviour present in the first test.
Although the materials used and the set up implemented for the tests were exactly equal, the peak load, for instance, was slightly different.
The main parameter which can affect the maximum strength reached by different specimens is the bonding interaction at matrix/textile interface depending mainly upon the impregnation grade of the matrix within the textile.
0 500 1000 1500 2000 2500 3000 -2.00 0.00 2.00 4.00 6.00 8.00 A ppl ie d st re ss s [M Pa ] slip g [mm] DS_300_60_2 sf 0 500 1000 1500 2000 2500 3000 -2.00 0.00 2.00 4.00 6.00 8.00 A ppl ie d st re ss s [M Pa ] slip g [mm] DS_300_60_2 sf Figure 20 Stress-Slip results (loaded and free end)
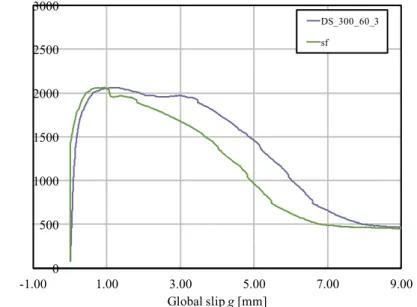
• DS_300_60_3
As it was reported before, the tendency of the displacements at top and bottom is the same, differing in the maximum strength reached. The behaviour reported regarding to the bottom (figure 23) was the same evidenced during the execution of the second specimen, in which the LVDT at the position C at certain point start assuming negative values for a specific interval of time due to its reference axis, representing the differentiation, in terms of displacement, experimented at the bottom of the specimen, leading to a vaguely rotation.
0 500 1000 1500 2000 2500 3000 -2.00 0.00 2.00 4.00 6.00 8.00 A ppl ie d st re ss s [M Pa ] slip g [mm] LVDTa LVDTb LVDTc LVDTd 0 500 1000 1500 2000 2500 3000 -1.00 1.00 3.00 5.00 7.00 9.00 A ppl ie d st re ss s [M Pa ] Global slip g [mm] DS_300_60_3 sf Figure 21 Stress-Slip results of the four LVDTs Figure 22 Stress-Slip results (loaded and free end)
• DS_300_60_4
In terms of shape and trend of the line, no changes are reported within the graphs, the factor which is changing continuously is the peak load reached by the different specimens, and in some cases the variation can be significant. The fourth specimen reached 1200 Mpa, while the third and first one were about 2000 Mpa. The variations evidenced, as it was mentioned before, are due to mainly the impregnation level of the matrix within the textile.
0 500 1000 1500 2000 2500 3000 -1.00 1.00 3.00 5.00 7.00 9.00 A ppl ie d st re ss s [M Pa ] Global slip g [mm] LVDTa LVDTb LVDTc LVDTd 0 500 1000 1500 2000 2500 3000 -2.00 0.00 2.00 4.00 6.00 8.00 A ppl ie d st re ss s [M Pa ] Global slip g [mm] DS_300_4 sf Figure 23 Stress-Slip results of the four LVDTs Figure 24 Stress-Slip results (loaded and free end)
• DS_300_60_5
As it was expected, the behaviour kept the tendency registered for the specimens tested before, corroborating the behaviour reported in the literature. Although the trend is equal, once again the peak load reached varies from specimen to specimen, in some cases, considerably.
0 500 1000 1500 2000 2500 3000 -2.00 0.00 2.00 4.00 6.00 8.00 A ppl ie d st re ss s [M Pa ] Global slip g [mm] LVDTa LVDTb LVDTc LVDTd 0 500 1000 1500 2000 2500 3000 -2.00 0.00 2.00 4.00 6.00 8.00 A ppl ie d st re ss s [M Pa ] Global slip g [mm] DS_300_60_5 sf Figure 25 Stress-Slip results of the four LVDTs Figure 26 Stress-Slip results (loaded and free end)
• DS_300_60_6
Finally, the six specimens were tested, observing in each one of them the trend expected according to the behaviour consigned on the research data. Observing the same behaviour among the different specimens, the further analysis should be addressed to encounter the cause why the peak load for the different specimen can vary, in some cases, in a considerable way, being an issue to standardize the procedure regarding to the execution of the test and in the manufacture process.
0 500 1000 1500 2000 2500 3000 -2.00 0.00 2.00 4.00 6.00 8.00 A ppl ie d st re ss s [M Pa ] Global slip g [mm] LVDTa LVDTb LVDTc LVDTd 0 500 1000 1500 2000 2500 3000 -1.00 1.00 3.00 5.00 7.00 9.00 A ppl ie d st re ss s [M Pa ] Global slip g [mm] DS_300_60_6 sf Figure 27 Stress-Slip results of the four LVDTs Figure 28 Stress-Slip results (loaded and free end)
Concluding, in the figure 31 is shown the 6 results related to the FRCM using PBO, in which is possible to appreciate the influence of certain parameters in the final performance. The parameter for the present job is the way of casting. The casting procedure for some specimens was carried out from the top of the concrete prism, and for the other was realized from the bottom.
Additionally, one of the initial assumptions was the non-uniform load distribution among the different bundles of the textile, which means the stress that each bundle was subjected to was different respect each other, resulting in a differentiation in terms of displacement. This is strongly observed in the figure 30, where the LVDTs at the top of the specimen (A and B) registered a different displacement between them as well as the LVDTs at the bottom (C and D). According to the figure 30, on the top of the specimen the displacement registered at A is higher than the one registered at B. The behaviour observed at the bottom was similar, being the displacement at D higher than the displacement registered at C, resulting in a slight rotation. Hence, the initial assumption was proved and was strongly noticed that the load transmission among the different bundles was not uniform. However, the use of LVDTs, in terms of load distribution in the different zones of the textile used, at certain point start encountering some limitations. Nevertheless, is evident that with the current set-up is possible to observed the non-uniform load distribution, but is not well known what specifically is the stress that each bundle is subjected to, and how the total load is distributed, in this case, among the six different yarns. Therefore, was necessary to carry out a photogrammetry analysis, which is going to be shown in the following sections.
0 500 1000 1500 2000 2500 3000 -2.00 0.00 2.00 4.00 6.00 8.00 A ppl ie d st re ss s [M Pa ] Global slip g [mm] LVDTa LVDTb LVDTc LVDTd Figure 29 Stress-Slip results of the four LVDTs
a) B)
In the table 2 the values of the ultimate stress of each specimen and its average are reported. The dash lines represent the specimens cast from top and the continuous the specimens cast from bottom. Therefore, is evident in this case that the way of casting does not influence significantly on the specimen´s performance, being dash and continuous lines mixed and not well differentiated within a specific range.
A B C D 0 500 1000 1500 2000 2500 3000 -1.00 1.00 3.00 5.00 7.00 9.00 A ppl ie d st re ss s [M Pa ] Global slip g [mm] LVDTa LVDTb LVDTc LVDTd Figure 30 a) Stress-Slip results of the four LVDTs; b) nomenclature for the LVDTs position Figure 31 overall results of the six specimens
smax [MPa] Avg smax [MPa] CoV DS_300_60_1 1732 1485 18.46% DS_300_60_2 1533 DS_300_60_3 1190 DS_300_60_4 2063 1671 20.85% DS_300_60_5 1556 DS_300_60_6 1395
Table 3 Results in terms of ultimate strength
In the table 3 is reported the ultimate strength and strain related to the concrete specimens strengthened with the FRCM using PBO. The value n refers to the number of bundles which the textile contains. The materials and parameters used for these six tested specimens were the same except for the way how the FRCM was applied on the prisms.
The variation among the ultimate strength values is due mainly to the interaction at textile/mortar interface, where the bonding and permeation reached by the mortar within the textile will dominate the final performance.
Additionally, as it was expected, once the maximum strength was achieved, when the debonding occurs, the slippage phenomena initiates and the movement at the free end of the textile starts (figure 32). This behaviour, which is represented by the green line, shows the global slippage at the free end of the textile, tendency clearly noticed during the other five tests as well.
Type Name n Strength [MPa] e max PBO DS_300_60_1 6 1732 0.008407891 DS_300_60_2 6 1533 0.007443406 DS_300_60_3 6 1190 0.005777253 DS_300_60_4 6 2063 0.010013879 DS_300_60_5 6 1556 0.0075522 DS_300_60_6 6 1395 0.00677238
Within the different parameters that can affect the final performance and the variation on the ultimate strength as it is noticed in the figure 31, the measures taken when FRCM material was placed on the concrete prisms can influence in a great manner as well as the different grade of permeation of the mortar into the textile. Hence, the equipment and personal responsible to carry out this activity may affect the final performance, leading to different results.
As a common behaviour observed during the test execution of the five specimens was the softening phase once the peak load is reached due to the debonding phenomenon. As it will be observed further, that this behaviour was not observed within the steel performance tests, in which the failure mode once the peak load is reached occurs abruptly.
2.3.2. Mechanical performance of FRCM (steel) under tension.
The procedure followed during the testing process of the PBO fibers was the same followed for the steel fibers. Six concrete prisms were placed and the free end of the fiber were glue to a steel plate, generating only tension and shear stress avoiding any slippage phenomena within the plates during the load application. As it can be noticed on the figure 33, four LVDTs were placed, two at the bottom part and two at the top one, making possible the measurement of the corresponding displacement.
On the following section the results obtained regarding to the steel-FRCM are presented, pointing out the main differences observed in comparison with the overall performance obtained using PBO-FRCM. 0 200 400 600 800 1000 1200 1400 1600 1800 2000 0.00 2.00 4.00 6.00 8.00 10.00 A ppl ie d st re ss s [M Pa ] Global slip g [mm] DS_300_60_1 sf Figure 32 General behavior of PBO-FRCM
a) b)
2.3.2.1. Results
As it was presented in the previous section, the stress-strain relation of the specimens tested are presented considering both the global slippage resulting from the average of the measures registered by the LVDTS at top and bottom and the individual displacement of each LVDT. Following the trend observed in PBO-FRCM, the load distribution among, in this case, the eight bundles was not equal, being some of the yarns subjected to a higher stress.
The nomenclature used to differentiate the specimens is denoted by DS_S300_60_X, where 300 and 60 are the length and width of the specimen in millimetres respectively, while the X refers to the specimen number.
• DS_S300_60_1
For the case of the steel, as it is showed in the figure 34, the displacement registered at the bottom of the fibers was negligible. The load was not transmitted to the bottom part of the textile until the very end of the test execution when the debonding start occurring. Hence, the lectures of the LVDTs located at the bottom were nearly nil.
Unlike PBO fibers, the behaviour of the steel was not ductile, reaching its failure in a sudden mode when the debonding phenomenon takes place at matrix/textile interface.
• DS_S300_60_2
For the case of steel, the variation in terms of peak load was not scatter as it was noticed during the PBO tests execution, in which sometimes the variation can be up 30%. The trend followed within the steel results is equal, where the bottom part does not register a significant displacement.
0 500 1000 1500 2000 2500 3000 0.00 2.00 4.00 6.00 8.00 A ppl ie d st re ss s [M Pa ] Global slip g [mm] Global Slip [mm] sf 0 500 1000 1500 2000 2500 3000 0.00 2.00 4.00 6.00 8.00 A ppl ie d st re ss s [M Pa ] Global slip g [mm] LVDTa LVDTb LVDTc LVDTd Figure 34 Stress-Slip results (loaded and free end) Figure 35 Stress-Slip results of the four LVDTs
• DS_S300_60_3
the pattern evidenced in the previous specimens is presented, even in the peak load reached during the test, which although the variation does exist, it is not substantial. The displacement
0 500 1000 1500 2000 2500 3000 -1.00 1.00 3.00 5.00 7.00 9.00 A ppl ie d st re ss s [M Pa ] Global slip g [mm] Global Slip [mm] sf 0 500 1000 1500 2000 2500 3000 -1.00 1.00 3.00 5.00 7.00 9.00 A ppl ie d st re ss s [M Pa ] Global slip g [mm] LVDTa LVDTb LVDTc LVDTd Figure 36 Stress-Slip results (loaded and free end) Figure 37 Stress-Slip results of the four LVDTs
registered at the bottom of the textile was practically nil, being the top part of the specimen subjected to the load application until debonding start to be present.
• DS_S300_60_4
The behaviour registered does not present any variation comparing to the previous specimens. Following the tendency, at the bottom of the textile there was not a substantial displacement registered. 0 500 1000 1500 2000 2500 3000 -1.00 1.00 3.00 5.00 7.00 9.00 A ppl ie d st re ss s [M Pa ] Global slip g [mm] Global Slip [mm] sf 0 500 1000 1500 2000 2500 3000 -1.00 1.00 3.00 5.00 7.00 9.00 A ppl ie d st re ss s [M Pa ] Global slip g [mm] LVDTa LVDTb LVDTc LVDTd Figure 38 Stress-Slip results (loaded and free end) Figure 39 Stress-Slip results of the four LVDTs
• DS_S300_5
Observing the different curves and its corresponding comparison among them, unlike PBO fibers, the distribution among the different steel bundles was considerable more uniform, having similar displacements the top part.
0 500 1000 1500 2000 2500 3000 -1.00 1.00 3.00 5.00 7.00 9.00 A ppl ie d st re ss s [M Pa ] Global slip g [mm] Global Slip [mm] sf 0 500 1000 1500 2000 2500 3000 -1.00 1.00 3.00 5.00 7.00 9.00 A ppl ie d st re ss s [M Pa ] Global slip g [mm] LVDTa LVDTb LVDTc LVDTd Figure 40 Stress-Slip results (loaded and free end) Figure 41 Stress-Slip results of the four LVDTs
• DS_S300_60_6
The trend observed during the execution of steel-FRCM composite was in way more regular that the performance observed during the testing season of PBO-FRCM composites. In this case the way how the specimens were casted has a more notorious impact on the overall performance of the specimens. The final result comparison is presented ahead.
0 500 1000 1500 2000 2500 3000 0.00 2.00 4.00 6.00 8.00 A ppl ie d st re ss s [M Pa ] Global slip g [mm] Global Slip [mm] sf 0 500 1000 1500 2000 2500 3000 0.00 2.00 4.00 6.00 8.00 A ppl ie d st re ss s [M Pa ] Global slip g [mm] LVDTa LVDTb LVDTc LVDTd Figure 42 Stress-Slip results (loaded and free end) Figure 43 Stress-Slip results of the four LVDTs
For the case of the steel fibers, the casting process was carried out in a different way for the three specimens, being casted from the top and the other three from the bottom.
0 500 1000 1500 2000 2500 3000 0.00 2.00 4.00 6.00 8.00 A ppl ie d st re ss s [M Pa ] Global slip g [mm] Global Slip [mm] sf 0 500 1000 1500 2000 2500 3000 0.00 2.00 4.00 6.00 8.00 A ppl ie d st re ss s [M Pa ] Global slip g [mm] LVDTa LVDTb LVDTc LVDTd Figure 44 Stress-Slip results (loaded and free end) Figure 45 Stress-Slip results of the four LVDTs
Additionally, the behaviour expected initially in terms of load distribution was the same as it happened with the PBO fibers, where the load distribution among, in this case, eight bundles was non-uniform, being represented in the displacement registered in the different LVDTs placed at the bottom and top of the specimen. In this case, unlike PBO fibers, the displacement at the bottom was negligible and the displacement differentiation was not possible to be observed. However, at the top of the specimen the displacement registered at position B was slightly lower than the one registered at position A (figure 45), resulting in a slight rotation in counter clockwise direction. Based on this, is possible to stablish the non-uniform load distribution
a) b)
Due to the nature of the steel fibers and its weight, the way of casting can lead to more noticeable difference in the results in terms of ultimate strength. This influence can be noticed on the figure 47 where the dash line represents the specimens casted from top and the continuous line corresponds to the specimens casted from the bottom. For specimens four, five and six (casted from top) the ultimate strength is considerable higher than the specimens one, two and three (casted from bottom). A B D C 0 500 1000 1500 2000 2500 3000 0.00 2.00 4.00 6.00 8.00 A ppl ie d st re ss s [M Pa ] Global slip g [mm] LVDTa LVDTb LVDTc LVDTd Figure 46 a) Stress-Slip results of the four LVDTs; b) nomenclature for the LVDTs position
smax [MPa] Avg smax [MPa] CoV DS_S300_60_1 2275 2159 4.94% DS_S300_60_2 2065 DS_S300_60_3 2137 DS_S300_60_4 2585 2570 1.58% DS_S300_60_5 2524 DS_S300_60_6 2601
Table 5 Results in terms of ultimate strength
Comparing the results obtained for steel and PBO fibers, although a steel textile on average presents a higher ultimate strength than the PBO fibers, its behaviour is brittle leading to explosive failures, as it was observed during the different tests, while the PBO textile exposed a ductile behaviour.
In the table 5 is reported the ultimate strength and strain related to the concrete specimens strengthened with the FRCM using steel. The value n refers to the number of bundles which the textile contains. The materials and parameters used for these six tested specimens were the same except for the way how the FRCM was applied on the prisms.
Type Name n Strength [MPa] e max Steel DS_S300_60_1 8 2585 0.01305548 DS_S300_60_2 8 2524 0.012747558 DS_S300_60_3 8 2601 0.013137135 DS_S300_60_4 8 2275 0.011487843 DS_S300_60_5 8 2065 0.010428648 Figure 47 overall results of the six specimens
DS_S300_60_6 8 2137 0.010793021 Table 6 Results in terms of ultimate strength and strain
Regarding to the brittle behaviour of the steel fibers, the displacement at the free end of the textile at the bottom of the FRCM is negligible (figure 48), and it is because once the debonding phenomenon takes place, the FRCM explode. Unlike PBO fibers, the steel textile does not perform a softening phase once the peak load is reached, having a sudden failure mode, leading in some cases to the impossibility to carry out its implementation.
0 500 1000 1500 2000 2500 3000 0.00 2.00 4.00 6.00 8.00 A ppl ie d st re ss s [M Pa ] Global slip g [mm] Global Slip [mm] sf Figure 48 General steel-FRCM behavior