POLITECNICO DI MILANO
Facoltà di Ingegneria dei SistemiCorso di Laurea Specialistica in Ingegneria Biomedica Dipartimento di Elettronica, Informazione e Bioingegneria
!
!
!
!
A new approach to Microsoft Kinect for
neuro-motor rehabilitation of the upper body
!
!
!
!
!
!
Relatore: Prof. G. C. Santambrogio
Correlatore: Prof. E. Burdet
!
!
Tesi di Laurea di:
Alfredo BELFIORI
Matr. n. 787382
!
!
ANNO ACCADEMICO 2012/2013
!
Contents
Abstract 3
1. Introduction 5
2. State of the art 9
2.2 Neurorehabilitation of the upper limb 9
2.2.1 Stroke 9
2.2.2 Motor neurorehabilitation 12
2.2.3 Rehabilitation assessment 13
2.3 Motion capture system 15
2.4 SITAR 18
2.5 Microsoft Kinect for Windows 19
3. Method 23
3.1 State of the art in upper limb detection 23
3.2 Proposed method 24 3.3.1 Data gathering 25 3.3.2 Data processing 27 3.3.2a Preprocessing 28 3.3.2b Calibration 30 3.3.2c Execution 35 3.3.2d Post-Processing 37 4. Experiment 40 4.1 Setup 40 4.3 Protocol 42 4.4 Results 44
5. Conclusion and Future Directions 52
5.1 Conclusion 52
5.2 Future work 53
References 55
Appendix 58
Abstract
!
Stroke is one of the leading causes of death worldwide and the main factor of neuromotor impairments. Neurorehabilitation plays an important role in limiting and improving this pathological situation. Critical elements of rehabilitation are to provide an engaging therapy, the ability to operate in a domestic environment, at low cost and the capability to assess the patients’ state.
The Human Robotics Group at Imperial College London has developed different rehabilitation devices, in particular the SITAR, which is an upper limb rehabilitation system. The SITAR addresses the factors of providing and engaging environment, is suitable for domestic use and inexpensive. It permits the interaction with patients through a large force touch screen table and require them to move objects and make specific movements, and measure the performance. This apparatus, however is incapable of controlling and assessing all the particular movement configurations during the tasks, such as compensatory movements, that impaired individuals tends to do. This thesis shows that coupling the SITAR with Microsoft Kinect can effectively be used to control the rehabilitation process.
Through the use of Microsoft Kinect and the developed algorithms to body recognition and motion tracking, it becomes possible to carry out the operations normally done using motion capture device, i.e. retrieving kinematic parameters necessary for assessing movement in neurorehabilitation. The chosen system has been verified through comparison with the gold standard device VICON system. The proposed algorithm successfully obtained:
1. Body movements tracking in every condition within the protocol constraints 2. Improvement of the tracking performance compared to the Kinect tracking 3. Higher sensibility to shoulder displacement
1. Introduction
!
This thesis project is introduced in the neuromotor rehabilitation field and deals with motion capture systems. The idea of this project comes from the necessity of finding a system able to measure movements executed by a subject put through a rehabilitation process. The sought system is required to be not invasive, low price, with discrete measurement and analysing capability, simple and intuitive to the user and feasible for a domestic use. Moreover this system has to be introduced in a broader project concerning the creation of a multi sensorial platform per neuromotor rehabilitation developed within the Imperial College London by the Human Robotics Group and the Prof. E. Burdet.
Commonly used optical systems for motion capture are the VICON and the CODAMOTION [18]. Both are system that use several high-resolution cameras to derive the position of the markers sited within the cameras field of view (fov). The acquired data is extremely precise and the accuracy error is lower than 1 mm. The characteristics of these system do not match with the requirement of this project because of the high cost of the devices, they are cumbersome and need specialised technicians therefore they are not suitable for domestic use. Furthermore they need the markers to be placed on the patient body surface. Microsoft Kinect came out onto the market during 2010 and since then its potentials have been studied in the clinical rehabilitation. [25][26][27]. Its low cost and its simplicity to use made the Kinect a product with a huge interest in this field, and many studies have been done to merge rehabilitation and virtual reality. Engaging and attractive rehabilitative video games that can interact with patient movements have been developed. However they all face the problem of measuring how well the patient is performing the requested tasks. This problem has not yet solved. Precisely the Microsoft Kinect is not capable of obtaining reliable data because of its lack of precision and accuracy if compared to the other motion tracking systems. This thesis project has the objective of implementing an algorithm able to determine some particular movement characteristics of patient affected by neuromotor disabilities and to improve the tracking capabilities of the Microsoft Kinect device.
As already mentioned, this project takes part of a broader project aimed to create a multi sensorial system called SITAR (System for Independent Task-oriented Assessment and Rehabilitation). The purpose of this system is to entertain the interacting subject in order to either rehabilitate or assess. This task has been executed through the use of a sensorised table able to identify the presence of selected intelligent objects placed on the table surface. It can also discern the
presence of a hand rather than the presence of a still object lying on the table surface.
The system is accessorised with other different sensorised object like a bracelet able to measure the hand acceleration, or a few object able to determine how and where are they grasped. The table is composed by a big screen with which the patient can interact. Several video games have been developed for this platform, they all ask the patient to move object on the table surface and to click buttons that appear on the screen. It has been decided to add to this architecture a system for movements detection based on optical sensors. The purpose consist in identify pathologic movements. Precisely impaired individuals present several problems in controlling affected parts of the body. During grasping tasks [32], patients that suffer of disabilities in the upper limb, hardly cope to contract several muscles. In order to accomplish the grasping task they are asked to do, they try to overcome their difficulties to properly contract the muscles, contracting other muscles and performing the movement with an unusual movement pattern. For instance they try to compensate the lack of shoulder flexion with a shoulder displacement and a compensatory movement of the trunk. The purpose of the optical system is to identify these wrong movement patterns.
Furthermore the optical system become useful for measuring the angular range of the several joint movements during the whole rehabilitative process. These measures helps physiotherapists with clear data to evaluate the quality of the adopted rehabilitation.
The problem specifications are: finding a system easy to implement within the SITAR platform, able to communicate with the table, easy to place and adaptable for different space availability and being suitable for a domestic use. One more requirement is that the elaboration code has to be straightforward for the user and that lasts a small amount of time, although the work on-the-fly is not requested.
Microsoft Kinect was selected for managing the control through the optical sensors and fulfilling the requirements. The Kinect provides with a joint position retrieval system, which does not meet the requirements in terms of accuracy: it was a system developed for video games and the only requirements were understand the wrist position. The system is therefore not highly precise and it does not recognise unusual movements such as shoulder compensatory movements. The Human Robotics Group at Imperial College London made available one of the mentioned devices, the installation software and the development KIT. Furthermore a VICON system has been used in order to verify the proposed method a SITAR device to couple at the end of the project.
The result of this thesis project consist of a software platform which engages a Kinect device, elaborates the data and cope to identify and assigns spatial coordinates to the subject joints. The software has been developed coding in C# language and Matlab.
The obtained result meets almost all the requirements: the hardware that has been used consists of a Kinect that is simply a camera easily to relocate and to be placed on every kind of surface, it does not need specialised personnel and then suitable for domestic use. The algorithm is easy to interface, it does not need any input apart from the connection with the Kinect, and it gives back as output a text file with the position of all the upper limb joints during the whole recording, and in addition all the angular range values of the single gestures of all the joints. This text file is useful either for the physiotherapist who can analyse the rehabilitation trend or for the SITAR which can read the data related to the joints position and ask the patient to perform precise movements.
The results precision is higher than the data precision coming directly from the Kinect. The proposed algorithm can even identify joint position impossible to identify with the Kinect, for instance a shoulder displacement and trunk compensatory forward movements. The only problem that has not taken into account during this work is the processing time. The algorithm takes about 15 seconds for the analysis of one frame, and since the Kinect is provided with a sampling frequency of about 30 Hz, the system can take up to 5 minutes per 1 second of recording. Speeding up and skimming the algorithm is an issue not yet engaged because of time limits for this thesis. This project on the other hand totally focused on the accuracy maximisation. However the critical points in the algorithm are known, and several ways to face the problem are described in the conclusion chapter.
The following chapter ‘State of the arT is meant to be an introductory chapter to the thesis context. A first part describes the addressed pathology and its most relevant characteristics to take into account during the design of any kind of rehabilitative device. This part reviews the neuromotor and cognitive capabilities of the post-stroke patients in order to shape the rehabilitative process on their needs. One paragraph is dedicated to the classic theories in the rehabilitation field commonly used by physiotherapists, these clinical methodologies are briefly described pointing out the limits. These limits culminate in the assessment field. One paragraph is focused on the assessment and explains its role. Once stressed the limits of these classic methodologies, new modern approaches and the state of the art are described. After this introductory paragraph about the neuromotor rehabilitation world, the following
chapter introduces the hardware devices analysed and used during the thesis work.
Three paragraphs come in succession generally describing motion capture devices, the SITAR device and the Microsoft Kinect. It follows a chapter with the proposed method and precisely it tells about the state of the art in motion capture and joint retrieval; afterwards it describes the proposed method and its features split into data gathering part and data processing part. The former consists of two simple software that store and read the data. The latter consists of a Matlab algorithm that elaborate and analysed the data.
The fifth chapter thoroughly describes the use and the validation of the proposed method. The first paragraph defines the experiment setup, which devices have been used and how they have been placed. Then the paragraphs that follow concern about the anatomical landmarks and marker positioning and about the protocol that has been approved by ICREC. Eventually there is the result paragraph.
Last chapter concerns about the conclusions, summing up the work done, the results and future arrangement for improving the results and meeting all the requirements.
!
2. State of the art
!
Following the research conducted by the Human Robotics Group at Imperial College, a new approach to measure upper-body movements during neurorehabilitation is proposed. It permits the use of cheap motion capture devices with depth sensor such as the Kinect in order to assess kinematic parameters.
In this chapter the context of the thesis will be briefly described, in particular stroke and the particular features that make our system so relevant. This is followed by a description of a few techniques clinically adopted in rehabilitation and assessment.
!
!
2.2 Neurorehabilitation of the upper limb
!
2.2.1 Stroke
During 2011, stroke was the second most common cause of death worldwide, reaching 6.2 million deaths (~11% of all the causes of death). [1]
In the ranking it lies after heart disease and before cancer[2]. The incidence of stroke increases exponentially from 30 years of age, and aetiology varies by age. [3]. Advanced age is one of the most significant risk factors in stroke. 95% of stroke occurs in people aged 45 and above and two-thirds of those are over the age of 65.However, stroke can occur at any age
such as in childhood. High blood pressure is another notifiable risk factor of stroke.
!
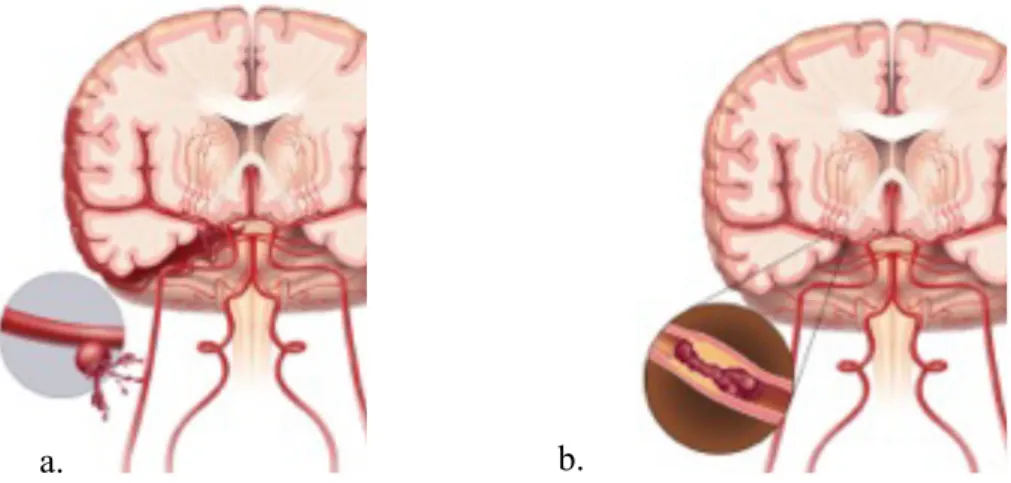
Stroke leads to a loss in brain function due to variation in the blood supply to the brain. It can occur due to diminished blood flow (‘ischemiA) or damage in the cerebral tissue or cerebral blood vessels (‘hemorrhage’). Following stroke the affected area can have abnormal function. This can result in an inability to move normally, complications in understanding and formulating speech or visual impairment.
Stroke can cause permanent neurological damage to the brain or death. There are different risk
57% 4% 6% 6% 13% 14%
Ischemic heart disease Stroke
Lower respiratory infections COPD
Diarroheal diseases Others
Fig. 1 The most striking cause of death in the world. [1]
factors such as age, high blood pressure, previous stroke or transient ischemic attack, diabetes, high cholesterol, tobacco smoking and atrial fibrillation[4].
!
Stroke affects people physically, mentally and emotionally. The effects of stroke vary widely depending on acuteness and location of the attack. Impairments usually directly correlate with the areas that have been damaged.
!
Various physical disabilities can affect stroke patients including muscle weakness, numbness, pressure sores, pneumonia, incontinence, apraxia (inability to perform purposeful learned movements), difficulties carrying out daily activities and losses of appetite, speech vision and pain. In severe cases coma or death can result.
!
Stroke also has debilitating emotional effects from rising frustration and difficulty in adapting to new limitations. Post-stroke patients often report anxiety, panic attacks, flat affect (failure to express emotions), mania, apathy, and psychosis.
!
Around 30 to 50% of stroke survivors suffer depression, characterised by lethargy, irritability, sleep disturbances, lowered self esteem, and withdrawal.[5] Depression can reduce motivation and worsen outcome but can be treated with antidepressants.
!
One more consequence of stroke is patient tendency to switch quickly between emotional highs and lows and to express emotions inappropriately such as excessive laughing or crying with little or no provocation.[6]
!
Fig. 2 Representation of the brain during a stroke. In the left brain (a) is occurring an hemorrhagic stroke. In the right brain (b) is occurring an ischemic. stroke.
Mental deficits resulting from stroke count distinct disorders, such as: Aphasia, [7] dementia,[8] problems with attention[9] and memory.[10] . Stroke patient may be unaware of his or her own disabilities; a pathology called anosognosia.
!
Up to 10% of post stroke patient develop epilepsy, most commonly in the week subsequent to the event; the severity of the stroke increases the likelihood of an epileptic episode.[11]
!
This work focuses on the motor neurorehabilitation assessment. Therefore a brief description about the main musculoskeletal variation after stroke is provided below:
• Distonia, motor problem characterised by involuntary muscular contractions, maintained or spasmodic repetition. This contraction provokes movement habits and abnormal postures. A well known example is spasticity or excessive muscular contraction response to stretching.
• Synkinesis which is the involuntary contraction of a single or group of muscles induced by other voluntary movement or through reflex. Synkinesis is a clinical sign underlying the Pyramidal Syndrome.
• Sensitive and sensorial troubles, they vary widely and can appear as sensory loss.
• Superior functional losses, the main phenomenon is the hemispatial neglect which is a condition where a deficit in attention to and awareness of on side of space does not allow the person to perceive stimuli coming from that side of the body [12].
• Sphincter trouble such as incontinence and gastroesophageal reflux.
!
!
Regarding more specifically the upper limbs, we observe the following:
• Loss in control of movement, the patient is unable to perform an action or to control the movement of a joint.
• Problem with joint coordination, the patient shows desynchronization during movements and little coordination among different body segments.[13] • Loss of movement smoothness.
• Slowness of movements, caused by the alteration of the recruitment process of the different body segments
• Spasticity, the patient is not able to perform rapid movements.
• Muscular force decrease and muscular tone reduction causes joint overcharging. This leads to inflammation and pain, stopping the patient to perform movement with the involved joint and overexploiting the others.
• Muscular synergy problem causes the replacement of default synergies with new pathologic ones [14].
!!
2.2.2 Motor neurorehabilitation
Stroke patients undergo motor neurorehabilitation therapy to regain satisfying skills of everyday life as much as possible. Rehabilitation also concerns helping those with disabling strokes to understand and adapt to changes provoked by the injury, prevent additional complications and educate family members to cope with this problem.
!
The rehabilitation process involves a large number of specialists such as trained physicians, orthosists, pharmacists, nurses, physiotherapists and therapists specialised in speech impediments.
!
Stroke rehabilitation should be started as soon as possible after the stroke and each exercise should be catered specifically for each patient. The whole process can last anywhere from a few days to years. Most of the benefits are seen in the first stages within the first months. Afterwards the improvements decrease exponentially, however the patients are told to continue for years, training their skills like writing walking running , etc.
!
Complete recovery is unusual but not impossible and most patients improve to some extent every time they train.
!
Motor neurorehabilitation takes into account movements and abilities to perform actions using healthy subjects as a reference. Usually all the motor learning is focused on particular task oriented movements. For instance holding a cup in order to drink tea. This represents a daily living problem for some stroke patients who are unable to hold a cup and take a drink.
!
Key elements of motor rehabilitation are: • Functional training
• Active participation • Self-initiated movements • Regular training intensity • Practice gives better success
!
• Severity of impairment prevents patient from practicing
• Poor motivation of patients during lengthy rehabilitation process • Limited number of repetitions
• Amount and duration of the therapy applied to the patient is limited by availability of therapists
• Unclear feedback regarding therapy progress
• Changing needs of patients at different stages of recovery
!
In order to accomplish most of the key elements, some current and future therapy methods include the use of robots, virtual reality and video games for rehabilitation. These forms of rehabilitation offer potential for motivating patients to perform specific therapy tasks that many other forms do not and help in assessing the state of impairment.
Different therapeutic methods are used for reeducating movements in stroke patients, a brief description of the most important for physiotherapists is provided below:
Bobath technique: This technique is used for brain damaged patients, both adults and infants, and is aimed to limit spasticity and improve postural reaction. The therapy is conducted following the Bobath plane, where all the inhibition postures for slowly stretching the spastic muscles are displayed clearly. [15] It follows an improvement of the postural standing reactions, improvement of the automatic protection reactions and the appearance of first signs of voluntary motion.
Kabat technique: This method is focused on the stimulation of the primitive synergies for flexion and extension. The patient is asked to voluntarily participate to the control of the synergies during exercises of “resistance opposition”.
Movement constraint therapy: This technique is suitable for a small percentage of patients who have a certain level of motor capacity. It consists of a set of techniques of re-adaptation designed for reducing functional problems of the upper limbs in a group of patients who underwent cerebrovascular accidents. These treatments involve forcing the least affected arm to rest, usually tying it with a scarf for 90% of the waking hours, while inducing an intensive use of the more affected arm.
!
!
2.2.3 Rehabilitation assessment
Assessment in rehabilitation is essential to accurately select suitable treatment. New methodologies are needed to couple the neuromotor re-education and
quantitative assessment of sensorimotor performances. Recent techniques in robotics and in virtual reality permit to increase the treatment intensity, to respond to the increasing demands of rehabilitation solutions, to decrease the costs and above all to establish a new approach for re-education. Not only this approach would be more effective, but it would also be grounded on more scientific basis than the current therapies, largely based on empirical observations.
!
The evaluation of sensory motor deficits is a cornerstone in stroke assessment. Considerable amount of measurement tools were based on the assumption that recovery occurs in a predictable stereotyped pattern . Validated instruments such as the Barthel scale are used to assess the likelihood of a stroke patient to be able to carry out everyday tasks, with or without support, after discharge from hospital. These measures mainly consist of questionnaires where the capabilities of performing activities of daily living (ADL) are evaluated using ordinal measurement scale. A few of these assessment methodologies are briefly listed below:
• Canadian Neurological Scale: it measures neurological status in patients with stroke and it is divided into 2 sections, mentation and motor function.
• The Barthel Index: it is a self-proxy questionnaire that is designed to measure 3 categories of function: self care, continence of bowel and bladder, and mobility. It is composed of ten items and has a maximum score of 100.
• The Balance Scale: it is a measure that consists of 14 task-oriented items, each of them based on a scale from 0 to 4.
• Functional Independence Measure: it is an adequate scale to measure competence in completing functional tasks, such as dressing. However, its score does not depend solely on motor control, but also on intangible factors such as patienTs personality, depression state, and dependent attitude.
• The Fugl–Meyer assessment: it is a scale that measures motor impairment. It assesses performance based on five domains: motor function, sensory function, balance, joint range of motion, joint pain.
!
The standard assessment procedures listed above are administered by a physiotherapist, who may mitigate their reliability and effectiveness. Rehabilitation robots, which have been the subject of intense inquiry over the last decades[16][17], are equipped with sensors that can be used to develop objective measures of motor behaviours in a semiautomated way during therapy. The possibility to record kinematic and force data will allow therapists to design new assessment procedures with improved objectivity, repeatability, precision
and ease of application. Robot aided assessment procedures may also provide new insight into the process of recovery.
!
Accurate quantitive assessment in neuromotor rehabilitation is fundamental to clearly assess the improvements and define the efficiency of a treatment and to classify the clinical state of the patient in order to select the appropriate rehabilitation process.
!
!
2.3 Motion capture system
!
A highly regarded solution for these two purposes is the use of optical motion capture devices[18][19]. The great interest around motion capture devices in rehabilitation assessment is mainly due to their ability to precisely evaluate three dimensional coordinates of the moving limbs, providing quantitative data to analyse and compare different trials and patients.
In literature, different motion capture studies regarding rehabilitation have been published. Many approaches have been proposed to analyse upper body motion: some were invasive [20] or the setup restricted movement [21]. Other studies tried to take into account the repeatability and the accuracy using more degrees of freedom of motion. [22].
!
The motion capture system is defined as a tool which helps to record the movements of objects or people [Fig. 3]. The information captured can be as general as the simple position of the body in space or as complex as the deformations of the face and muscle masses. It is used in military, entertainment, sports, and medical applications, and for validation of computer vision and robotics.
Jules Etienne Marey and Eadweard Muybridge developed a shutter which enabled several different images to be captured on the same photographic plate (the chronophotograph [23]).
A limitation of the chronophotograph was that the images overlapped and measurements were still difficult. Marey thus experimented with different types of markers. The technique resulted in exquisite images from which it is clearly possible to make meaningful measurements [Fig. 5]
Marey and Muybridge went on to refine this technique in different ways and used it to study pathological walking. This can be seen as one of the first attempts in motion capture systems. Nowadays after different technological revolutions, many motion captures devices are available on the market,
providing plenty of features for any kind of interest. The most currently used is the optical motion capture system. It consists of a subject moving in front of different cameras. The subject must wear a set of markers, tracked by the motion capture system. LED or reflective markers, or a combination of these are tracked, at least two times the frequency rat of the desired motion, to sub millimetres positions. The resolution of the system is important in both space and time as motion blur causes almost the same problems as low resolution.
!
A commonly used class of motion capture techniques is represented by the optical systems [Fig. 4]. They utilise data captured from image sensors to triangulate the 3D position of a subject between one or more cameras calibrated to provide overlapping projections. These systems calculate the position of each marker. Rotational information must be inferred from the relative orientation of three or more markers.
!
Passive optical systems use markers coated with a retroreflective material to reflect light that is generated near the
cameras lens. The cameras read all the light of the field of view, than the camerAs threshold can be adjusted so that only the bright reflective markers will be sampled, ignoring skin, fabric and the rest of the environment.
!
The final coordinates of each marker are calculated by an algorithm which takes all the data coming from all the cameras. For each marker a spot of light is recorded in
Fig. 3 Taxonomy of the motion capture system.
Fig. 4 Typical configuration of an optical motion capture system: cameras on the sides recording a subject moving. The yellow points represent the marker worn by the subject.
each camera (in case of no occlusion). The centroid of the marker is estimated as a position within the two-dimensional image that is captured. The grayscale value of each pixel can be used to provide sub-pixel accuracy by finding the centroid of the Gaussian. The centroid will be the point of interest and its coordinates will be the marker coordinates.
!
Before data motion recording, a calibration phase is often needed. An object with known geometrical characteristics and with attached marker in known position is requested for the calibration. The calibration re-calculates all the camera positions and lens distortion in order to maximise the tracking accuracy.
!
Regarding the active optical systems, they triangulate positions by illuminating the LEDs intermittently with different phases or multiple LEDs together and then identified by their relative positions, somewhat akin to celestial navigation. Rather than reflecting externally generated light, the markers themselves are powered to emit their own light. Since Inverse Square law provides one quarter the power at two times the distance, this can increase the distances and volume for capture.
!
The power to each marker can be provided sequentially in phase with the capture system providing a unique identification of each marker for a given capture frame at a cost to the resultant frame rate. The ability to identify each
Fig. 5 Chronophotographs, first attempt of motion capture for movement analysis.
marker in this manner is useful in realtime applications. The alternative method of identifying markers is doing it algorithmically. However it requires extra data processing.
!
During this work the VICON system (©Vicon Motion Systems Ltd) was utilised. This passive optical system uses cameras and image processing technology to track reflective markers [Fig. 6]. Ten high speed cameras [Fig. 7] were placed around the stage. The cameras use infrared lighting to get high contrast images of the markers. Vicon software Nexus then correlates the data
from each camera to generate a three dimensional (3D) map of all the markers. This results in a 3D reconstruction of the movements. This data can be read by different software (i.e. Matlab) in order to analyse the movements in terms of forward (e.g., joint angles) or inverse dynamics (e.g., forces, moments), or in graphical software tools to visualise the movements. The accuracy of this system is extremely high. For instance the Vicon 460 has an accuracy of the order of 60 um. However its retail price is high, around $200,000 including all the costs of cameras, tripods, markers and processing stacks.
!
2.4 SITAR
!
The SITAR (System for Independent Task-oriented Assessment and Rehabilitation), is a novel sensor based platform developed for training and assessment of patients with sensorimotor deficits by focusing on meaningful functional tasks relevant to the ADL.
This sensor-based approach address several key-elements sought in rehabilitation assessment: functional training, patient engagement, feasible for domestic use, inexpensive, able to assess complex sensorimotor impairments and functions.
The device is provided with Intelligent Objects, wearable inertial sensors, touch and force sensitive screen, and force sensor-based systems [Fig. 8]. All these systems are potentially feasible for assessing complex sensorimotor impairments
Fig. 7 Vicon sensor, composed by a crown of IR emitters and a monochromatic IR camera. Fig. 6 Reflective markers.
and ADL functions (e.g. reach and grasp, bimanual manipulation) for assessment (and potentially training) of upper limb motor functions.
For example, it can give information to fully judge a pick and place task taking into account all the different phases: the reach phase, the grasping/picking up phase and the re-placement phase.
!
!
2.5 Microsoft Kinect for Windows
!
The Microsoft Kinect for Windows is the Kinect version for developers. It works in the Windows developing environment and gives the user the possibility to access different function through a dedicated API. The hardware consists of two different cameras, an infrared projector and 4 sound sensors.
One of the camera is a normal RGB camera. Its characteristics are 8-bit VGA resolution 640×480 pixels with a frame rate of 30 Hz. The resolution can be incremented up to 1280x1024, even though this lowers the frame rate.
The other camera is an infrared camera, with an on-system light-to-depth conversion. It results in a monochrome depth sensing VGA video stream with a resolution of 640×480 pixels sampled at 11-bit depth, which provides 2,048 levels of sensitivity. It can otherwise just stream the infrared light intensity directly. The resolution can increase up to 1280x1024 pixels,even though this lowers the frame rate. The Kinect sensor has a practical range limit of 1.2–3.5 m, although the sensor can maintain tracking through an extended range of approximately 0.7–6 m. The sensor has an angular field of view of 57° horizontally and 43° vertically, while the motorised pivot is capable of tilting the sensor up to 27° either up or down. The horizontal field of the Kinect sensor at
the minimum viewing distance of ~0.8 m is therefore ~87 cm, and the vertical field is ~63 cm. This results in a resolution of just over 1.3 mm per pixel. The Kinect provides also an array of four microphones, each channel processing 16-bit audio at a sampling rate of 16 kHz.
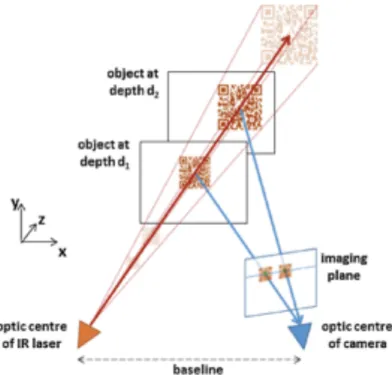
The IR projector casts an IR speckle dot pattern into the 3-D scene while the IR camera captures the reflected IR speckles. Kinect can therefore decode the structured light from the depth sensor. The geometric relation between the IR projector and the IR camera is obtained through an off-line calibration procedure. The IR projector projects a known light speckle pattern into the 3-D scene [Fig. 9]. The speckle is invisible to the color camera but can be viewed by the IR camera. Since each local pattern of projected dots is unique, matching between observed local dot patterns in the image with the calibrated projector dot patterns is feasible. The depth of a point can be deduced by the relative left-right translation of the dot pattern. This translation changes, dependent on the distance of the object to the camera-projector plane. Such a procedure is illustrated in [Fig. 10].
The depth sensor accuracy has a non linear behaviour, it increases following the square of the distance from the kinect, reaching 4 cm of error at 5 m distance [24].
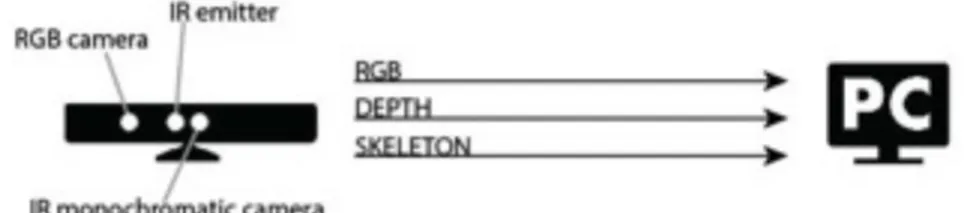
During the experiment the system records the depth stream, the RGB stream and the skeleton reconstruction.
The skeleton reconstruction is a method provided by ‘Microsoft Research Cambridge & Xbox Incubation’, able to quickly and accurately recognise body parts and then find the joint positions [Fig.11]. Giving the joints position is possible to reconstruct the whole skeleton and track its movements. This reconstruction just needs a depth frame
[Fig. 11a] and the cited algorithm. The code able to do this recognition is fast, it takes 5 ms with custom hardware to calculate all the joints position. Although very efficient and not computationally demanding, it lacks of accuracy and precision. The reason for this behaviour, lies on the fact that the reconstruction frame by frame is accomplished by a supervised classifier. As most of the supervised classifiers, it is fast and robust but not accurate.
Precisely the Kinect is shipped with an on board classifier. It was built using a dataset of around 500k frames with different people of different height and
Fig. 9 IR speckles recorded with an IR camera.
weight, doing different movements such as: driving, dancing, kicking, running, navigating menus, etc. [25] This training data provides with a supervised segmentation of the bodies depicted on the frames [Fig. 11b]. The classifier was trained with this database in order to learn the way the segmentation must be performed.
A randomised decision forest (a multi class classifier) was used and efficiently implemented on the GPU. It is basically an ensemble of decision trees. Each tree is composed by different split and leaf nodes. The split node is defined by a feature and a threshold. The tree splits in different branches, and the number of branches per split is always two, the feature can be more, or less and equal than the threshold. The node leaf represents the end of a branch and it means there will be no more splits. Moreover it represents the result of the classification. To classify a pixel x of an image I, the algorithm starts with the first splitting rule called the root, and once evaluated the comparison with the threshold the classification can go either in one direction or in the other. For instance [Fig. 12] Using the average among different trees, the classifier becomes enough accurate to be the final classification method. The selected features are simply neighbour pixel comparison. To classify pixel x in image I, one starts at the root and repeatedly evaluates Eg. 1, branching left or right according to the comparison to the threshold µ. At the leaf node reached in tree t, a learned distribution
Pt( c |I , x) over body part labels c is stored. The distributions are averaged
together for all trees in the forest to give the final classification:
Once obtained the body segmentation a weighted mean is applied to all the classified pixels and thus it results in the 3d joint position.
!
!
This method has two main issues apart from accuracy and precision. The final skeleton does not have any accordance among frames, therefore the skeleton representing the same person in different frames, changes its shape extending and shortening body segments length. This length modulation happens because for each frame is considered as a per se classification case. Furthermore each skeleton joint throughout all the recording moves without any constraint, causing instant velocity out of the human range.
In this thesis is provided a new approach, which solves these issues.
!
For the sake of clarity, the precision and accuracy provided by the most common motion capture devices such as the VICON system, do not suffer of these kind of problems, but result to be at least one or two orders of magnitude more expensive.
Fig. 11 Representation of the three steps around the Skeleton detection:
starting from the 3D points of the body (a), the algorithm segments the body (b) and finally with a weighted average it obtains the Skeleton (c).
!
3. Method
!
In this chapter the state of the art that strictly relates to the upper limb detection and rehabilitation assessment will be briefly described. Its limits will be discussed and finally methods for overcoming these limits will be proposed.
!
!
3.1 State of the art in upper limb detection
!
Following its release in 2010, a series of publications discussed the use of the Microsoft Kinect for rehabilitation purposes [26][27][28][29][30]. This new device first introduced the field of upper limb recognition for rehabilitation. Despite the great enthusiasm around this new topic, the results were not satisfactory. The inadequate accuracy of the skeleton detection algorithm provided by Microsoft, does not permit the use of the system for rehabilitation assessment. As proven by [24] the error in the angle measurements reached during acquisitions of different poses lies between 5 and 10 degrees. This magnitude precludes the use of the Kinect and its own algorithm for rehabilitation assessments.
The reason behind this lack of accuracy resides in the chosen algorithm for the segmentation and identification of the skeleton. It is a decision tree classifier, which ensures high robustness: given an input it returns an output similar to the output desired, but that is not optimal.
This system is able to find a series of variables each representing a joint, as shown in the list below [Tab. 1].
Tab. 1 List of the joints detected by the Kinect
Left shoulder Left ankle Right shoulder Right ankle Left elbow Left foot Right elbow Right foot Left wrist Left Hip Right wrist Right hip Left hand Left knee
This thesis focuses on the field of upper body rehabilitation, thus only the left column was considered. The frame rate for the skeleton stream is not precise and is around 30 fps.
!
!
3.2 Proposed method
!
The proposed method consists of adopting a morphological classifier instead of the decision tree classifier. The body can be identified by studying the shape of the cloud point recorded by the sensor. The arm, trunk and head can then be identified from the shape of the body and from its invariant features. Given some assumptions, the optimal identification is sought. The assumptions for instance are the position of the gleno-humeral joint in relationship with the external shape of the shoulder or the position of the centre of the thorax. These assumptions are represented as parameters inside the algorithm.
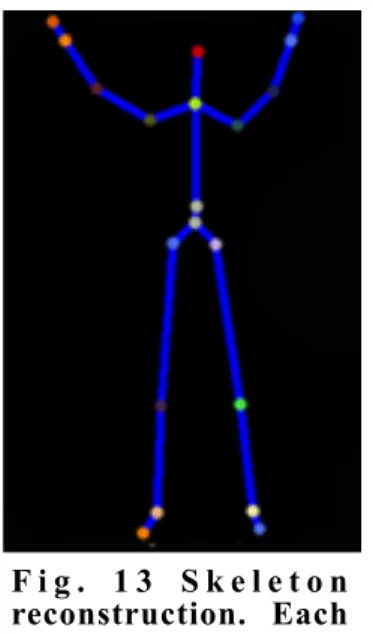
The line of reasoning underlying the algorithm entails obtaining the body segments lengths, then analysing the surface exposed to the sensors and extrapolating the contour. The contours give information on the direction of the segments. Given the body segments lengths and the directions, it is then possible to create the skeleton model and track joints movements.This work takes advantage of the low cost and high resolution capabilities of the Kinect. The direct role of the latter is to acquire the depth data of the scene and send it to the PC. Once the data is received, the PC and the algorithm running on it, are then used to reconstruct the enhanced skeleton [Fig. 13].
In order to perform the reconstruction and to control the data flow, the system requires the RGB stream, the depth data stream and the skeleton detection made by itself.
The RGB stream is needed to provide a quick feedback on what is occurring in the scene during the shooting. The frame rate is 30 fps, the resolution used is
Fig. 14 Data acquisition system. On the left there is the sensor base device Kinect. On the right the personal computer which stores and analyse the data.
640x480 and all the data is stored in a file. Each pixel consists of 32-bit sRGB vector, thus every second of shooting takes 147 MB of memory (640*480 resolution, 4 values sRGB, 32 bit value, 30 fps).
The depth stream is the raw data needed by the code to run the reconstruction. Each frame of the depth data stream is made up of pixels that contain the distance (in millimetres) from the camera plane to the nearest object at that particular (x, y) coordinate in the depth sensor's field of view (fov). It is provided as a stream of data at around 30 fps. Unfortunately this data does not have a fixed frame rate. The data is thus resampled during the processing to obtain a fixed fps. The resolution was 320x240, the only resolution that allows keeping a frame rate that never drops below 30 fps. The skeleton detection is needed just for comparison with the enhanced skeleton made by the proposed method.
!!
3.3.1 Data gathering
The Microsoft Kinect comes along with the Software Development Kit (SDK). It consists of several tutorials, algorithms and guides for the Application Programming Interface (API). These tools were used during this project to develop a couple of softwares: the ‘Recorder’ and the ‘Reader’.
The former is employed to acquire and log all the data needed for the experiment. The graphic user interface (GUI) is shown in the image [Fig. 15]: The software displays three small windows and four interactive objects. The first window shows a reconstruction of the fov obtained using the depth data. The depth raw data is processed by using the ‘Fusion Algorithm’, also provided in the SDK. It basically takes the 3D raw data (scattered points in the 3D space) and makes a 3D model, shaping the surfaces and imposing lights and shade [31]. This function is useful for giving a clear feedback on how accurate the depth data is, showing possible occlusions and objects out of the fov. Using the slider sited below, it is possible to set the distance after which the software does not acquire any points.
The second window displays the RGB video stream. It shows the fov with real RGB colours. This RGB stream is used during the final stage of comparison between the different motion capture systems. It shows the performed movements during the experiment. The third small window shows the Kinect skeleton consisting of bones drawn as green sticks on a black background. In case of occlusion the Kinect skeleton detector is also able to predict the position of some joints. In this case the joints are highlighted in red.
The four interactive objects are: a slider for adjusting the maximum depth acquired, a box with the subject name, a button for starting the recording and a button for terminating the recording. Clicking on the start button the software creates three different files. All of them are named starting with the string input in the box, and ending with ‘_depth.daT, ‘_RGB.daT and ‘_skel.txT.
The ‘_depth.daT file contains the maximum depth value as the first value; then all the depth frames preceded by the time instant of the frame. The ‘_RGB.daT and the ‘_skel.txT files hase the same format except for the first value of maximum depth.
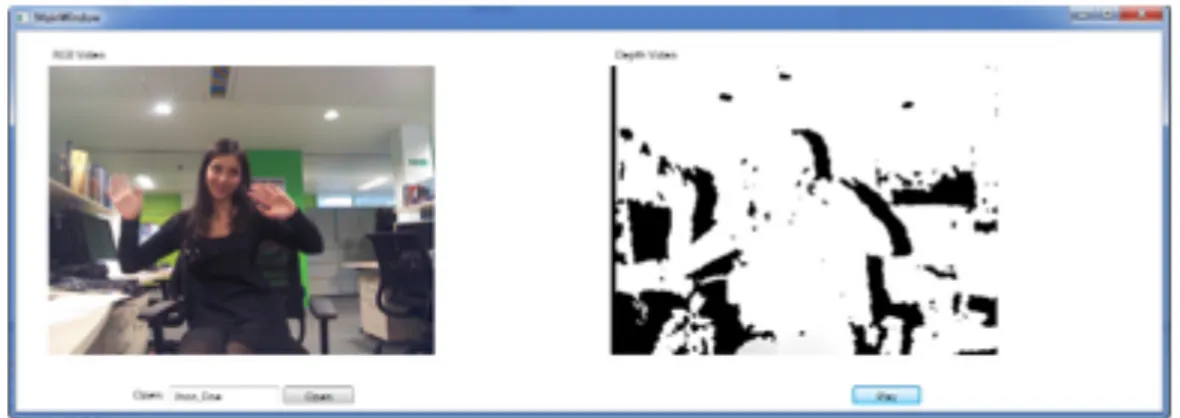
The first two files can be read with the second software, the ‘Reader’. This software has a GUI, shown in [Fig. 16], composed by two main windows and a few control objects. Once the subject name has been written in the box and play has been clicked, the software reveals the ‘_depth.daT and ‘_RGB.daT content: the depth data is shown as a greyscale image, the lighter the pixel, the closer it is to the camera; and the RGB stream.
!
3.3.2 Data processing
The data processing covers the central part of this thesis. It consists in analysing the raw data and detecting the subject and his movements. As a result this algorithm provides with a new enhanced skeleton, with the same shape of the Kinect skeleton, but more precise and accurate.
The data processing is divided into three parts: preprocessing, calibration and execution [Fig. 17].
The preprocessing phase is necessary to prepare the data for next stages. The calibration calculates the upper body segments length. The execution tracks the joints movements and creates the final skeleton. In order to track the joints movements, the code first calculates the body segments length, then it finds the segment directions through the body contour. The algorithm thus having distance and direction can find joint position for each frame.
The input of the system is the raw depth data. It consists of a set of point, commonly called point cloud, that represents the 3D position of all the detected IR speckles. It comes as x,y,z coordinates. The data coordinate system is the Kinect coordinate system, the x, y, and z-axes are the body axes of the depth sensor. This is a right-handed coordinate system that places a Kinect at the origin with the positive z-axis extending in the direction in which the Kinect is pointed. The positive y-axis extends upward, and the positive x-axis extends to the left.
!
3.3.2a Preprocessing
The preprocessing phase is a step repeated throughout the whole data analysis and takes into account the cleaning, integration and under-sampling of each frame [Fig. 18].
The data needs to be clean from all the background and table points present in the recording. To accomplish this task the first value of the ‘_depth.daT file, the maximum depth value, is read and used as a threshold to ignore all the depth values greater than its value. This comparison is sufficient to eliminate the background points.
In order to work with the data representing the upper body, the table must be cut off from the scene. The table represents the SITAR system. The latter is always present throughout all the registration and in order to perform a good joint retrieval, it needs to be identified and eliminated from the data. Before starting the experiment and after the Kinect is placed in the appropriate spot, the algorithm requests a recording with the only table in the fov. In this registration, once cut out the background, the table only is represented in the data. It is then possible to extract three points from the table surface and create the model of the plane, parallel to the table. Thanks to this plane is possible to obtain the body out of the point cloud comparing the y coordinate of each point: if it results smaller than the correspondent in the plane the data point will be eliminated, otherwise it belongs to the body. [Fig. 18]
Thereafter the integration phase consists in banding together the three frames. This step solves an intrinsic lack of precision of the depth sensor, which do not cover all the scene homogeneously with the infrared speckles. Merging three frames permits to fill most of the holes left.
Following this step, the great amount of points needs to be decreased. Therefore the data is skimmed by an under sampling phase. The mechanisms thanks to which this was possible is a first subdivision of the space in a set of small cubes
ci (with i=1,2,3,…,C and C number of cubes in all the space). For each cube ci,
(with k=1,2,3,…,N; N number of raw data points that are lying inside the cube
ci), the value pi1 can be calculate as follows:
!
Then the values pif where f = 2,3,4,5,6,7 respectively are the points found inside
the cube ci and most distant from the centre in direction of each of the 6 face of
the cube. Choosing the right length of the cube side is possible to modulate the total number of cubes and eventually the total number of final points involved in the analysis. Moreover this method permits to keep the spatial high frequency of the data in contrast with using the only average. The sides length cannot be less than the maximum accuracy of the Kinect. The number of points per cube are not always seven, but it depends on how many points are in the cube. If no one points is placed inside the cube there will be no points in the final cube.
!
Fig. 18 Flowchart of the preprocessing phase.
Fig. 19 a) Raw data after background elimination. b) under sampled data after table elimination
!
3.3.2b Calibration
The main purpose of the calibration phase is to gather information about the upper body segments of the subject [Fig. 20]. The procedure that follows, is repeated for every frame recorded for the calibration. In the calibration shooting the subject is asked to hold a certain pose for the whole recording. The body segments lengths obtained at the end of this phase are eventually averaged. All the data in this stage represents the upper body, except from some possible outliers. In order to find the body segments length, the subject is asked to keep a particular posture [Fig. 24] This posture helps the algorithm to recognise the trunk, shoulders elbows and hands. The first step consists of classifying the data in four classes: the torso, the head, the left arm and the right arm.[Fig. 24d,e] This step is known in literature as segmentation of the data. In this project the segmentation is performed using a morphological analysis. As already mentioned, the segmentation in the Microsoft Kinect skeleton algorithm is performed by a supervised classifier. The morphological analysis has the perk of being more accurate and precise, but it lacks in efficiency. Currently it is not possible to run it online with the recording.
The morphological segmentation starts by classifying the torso points. The line of reasoning is creating a model of the trunk using a paraboloid that, fitting on the torso, is able to cut off the arms and the head.
Before the trunk fitting, a first attempt of detecting the head is performed. This detection is an attempt to find the head although it cannot be enough. This process relies on the Kinect perspective: since the neck is occluded by the head [Fig. 24e], a clustering classification can isolate the head from the body recognising the vacuum between the two points agglomerates. The head recognition can speed up the following steps and avoid other classification mistakes. In case the neck is not completely occluded and the clustering classifier does not divide the points between body and head, the paraboloid will do it as follows.
In order to find the right trunk model, the algorithm firstly considers a slice of data right above the table: all the data having the y coordinate below a certain threshold T composes the slice. The slice thickness t is usually a percentage of the upper body height (i.e. 5%). It directly relates to the mentioned threshold by the equation[Eq. 1]:
t = T - ytable .
!
Because of the protocol, three body part are present in the slice: the hands lying on the table and a slice of the trunk [Fig. 24]. A clustering phase is then used to
gather the different points in three different classes. The cluster with the centroid lying in the middle of the other two is the trunk cluster and it is used to initially create the trunk model. The clustering method is the hierarchical clustering. It is a clustering method which creates clusters agglomerating the observations ( the cloud points ) in different steps. Each step represent a level of the hierarchy. The initialisation of the clustering links each observation to a different class. Pairs of clusters are merged as one moves up the hierarchy. At the top of the hierarchy there is one single cluster gathering all the points. The merges are determined in a greedy manner. The result can be represented in a dendrogram.
Each agglomeration occurs at a greater distance between clusters than the previous agglomeration, and one can decide to stop clustering either when the clusters are too far apart to be merged (distance criterion) or when there is a sufficiently small number of clusters (number criterion).
The algorithm consists of three steps:
1. Calculate the distance among the clusters
2. Clusters are merged together two by two if their distance is lower than a threshold
3. The threshold updates its value T=T+ΔT
!
The algorithm ends when all the observation are gathered in a single cluster. Each loop represents a level of the hierarchy and a level of the dendogram. Some commonly used distance functions are[Eq. 2][Eq. 3][Eq. 4]:
!
Euclidian distance:
Squared Euclidian distance:
Manhattan distance:
Fig. 20 Flowchart of the calibration algorithm.
[Eq. 2]
[Eq. 3]
!
In this thesis the first distance function [Eq. 2] is used and the clustering stops when the classifier obtains 3 clusters with at least 500 points each. In order to do that the selected stop criterion is the distance between clusters. The distance inc eases from a small value to bigger values every loop. This method permits to avoid considering outliers points that would lead to a wrong classification.
The trunk slice points are then fitted with a parabola . The fitting is performed using a least square error algorithm able to find the parabola coefficients minimising the distance between the parabola and the points. Given the point di
belonging to the selected slice, the values xi=dix and zi=diz, the parabola formula f(xi) = axi2+bxi+c , and collecting the coefficients values in the set β:{a,b,c}; the
problem is finding the right coefficients values {a,b,c} in order to have the minimum error E [Eq. 5]:
The minimisation can be solved by taking the partial derivative of the error according to the three coefficients and ending with the system [Eq. 6]:
Once solved this system[Eq. 6], the coefficients can be used for the parabola model.
The same tactic is used one more time, but slicing vertically. The points of the vertical slice range between two x values. These x values are selected laterally enough to avoid the head, but within the torso horizontal slice.
Afterwards is possible to combine the two parabolic shapes in one paraboloid [Fig. 18], able to fit around the torso and separate arms and head.
[Eq. 5]
At this stage the head the arms and the torso are classified in 4 different classes, and the segmentation is done.
Once segmented the body, the joint retrieval starts[Fig. 23]. The shoulder joint is assumed to lie n centimetre ( i.e. n=3 ) below the scapula most distal and high point, the acromion. This point approximately lies in the intersection between the arm and the trunk defined by the paraboloid division.
!
Calculating the elbow joint is helped by the advantageous posture the subject is asked to hold by protocol. As shown in the figure, subjecTs arm draw a right angle. Therefore considering the lines which enclose externally and medially the arm (fig), two parabola fitting are applied to find the parabola peaks. The elbow joint is considered the point between the two peaks.
!
Found elbow, the detection is focused on the wrist joint. This step is made simple by a k-means clustering method which easily isolate the hand from the rest of the arm. For this thesis is sufficient to consider the hand cluster centroid as the wrist joint position. The k-means clustering is a clustering method that given a desired number of clusters K, it is able to classify the observation in K classes. The algorithm consists of: given K number of desired classes, the observations xn with n=1,2,3,…,N, the clusters Si(t) (with i=1,2,3,…,K), and a random set of observation {m1,…mK} then called centroids; at the instant t=1
each cluster Si(t) gets a centroid. After this initialisation a loop starts:
1. at the instant t>2, K random xpare considered and each cluster follows the rule [Eq. 7]
2. the centroids need to be updated [Eq. 8]
The algorithm loops until the clusters stops changing their observation reaching the convergence.
!
[Eq. 7]
Finally last step is finding the thorax centre. This is calculated by the algorithm as the point in the middle between the shoulder and the neck base. The neck base is delimited by the first row of points under the head.
!
Fig. 21 Cloud points representing the body surface in blue and the parabola cutting the arms off in green
Fig. 22 a) Bottom body slice, each colour represent a cluster, the hands are recognised and coloured with green and blue, instead the trunk in brown. b) Trunk without the head and with the result of
!
!
3.3.2c Execution
During the execution phase the subject is asked to perform different reaching tasks. The arms, the trunk and the head are moving and the code is capable of tracking this movements and retrieve the joints positions. The execution algorithm analyses each frame and for each one it saves the skeleton reconstruction, which presents the retrieved joints positions.
The algorithm starts with the head detection. This step is accomplished by considering the upper half of the body and applying a k-means clustering. [Fig. 23a]. The head gives two information: the shoulders start point and the thorax upper centre. The latter is defined as the minimum value of the arable fitting on the bottom contour of the head. Even though this point becomes dependent on the head orientation, the eventual filtering and the results ensure the negligibility of this issue.
In order to determine the shoulder direction the algorithm takes into account the points lying out of the domain limited by the neck, as shown in [Fig. 23b.] At this point the algorithm deals with two sets of points: the body points (BL) on the left of the neck and the one on the right (BR). Avoiding the area right next to the neck, the upper closest points to the centre from BL and BR are gathered respectively in STL (shoulder top left) and STR (shoulder top right). Following the upper contour until reaching the same length of the shoulders, the points
Fig. 23 Process for the joint retrieval (clockwise): a) parabola on the neck values; b) check for the head and trunk recognition; c)
shoulder joint centre; d) elbow joint centre; e) arm clustering and wrist centre; f) representation of ally he joints.
under this part of the contour are sited above the glenohumeral joint. Gathering the points above the glenohumeral joints in two sets called SBL (shoulder bottom left) and SBR (shoulder bottom right) is then possible to measure the joints positions CSL and CSR as the centroids of the sets SBL and SBR [Fig. 23b].
Since the depth sensor is sited in a high position, the whole arms are directed in every frame towards a position in the lower part of the fov and closer to the sensor. Therefore sorting the points according to the y coordinate and then moving on the contour from the shoulder joint to lower points, the elbow joint is reached after a distance from the shoulder equal to the arm length measured during the calibration. Gathering the most external point at the level of the elbow and calculating the centroids CEL and CER as shown in [Fig. 23c], the
elbows joints position is given by CEL and CER respectively the left elbow and
right elbow positions.
3.3.2d Post-Processing
The phase of post processing is needed as the last step of the data analysis. The raw signal i composed by the useful signal and noise. It has been assumed that that the noise does not have any particular shape and can be considered white noise with a standard deviation depending on the distance of the target from the sensor. The final joints position and the reconstruction of the skeleton carry the initial white noise. Using a moving average filter is considered suitable in order to give back the mean value of the signal windows. If the resulting signal is affected by a bias, it does not affect final result because it will be analysed considering its variation and not its singles values. Namely the result takes into account the variation of the angles and not the particular joint position.
Before performing the moving average filtering, two essential operations are executed: the outliers elimination and the interpolation.
The outlier elimination is extremely useful when the data stream coming from the Kinect brings errors, especially when the stored frames result corrupted and a part of the data is missing. In the following image a typical example is shown. [Fig. 24].
The code is able to analyse ally he frames, also the corrupted ones. It always gives back the skeleton reconstruction. When a corrupted frame intervenes the skeleton reconstruction is obviously abnormal. In [Fig. 25] the presence of corrupted frames is identifiable by the outliers present in the signals.
In order to identify each corrupted reconstruction and the outlier joint position, the analysis of the shifting of each frame between one frame and the consecutive. Given a maximum moving speed of vmax = 0.5m/sec, it is possible
to calculate the speed limit between one frame at the time instant ti and one at the time instant ti+1 proportionally to the sampling frequency
!
0.5m/sec = x/ (ti+1-ti)
!
All the joints that overcome the maximum movement of length x at the time instant ti+1 s will be replaced with a joint position weighted mean of the same joint at the time instant ti and time instant ti+2. Using this technique the final joint respect the old position and the moving direction of the follower.[Fig. 25] Canceled all the outliers, the linear interpolation function is executed in order to get a signal with constant sampling frequency of 30 Hz though out the signal, and not oscillating between 27 and 33 Hz like the data coming straight from the Kinect.
The linear interpolation of a discrete signal S:[Y(T1),Y(T2),..Y(TN)] consist in creating a continuos signal s=y(t) made by a polygonal chain, whose corners are
the original values of S and are placed in correspondence to the time instant Ti when the frame was recorded. Three polygonal chain are created for each joint, each representing a coordinate. Finally the signal is resampled with the desired frequency and from the continuous signal s it is possible to move to the discrete signal S whose time instants Ti are different from Ti and such that (Ti+1-Ti)-1=30, the desired sampling frequency [Fig. 25].
!
Fig. 25 a) 3 black lines related to the wrist coordinates before the outliers elimination; 3 coloured lines related to the wrist coordinates after the outliers elimination. b) the effect of the moving average.
x y z x y z
!
4. Experiment
!
4.1 Setup
!
The project took advantage of the facilities provided by Imperial College. It has been used a laboratory equipped with the Microsoft Kinect depth sensor, the VICON motion capture system and finally the SITAR [Fig. 26]. The structure is also furnished with the emergency first AID kit and an emergency plan in case of subject injury.
!
The VICON system consists of ten high resolution cameras ( version MX40) : two fixed on the wall and seven movable by the operator. Each of the seven cameras is provided with a three degrees of freedom tripod with adjustable height. The cameras sample with a frequency of 150 Hz. The huge amount of data coming from the ten cameras is stored in a stack of processing machines. The output of the stack is the 3D position of the markers for each frame. This output is sent to a PC running the VICON software called Nexus. The software gives the tools to label the markers and to reconstruct their movements across all the frames. The software is also needed during the cameras calibration and during the setting of the origin of the VICON coordinate system. Moreover the