DISI - Via Sommarive 14 - 38123 Povo - Trento (Italy)
http://www.disi.unitn.it
REPRESENTATIVENESS AND
DIVERSITY IN PHOTOS VIA
CROWD-SOURCED MEDIA
ANALYSIS
Anca-Livia Radu, Julian Stöttinger, Bogdan
Ionescu, María Menéndez and Fausto
Giunchiglia
July 2012
Technical Report # DISI-12-026
Also in: “10th International Workshop on Adaptive Multimedia
Retrieval - AMR 2012, October 24-25, Copenhagen, Denmark,
2012”
Representativeness and Diversity in Photos
via Crowd-Sourced Media Analysis
Anca-Livia Radu1,2?, Julian St¨ottinger1, Bogdan Ionescu2, Mar´ıa Men´endez1, and Fausto Giunchiglia1
1
DISI, University of Trento, 38123 Povo, Trento, Italy
2 LAPI, University ”Politehnica” of Bucharest, 061071, Romania
{radu,julian,menendez,fausto}@disi.unitn.it [email protected]
Abstract. In this paper we address the problem of user-adapted image retrieval. First, we provide a survey of the performance of the existing social media retrieval platforms and highlight their limitations. In this context, we propose a hybrid, two step, machine and human automated media analysis approach. It aims to improve retrieval relevance by select-ing a small number of representative and diverse images from a noisy set of candidate images (e.g. the case of Internet media). In the machine anal-ysis step, to ensure representativeness, images are re-ranked according to the similarity to the ”most common” image in the set. Further, to ensure also the diversity of the results, images are clustered and the best ranked images among the most representative in each cluster are retained. The human analysis step aims to bridge further inherent descriptor semantic gap. The retained images are further refined via crowd-sourcing which adapts the results to human. The method was validated in the context of the retrieval of images with monuments using a data set of more than 30.000 images retrieved from various social image search platforms.
1
Introduction
The people’s desire to try to preserve important moments in their lives has led to a fast and continuous growing of online personal digital image collections and to an intrinsic desire for the automatic indexing and searching of these media assets, the so called image retrieval. At the same time, the high number of public image search engines providing an image retrieval system cannot keep up with the tremendous number of available online images. They have certain limitations since most of them rely on keywords-based and/or GPS-based search. Keywords-based image search is inspired by text search techniques, relying on the images’ surrounding text (e.g. comments, titles, tags or other description of the images) [1]. But the surrounding text is not particularly accurate, mostly because people usually tag all pictures from a collection with a particular word. On the other hand, GPS-based image search may also lead to bad results, since
?
geo-tagging is not always accurate and typically doesn’t refer to the position of the query object, but to the position of the photographer. Thus, most of the time, when we type a keyword or a set of GPS coordinates into an image search engine, images are not perfectly returned in a descending order of their representativeness or, even worse, some of them are not related to the subject at all.
Research efforts have been made towards developing re-ranking techniques in order to solve the above-mentioned search limitations. Most of the existing re-ranking methods only try to refine the retrieved images. Though, users are interested in taking possession of not only accurately representative images, but also diverse images that can depict the query object in a comprehensive and complete mode, covering different aspects of the query. In this respect, we pro-pose the following approach: given a query term and a set of GPS-coordinates (latitudes and longitudes) we aim to select a small set of most representative and diverse images that image search engines can provide us. The procedure consists in an automatic media image analysis that uses only visual information in im-ages. In order to finally maximize results’ refinement, a crowd-sourcing process is performed, since perfectly translating the query-text or query-coordinates to a semantic meaning is yet unreachable. Our method assumes that among the downloaded images, a big amount depict the subject in a clear way. Another assumption that we make is that a big part of the best images retrieved from the image search engines are among the first returned.
The remainder of the article is organized as follows: Section 2 discusses related work and situates our approach accordingly. Section 3 analyses the limitations of the existing image search engines. Section 4 presents the proposed approach for selecting a representative and diverse set of images. Experimental validation is presented in Section 5, while Section 6 concludes the paper.
2
Related work
There are a number of specific fields like re-ranking, relevance feedback and automatic geo-tagging that are related to our work. The papers concentrating on re-ranking are the closest to our work. For instance, the approach in [2] builds clusters of images and then ranks them according to ratio of inter-cluster distance to intra-cluster distance and according to cluster connectivity. Inside each cluster, images are ranked according to the similarity with images from the same cluster and dissimilarity to random images outside the cluster. A similar approach [3] considers to be representative images that are most similar with images in the same cluster, but different to images in an external class build by using, e.g. a keyword-based search for word ”test” on Flickr. In [4], the proposed method measures the “visual consistency” among the images and re-rank them on the basis of this consistency. In other words, a probabilistic model is learned in an unsupervised manner and given the learnt model, the likelihood ratio is computed for each image. This ratio will be used to rank all the images in the data set.
Relevance feedback (RF) is another tangent domain to our work to which a high interest has been given in recent years. A typical RF scenario can be formulated as follows: for a certain retrieval query, an user provides feedback by marking the results as relevant or non-relevant. Then, using this information, the system re-computes a better representation of the information needed. One of the earliest RF algorithms attempts to update the query features by adjusting the position of the original query in the feature space according to the positive and negative examples and their associated importance factors [5]. More recently, machine learning techniques have been introduced to RF, e.g. Support Vector Machines, classification trees or boosting techniques. In this case the RF prob-lem can be formulated as a two-class classification of the negative and positive samples.
The availability of GPS-enabled cameras triggered the interest in validating automatic geo-tagging techniques, i.e. providing automatic GPS localization of recorded media using text and visual features (see MediaEval benchmarking -Placing task [6]). In [7], a combination of textual and visual features are employed for trying to decide which of ten landmarks in a certain city is the subject of an image. In order to do that, for each of the ten landmarks, a classifier is build with positive examples images of a given landmark and negative examples images from other landmarks. A similar approach is presented in [8] in which a prediction of geographic location using a nearest-neighbour classification visual features-based is employed. The method is limited to a sub-set of images tagged with at least one area name.
The approach proposed in this paper is at the intersection of these three fields, but goes beyond the state of the art along these dimensions:
– diversity: adding the diversity requirement to the existing re-ranking meth-ods;
– enabling better crowd-sourcing: providing a quality starting point to a future extended crowd-sourcing study;
– representativeness: providing users not only with correspondence between images and locations, but also with a set of representative and diverse images for each location in order to obtain a clear and complete understanding. The novelty of our method with respect to the three adjacent fields is also enhanced by its cultural aspect with a practical use: selecting a small number of representative and diverse images for a high number of Italian monuments may prove of high interest in tourist world. In the same time, Section 3 is the first published study about possible retrieved mistakes in search engines which emphasizes the drawbacks of the existing textual and location image search platforms.
3
Image Representativeness
In this section we present a detailed study of the actual performance of the existing social image retrieval platforms. For exemplification, we have selected
three of the most famous: Picasa, Flickr and Panoramio. As case study we use the application domain of this work - the search of Italian monuments. We search for images of monuments using both keywords (e.g. name of the monument) and GPS tags (retrieved from Wikipedia). For practical reasons we limit to retaining only the first 100 retrieved images for each of the three image search engines. At a simple inspection of the retrieved images, we can sustain that accurate pictures of an object and/or place can be made both during day and during night and also can use different viewpoints, scaling and orientations, as long as they depict the subject in a clear and distinctive way. Regardless the accurate text tags and GPS localization, the search engines tend to fail due to the following situations:
(a) (b) (c) (d) (e) (f )
(g) (h) (i) (j) (k) (l)
Fig. 1: Exemplification of possible occurring mistakes (letters correspond to the cases presented in the text). Image sources: Picasa, Flickr and Panoramio
(a) People in focus: Pictures with people visiting the inside or the outside of the monument, but with no monument in it (Figure 1a). This mistake is caused by the inaccurate images’ surrounding text made by people who tag an entire album photo with a particular word. For this reason, three different images, one containing a representative view of the monument, the second one a person totally occluding the monument or standing close of it and a third one a person inside of the monument will probably receive same tags. (b) People in front: Pictures with people in front of the monument (Figure 1b). People appear in images depicting monuments because of the inaccurate im-ages’ surrounding text and also because it is difficult to capture monuments with no person on the image. Some monuments are very famous, others are less famous, but they all attract visitors.
(c) Unfocused images: Pictures with a far sight of the monument (Figure 1c). When the photographer is taking a distant shot or a high altitude shot of a monument, he can add or modify the GPS coordinates and most of the times he will geo-tag the image with the GPS coordinates of the monument, even
though the image depicts only a far sight of the monument. Another reason for this mistake is that images are often tagged with the GPS coordinates or the name of the most famous place/object that appears in the image, even when the image is not focused on it.
(d) Reproductive art objects: Pictures with drawings, posters , paintings or sculptures of the monument (Figure 1d). Most likely, images that contain reproductive objects of a monument will be assigned the name of the mon-ument among other tags, causing a confusion and thus this type of mistake to occur.
(e) Surrounding or inside map: Pictures with inside maps of the monument or maps with the region where the monument is located (Figure 1e). Images containing maps of a place are usually tagged with the name of that place and thus retrieved when searching a monument by its name.
(f) Advertising: Books, postcards, articles, tickets or other similar writings or objects related to the monument (Figure 1f). Inevitably, most of the images with writings about a monument will be accompanied by surrounding text containing words related to the monument.
(g) Inside pictures: Pictures of monuments’ interior (Figure 1g). The first cause for this mistake involves people usually tagging all images taken dur-ing a visit to a monument with one word, regardless the images’ content. The second reason refers to the fact that both the photographer and the inside of the monument being photographed have the same location and will be correctly geo-tagged with the GPS coordinates of the monument, but incorrectly retrieved when searching for images with the monument. (h) Detailed images: Pictures with only small parts of the monument (e.g.
statues, different objects from inside or outside of the monument, etc.; see Figure 1h). The cause of this type of mistake is the same as for the previous case.
(i) Accommodation and restaurants: Pictures with hotels and restaurants to go to during the monument visit (Figure 1i). This mistake appears be-cause images with hotel rooms or restaurants in the vicinity of monuments are tagged with names of monuments since the owners make use of their names to attract customers, because it can happen for some hotels or restau-rants to be close enough to the monument to fit into the search radius or because the atmosphere of people’s vacation is highly influenced by both hotels and restaurants and people upload images containing them but add tags containing the name of the monuments.
(j) Other places: Pictures with different places close to a certain monument but with no monument in it (Figure 1j). The reason of this mistake is the
inaccurate tagging of places located or not in the vicinity of the monument caused by people who just simply make use of the monument’s name to de-scribe their photos.
(k) Other monuments: Other monuments located in the same region or not, some of them belonging to the same category of monuments (Figure 1k). The reasons for this type of mistake can be the coincidence of names be-tween two different monuments or the use of the name of the monument of interest for describing, comparing other monuments.
(l) Meaningless objects: Pictures with objects that have absolutely nothing to do with the monument (Figure 1l). This is the most general error that can occur when searching for images with monuments and it is based on all the causes previously described: inaccurate text-based image search because of the poor correlation that exists between surrounding text and the visual image content and also inaccurate image search by GPS coordinates since manually or automatically geo-tagging do not consider the content of the image.
4
The proposed approach
To address these issues and to qualitatively refine the results, we use the following approach:
– extract from the Internet the target photos for a certain query. We aim to select a set of candidate photos;
– perform a fully automated image analysis whose goal is to select a subset of most significant and in the same time diverse images;
– perform the final refinement on the remaining set of photos via crowd-sourcing.
Each step is presented in the sequel.
4.1 Selecting the monuments’ photos
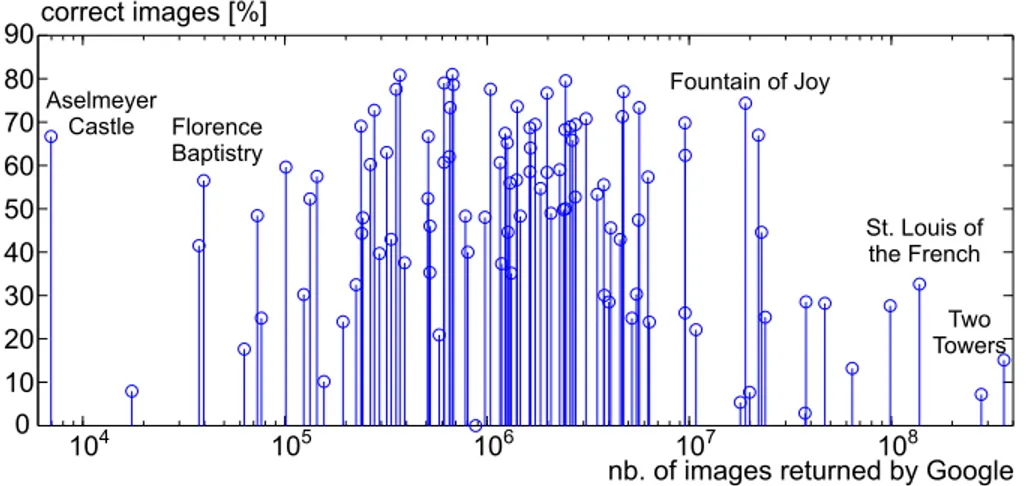
Following the study in Section 3, we further try to define and classify monu-ments from most prominent to least prominent and then to establish a con-nection between these attributes and each type of mistakes listed in Section 3. Thus, we define a monument as being prominent if the listing of returned images’ number on Google is significant (query is performed using keywords). Figure 2 depicts for the entire list of 100 monuments the percentage of correct images returned by the 3 image search engines (Picasa, Flickr and Panoramio) versus the prominence of the monuments, namely the number of images returned by Google. Therefore, the least prominent three monuments in the list are “Victor Emanuel II”, “Aselmeyer Castle”, “Papal Archbasilica of St. John Lateran” with 2.270, 6.970, 16.000 number of returned images and the most prominent three
104 105 106 107 108 0 10 20 30 40 50 60 70 80 90
nb. of images eturned by Googler correct mages [%]i Fountain of Joy Aselmeyer Castle Florence Baptistry St. Louis of the French Two Towers
Fig. 2: Monuments’ prominence: percentage of correct images returned by social image sharing platforms vs. number of images returned by Google (on a
log scale).
monuments are “Two Towers”, “New Gate”, “Juliet’s House” with 361.000.000, 279.000.000, 98.800.000 number of returned images. The most handy assump-tion that someone can do is that most prominent monuments will bring almost only representative images when searching them by keywords. Before trying to adopt or reject such an assumption, lets try first to make a simple analysis of the monuments’ names. It easily leads us to considering three categories of names for prominent corresponding monuments on Google:
- names that contain common words which coincide with aspects/objects from real life. In this case, the returned images when searching monuments by key-words will present many shots of monuments’ homonyms and less shots of the real monuments. The most handy examples are “Two Towers” (many pictures with shots from “The Lord of the Rings: The Two Tower” movie or pictures with other two towers) and “Saint Mary of the Flower” (pictures with statues of Saint Mary or different flowers);
- names that are not sufficiently precise so that the returned images to make reference to a single monument, but to worldwide monuments. The simplest ex-amples are “Cathedral Square” (pictures with different cathedrals’ squares) and “Fountain of Joy” (pictures with several fountains or with people having fun). For these two examples, there are, definitely, many cathedrals which have frontal squares, or many fountains that gather people and joy. These cases of ambiguity lead to inevitable random results among the returned images;
- names that mostly contain simple distinctive nouns that are known world-wide. As example we can mention “Pantheon” and “Verona Arena”. In both cases, when searching images by keywords, we obtain a relatively high number of representative images. It is obvious that the number of images returned for
prominent monuments is larger than the less prominent monuments, but the as-pect that interests us in the first instance is the quality of images. A conclusion on this aspect is given by the above classification. For the first two categories, the quality of the returned images is not sufficiently high. On the other hand, for prominent monuments in the third category, the returned images are not just many but also of high quality. Differently from the prominent monuments, some names lead to classify the corresponding monuments in low prominent for two main reasons:
- names contain complex words combination and the probability oh having im-ages tagged with all these words is small. The most handy examples are “Basilica of Our Lady Help of Christians” and “Santa Maria della Spina”;
- names contain simple, but distinctive nouns that are not very known for peo-ple.We can mention as examples “Aselmeyer Castle”, “Basilica di San Zeno” and “Garisenda Tower”.
4.2 Automated image analysis
The proposed method tries to select from a given set S of N noisily ranked images returned by social image search engines (search performed by keywords and GPS-coordinates) the best representative images that will present the query subject in a diverse manner. The following mechanism is employed:
– Step 1: The first step consists of determining, for each of the N images in set S, a description of the underlying visual content. Considering the appli-cation of our approach (retrieval of monuments pictures), we use color and feature descriptors for representing images by 92 dimension feature arrays as a combination between Colour Naming Histogram [9] (11 components) and Histogram of Gradients (81 components). Then, to assess image similarity, we compute the Euclidean distance between their corresponding feature ar-rays. Further, we construct a Synthetic Representative Image Feature (SRI) by taking the average of all distances.
– Step 2: Furthermore, for each image, Ii, the average between the Euclidean
distances to the rest of (N-1) images in the set is computed, resulting a global array of N average values. The value of SRI is subtracted from the new array which is further sorted in ascending order and the position of each value in the sorted array will be the new rank to the corresponding image. – Step 3: Considering the second assumption that our algorithm makes
re-garding most of the best downloaded images being among the first returned, the final ranking of images will consider both the initial ranks given by the image search engines and the new ranks computed at Step 2. Thus, the av-erage between the two ranks of each image is computed, resulting another array of N average values. The new array is sorted in ascending order and images will be arranged according to their final position in the sorted array.
– Step 4: All re-ranked images are clustered in M clusters using k-means method. The value for M has been experimentally chosen to 15 in order to get the best results.
– Step 5: For the set of images inside of each cluster Cj, j = 1, ..., M , steps
1, 2 and 3 are reiterated and the SRIj value is computed for each
clus-ter and images are re-ranked according to their similarity with it. In this way, first ranked image in each of the M clusters is considered to be the representative image for its cluster. Totally, there will be M such images (RIj, j = {1, 2, ..., M }).
– Step 6: From all the M representative images for the clusters, a small set of best ranked images (ranking according to the final rank computed in Step 3) will be chosen as the representative and diverse images for the set of N images.
4.3 Crowd-sourced image analysis
A pilot crowd-sourcing study was performed in order to qualitatively quantify and also perform a final refinement on the the results obtained in the automated image analysis process. The study aimed at assessing the level of representative-ness and diversity of the selected set of images. The selected set of 701 pictures related to 107 Italian monuments were annotated and clustered by twenty-one participants (15 masculine, mean age = 31.6 years) of a local Italian University. Participants were rewarded with a coupon.
The study consisted of two tasks. For the first one, participants were asked to annotate with “1” all pictures which showed, partially or entirely, the outside part of the monument. Pictures containing people were accepted if the outside of monument, or part of it, was clearly depicted. Participants were asked to annotate with “0” all pictures which did not show, partially or entirely, the out-side part of the monument. Alternatively, participants could indicate they could not decide whether the picture contained the outside part of the monument. Comments could be added to all the annotations. For each monument, an ex-ample image was provided for reference. The exex-ample image was chosen by the researchers and represented a prototypical image of the monument. For the sec-ond task, participants were asked to cluster images annotated as representative. Pictures belonging to the same cluster should depict the monument from the same perspective and share light conditions. At the end of the study, users were asked to fill in a short questionnaire where issues related to task design were addressed.
5
Experimental results
As previously mentioned, to validate our approach presented in Section 4, we use a particular application domain that is the search for pictures with Italian
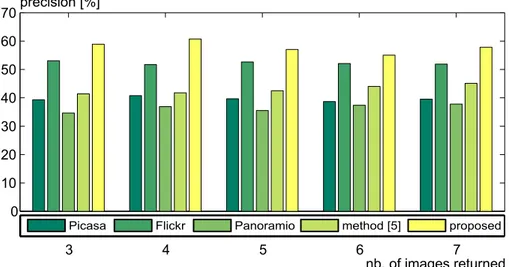
3 4 5 6 7 0 10 20 30 40 50 60 70precision [%] nb.of imagesreturned
Picasa Flickr Panoramio method [ ]5 proposed
Fig. 3: Performance comparison.
monuments. We use a data set of over 30.000 images retrieved from Picasa, Flickr and Panoramio using both keywords and GPS based search. We use 107 Italian monuments locations, from the least known to the grand public to the most famous ones.
5.1 Representativeness results
The first validation experiment consists on assessing the representativeness of the images from the precision point of view:
precision = tp
tp + f p (1) where tp is the number of true positives and f p the false positives. A ground truth was determined by manually labelling all pictures in the data set. This task was carried out by an expert with extensive knowledge of these particular monument characteristics and localization. Figure 3 compares the results obtained with the proposed approach against the initial retrieval given by the three image search engines and the approach proposed in [2]. Experiments were conducted for a manageable number of returned images varying from 3 to 7. The best precision is obtained for 4 images - 60.7% - while the lowest precision is around 55% (in the case of 6 images). There is a slight tendency that the precision may decrease by the number of images. Globally, there is an obvious improvement over the approach in [2], ranging from 11% to 19%; and also compared to the initial retrieval, e.g. more than 16.3% for Picasa, 2.9% for Flickr and 17.6% for Panoramio, respectively.
In-line with the statements in Section 3 we assess the precision also according to each category of prominence (for exemplification we use the case of 7 images).
Fig. 4: Results - Palazzo Pubblico. Image sources: refference Wikipedia; others Picasa, Flickr and Panoramio
Fig. 5: Results - Egg Castle. Image sources: refference Wikipedia; others Picasa, Flickr and Panoramio
We obtain very interesting results as for the least prominent monuments the precision is up to 70.8%, for average prominent monuments is around 63.3% while for most prominent ones is only 25% (the monuments were divided in these categories based on the number of images returned by Google search -thresholds were set empirically, see Figure 2). The accuracy of retrieval in the case of prominent monuments is significantly lower than for the rest because of their names containing common words, easily mistakable with everyday aspects or objects (see Section 3).
In Figure 4 we depict an example of good retrieval (for ”Palazzo Pubblico” monument and 7 returned images) where images are all relevant snapshots of the target monument. On the other hand, Figure 5 presents a typical case when
the method tends to be less efficient. This is typically the case when among the initial retrieved images very few are representative and the representative ones have no high ranks.
5.2 Diversity results
The second step of the evaluation highlights the precision and the level of completeness in monuments’ view for the diversity part obtained when using a ground-truth built employing a number of 21 people to manually label all pictures in the set. The level of completeness was computed as:
completness = nc
tp (2)
where nc are the total number of clusters that can be obtained from the true positive images.
Thus, the precision obtained when using the crowd-sourcing study is 48.14% and the level of completeness is 88.53%. The level of accuracy is lower than the accuracy obtained using the ground truth built by the expert in Section 5.1. Instead, the diversity in monuments’ images is sustained by the high level of completeness on which all participants agreed. The inter-rate agreement using Kappa statistics was calculated for each pair of participants.
In general, the data indicated a low level of agreement among annotators. The average accuracy was 0.47, with a maximum of 0.78 and minimum of 0.183. In our understanding, the low level of accuracy and inter-rater agreement is re-lated to participants’ different levels of familiarity with the monuments and to the task’s design. The results of the pilot study suggest that participants’ level of familiarity with the monument influences their answers. The description of the task required to annotate with “1” those pictures which showed, partially or en-tirely, the outside part of the example picture of the monument. However, many participants annotated with “1” images which represented the monument from a different point of view, not visible in the example image. A few participants reported to have used external services, such as Wikipedia and Google.
These results reflect the need for better defining the scope of related pictures. Providing an example image can be too restrictive, since it only depicts one point of view. An alternative approach could consist in providing a pointer to a source of information, such as the Wikipedia’s page of the monument. Collecting users’ familiarity with the monument could contribute to the assignment of different levels of trust to the annotations. Although most of the participants reported that the task description was clear (mean = 6.22 in a 7-point Likert scale), some annotations did not follow the instructions. Theoretically, all pictures represent-ing the inside of the monument should be annotated with “0”. However, many participants annotated images clearly depicting the inside of a monument with “2” (i.e., they could not decide whether the picture contained the outside part of the monument). Furthermore, some annotations were inconsistent within par-ticipants (images depicting the inside of the monument were annotated with “0” and “2” by the same participant).
In Figure 6 we depict an example of results obtained using the whole machine and human chain. To have a reference of the improvement, we illustrate the results in the case of the queries presented in Figure 4 (showing a relevant re-ranking) and 5 (showing a case when the media analysis tends to fail due to the limited number of relevant pictures returned by the search engine). One may observe that the refinement of Figure 4 is accomplished by keeping 6 out of 7 pictures as being representative and in the same time diverse for the query subject (Figure 6a). The outlier picture was mostly annotated by people as also being representative, but showing high similarity to another selected picture, thus not contributing in diversity requirement. In this case, the human analysis process tends to increase the diversity among the already representative pictures. On the other hand, the less relevant results from Figure 5 are improved by selecting 2 out of 7 pictures that present the subject in a representative and diverse manner (Figure 6b). In this case, diversity already exists among images and the human analysis process tends to increase images’ relevance.
(a)
(b)
Fig. 6: Final results as machine - human media analysis chain output (a) Palazzo Pubblico; (b) Egg Castle
The machine and human automated media analysis as a whole provides a better mean for adapting the results to the human requirements. In this chain, the automated media part plays a critical role as a pre-filtering step that
dimin-ish the time, pay and cognitive load and implicitly people’s work in the crowd sourcing part. This makes profitable to have the crowd part as an automated human computation step in the whole chain, although expensive (both in terms of time and costs) to run directly on the initial results returned by the search engines.
6
Conclusions
In this article we introduced a method for the selection of a small number of representative and diverse images from a set of contaminated images automati-cally retrieved from several image search engines. It aims to select only images containing correct and complete view of the query subject. In order to maximize the quality of our method’ results from both representativeness and diversity point of view, we have adapted our method to human constraints by means of crowd-sourcing. To this end, we first highlighted the improvements brought by our method to the initial retrieval in comparison to the method in [2] by employ-ing a ground-truth built by an expert and, second, the high level of diversity in images by employing a ground-truth obtained using a crowd-source study (hu-man participants were asked to position the retrieved images in the same cluster if they share the same perspective and light condition). Future work will mainly consists on adapting the approach to the large scale media analysis constraints.
7
Acknowledgments
This research is partially supported by the CUbRIK project, an IP funded within the FP7/2007-2013 under grant agreement n287704 and by the Roma-nian Sectoral Operational Programme Human Resources Development 2007-2013 through the Financial Agreement POSDRU/89/1.5/S/62557.
References
1. Bartolini, I., Ciaccia, P.: Multi-dimensional keyword-based image annotation and search. In: ACM Int. Workshop on Keyword Search on Structured Data, New York, USA (2010) 1–6
2. Kennedy, L.S., Naaman, M.: Generating diverse and representative image search results for landmarks. In: Int. Conf. on World Wide Web, New York, NY, USA (2008) 297–306
3. Popescu, A., Mo¨ellic, P.A., Kanellos, I., Landais, R.: Lightweight web image rerank-ing. In: ACM Int. Conf. on Multimedia, New York, NY, USA (2009) 657–660 4. Fergus, R., Perona, P., Zisserman, A.: A visual category filter for Google images.
In: European Conf. on Computer Vision. (2004)
5. Nguyen, N.V., Ogier, J.M., Tabbone, S., Boucher, A.: Text retrieval relevance feed-back techniques for bag of words model in cbir. In: Int. Conf. on Machine Learning and Pattern Recognition. (2009)
6. Larson, M., Rae, A., Demarty, C.H., Kofler, C., Metze, F., Troncy, R., Mezaris, V., Jones, G.J. In: MediaEval 2011 Workshop at Interspeech 2011. Volume 807., CEUR-WS.org (September 1-2 2011)
7. Crandall, D.J., Backstrom, L., Huttenlocher, D., Kleinberg, J.: Mapping the world’s photos. In: Int. Conf. on World Wide Web, New York, NY, USA (2009) 761–770 8. Hays, J., Efros, A.A.: Im2gps: estimating geographic information from a single
image. In: IEEE Int. Conf. on Computer Vision and Pattern Recognition. (2008) 9. van de Weijer, J., Schmid, C., Verbeek, J.J., Larlus, D.: Learning color names for