1 Phd Course
Agrobiodiversity
Academic Year
2015/2016Temporal and carbon dependent patterns in
gibberellin biosynthesis and growth
Author
Putri Prasetyaningrum
Supervisor
2
Temporal and carbon dependent patterns in
gibberellin biosynthesis and growth
Chapter 1
General background ……….
3
Chapter 2
Growth throughout the day-night cycle and its interaction with gibberellin
and carbon availability ……….
14
Chapter 3
Temporal regulation of gibberellin biosynthesis by light, the clock and
carbon availability ………
30
Chapter 4
Adjusting growth via GA in variable environmental conditions ………….
52
Chapter 5
Summarizing discussion ………..
64
Chapter 1: General background
Plants experience day and night cycles as consequence of the earth’s rotation (Figure 1.1). Due to these daily environmental changes, plants have evolved an endogenous circadian clock that ensures that internal biological processes are synchronized with the day/night cycle (McClung, 2006). During the day, plants derive energy and carbon through photosynthesis. A part of the photosynthates accumulate as starch to support metabolism and growth during the night. An optimal performance of a plant requires the fine-tuning between growth and the available metabolic resources. Metabolic resources clearly vary throughout the day and the night, but also depend strongly on the environmental conditions. Therefore, plant growth probably also varies within and between days. Currently, the underlying molecular coordination of growth control is gradually being elucidated. Growth in the context of size increase is the result of a combination of the increase in cell size and the number of cells. These cells also potentially differentiate and develop into different types of tissue and organs. This also implies that growth and developmental processes are intertwined. Each developmental stage has its own characteristics. For example, at the seedling stage the plants tries to establish autotrophy whereas at the adult rosette stage it is concerned with increasing size to prepare for eventual flowering (Boyes et al., 2001; Yang et al., 2013; Teotia & Tang, 2015).
Figure 1.1. Plants encounter day-night cycles throughout their lifetime. Image credits to Ardhi Yudha Pratama
4 In this thesis, we provided a mechanistic explanation on how the growth stimulating hormone gibberellin (GA) integrates the environmental cues and resource availability to determine growth in variable environments. Specifically, we investigated growth dynamics at the vegetative adult stage (10-leaf) of Arabidopsis thaliana (A. thaliana; Figure 1.2). By looking at this particular stage, we study growth as rosette size increase, and minimize the influence of developmental transitions such as seedling establishment, flowering and seed production. The good reference and widely used plant to study this mechanism is A. thaliana. Over the past 30 years, A. thaliana has become the model species for annual plants. Its favourable genetics and a community effort have led to a nicely curated data of molecular mechanisms derived from this species and implemented in other species and crops such as maize, rice, tomato (Lawit et al., 2010; Tong et al., 2014; Shahnejat-Bushehri et al., 2017). In this chapter, we provide the background information and context of growth, internal and environmental growth regulators, as well as the regulation of Gibberellins (GA) as one of the growth-promoting phytohormones.
1.1 The mechanisms of growth at the cellular level
Cell division
Cell division is a process where one cell divides into two individual cells which in the majority of cases are identical to the previous mother cell. This event is a tightly regulated process, which starts from the duplication of genetic materials until the division leading to newly formed daughter cells. Cell division is split into several phases, where lag or gap (G) phases separate the DNA replication phase (S phase) and the chromosome segregation phase (M phase, mitosis; Figure 1.3). The G1 (the first gap) phase occurs between the previous cell division and the entry into the DNA synthesis phase (S phase), and the G2 (the second gap) phase occurs between the S phase and M phase (Dewitte & Murray, 2003; Livanos et al., 2012).
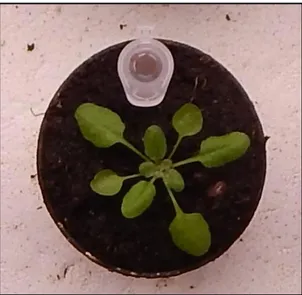
Figure 1.2. Arabidopsis thaliana at the 10-leaf stage. Arabidopsis thaliana is a small plant that belongs to
Brassicaceae family and has become a model for plant biology research. It has a 120-megabase genome
This cell cycle is an irreversible process and is coordinated by a large number of proteins. In principle, this large number of proteins are categorized into four groups based on their function and activity; cyclin-dependent kinases (CDKs), catalysis activator (Cyclin/CYC), phosphatases, and kinase inhibitors. Each phase and transition are characterized by specific combinations of these proteins. CYCs are important for CDKs activation and have been widely used as markers for the regulation of cell proliferation to environmental and developmental cues that affect growth (Potuschak & Doerner, 2001; Gutierrez C, 2009). Cell division typically occurs in meristems and young developing tissue, such as the young leaves. Hereafter, the tissue is entering a cell expansion phase (Donnelly et al., 1999; Beemster et al., 2003; Gonzalez et al., 2012).
Cell expansion
The cell wall is an important structure for plants. It determines cell shape, attaches the cells together and provides mechanical strength. Loosening and increasing the elasticity of the cell wall in combination with turgor pressure leads to cell expansion. Simultaneously, the cell wall must retain sufficient strength to withstand cell turgor pressure and remain intact. Loosening of the cell wall is thus a highly controlled process and requires the breaking of the chemical cross-links between the load-bearing sugar-polymer structures in the cell wall. Two important groups of enzymes that catalyse cell wall modifications are encoded by the Xyloglucan endotransglucosylase/hydrolase (XTH) gene family, and the expansin (EXP) gene family (Nishitani, 2000; Cosgrove, 2005).
The primary cell wall structure of land plants consists of cellulose microfibrils cross-linked with hemicellulosic polysaccharides, which are embedded in a pectin polysaccharide matrix with some lowly abundant components such as structural proteins (Carpita & Gibeaut, 1993). Cellulose and hemicellulose xyloglucan contribute to about two thirds of the dry cell wall mass. These two compounds form the main interaction in the primary cell wall by binding and crosslinking together (Hayashi, 1989; Mccann et al., 1990). This typical network acts as the major tension-bearing structure Figure 1.3. Diagram of cell division phases. The 4 stages in cell division are M-phase, G1 phase, S-phase,
G2-phase. M- phase is the mitosis phase. G1-, S-, and G2-phases are collectively known as the interphase. DNA synthesis occurs at S-phase. Modification from Jones et al. (2013)
6 in the primary wall. Xyloglucan (hemicellulose) metabolizing enzymes encoded by the XTH gene family therefore have an important role in controlling wall strength and extensibility (Fry, 1989). The XTH gene family of Arabidopsis can be divided into three major subfamilies. This classification is based on the phylogeny and gene structure. Group 1 consists of 11 genes that each contain four exons in the sequence. Group 2 consist of 15 genes with two or three exons, and group 3 contains 7 genes that share similarity in having four or five exons (Rose et al., 2002). The XTH gene family members show distinct expression patterns, based on their localization and their response to hormones, indicating that each gene has a specific role in a specific tissue and developmental stage (Nishitani, 2000). Moreover, given that XTHs break and connect hemicellulose polymers means they can have opposite effects on cell wall loosening, depending on their biochemical activity.
Another mechanism of cell wall modification involves a group of enzymes encoded by the Expansin gene family. In Arabidopsis, this expansin protein family is encoded by 36 genes which are divided into 4 groups, α-expansin (EXPA), β-expansin (EXPB), expansin-like A (EXLA), and expansin-like B (EXLB). The activity of expansins is pH dependent, with enhanced activity around a pH of 5 and below. Expansins reduce the interactions between cellulose microfibrils and hemicellulose xyloglucans, and widely break noncovalent bondings of the cell-wall polysaccharides (Cosgrove 2005; Cosgrove 2015). Expansins are expressed in different parts of the plants and the activity differs depending on the age of the plants, e.g. EXPA15 is expressed in young plants whereas EXPA1 in the older plants (Goh et al., 2012).
1.2 How plants perceive the day/night cycle: The integration of light signals, the circadian clock and sugars
Day/night cycles lead to the rhythmicity of many physiological processes in plants, e.g. photosynthesis during the day and starch breakdown at night. There are several cues that plants use to ensure proper timing. Firstly, light and darkness are perceived as signals, which can trigger specific responses. For an autotrophic organism such as plants, light is an essential source of energy for photosynthesis. Regarding the day/night cycle, sugar availability varies throughout the day and night and is used as an important regulatory cue. Thirdly, the internal circadian clock provides oscillations in regulatory proteins affecting a multitude of processes. Taken together, the rhythmicity of light and sugar availability are important cues to adjust the circadian oscillation.
The circadian clock and light signals
The circadian clock is entrained by the light/dark cycle, and acts as the timekeeper for plants. Circadian oscillations are produced by a network of genes that are connected to each other in mostly negative and some positive transcription–translation feedback loops (Figure 1.4). These oscillations coordinate and ensure that metabolic, physiological, and developmental processes occur at the relevant time of the day (Dodd et al., 2005; Covington et al., 2008). Moreover, gathering information of the relative day-length allows appropriate timing of seasonal responses. Light cues are considered the primary entrainers of the circadian clock, however after removal day/night light cues the transcription-translation feedback loops will allow oscillations to continue for several days. This might help plants to maintain rhythmic behaviour under varied environmental conditions and anticipate start of the day and night (Kinmonth-Schultz et al., 2013).
To perceive light cues from the environment, plants have photoreceptors that respond to specific wavelengths and so generate appropriate response. Those photoreceptors are phytochromes, cryptochromes, and phototropins (Briggs & Olney, 2001). Phytochromes are the most studied photoreceptors, which perceive red and far red light and are present as a 5-member gene family in Arabidopsis. (Briggs & Olney, 2001; Quail, 2002). Cryptochromes are the eukaryote blue light receptors, while phototropins are specifically found in plants. These photoreceptors mediated light signals into a wide range of function such as light-induced stomatal opening, chloroplast movements, and phototropism (Chen et al., 2004; Seluzicki et al., 2017)
Changes in light quantity or quality itself can trigger a response in plants independently from the clock. For example, at the seedling stage light regulates the rate of hypocotyl elongation through the combination of PHYTOCHROME INTERACTING FACTOR4 (PIF4) and PIF5 expression and their light-regulated protein stability (Sun et al., 2013). In the context of competition with neighbouring plants, low light and far red light induced hyponasty elevate leaves above neighbouring plants and maximizes light harvesting (de Wit et al., 2012; Küpers et al., 2018). Interestingly, in Arabidopsis rosettes placed under low light conditions, hyponasty is retained in a photoreceptor mutant that is unable to perceive the appropriate light signals. This suggest there is also a link between hyponastic movement and low carbon availability within the plant (Vasseur et al., 2011).
Clock – Sugar reciprocal regulation
Photosynthetic genes are activated already before the day starts. Daytime photosynthesis and carbon fixation are clearly controlled by the circadian clock. For example, LIGHT HARVESTING COMPLEX A (LHCA) and LHCB gene families which encode chlorophyll a/b binding polypeptides are clock regulated, as well as RUBISCO SMALL SUBUNIT (RBCS) and RUBISCO ACTIVASE (RCA) that participate in carbon fixation (Pilgrim & McClung, 1993; Harmer et al., 2000). Fine-Figure 1.4. Simplified circadian oscillation. CCA1 and LHY are expressed in the morning, which suppress the
evening complex formed by LUX, ELF3, and ELF4. These morning-expressed genes also act as repressor to other components such as the PRRs (PRR9, PRR7, and PRR5) and TOC1. White and grey background represent the day- and nighttime, respectively. Modified from Sanchez & Kay (2018).
8 tuning between the internal clock and the day-night cycle is essential for optimal plant performance. Indeed, a mismatch of the internal clock and the environmental light/dark cycle was found to result in reduced chlorophyll content, photosynthetic carbon fixation, and growth (Dodd et al., 2005). On the other hand, fluctuations of sugar throughout the day also entrain the circadian oscillator. It has been reported that sugar accumulation during the day represses the PSEUDO RESPONSE REGULATOR (PRR7, Figure 1.4) expression (Blasing et al., 2005; Haydon et al., 2013; Seki et al., 2017). Furthermore, sucrose dependent changes in clock behaviour were found to require GIGANTEA (GI), (Dalchau et al., 2011). Thus, photosynthesis also has an effect on the entrainment and the robustness of circadian rhythms.
Highly controlled starch turnover prevents starvation
A portion of the photosynthesis assimilates is stored as starch to be utilized as a carbon source during the night. In Arabidopsis 95% of starch is degraded during the night in a linear manner under a wide range of day/night lengths (Smith & Stitt, 2007; Gibon et al., 2009). Starch degradation rates adjust immediately to an unexpected onset of night, suggesting that a timing mechanism matches the amount of starch and the utilization rate to the anticipated length of the night to consume almost all the starch originally present (Figure 1.5; Graf et al., 2010; Fernandez et al., 2017). The circadian clock plays an important role in predicting the day-length and starting starch degradation. However, the circadian clock alone cannot predict the precise matching between the rate of starch utilization and the anticipated dawn. The immediate adjustment to unexpected early night also requires an assessment of the starch requirement and availability. It has been reported that sugar-signalling metabolite, trehalose-6-phosphate (T6P) regulates starch accumulation and turnover through a sucrose feedback regulation. This molecule is potentially linking the starch turnover to the demand of sucrose by growing sink organs at night (Martins et al., 2013). Overall, starch levels could potentially act as the integrator of daytime photosynthetic performance. Mismatches between the day-length and the preserved starch result in growth retardation and decreased productivity (Graf et al., 2010; Stitt & Zeeman, 2012).
Sugar status determines daily oscillations and plant development
Another important factor that determines growth is sugar availability. Plants need to coordinate their growth with the diurnal rhythm of carbon availability. Protein translation is one of mechanism that depends on sugar status. The starchless mutant phosphoglucomutase (pgm) is a representative model to study the effects of extreme sugar fluctuations, since sugars are high during the day and low during Figure 1.5. The model of starch production and breakdown throughout the day-night cycle. Starch is produced
by plants during the day and degraded during the night. Plants have an ability to estimate the production and consumption of starch in a variety daylengths such that almost all starch is degraded at the end of the night. Modified from Smith & Stitt (2007).
the night in this mutant. pgm showed significantly lower polysome loading during the night compared to Col-0 wild type, and followed the sucrose availability (Piques et al., 2009; Pal et al., 2013). The utilization of this mutant also showed that that sugar levels make a major contribution to day-night rhythmicity in gene expression. Furthermore, half of the circadian clock genes were affected by sugar levels, mostly by reductions in available sugar (Blasing et al., 2005).
Sugars have also been implicated in many developmental processes. In Arabidopsis it was found that sugars are essential for the transition from the juvenile to adult stage via the micro-RNA mir156 (Yu et al., 2013). Furthermore, subsequent flowering was also found to be sugar dependent (Corbesier et al., 1998; Seo et al., 2011). Also plant architecture requires coordination and signalling by sugars. In peas, shoot branching was found to be initiated by sugars via the transcription factor BRANCHED1 (BRC1), even preceding auxin as a regulator. (Mason et al., 2014).
From these examples, we conclude that sugars also have a role as a signalling molecule. SNF1-RELATED KINASE 1 (SnRK1) AND TARGET OF RAPAMYCIN (TOR) kinase are the central regulators that translate sugar and energy availability in downstream plant responses (Smeekens et al., 2010). Both SnRK1 and TOR signalling routes could underlie the sugar dependent regulation observed in daily oscillations and development. SnRK1 is active under low sugar conditions and can orchestrate large scale transcriptomic reprogramming to suppress biosynthetic processes and plant growth (Baena-González et al., 2007). The activity of this molecule is repressed by glucose-6-phosphate (G6P), glucose-1-glucose-6-phosphate (G1P), and trehalose-6-phospate (Ghillebert et al., 2011; Nunes et al., 2013; O’Hara et al., 2013). In contrary with SnRK1, TOR is active under high energy conditions and subsequently promotes plant growth. It is mainly expressed in proliferating tissues such as meristematic regions and endosperm (Robaglia et al., 2012).
1.3 Gibberellin, the growth hormone
Gibberellins (GAs) are a tetracyclic, diterpenoid plant hormones that induce a wide range of plant growth and developmental processes. The origin of Gibberellin research started in Japan in the late 19th century. A disease in rice exhibited symptoms such as elongated seedlings and infertility, was known to result from infection with a gibberellin producing fungus named Gibberella fujikuroi. Later on, researchers also found the compound was produced by plants (Hedden & Sponsel, 2015). GAs have a role in many developmental processes in plants, such as leaf growth (Nelissen et al., 2012), flowering (Porri et al., 2012), fruit and seed formation (Pharis & King, 1985), seed germination and early seedling growth (Achard et al., 2009). Malfunction in GA biosynthesis leads to repressed growth, such as smaller rosettes and delayed flowering (Yamaguchi et al., 1998; Mitchum et al., 2006; Plackett et al., 2012).
Bioactive GA and biosynthetic pathway
GAs belong to a large family of hormones produced by plants and fungi. This hormone has a tetracyclic diterpene structure formed by 19 or 20 carbon atoms. So far, 136 GAs have been isolated and characterized (Hedden & Sponsel, 2015). Most GAs have been identified as intermediates in the synthesis of bioactive GAs or their degradation product. Four forms of characterized GAs have been
10 identified as bioactive GAs in the plant kingdom, i.e. GA1, GA3, GA4 and GA7. GA4 is considered to
be the major active GA in Arabidopsis (Hedden & Kamiya, 1997; Yamaguchi, 2008).
The upstream biosynthetic pathway of gibberellins occurs in plastids, where the precursor trans-geranylgeranyl diphosphate (GGPP) is converted into ent-kaurene (Figure 1.6). Two enzymes, CPS and KS, are involved in this conversion. In Arabidopsis, these enzymes are encoded by two single genes. Ent-kaurene is converted into a form of ent-kaurenoic acid by ent-kaurene oxidase (KO) which is localized at the outer membrane of the plastid. The next step is the conversion of ent-kaurenoic acid into GA12 through several steps of oxidation at C-19 by ent-kaurenoic acid oxidase (KAO) in
the endoplasmic reticulum. GA12 is converted to GA4 through several oxidation steps on the C-12
and C-3 by GA20-oxidases (GA20ox) and GA3-oxidases (GA3ox), respectively. In a parallel pathway, GA13ox convert GA12 into GA53, which is a precursor for GA1 through the 13-hydroxylated
pathway (Lange & Lange, 2006; Yamaguchi, 2008; Hedden & Thomas, 2012). The existence of a gene that encodes for a GA13ox in Arabidopsis is still unclear. Until now it has only been confirmed in fungi (Yamaguchi, 2008) and rice (Magome et al., 2013). Overall, the evidence of these pathways comes from a variety of biochemical and in planta studies. Given the wide variety of gibberellins, it serves as working model.
GA signalling
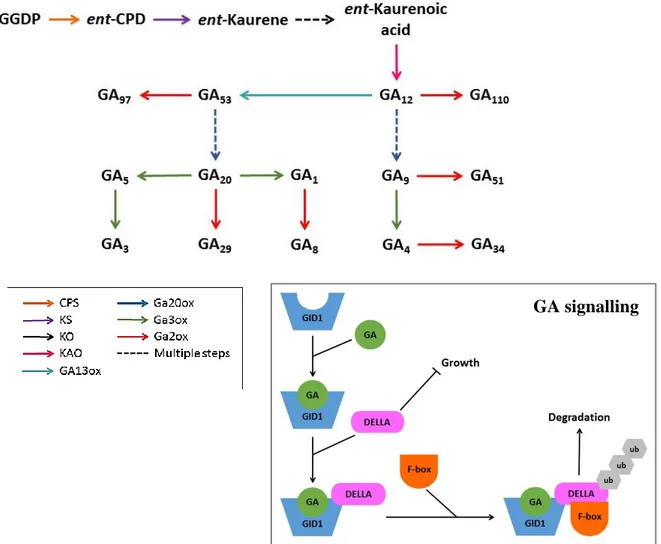
Figure 1.6. Simplified version of GA biosynthesis and signalling. GA biosynthesis starts from processing the
precursor Geranylgeranyl Di-Phosphate (GGDP). The conversion from precursor into bioactive GA involves seven different enzymes and two routes namely C13- and non-C13-Hydroxylase. The C-13-Hydroxylase
route produces bioactive GA1 and GA3. Non-C13-hydroxylase route produces bioactive GA4. GA signalling
involves binding of GA by GID1 and the formation of a protein complex with DELLA proteins. This leads to ubiquitination and subsequent degradation of the DELLA protein.
Deactivation processes provide a mechanism to remove bioactive GAs. The well-characterizes deactivation reaction is the 2β-hydroxylation catalysed by GA2-oxidases (GA2oxs) (Hedden & Sponsel, 2015; Fukazawa et al., 2017a). Another type of deactivation involves the expression of the genes encoding GA methyl transferase 1 (GAMT1) and GAMT2. These genes are both expressed mainly in the entire siliques, including the seeds. The transcriptional level peaks from the middle until the end of silique development (Varbanova et al., 2007).
GA Signalling: GID-mediated DELLA breakdown
GA signalling involves several players, especially the proteins GIBBERELLIN-INSENSITIVE DWARF1 (GID1) as the GA receptor, the F-box protein SLEEPY1 (SLY1), and DELLA proteins. The GA receptor was first identified in a rice mutant that shows insensitivity to GA (Ueguchi-Tanaka et al., 2005). The mutant phenotype then later became the name of the GA receptor, GID1. In Arabidopsis, there are three GID1 orthologs which are named GID1A, GID1B, and GID1C (Griffiths et al., 2006). DELLAs belong to the plant-specific GRAS family of putative transcription regulators, and act as key repressors of GA responses (Zentella et al., 2007). DELLA proteins are distinguished from the other GRAS family by the specific N-terminal sequence containing two conserved domains: the DELLA domain and the TVHYNP domain. The DELLA domain is highly conserved among different plant species including Arabidopsis (Dill et al., 2001), maize (Lawit et al., 2010), rice (Ueguchi-Tanaka et al., 2007), wheat (Wu et al., 2011) and conifers (Du et al., 2017), it is essential for its GA-dependent breakdown. DELLA proteins repress almost all known GA-dependent processes such as seed germination (Sun & Gubler, 2004), vegetative growth and flowering (Jiang et al., 2012). Arabidopsis encodes five DELLAs, REPRESSOR OF GA1 (RGA1), GA-INSENSITIVE (GAI), RGA-LIKE1 (RGL1), RGL2, and RGL3. Each of those DELLAs play a different role in repressing GA responses. RGA and GAI repress vegetative growth and flowering (Feng et al., 2008), RGL1 and RGL3 are involved in responses to stress (Ding et al., 2013; Huang et al., 2018) and RGL2 inhibits seed germination (Liu et al., 2016). GA signalling occurs through the binding of bioactive GA by GID1, which then forms a complex together with SLY1 and a DELLA protein. The complex of GID1, bioactive GA, SLY1 and DELLA leads to ubiquitination and degradation of DELLA proteins by the proteasome, thereby releasing the suppression on GA responsive genes (Figure 1.6; Hirano et al., 2008; Harberd et al., 2009; Davière & Achard, 2013).
Crosstalk of GA with other growth hormones
Plant growth and development require a complex regulation. Environmental factors, such as light intensity and temperature, directly or indirectly affect growth. Many plant growth-promoting hormones have been identified, such as gibberellins, brassinosteroids, auxin and strigolactones (Chaiwanon et al., 2016). Each hormone affects a wide range of developmental and physiological processes, while some other processes are co-regulated by multiple hormones. The crosstalk between GAs and brassinosteroids (BR) occurs at both hormone biosynthesis and downstream signalling components. For instance, the expression of GA biosynthetic genes are decreased in BR mutants (Unterholzner et al., 2015), whereas BR biosynthetic genes are activated by DELLAs. At the signalling level, the interaction directly happens through the physical interaction of the signalling proteins, DELLA and BZR1. Subsequently, these proteins operate in an antagonistic manner (Li et al., 2013).
12 The crosstalk between GAs and auxin has also been observed in several growth and developmental stages. The reduction of auxin transport, mainly pointed out by the decrease of PIN-FORMED (PIN) protein levels, suggests that GA regulates the auxin efflux via PIN protein abundance (Willige et al., 2011). Moreover, exogenous GA3 was shown to inhibit root elongation in seedling stage via
auxin-signalling modulation (Li et al., 2014). Auxin is also shown to modulate GA biosynthesis by upregulating several genes from the GA20OX and GA2OX gene family (Frigerio et al., 2006). Taken together, these examples of interactions among the growth hormones illustrate the complexity of plant growth in response to specific environmental cues, and positions GA central in a growth control mechanism.
Interaction of GA with light, clock, sugar
GA is one of the hormones that regulate a wide-range of growth and developmental processes in plants. Response of GA to environmental cues become important in order to match growth with environmental conditions. So far, it is known that the interaction between light quality (red : far red ratio) with GA occurs indirectly via a protein complex formed between Phytochrome-Interacting Factors (PIFs) and DELLA (Rodrı et al., 2008). The reduction of PIF3 protein abundance by DELLAs also correlates closely with reduced hypocotyl elongation as the consequence of the reduction in PIF3 binding to its target gene (Li et al., 2016).
The circadian clock also interacts with GA through transcriptional regulation of the GA receptor in seedlings. It was shown that the subsequent oscillations in GA signalling were important for rhythmic hypocotyl elongation (Arana et al., 2011). The clock might also bypass GA signalling since among targets of CCA1, a core component of the circadian clock, many GA responsive genes were identified (Nagel et al., 2015). This also in line with the finding that GA responsive genes were enriched among circadian genes that were highly expressed during the night (Covington et al., 2008).
Few reports identified links between carbon and gibberellins. However, sugar starvation in Arabidopsis thaliana arising from inefficient starch metabolism at night reduces the expression of ENT-KAURENE SYNTHASE, the gene encoding a key upstream biosynthetic enzyme for gibberellin biosynthesis. The down regulation of this gene leads to growth reduction the following day (Paparelli et al., 2013).
1.4 GA as the mediator between environmental cues and growth
Research questions and thesis outline
Plant growth occurs in a highly dependent manner on environmental conditions and internal physiology. Day-night cycles create rhythmicity in important cues, such as light intensity. These dark-light shifts entrain the circadian clock which act as the time-keeper of many processes in plants, including photosynthesis and starch degradation. Furthermore, sugars regulate many processes such as protein synthesis and development, but also act as an input for entraining the circadian clock. These three components are clearly intertwined and are important in regulating growth. However, GAs are an essential prerequisite for growth. A mechanistic understanding on how light, sugar, and the circadian clock regulate GA biosynthesis to adjust growth to day-night cycles and environmental conditions remains absent, especially during vegetative growth. Therefore, this thesis aims to identify how the interplay of light, the circadian clock, and sugars affects GA biosynthesis; and study how these interactions determine variation in growth rates throughout the day and adjust growth to environmental conditions.
In Chapter 2 we observed the growth patterns in the day/night cycle of 10-leaf rosette stage plants, and the main contributors of leaf expansion at the cellular and molecular level. In this chapter, we also discussed a preliminary investigation of the role of light, sugar and GA on growth rhythmicity. In Chapter 3 we focus on the genes that shape rhythmicity in GA biosynthesis. The role of light, the clock and sugars in their transcriptional regulation was characterized. Moreover, their effect on the actual GA abundance was investigated. Chapter 4 Based on the identification of rhythmic and sugar dependent GA biosynthesis in chapter 3 we studied how GA regulates growth overtime in a high throughput system under variable light conditions. In chapter 4, we showed that GA contributes to controlling plant growth under variable environmental conditions and that regulatory processes identified in chapter 3 can explain these effects.
14
Chapter 2: Growth throughout the day-night cycle and its interaction with
gibberellin
Putri Prasetyaningrum, Stijn Dhondt, Dirk Inzé, Pierdomenico Perata, Hans van Veen
Abstract
Plants encounter day-night changes throughout their entire lifetime. This rhythmicity entrains the circadian clock, the time-keeper, and determines sugar availability. Plants derive sugar through photosynthesis during the day. A part of the sugar is then stored as starch, to ensure a carbon supply during the night, which results in different levels of sugar availability within the day due to alterations of carbon sources. These conditions determine time of growth. Growth as a size increase is the result of cell division and expansion. Gibberellin (GA) is one of the main growth hormones in plants. However, it is hardly known how the light, sugar and circadian clock rhythmicity interact with GA and henceforth affect the timing of growth. Therefore, in this chapter we investigate the growth rhythm and a preliminary evidence on how GA as a growth-mediator could affect growth rhythmicity. We investigated the growth rhythmicity by measuring leaf size increase and analyse the gene expression involved in cell wall modification throughout the day. We found that leaf expansion rate is higher from midnight until midday. This coincides with the rhythmic expression of several cell wall modifying genes. Moreover, we analysed public microarray data of diurnally expressed and GA-regulated genes. The analysis showed that the diurnal rhythmic GA-related gene is highly expressed during the night. However, the imbalance of GA concentration in the plant resulted in deterioration of its performance.
Introduction
Arabidopsis thaliana is a common model plant for investigating growth and physiology. With a life cycle of around two-months, in the case of ecotype Columbia-0, A.thaliana has seven principal growth stages, namely germination, leaf production, rosette growth, inflorescence emergence, flower production, silique ripening, and senescence (Boyes et al., 2001). Currently, the underlying molecular coordination of growth control is slowly being elucidated. For example, protein synthesis is shown to follow sucrose availability (Pal et al., 2013). However, growth does not simply follow the resource availability, the circadian clock and hormonal composition are also crucial players in growth control. Hormones play a crucial role in plant growth and development. One of the main growth stimulatory hormones is gibberellin (GA). GA biosynthesis starts from the processing of trans-geranylgeranyl diphosphate (GGDP), which in a series of enzymatic steps is metabolized to bioactive GA. Bioactive GA is perceived by a GID1 (GA INSENSITIVE DWARF1), which then forms a complex with the growth suppressing DELLA protein. Consequently, this complex is degraded by the proteasome and so GA abolishes the growth suppression by DELLA proteins (Hirano et al., 2008; Salazar-Cerezo et al., 2018). The circadian clock is suggested to regulate increased sensitivity to GA during the night, regarding hypocotyl elongation (Arana et al., 2011). Covington et al. (2008) found by analysing microarray data from seedlings, that GA responsive genes were enriched with circadian genes that are high during the night. Interruption of GA biosynthesis or signalling severely hampers growth, despite ample carbon availability. This is apparent from many mutants identified in Arabidopsis that upon disruption of these pathways typically show dwarf phenotypes (Silverstone et al., 1997; Plackett et al., 2012).
In 24 hours, plants experience a day-night cycle, which require different physiological processes. During the day, plants derive energy and carbon through photosynthesis. A part of the carbon derived from photosynthesis is accumulated as starch to support metabolism and growth at night. Circadian clock system has an important role for the timing of starch turnover (Smith & Stitt, 2007; Graf & Smith, 2011). Starch is degraded during the night and reaches the minimum point almost precisely at dawn regardless of changing the photoperiod, due to the circadian clock regulation (Graf et al., 2010). Moreover, many parts of the photosynthesis machinery are clock controlled, such as
CHLOROPHYLL A/B-BINDING PROTEIN2 (CAB2) that is important for light harvesting (Millar et al., 1992; Dodd et al., 2014). Conversely, sugars can influence the circadian oscillator. The daily rhythmicity of carbon metabolism contributes to oscillations of transcripts in Arabidopsis, and furthermore to the circadian-regulated transcriptome (Blasing et al., 2005). It was also reported that exogenous sucrose can entrain the promoter of several core clock genes to keep the oscillation under continuous darkness (Dalchau et al., 2011).
To arrive at a final growth rate, there must be a crosstalk between the light, carbon availability, the clock and GA as the growth hormone. One of the most well-known hubs in light and GA crosstalk is the physical interaction of PHYTOCHROME INTERACTING FACTORs (PIF) and DELLAs, thereby preventing DELLA action. PIFs belongs to basic helix loop helix (bHLH) transcription factors, which bind to phytochrome, the red and far-red light photoreceptors; their stability is highly dependent on the quantity and composition of the light (Leivar & Monte, 2014; Li et al., 2016). In the context of growth, there is evidence of sugar dependent regulation of GA abundance. sex1-1 and pgm showed dwarf phenotypes as an effect of the failure to degrade or produce starch, respectively. However, this dwarf phenotype can be reversed by exogenous GA addition. Moreover, abundance of the upstream GA biosynthetic gene KAURENE SYNTHASE, in these mutants was found to be lower under low light condition (Paparelli et al., 2013).
Light, circadian clock, and sugar availability are intertwined and creates specific timing and rhythmicity for many physiological processes. In this study we would like to investigate whether this rhythmicity then consequently creates a daily rhythm in Arabidopsis rosette growth. Furthermore, we would like to study whether GA have a role in the rhythmicity and performance.
Results
Leaf expansion is high during the night and early morning
To investigate growth rhythmicity, we performed destructive measurements of leaf area at six-hour intervals over the course of 24 hours (Figure 2.1a). At the first part of the day, the plant grew relatively faster compared to the last part of the day (Figure 2.1b). During the night the plants grow faster again
(a)
Figure 2.1. (a) A representative image of the leaves/cotyledons in order from old (left) to young (right) (b)
Total leaf area represented in mm2 unit under 12L/12D light regime. X-axis indicates the harvesting time
points (Zeitgeber Time/ZT), which starts at the beginning of the day (8:00 AM). Mean ± SEM (n=23) are shown.
16 and reach the maximum expansion rate at the last part of the night. This suggest that growth is faster during midnight until midday and that it seized uo in the afternoon. Maximum growth from midnight to midday is also seen at the level of individual leaves and independent of leaf age (Figure 2.1c). Leaves of intermediate age show the largest rates of expansion, which despite being predominately midnight to midday, also includes some afternoon growth.
Cell wall modification is potentially responsible for growth rhythmicity
Growth is the product of cell division and expansion (Kalve et al., 2014). To identify the potential downstream players, we investigate the day-night expression patterns of CYCLINs (CYCs), EXPANSINs (EXPs) and XYLOGLUCAN ENDOTRANSGLUCOSYLASE/HYDROLASEs (XTHs) gene families in rosette stage plants, which were available from public microarray data (Mockler et al., 2007). To this end, datasets from 29 and 35 days grown Arabidopsis under day night pattern of 12L/12D were taken from Smith (Smith et al., 2004) and Blasing (Blasing et al., 2005), respectively. CYCLINs (CYC) gene family encode the prerequisite enzyme that regulates cell cycle progression (Burssens et al., 2000; Imai et al., 2006). From 27 members of the CYC gene family (Supplemental figure 2.2), only 3 genes showed day-night rhythm (Figure 2.2a). CYCA3;1 and CYCD2;1 showed diurnal rhythm in both Smith and Stitt dataset. CYCB1;1 is traditionally used as a marker of divisional activity (Planchais et al., 2002; Weingartner et al., 200 4; Weimer et al., 2016). Rhythmicity in CYCB1;1 was only present in the Stitt dataset. These three genes showed rhythmicity with different timing. CYCA3;1 and CYCB1;1 showed higher expression levels during the day which decreased during the night. Meanwhile CYCD2;1 was higher during the night and lower during the day.
EXPANSINs (EXP) are cell wall-associated proteins expressed by a gene superfamily involved in cell wall loosening and extension (Sampedro & Cosgrove, 2005; Gonzalez et al., 2012). Three genes out of 32 EXP gene family member showed day-night rhythm, namely EXP1, EXP8, and EXPB1 (Figure 2.2b; Supplemental figure 2.3). EXP1 and EXP8 had similar rhythms which reach the peak of expression level at the end of the night. EXPB1 demonstrated different rhythms which reached their peak during the day, quickly decreased, and kept low expression levels throughout the night.
18 EXP1 was the most abundant of the gene family, followed by EXP8 and EXP6 (Supplemental Figure S2.3).
The xyloglucan polysaccharides are important structural compounds in the primary dicotyledons cell wall. The modification of this structure is catalysed by a xyloglucan endotransglucosylase/hydrolase (XTH) protein family (Rose et al., 2002; Sasidharan & Pierik, 2010). Six out of the 33 XTH gene family members were rhythmic (Figure 2.2c; Supplemental figure 2.4). XTH4 expression level was higher during the night and lower during the day,and was also the most abundant XTH family member. On the contrary, XTH31 and XTH32 expression level is higher during the day and lower during the night. XTH6, XTH8, and XTH27 had similar patterns, with increasing expression levels during the night, peaking at the end of the night and subsequently decrease during the day. To assess the contribution of cell division and expansion to this growth rhythmicity, we investigated the expression and localization of CYCB1;1 and EXP1 by utilizing CYCB1;1-GUS and EXP1-GUS reporter lines as a marker of cell division and expansion, respectively (Figure 2.2d). GUS activity in EXP1-GUS reporter line occurred almost throughout the entire rosette. The GUS activity was especially observed at leaf#3 until the youngest leaf. On the other hand, GUS activity in CYCB1;1-GUS was only observed in the five youngest leaves and the apical meristem of the rosette.
CYCLIN-B1;1 (CYB1;1) is the major regulator in mitotic cell division and used as a marker of cells specifically at the G2 and M transition (Potuschak & Doerner, 2001). EXPANSIN A1 (EXP1) belongs to an α-expansin protein superfamily that have a role in cell-wall loosening (Sampedro & Cosgrove, 2005), and was identified as the most abundant transcript in rosettes (Figure 2.2b). Leaf expansion rates varied throughout the day (Figure 2.1).
GA homeostasis is important for optimal performance
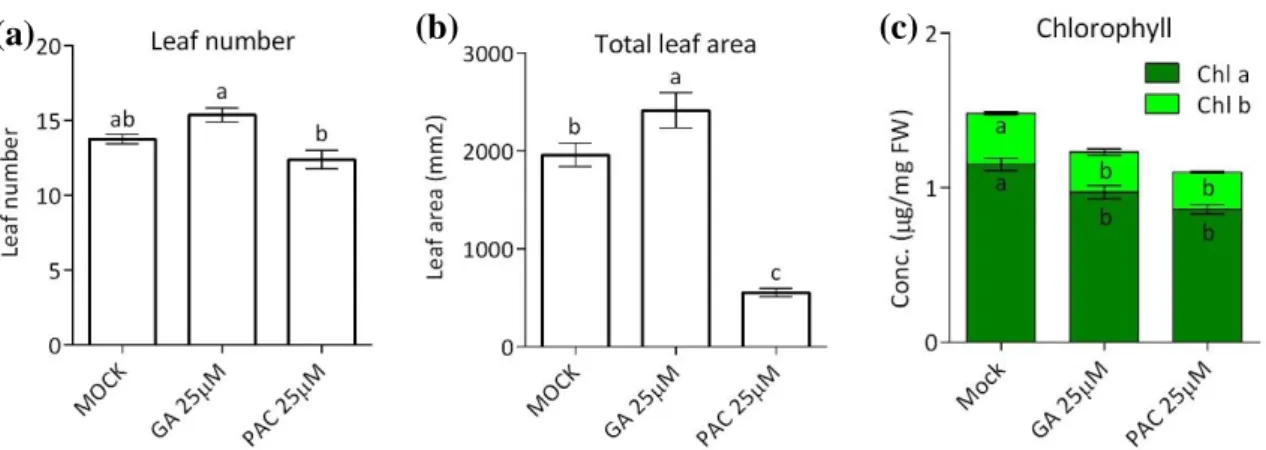
We conducted an experiment to investigate the effect of an imbalance of GA abundance on growth by artificially modifying GA abundance with GA and PAC over seven days. There was no significant difference in leaf number between the mock and both the GA or PAC treated plants (Figure 2.3a). However, GA treated plants did have a significantly higher leaf number than PAC treated plants. Total leaf area of GA treated plants was significantly higher compared to mock treatment, whereas PAC addition drastically reduced total leaf area (Figure 2.3b). Both GA and PAC treated plants showed significant reduction in chlorophyll content (Figure 2.3c).
(a) (b) (c)
Figure 2.3. (a) Leaf number, (b) total leaf area, and (c) chlorophyll content of rosettes treated with mock,
GA, and PAC. The treatments start at 7-leaf stage every two days at ZT12 for 1 week. The sampling was done at ZT12 at the last day of the experiment. The letter indicated a statistically significant difference using t-test (p < 0.05). (a and b) values are mean ± SEM (n= 8). (c) values are mean ± SEM (n= 5).
Significant amount of GA responsive genes peak during the night
We identified GA responsive genes from a microarray dataset derived from GA and PAC treated rosettes (Ribeiro et al., 2012). This dataset was then combined with those from Stitt and Smith describing the day-night cycle (Smith et al., 2004; Blasing et al., 2005). The proportion of GA responsive genes among gene-sets that peaked at specific times of the day were identified and served as a proxy for the timing of GA abundance and signalling (Figure 2.4). Both diurnal datasets showed
similar trends in the enrichment of GA-related genes. Here, a significant enrichment of GA responsive genes was found among gene sets that peaked at night. Maximum enrichment was found at ZT17, suggesting high levels of GA and/or GA signalling during the night. EXPANSIN-LIKE A1 (EXLA1) is enlisted as one of the GA responsive genes that peaks at ZT17 (Supplemental Table T2.1).
Discussion
Variation in growth rates throughout the day-night cycle are likely due to rhythmicity in cell expansion
Plants are autotrophic organisms that have to adapt to the day-night cycle, likely resulting in growth rhythmicity. Leaf expansion rates were higher at the last part of the night and the first half of the day (Figure 2.1b), and leaves of intermediate age provided the largest contribution to the increase of total leaf area (Figure 2.1c). Only a few of CYC gene family, which are involved in cell division, showed rhythmic expression (Figure 2.2a). Furthermore, localization of divisional activity did not correspond with the leaves that showed the strongest contribution to growth. For EXP1, however, the localisation matched with the destructive growth measurements (Figure 2.2d and 2.1c). Overall, the cyclical nature and the localisation of putative downstream growth-related genes indicates that the higher rates of nighttime and morning growth are mostly due to cell expansion rather than division.
We identified several EXP and XTH gene family members which are likely to be involved in cell wall modifications required for expansion and could be instrumental for rhythmic growth (Figure 2.2b and c). Expansin activity is thought to function in cell enlargement (Cosgrove, 2000). The high abundance Figure 2.4. GA-related gene enrichment among rhythmic genes. The grey and white box indicate the night
and day, respectively. Y-axis indicates the number of genes regulated by GA among the genes that peak at a particular time of the day (Zeitgeber Time - X-axis).
20 of EXP1 and EXP8 transcript levels points to their relative importance, moreover given their increased expression during the night matched the observed growth rhythms.
The XTH enzyme family is involved in the modification of the load-bearing cell-wall components, which are believed to be important in the regulation of cell wall extensibility (Maris et al., 2011). Interestingly, expression of XTH activity has not always correlated to increased cell expansion. This is probably due to the dual nature of the XTH enzymatic activity (Sasidharan & Pierik, 2010). Four XTH family members were identified with day-night cycle rhythmicity that corresponded with expansion growth, namely XTH4, XTH6 XTH8 and XTH27. However, XTH31 and XTH32 showed an opposite expression pattern. XTH31 and XTH32 are part of the subgroup III of the XTH superfamily. Genevestigator expression level of these genes showed that XTH31 is expressed higher in early stage of the plants, while XTH32 appears to be slightly higher in the mature stage (Kaewthai et al., 2013). This example points out that the genes within the families could act in a specific locations and developmental stages of the plants, which could explain why not all the gene expression patterns follow the trend of growth data. However, through this inventorization we identified putative downstream genes responsible for cell expansion driven rhythmic growth, which focuses around EXP1, EXP8 and four XTHs.
GA stimulates growth and shows evidence of rhythmic behaviour
One of the hormones typically involved on growth stimulation is GA. We showed that upon GA application growth is induced and up inhibition of GA biosynthesis growth is repressed. GA responsive genes were most abundant during the night, coinciding with the timing of growth observed in figure 2.1b. It has been shown that modification of GA abundance alters the expression level of EXP1, EXP8 (Ribeiro et al., 2012) and CYCB1;1 (Achard et al., 2009). Particularly EXP1 and EXP8 expression are shown to be rhythmic (Figure 2.2b). Arana et al., (2011) indicated that GA sensitivity in Arabidopsis hypocotyls during the night was due to the circadian oscillation of the GA receptor GID1 and DELLA proteins. Our data also pointed out that GA responsive genes were most highly expressed during the night (Figure 2.4b). Overall these observations point to an important role of this hormone to explain the observed patterns in leaf expansion.
The inability to maintain homeostatic GA levels as a growth regulator, either due to GA addition or inhibition of GA biosynthesis (Figure 2.3), resulted in a performance penalty in the form of decreased chlorophyll abundance (Figure 2.3c; Jiang et al., 2012). It has also been reported that an inability to access carbon during the night results in lower GA concentrations (Paparelli et al., 2013). The growth stimulating GA is clearly intertwined with the day-night cycle. Previous research showed the coordination of leaf elongation with light signals and internal clock of the plant (Dornbusch et al., 2014; Apelt et al., 2017). Moreover, under the mild drought conditions, the expression of the genes encoding DELLA proteins are increased, which resulted in a decrease of leaf area (Dubois et al., 2017). Those examples showed the complexity of growth regulation in order to have coordination with environmental conditions.
A link between nighttime growth and GA?
This chapter showed that growth varies throughout the day, with high growth at the end of the night and start of the day. This is likely caused by changes in expansion activity, rather than cell division. We identified putative downstream candidate genes that could play a role in the growth variation. Furthermore, GA responsive genes were most highly expressed during the night, coinciding with growth. Taken together, the growth and expression differences at the different times of the day, indicates a level of complexity in growth control that strongly involves the day-night cycle. GA is one of important growth hormones that seemingly caused the growth rhythmicity. Nevertheless, little
is known about the regulation of GA biosynthesis as the integrator of growth and environmental cues. Therefore, questions arise on how light, the circadian clock, and sugar availability regulate GA biosynthesis over the course of the day-night cycle. The next chapter aims elucidate the regulation by these three components, and how they result in the rhythmicity of GA abundance.
Material and methods Growth conditions
Arabidopsis thaliana wildtype Columbia-0 (Col-0), EXPA1-GUS and CYCb1;1-GUS transgenic lines were germinated in pre-mixed soil. The seedlings were subsequently transplanted in soil with 2:1 ratio of soil and perlite respectively. The plants were grown in climate chamber with controlled relative humidity (> 50 %), CO2 (400 ppm) and temperature (20°C). light intensity and duration
varied according to the treatments.
Leaf measurements: destructive methods
The rosettes of 10-leaf stage plants were harvested and the leaves separated. The leaves were then arranged in order of age on square plates 22 x 22 cm filled with 0.5% agarose. Pictures were taken with a digital camera (Canon EOS 550D). Image processing was done using software ImageJ, to obtain surface area of individual leaves. Statistical analysis was done using ANOVA one-way with R.
GUS staining
GUS staining was done according to Malamy & Benfey (1997) with several modifications. 10-leaf stage rosettes were harvested in the respective treatments and time points. This initial fixation procedure was done in cold 90% acetone (-20 °C) for 30 minutes. Next, the samples were washed twice in GUS washing solution (Supplemental table T2.2) for 5 minutes each round in room temperature. The staining solution (Supplemental table T2.2) was added to the samples, and kept in vacuum for 10 minutes, after which they were incubated for 20 hours at 37°C. Furthermore, after removing the staining solution, samples were incubated in 75% acetic acid in room temperature for 1 hour to stop the staining process. Next, the rosettes were incubated in 70% ethanol. Imaging was done by using scanner Epson V800.
Chlorophyll quantification
Whole rosettes were harvested at the end of day and the fresh weight was measured. Chlorophyll extraction was done by incubating the samples in 96% ethanol. The extraction step was repeated if the material stayed green. Chlorophyll extracts were combined and absorption read as the wavelengths according to previously described method (Ritchie, 2006) with A750 for blank, and at A649 and A665 using a plate reader Synergy™ HT (BioTek). The calculation of chlorophyll
concentration was done using the following equation (Warren, 2008):
chlorophyll a (µg/mL) = −5.2007 (𝐴649
𝑝𝑙 ) + 13.5275 ( 𝐴665
22 chlorophyll b (µg/mL) = 22.4327 (𝐴649
𝑝𝑙 ) − 7.0741 ( 𝐴665
𝑝𝑙 ) pl (path length correction) = 0.51
Analysis of variance (ANOVA) of the chlorophyll concentration was done using R.
Microarray data analysis
Microarray data of diurnal rhythmic genes (Smith and Blasing datasets) and GA-responsive genes (Ribeiro dataset) were obtained from ftp://www.mocklerlab.org/diurnal and Genevestigator, respectively. The threshold for the correlation of diurnal rhythmic genes were set to 0.8. The analysis was done using R.
Chapter 2 - Supplemental figures and tables
Supplemental figure S2.1. Individual leaf area. X-axis indicates the leaf, C = cotyledon, L = leaf. Y-axis
24 Supplemental figure S2.2. Visualisation of CYCLIN gene family transcript abundance obtained from two
public microarray datasets (Smith: Smith et al. 2004; Stitt: Blasing et al. 2005). X-axis indicates time points (Zeitgeber time/ZT). Y-axis indicates the level of mRNA abundance.
Supplemental figure S2.3. Visualisation of EXPANSIN gene family transcript abundance obtained from two
public microarray datasets (Smith: Smith et al. 2004; Stitt: Blasing et al. 2005). X-axis indicates time points (Zeitgeber time/ZT). Y-axis indicates the level of mRNA abundance.
26 Supplemental figure S2.4. Visualisation of XTH gene family transcript abundance obtained from two public
microarray datasets (Smith: Smith et al. 2004; Stitt: Blasing et al. 2005). X-axis indicates time points (Zeitgeber time/ZT). Y-axis indicates the level of mRNA abundance.
Supplemental figure 2.5. Subset of from the transcriptionally rhythmic genes of two public microarray
datasets (Smith: Smith et al. 2004; Stitt: Blasing et al. 2005). X-axis indicates time points (Zeitgeber time/ZT). Y-axis indicates the level of mRNA abundance.
28
Supplemental table T2.1. GA responsive genes (Ribeiro et al., 2012) that showed a peak in
expression (Mockler et al., 2007) around ZT17
AGI code Gene name Description
AT4G16447 hypothetical protein unknown protein AT3G13672 TRAF-like superfamily
protein
AT1G56150 SAUR71 SMALL AUXIN UPREGULATED 71
AT5G61520 Major facilitator superfamily protein
AT3G04210 Disease resistance protein (TIR-NBS class)
AT2G40140 CZF1 zinc finger (CCCH-type) family protein
AT5G60950 COBL5 COBRA-like protein 5 precursor
AT3G08720 ATS6K2
serine/threonine protein kinase 2 Involved in translational up-regulation of ribosomal proteins.
AT2G38470 ATWRKY33 Involved in response to various abiotic stresses - especially salt stress.
AT5G49330 ATMYB111 Member of the R2R3 factor gene family. AT1G17745 PGDH2 3-phosphoglycerate dehydrogenase (PGDH); AT5G24210 alpha/beta-Hydrolases
superfamily protein
AT1G69840 SPFH/Band 7/PHB domain-containing
membrane-associated protein family
AT3G45970 EXLA1 expansin-like A1
AT1G14480 Ankyrin repeat family protein
Supplemental table T2.2. GUS washing and staining solution GUS washing solution 500 mL
Stock concentration Volume
PhospH – Pi buffer pH 7.0 1 M 50 mL
EDTA 0.5 M 10 mL
K3Fe(CN)6 100 mM 10 mL
H2O 380 mL
GUS staining solution 500 mL
Stock concentration Volume
PhospH – Pi buffer pH 7.0 1 M 50 mL
EDTA 0.5 M 10 mL
K3Fe(CN)6 100 mM 5 mL
K4Fe(CN)6 * 3H2O 100 mM 5 mL
H2O 380 mL
30
Chapter 3: Temporal regulation of gibberellin biosynthesis by light, the clock and
carbon availability
Putri Prasetyaningrum, Lorenzo Mariotti, Pierdomenico Perata, Hans van Veen
Abstract
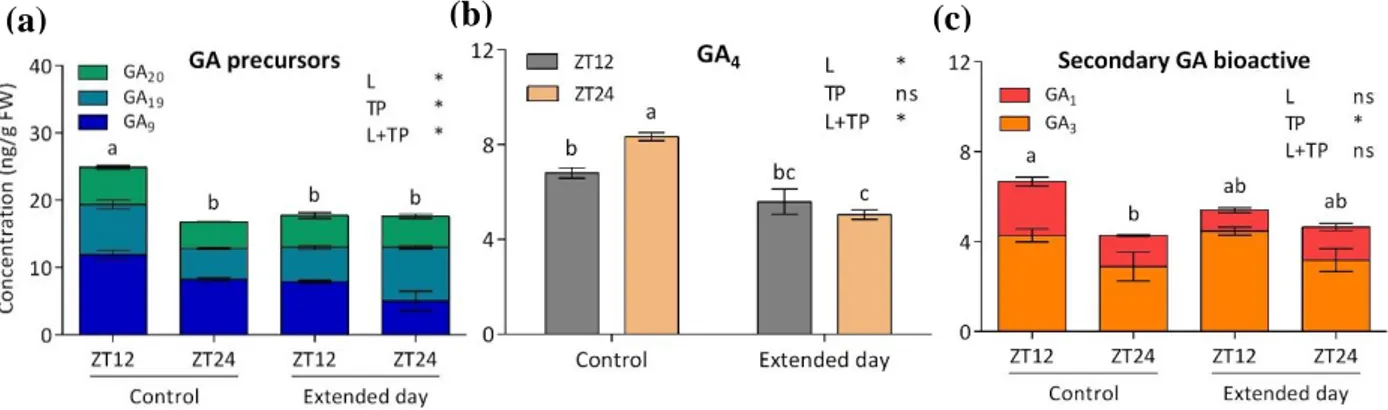
Plant growth shows rhythmic behaviour during day/night cycles and is highly dependent on environmental conditions. Gibberellin (GA) plays a key role in growth control. However, a lot remains unclear regarding how GAs interplay with light, sugar availability and the circadian clock, to ensure proper timing and magnitude of plant growth. Therefore, this study explores how these cues regulate GA biosynthesis. First, we identified GA biosynthetic genes that showed rhythmic transcriptional behaviour throughout the day-night cycle in adult Arabidopsis rosettes. Of these, KAURENE SYNTHASE (KS) was the only GA biosynthesis gene that retained rhythmicity under continuous light conditions. However, GA20OX1 and GA3OX1, the genes that encoded final enzymatic steps of GA biosynthesis required a shift to light or darkness respectively for their induction. All three GA biosynthetic genes were affected by inhibiting photosynthesis. These results suggest a process where precursor metabolism occurs during the day, and formation of bioactive GA at night. Subsequently, precursor levels and bioactive GA were higher at the end of the day and end of the night, respectively. Disruption of transcript abundance rhythmicity by changing the light regime led to corresponding alteration in GA levels and rhythmicity. We present data that supports a model of rhytmic GA biosynthesis where GA precursors are made during the day and converted to bioactive GA during the night in a resource, light and clock dependent way.
Introduction
Gibberellins (GA) are diterpene plant hormones, which are synthesized in a complex pathway and control various aspects of development and growth such as leaf growth (Nelissen et al., 2012), flowering (Porri et al., 2012), fruit and seed formation (Pharis & King, 1985), seed germination, and early seedling growth (Achard et al., 2009). Among more than a hundred forms that have been identified, only a few were found to have a bioactive role in signalling (Hedden & Thomas, 2012). GA biosynthesis is a pathway consisting of many enzymatic steps (Figure 3.1). GA biosynthesis starts by converting geranylgeranyl diphosphate (GGDP) as a substrate into ent-Kaurene. This process occurs in plastids involving ent-copalyl diphosphate synthase (CPS) and ent-kaurene synthase (KS). The next step is the conversion of ent-Kaurene into GA12 by Kaurene oxidase (KO) and
ent-kaurenoic acid oxidase (KAO) which occurs in the endoplasmic reticulum. GA12 is considered the
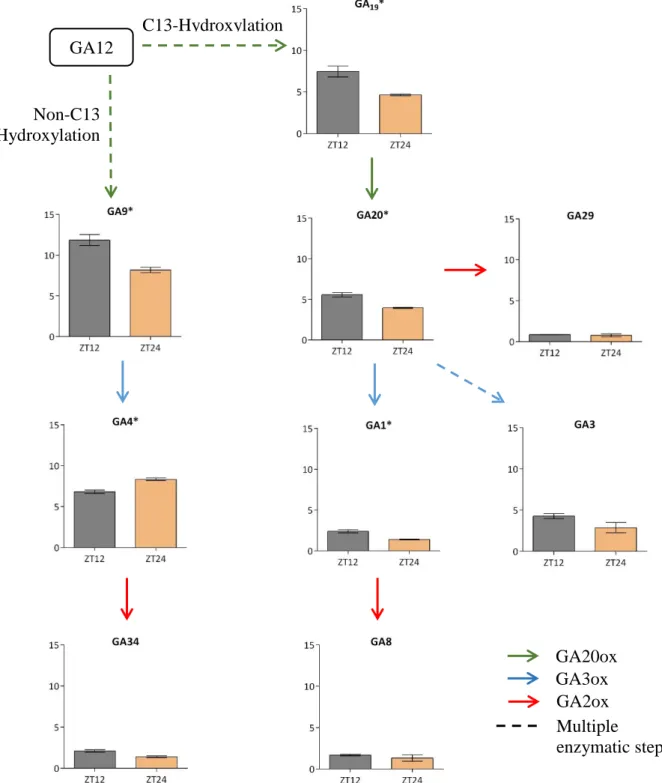
common precursors of all gibberellins in plants, of which some are hydroxylated at C13, separating gibberellins in the C13- and non-C13-hydroxylation pathway. The non-C13-hydroxylation route is known to be the main pathway for bioactive GA production in most of higher plants (Hedden & Sponsel, 2015). From GA12, the precursors are subsequently converted into bioactive GA through
oxidations on C-20 and C-3 by GA20-oxidases (GA20ox) and GA3-oxidases (GA3ox), respectively. This process results in the formation of bioactive GA1 and GA3 via the C13-hydroxylation, and GA4
and GA7 via the non-C13-hydroxylation pathway (Yamaguchi, 2008; Hedden & Thomas, 2012).
Gibberellins can be deactivated via a 2β-hydroxylation reaction catalysed by GA2-oxidases. These enzymes target a wide-range of GA forms, from initial precursor up to the bioactive forms.
Like many other plant hormones, GAs present in plant tissues at extremely low abundance. Therefore, changes in the GA concentrations must be strictly controlled, especially to maintain their effectiveness as a regulatory hormone. The level of GAs controlled by negative feedback and feed-forward mechanisms. One example of this feedback regulation is the GA20ox that converts GA12 to
GA9 and GA20, which is inhibited by high concentration of bioactive GA (Matsushita et al., 2007;
Fukazawa et al., 2017b). In Arabidopsis, GA3OX1 and not the GA3OX2 gene, is under negative feedback regulation (Yamaguchi et al., 1998). Feed-forward mechanism to control GA abundance occurs by upregulating by GA2ox under high GA conditions. This enzyme targets and makes various forms of GA biologically inactive. Overall this feedback and forward mechanism should lead to constant and stable levels of bioactive GA (Yamaguchi, 2008).
As a growth regulator, GA also play a role in response to environmental conditions. Submergence tolerant rice tolerance varieties have an ‘escape’ strategy where under flooded conditions they rapidly elongate their internodes. This is mediated by transcriptional activation of a GA20ox leading to elevated GA levels (Kuroha et al., 2018). Similarly, elongation growth as a part of shade avoidance mechanism, involves enhanced GA biosynthesis through the transcriptional upregulation of GA20ox expression in R. palustris (Benschop et al., 2006) and A. thaliana (Hisamatsu et al., 2005). The role of GA was also observed under osmotic stress conditions where an induction of the transcriptional expression of GA2OX6, encoding a GA-inactivating enzyme, resulted in reduction of bioactive GA (Dubois et al., 2013). These observations suggest that despite feedback regulation GA levels can vary, often caused by transcriptional regulation of the corresponding metabolic enzymes.
Figure 3.1. Simplified version of GA biosynthesis. The blue box indicates the C13-hydroxylation route, the
32 In chapter 2, we showed that leaf growth has day-night rhythmicity, where growth in terms of expansions occurs predominantly during the night and the morning. Here growth rhythmicity correlated with cell wall modifying enzymes and GA responsive genes, in line with the growth promoting behaviour. This suggests that GA levels might vary throughout the day. Light cues, sugar availability, and circadian clock are prime candidate regulators to achieve rhythmic GA biosynthesis over the course of the day. In this chapter, we investigated how these three factors regulate transcription of specific GA biosynthetic genes. Furthermore, we show how these three factors and the corresponding changes in GA biosynthetic gene expression affects GA abundance.
Result
Multigene families of GA biosynthetic genes have specific members that are rhythmic in Arabidopsis rosettes
To observe the rhythmicity of GA biosynthesis genes, we analysed two public microarray datasets with day-night rhythms and with developmental stages and light regime similar to our conditions (Smith: Smith et al., 2004; Stitt: Blasing et al., 2005). From all the genes involved in GA biosynthesis (Supplemental figure S3.1 and S3.2) we found several genes that have diurnal rhythmicity, namely KS, GA20OX1, and GA3OX1. KS expression peaks during the day and has reduced transcript abundance during the night (Figure 3.2a). Among five genes from the GA20OX family, only GA20OX1 showed rhythmicity, which peaks during the day (Figure 3.2b). Moreover, only GA3OX1 showed the up and down pattern among four genes in the GA3OX gene family (Figure 3.2c).
Among all GA biosynthesis gene, these three genes showed a strong day-night rhythmicity in transcript abundance. Moreover, these three genes are considered main players in GA biosynthesis and have been widely characterised. To investigate more about the dynamics of these three genes, we also looked at public microarray data from different developmental stages. We picked an additional dataset derived from seedlings besides the Stitt and Smith datasets investigated above (Supplemental figure S3.3). The transcriptional level of KS and GA20OX1 in seedlings showed no rhythmicity and were consistently lower compared to both rosette datasets. Interestingly, GA3OX1 behaviour changes between the two different developmental stages. In seedlings, this gene peaks during the day. As the plants enter the rosette stage, the peak shift to the nighttime. Seedlings showed strong rhythmicity in GA20ox2 and GA3ox1 which was not the case in rosettes. Overall, it seems that seedlings have different dynamics in the expression of GA biosynthetic genes. Based on these results we decided to focus on rosettes and on the GA metabolic enzymes KS, GA20OX1, and GA3OX1 as main candidates for rhythmicity in GA biosynthesis.
Figure 3.2. mRNA abundance of (a) KAURENE SYNTHASE/GA2, (b) GA20OX gene family, and (c)
GA3OX gene family derived from the Smith microarray dataset (Smith et al., 2004). Grey and white boxes
indicate the night and day, respectively. Y-axis indicates the level of transcript abundance. X-axis indicates the Zeitgeber Time (ZT), which starts at the beginning of the day.
KAURENE SYNTHASE is circadianly regulated to ensure daytime expression
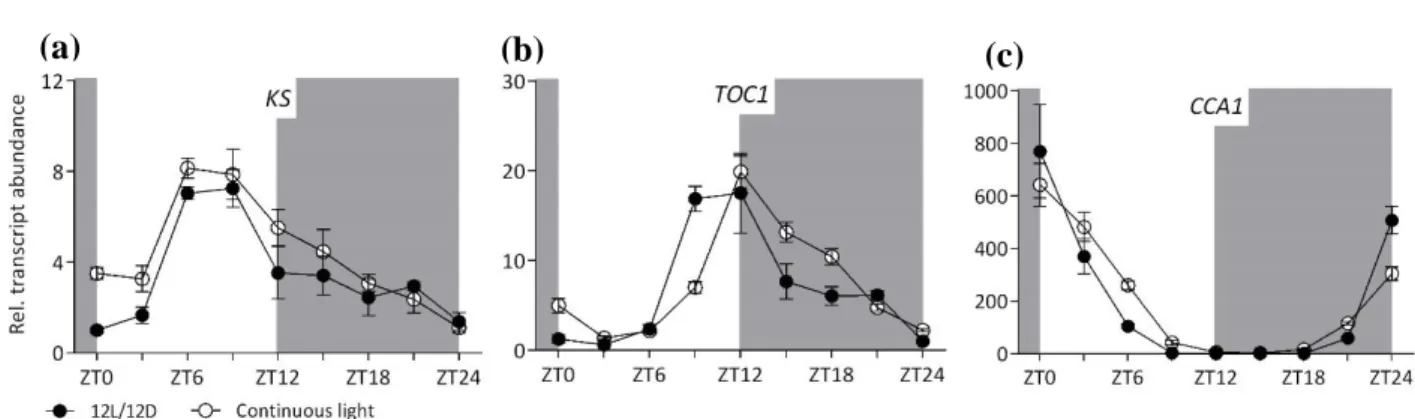
From existing microarray data, we identified which GA biosynthesis and signalling genes showed some level of rhythmicity and were expressed during vegetative stage. To confirm their rhythmic behaviour in adult rosettes and investigate the importance of the circadian clock we followed the transcript abundance over 24 hours under normal (12L/12D) and continuous light conditions (24L). TIMING OF CAB EXPRESSION 1 (TOC1) and CIRCADIAN CLOCK ASSOCIATED 1 (CCA1) are key genes of the circadian clock peaking in expression in the evening and morning, respectively. Both genes retain the rhythmicity of 12L/12D under continuous light conditions, with the corresponding peak expression at ZT12 (TOC1) and ZT0 (CCA1) (Figure 3.3b and c). KS transcript abundance Figure 3.3. Transcript abundance of (a) KAURENE SYNTHASE, (b) TOC1, and (c) CCA1. Grey and white
boxes indicated night and day, respectively. Y-axis indicates the fold-change level of transcript abundance. X-axis indicates the Zeitgeber Time (ZT). Mean ± SEM (n=4) is shown.
(a) (b) (c)
(a) (b) (c)
(d)
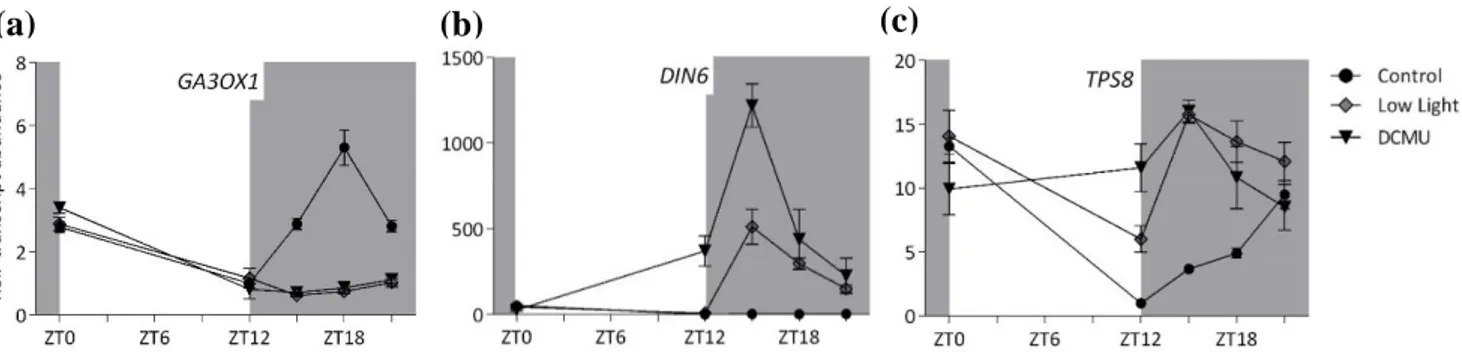
Figure 3.4. Transcript abundance of (a) KAURENE SYNTHASE, (b) PRR7, (c)PRR9, (d) TPS8 and (e) DIN6.
The light intensity in control and low light condition is 120 µmol·m-2·s-1 and 30 µmol·m-2·s-1, respectively.
DCMU concentration is 100 µM applied at ZT0. Grey and white colour in the graph indicate night and day respectively. Y-axis indicates the fold-change levels of transcript abundance. X-axis indicates the Zeitgeber Time (ZT). Mean ± SEM (n=4) is shown.
34 peaked at ZT6 and started decreasing towards the end of the day under the 12L/12D light regime (Figure 3.3a). The same rhythm was also observed in continuous light conditions, indicating that this gene is controlled by the circadian clock.
To look at the role of sugar availability in the rhythmicity of KS transcript abundance, we performed a DCMU application to block photosynthesis activity and so limit carbon availability. DCMU has very strong effects, to probe the effect of a mild reduction in sugars, a low light treatment was included. The determination of light intensity was tested in an independent experiment and was chosen such that the plant still produces sugars during the day to maintain of positive carbon balance and produce a little starch (Supplemental figure S3.5). No peak was observed in KS transcript abundance at ZT9 in both DCMU and low light treatment (Figure 3.4a). For DARK INDUCIBLE 6 (DIN6) and TREHALOSE-6-PHOSPHATE SYNTHASE 8 (TPS8), typical carbon starvation marker genes (Usadel et al., 2008), the relative transcript abundance increased significantly as a sign of starvation condition in DCMU treatment (Figure 3.4d and e). TPS8 was also induced under low light conditions.
Carbon availability and light are considered important cues for entraining circadian clock (Haydon et al., 2015; Seki et al., 2017). Therefore, we also investigated how the difference in light and sugar availability affected the transcript abundance of midday-expressed genes of the circadian clock, whose timing coincide with KS. PSEUDO-RESPONSE REGULATOR 7 (PRR7) transcript abundance increased during the day, reached the peak at the middle of the day, and slowly decreased at the last part of the day (Figure 3.4c). A different pattern was observed in the DCMU treatment as the transcript abundance is rapidly increased and reaches 3-fold difference compared to the control and low light condition at ZT9. Low light treatment has a significant impact in PRR9 transcript abundance which shows 4-fold difference in transcript level relative to control condition. On the other hand, DCMU treatment only slightly affected PSEUDO-RESPONSE REGULATOR 9 (PRR9) rhythmicity which observed slightly higher at ZT6 and ZT9 compared to low light and control condition. No clear correlation was found between KS suppression after DCMU and low light and alterations of the clock, suggesting that suppression by low carbon availability does not occur via the clock. Overall the results showed that the circadian clock regulates KS rhythmicity, and that carbon availability determined the strength of midday transcriptional induction.