based on marker tracking for robotic assisted
minimally invasive spine surgery
Francesca Pia Villani1[0000−0001−6883−1618], Mariachiara Di
Cosmo1[0000−0002−0269−4304], ´Alvaro Bertelsen Simonetti2[0000−0003−2421−9202],
Emanuele Frontoni1[0000−0002−8893−9244], and Sara Moccia1[0000−0002−4494−8907]
1 Department of Information Engineering, Universit`a Politecnica delle Marche,
Ancona, Italy
2 eHealth and Biomedical Applications, Vicomtech, San Sebasti´an, Spain
[email protected], [email protected], [email protected], [email protected], [email protected]
Abstract. Spine surgery is nowadays performed for a great number of spine pathologies; it is estimated that 4.83 million surgeries are car-ried out globally each year. This prevalence led to an evolution of spine surgery into an extremely specialized field, so that traditional open in-terventions to the spine were integrated and often replaced by minimally invasive approaches. Despite the several benefits associated to robotic minimally invasive surgeries (RMIS), loss of depth perception, reduced field of view and consequent difficulty in intraoperative identification of relevant anatomical structures are still unsolved issues. For these rea-sons, Augmented Reality (AR) was introduced to support the surgeon in surgical applications. However, even though the irruption of AR has promised breakthrough changes in surgery, its adoption was slower than expected as there are still usability hurdles. The objective of this work is to introduce a client software with marker-based optical tracking capa-bilities, included into a client-server architecture that uses protocols to enable real-time streaming over the network, providing desktop render-ing power to the head mounted display (HMD). Results relative to the tracking are promising (Specificity=0.98 ±0.03; Precision=0.94 ±0.04; Dice=0.80 ±0.07) as well as real-time communication, which was suc-cessfully set.
Keywords: Augmented Reality · Marker Tracking · Spine Surgery.
1
Introduction
The incidence of spinal disorders has undergone a huge increase in the last few years, reaching epidemic extensions. It is estimated that globally 4.83 million spinal operations are annually performed [6]. This growing trend was related to the aging population, greater disease prevalence, improved diagnostic modali-ties, development of new surgical techniques, and an increased number of spine
surgeons [16]. Over the past few decades, spine surgery has become an extremely specialized field; highly complex procedures are more and more performed, across all age groups, and often through minimally invasive approaches [19]. Traditional open interventions to the spine, although familiar to surgeons, are associated with morbidity, increased blood loss, increased postoperative pain, longer recov-ery time, and impaired spinal functions. Thus, less invasive techniques that can provide equivalent or better outcomes compared with conventional spine surgery, while limiting approach-related surgical morbidity, are desirable [17].
Minimally invasive surgeries (MIS) procedures are characterized by small surgical incisions, minimal disruption of musculature, intraoperative monitor-ing and imagmonitor-ing modalities. The use of small surgical incisions was associated with less surgical-related morbidity, better long-term postoperative outcomes, and decreased costs mostly due to shorter postoperative hospital stays [20]. Un-der this scenario, surgical robots emerged during the ‘90s [10] and from then, progresses to optimize the use of robotic technology were made. Robotic min-imally invasive surgeries (RMIS) in fact, increase surgeons ability with tremor compensation, allowing the use of more sophisticated control strategies (e.g., vir-tual fixture) [12]. Nevertheless, as spine surgeons are familiar with the patient anatomy when it can be directly visualized and MIS generally limits the area of surgical interest, certain key anatomic landmarks can be lost [13]. Moreover, RMIS is associated with reduced field of view and consequent difficulty in in-traoperative identification of relevant anatomical structures. For these reasons, RMIS is more technically demanding; however operative times and complications are reduced as the surgeon becomes more experienced with the technique [11].
A solution for these problems can be found in augmented reality (AR), an imaging technology which provides digital contents that augment information di-rectly on the real world. AR creates opportunities for new medical treatments: in fact, various imaging methods can be used to guide surgical instruments through the body without the physician direct sight [5]. Thanks to AR, sensitive struc-tures placed in the surgical field can be identified in the pre-operative plan, and their intra-operative position can be retrieved in order to avoid the interaction of the robot with these structures [1]. Moreover, AR enables the surgeon direct sight on the surgical area, without the need to switch between screen and patient, and it is associated with increased safety and accuracy, and reduced amount of intraoperative radiation (as it happens when using fluoroscopy) [23].
Although AR is not a new technology and it has made progresses in the past years, with considerable benefits for both patient care and surgical perfor-mance, its adoption in the surgical field is still impeded by a set of technological barriers regarding handling, feasibility, hardware limitations, and the high cost of the instruments, which reduces the possibility of a wider development of this surgery [21]. One of the greatest limitations of AR is the low frame rate achieved by the head mounted display (HMD). Another problem is the need of real-time patient motion tracking, which is required to accurately position the instru-ments. This is usually solved by positioning markers on the patient body or on the robot end-effector, whose position in space is measured by tracking devices.
The marker to be placed is printed and then attached to the patient skin or to the robot end-effector. In the first case it is fixed using any kind of existing bio-compatible transparent tape or glue, paying attention to the placement of the marker in a smooth and planar site; in the second one, it is attached to the robot and then covered with a sterile transparent foil. The marker usually does not affect the intervention but problems could arise due to occlusion, which can occur if the marker is partially covered, and the augmented scene is suppressed or visualized on top of real objects (e.g. surgical instruments or surgeon hands) [7]. Multiple tracking technologies were proposed but they are characterized by different drawbacks: optical tracking requires direct line of sight between a set of stereo cameras and the markers -which is difficult to achieve in a crowded operating room (OR)- while electromagnetic tracking precision is reduced by the proximity of metallic objects. Optical tracking normally achieves tracking errors of several millimeters [22], which is not sufficient for high-precision interventions such as spine surgery. However, previous studies made with electromechanical tracking show the potential to achieve tracking errors < 1 mm, which is a great improvement over existing technology [2].
In this work, a marker-based optical tracking is proposed, in which two-dimensional open source markers were used. It was tested and evaluated with different metrics and then integrated in a client-server architecture, on which computationally intensive tasks are performed on remote servers, leaving the wearable devices in charge of rendering the final frames transmitted as a video stream.
2
Methods
2.1 Marker system selection
For the client software implementation, open-source libraries were used as a starting point for the development of a marker detection and tracking algorithm and for the integration of this algorithm on the HoloLens 13. The marker
track-ing algorithm was developed taktrack-ing as reference OpenCV 4, an open source
Computer Vision library, which offers infrastructures for real time applications. In OpenCV the ArUco module, based on the ArUco library [8, 14], was used to implement the tracker application. ArUco library was chosen among the many fiducial marker detection systems available, as it is the most popular and reliable one. In fact, ArUco is robust and able to detect and correct binary code errors, it is characterized by a good performance at a wide range of marker orienta-tions and great adaptability to non-uniform illumination condiorienta-tions [14, 15]. The algorithm and the libraries were mainly implemented in C++.
Experimental design: The marker tracking algorithm was firstly tested on a desktop application acquiring video of markers with a smartphone, later Adobe After Effect [4] was used to simulate an intraoperative scenario and finally
3
https://docs.microsoft.com/it-it/hololens/
4
Fig. 1: Phases of ArUco marker tracking.
it was adapted to be used as Universal Windows Platform (UWP) application for HoloLens in the context of server-client communication. The diagram in Fig. 1 shows the phases of the tracking algorithm based on fiducial bitonal markers. ArUco markers are synthetic square markers composed by a black border and an inner binary matrix which determines their identifier (ID). The marker black border facilitates its fast detection in the image and the binary codification allows its identification and the application of error detection and correction techniques [8].
The marker size defines the dimension of the internal matrix (such as, a marker size of 4x4 is composed by 16 bits); markers can be found rotated in the environment, as the detection process is able to determine the original rotation, so that each corner is identified unequivocally. A dictionary of markers is the set of markers that are considered in a specific application, it is the list of binary codifications of each of its markers. The marker ID is the marker index within the dictionary it belongs to [7]. Starting from an image containing ArUco markers, the detection process must return a list of detected markers. Each detected marker includes the position of its four corners in the image (in their original order) and the ID of the marker. In this work a 4x4 dictionary was used.
Calibration of the system: Camera calibration is the process of obtaining intrinsic and extrinsic camera parameters which allows to determine where a 3D point in the space projects in the camera sensor (pose estimation). In this work the OpenCV routine was used [3, 24]. OpenCV uses the pinhole camera model in which a scene view is formed by projecting 3D points into the image plane through a perspective transformation. The camera parameters can be divided into intrinsics and extrinsics. Intrinsic parameters include focal length of the camera lens in both axes, optical center of the sensor and distortion coefficients. The calibration was done by targeting the camera on a known structure, a flat pattern of alternating black and white squares (chessboard) [24].
By viewing this structure from various angles, it is possible to obtain the (relative) location and orientation of the camera for each image in addition to the intrinsic parameters of the camera. To provide multiple views, the board was rotated and translated while keeping the camera fixed to acquire the images (80 images of a 9x6 chessboard with square dimension of 24mm). At the end of the calibration process, results were saved into an XML file (which contains intrinsics and extrinsics parameters, and camera matrix), and it was used in the routine to estimate the pose and to track ArUco markers.
2.2 Server-Client communication
Once obtained a working desktop application it was adapted to be used with HoloLens 1 and included in the client-server architecture. DirectX 5 and We-bRTC 6 (Web Real-Time Communications) were used to deliver desktop ren-dering power to HoloLens, so that the entire computation is done on the server side and HoloLens becomes a viewer. The proposed visualization architecture in-cludes three interconnected applications, running at the same time: the HoloLens Client, the Windows Desktop Server, and a Signaling Server which manages the communication and connection between the first two. This architecture was built on the 3DStreamingToolkit7 which uses the WebRTC protocols, as well as the
NVEncode hardware encoding library from NVIDIA8. The hardware
architec-ture used to establish the communication includes three components: a router, a desktop Windows server (hosting the rendering server and the signaling server9),
and the HoloLens 1 running the DirectX HoloLens Client. A local network was used for communication as it enables control, reliability, transmission speed and latency. The peers interact with the signaling server to share the handshakes and start a direct peer-to-peer transmission. After this, data are sent directly between client and server.
2.3 Evaluation protocol
The following metrics were used to qualitatively analyze the marker-based optical tracking system:
– Localization accuracy of the marker pose: it is important, in spine surgery, to test how accurately the position and orientation of the marker were de-termined by the localization algorithm.
– Runtime performance: to measure how long it takes to process a frame is an important parameter to consider: in fact, the algorithm being part of a real time application needs to have a fast processing time. A timer was integrated in the algorithms to get the time the system needs to process
5 https://docs.microsoft.com/it-it/windows/mixedreality/ 6 https://webrtc.org/ 7 https://3dstreamingtoolkit.github.io/docs-3dstk/ 8 https://www.nvidia.com/ 9 https://github.com/anastasiiazolochevska/ signaling-server
one frame. The running time was measured at a distance of 40 cm between the marker and the camera, a marker size of 4 cm and a static scene with constant lighting conditions. Furthermore, to ensure consistent results, the measurements were performed several times and finally the average of the detection rate for 100 frames was determined.
– Robustness: to test how the system behaves in different environment condi-tions. It is important to consider the environment in which a marker system is used, in fact parameters as illumination conditions and partial occlusion of the marker play an important role [9]. For these tests, a marker grid was used. The detection rate was first determined with three different light con-ditions, from low to strong light (typical condition in an OR). Moreover, in the OR it is often required to cover the marker with a protective transparent foil, which can lead to light reflection and therefore to partial masking of the marker. To simulate this scenario the marker grid was coated firstly with a transparent smooth foil, and then with a transparent crumpled foil.
All these metrics were evaluated by recording a set of videos containing a variable number of markers (1 to 35), with a Huawei P20 camera, using an image resolu-tion of 1080 x 1920 pixels. All tests were performed using an Intel Core i5-7200U 2.50GHz x 4-core processor with 12GB RAM running Windows10 (10.0.18363).
The correct detection of markers is a critical aspect that must be analyzed to verify that the proposed algorithm is able to obviate redundant information present in the scene, extracting exclusively marker information. To assess the quality of the tracked marker pose, it is necessary to know the marker pose as ground truth. The ground truth used was extracted from the thresholding process involved in the detection of the marker. Then indexes were calculated in MATLAB 2018a10: multiple frames containing the marker in gray scale were analyzed and compared with a mask. The mask was created using the function roipoly, which creates an interactive polygon tool associated with the image displayed in the current figure and returns the mask as a binary image, setting pixels inside the Region Of Interest to 1 and pixels outside to 0. The segmented image is then confronted with the ground truth.
The quality of the proposed algorithm was assessed calculating the following spatial overlap-based metrics:
Accuracy: assesses the extent to which a binary segmentation method correctly identifies or excludes a condition. It is defined by: Accuracy = T P +T N
T P +F P +T N +F N,
where TP, TN, FP, FN mean true positive, true negative, false positive and false negative, respectively.
Sensitivity: also known as True Positive Rate (TPR) or Recall, defines the por-tion of positive voxels in the ground truth which are also identified as positive by the evaluated segmentation. It is defined by: Sensitivity = T P +F NT P .
Specificity: or True Negative Rate (TNR), measures the portion of negative voxels (background) in the ground truth segmentation that are also identified as
10
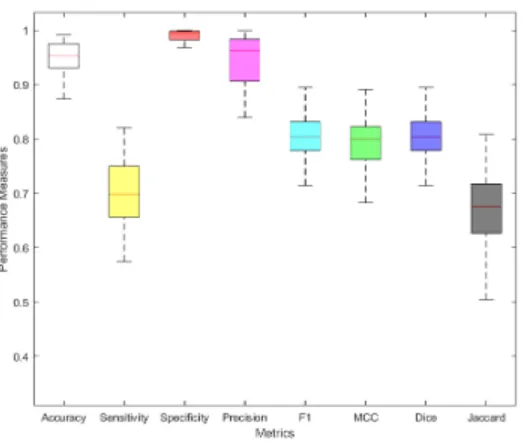
Fig. 2: Boxplot of the different metrics used to evaluate the localization accuracy of the pose estimation.
negative by the evaluated segmentation. It is defined by: Specif icity = T N +F PT N . Precision: or Positive Predictive Value (PPV ), is not usually used in validation of medical images, but it is used to calculate the F-Measure. It is defined by: P recision = T P +F PT P .
F1-measure: Fβ-Measure is a balance between precision and recall. Fβ-Measure is defined by: F M Sβ = (β
2+1) ·P P V ·T P R
β2 · P P V + T P R . When β = 1.0 (precision and recall
are equally important), it becomes F1-Measure (FMS1 ). It is also known as har-monic mean, and it is defined by: F M S = P P V + T P R2·P P V ·T P R.
MCC: or Matthew Correlation Coefficient, is used to assess performances, has a range of -1 (completely wrong binary classifier) to 1 (completely right binary classifier). It is defined by: M CC = √ T P ·T N − F P ·F N
(T P +F P ) (T P +F N ) (T N +F P ) (T N +F N ).
Dice: or Dice Similarity Index, evaluates the similarity between prediction and ground truth, by measuring the TP found and penalizing the FP found. It is defined by: Dice = 2·T P + F P + F N2·T P .
Jaccard: the Jaccard index or Jaccard similarity coefficient, evaluates the sim-ilarity and diversity of sample sets. It has a relation with Dice, and it is defined by: J accard = T P + F P + F NT P .
3
Results
3.1 Localization accuracy of the pose estimation
The establishment of how accurately the position and orientation of the marker is performed by the localization algorithm is particularly important. It was found that augmenting the distance between the marker and the camera the accuracy decreases, while with a fixed distance accuracy improves with increasing marker
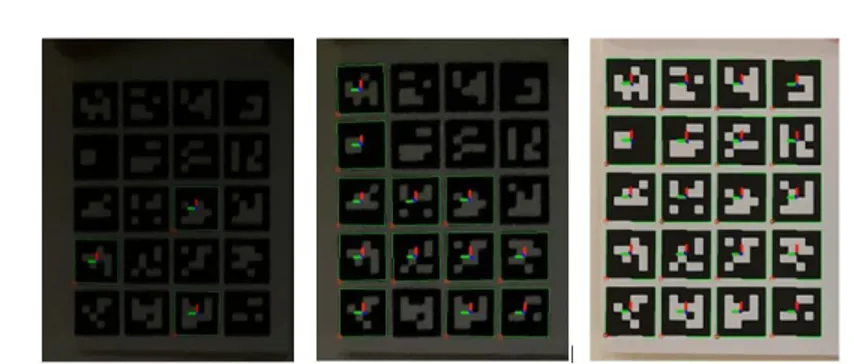
Fig. 3: Detection of an ArUco marker grid under three different light conditions. From left: low light, medium light and bright light.
Table 1: Average time of detection and pose estimation.
Process Runtime: 1 marker( ms
f rame) Runtime: 5x4 grid ( ms f rame)
Marker detection 224.74 502.68 Pose estimation 231.07 552.65
size. For these reasons all the tests were performed at a distance of 40-60 cm from the sensor to the marker, using a marker size of 3-5 cm.
The performance was assessed through several spatial overlap-based metrics calculated on individual frames from video sensor data. All the items were indi-vidually tested to verify the presence of a match between the frame under test and the ground truth, for each video frame. The performance on each individ-ual frame was then averaged over the total to develop performance scores. The statistics of the computed performance measures are reported in Fig. 2 which shows the relative boxplots; while mean values and standard deviation (SD ) are listed in Tab. 2.
Table 2: Mean value and standard deviation of the metrics used to evaluate the localization accuracy of the pose estimation.
Metric Mean SD Accuracy 0.94 ±0.04 Sensitivity 0.70 ±0.10 Specificity 0.98 ±0.03 Precision 0.94 ±0.07 F1 0.80 ±0.07 MCC 0.78 ±0.08 Dice 0.80 ±0.07 Jaccard 0.67 ±0.10
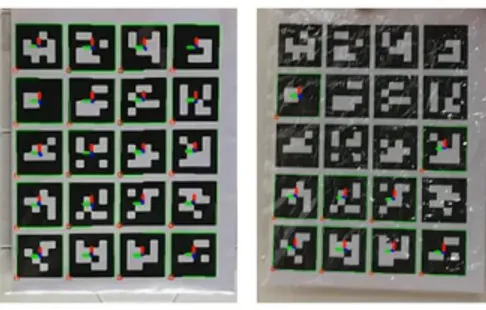
Fig. 4: Samples of the detection of ArUco marker grid covered with largely smooth foil (left) and covered with a crumple-rich foil (right).
Specificity which indicates the ability to correctly generate a negative result when the marker is not present in the scene (high TNR) has shown the highest value among the indexes.
3.2 Runtime
Results of the experiments done to determine the time required to process a frame to detect and estimate the pose of a single marker of size 4 cm and of 20 markers arranged on a 5x4 grid, at a camera distance of 40 cm in a stationary scene with constant illumination conditions, are presented in Tab. 1.
3.3 Robustness to external influences
The detection rates of the markers for each of the following conditions were calculated dividing the number of markers correctly identified by the total num-ber of markers in the grid. Fig. 3 shows a picture of the camera detecting the marker grid at the three different light conditions (dark, medium and bright), while Fig. 4 shows the influence of covering on marker detection. Detection rates of each trial are shown in Tab. 3. Even with medium lighting the detection of ArUco is possible with 42.7% in almost half of all images, while with a very low lighting the rate decreases at 3.5%.
Table 3: Detection rates under different lighting and covering conditions.
Condition Detection rate Low light 3.5 % Medium light 42.7% Bright light 100% Smooth foil 98 % Crumpled foil 47 %
(a) (b)
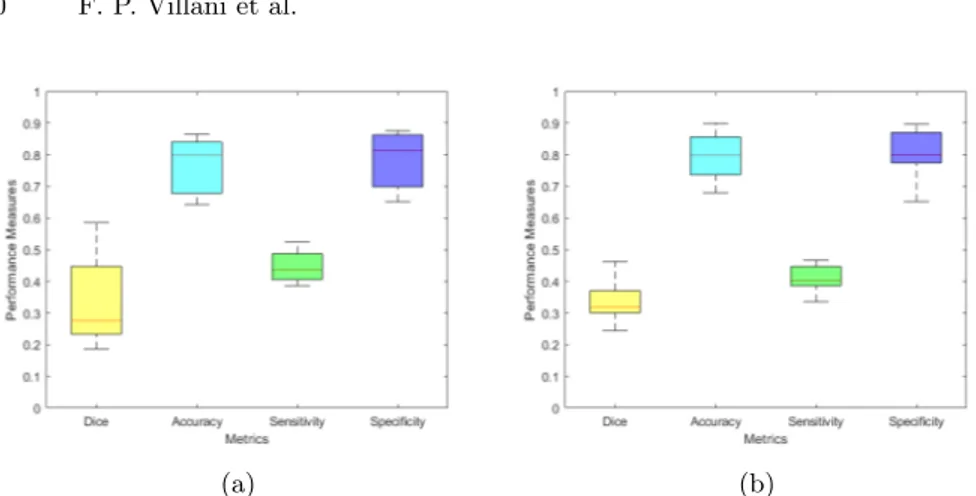
Fig. 5: Localization accuracy metrics. (a) Boxplot of the metrics used to evaluate the marker detection ability in condition of medium light. (b) Boxplot of the metrics used to evaluate the marker detection ability in presence of a crumpled covering foil.
Results obtained covering the marker grids with transparent foils to simulate the sterile coating of the OR are dependent on the degree of crumpling: the higher the folds, the stronger the generated light reflection and the lower the detection rate.
In Fig. 5 the boxplot of metrics used to evaluate the localization accuracy in presence of dark light and in presence of a crumpled foil covering the marker are shown. Significant differences were observed in Dice index and the Sensitivity values if compared with the ones of the detection performance in optimal condi-tions. Reduced marker detection rates in these conditions can be also observed in the reduction of these values. Accuracy and Specificity have similar values both in the optimal condition and in case of external disturbances.
3.4 Communication and 3D visualization
Communication was successfully set between the rendering server and two differ-ent DirectX clidiffer-ents (desktop and HoloLens). Once launched the signaling server, the rendering server and the client were connected to it and started to exchange information.
As a first trial to test the communication, a spinning cube was remotely ren-dered and visualized on a desktop client in the 3DStreamingToolkit environment. Then, the same desktop client was used to receive a rendered frame implemented on a VTK server. These tests were conducted on a computer receiving the frames from a remote host running both signaling and rendering servers; 60 frames per second (FPS) were obtained almost all the time.
Later, communication with the HoloLens client was verified. The client was developed in Visual Studio 2017 as UWP application and then deployed on HoloLens. An application that renders the model of a vertebra developed on a
Fig. 6: Picture of the HoloLens client showing the model of a vertebra that was previously remotely rendered on a Unity server and then transmitted to the headset through 3DStreamingToolkit communication architecture.
Unity rendering server was transmitted and effectively visualized on HoloLens as can be seen in Fig. 6.
4
Discussion
Results of spatial overlap-based metrics are promising: among the indexes Speci-ficity shows the highest value (mean=0.98 ±0.03), thus the algorithm rarely gives positive results in absence of marker. This is most likely due to the small dimension of the marker and so to the small portion occupied in the scene, which leads to the identification of a lot of TN. This finding is further strengthened by the result of the FPR as function of the marker size in the image, which resulted to be zero in all cases tested.
Accuracy (mean=0.94 ±0.04) and Precision (mean=0.94 ±0.07) have the highest values after Specificity. Accuracy is a measure of the system performance in relation to both correctly detecting and correctly rejecting targets, so a high value can be interpreted as the capability of the algorithm to consider only TP, rejecting FP. This is also confirmed by the high resultant value of Precision, which is the fraction of detected items that are correct, and the high value of the F1-measure (mean=0.80 ±0.07) which gives an estimate of the accuracy of the system under test.
The Dice coefficient is the most used statistical metric in validating seg-mentations. Besides the direct comparison between manual and ground truth segmentations, usually the Dice is used to measure reproducibility (repeatabil-ity) and accuracy of manual segmentations and the spatial overlap accuracy [25]. Results show a high value of the Dice coefficient (mean=0.80 ±0.07), suggesting that the outcomes match the ground truth with a high extent, thus the marker is detected in the correct position. The F1-measure is mathematically equivalent to Dice [18], in fact their resultant values are the same.
The MCC index shows how the manually segmented image is correlated with the annotated ground truth. The promising resultant value of the index
(mean=0.79 ±0.08) indicates the consistency and capability of the proposed algorithm in correctly identifying, tracking and estimating the pose of markers in the scene.
In this study, the optimal size of the marker was determined based on the detection rate, resulting in a marker dimension of 3-5 cm at a distance of 40-60 cm from the sensor. It was also observed that the dimension of the marker and the distance from the camera influence the computation speed: the higher is the marker size and the smaller is the distance from the camera, the faster is the detection. This finding is in accordance with the literature [14].
Regarding the runtime, the obtained results (224.74 ms for single marker detection and 231.07 ms for pose estimation) were found to be a bit higher than in the literature [7]. However, as the selection of the camera influences the runtime of the marker detection, the obtained runtime is supposed to be influenced by the used hardware (both camera and computer used to process the frames). It was also observed that increasing the number of markers in the scene the runtime increases.
About findings on the capability of the algorithm to correctly identify mark-ers in worse conditions like partial occlusion, results show that noise resilience decreases (detection rate = 47%) when covering the markers with a crumpled foil: this is due to the higher reflection that is generated, thus the inability of the algorithm to find the corners of the markers and estimate their IDs. While for the illumination criteria, detection rate decrease up to 3.5%, suggesting the inability of the algorithm to detect markers in condition of reduced illumination. Results from the boxplots of metrics used to evaluate the algorithm performance in these conditions show that the match with the ground truth is low (Dice), so the marker is often detected in the wrong position. On the other hand, Accuracy and Specificity have similar values both in the optimal condition and in case of external disturbances, and this is due to the fact that even with worse conditions a smaller percentage of markers is correctly identified.
Results related to the communication and 3D visualization are still partial. If on one side the communication between the rendering server and the DirectX clients was successfully set, on the other side the client needs to be completed integrating the tracking algorithm to send information regarding the marker pose to the robot, in order for the server to read the last transform messages coming from the glasses and tracker, and to upload its position. To do so, the tracking applications already adapted for this work need to be fused together to obtain a final one capable to access the camera frame and use the OpenCV libraries.
5
Conclusion
This paper is part of a project which was developed starting from the idea to provide assistance to the surgeon during spine surgery, by visualizing the area of interest using an AR device. More practically, the proposed system will
help the surgeon both to develop pre-operative plans (to study the patient’s anatomy through different imaging techniques used to generate the AR scene to be visualized on the HMD and overlaid on specific anatomical sites) and to visualize patient structures without cutting or disrupting tissues, to perform low-risk surgeries, and minimize side effects and operational time.
To reach this goal a marker tracking algorithm was developed to detect ArUco markers attached to the patient’s skin or to the robot end effector to track move-ments. ArUco markers characteristics (reliability, robustness, ability to detect and correct errors, good performance, adaptability to non-uniform illumination conditions) led to the choice of this system among the many available [14].
To use the developed algorithm directly on HoloLens and integrate it in an AR application, it was included in a system which permits real time communi-cation between server and client through the WebRTC protocol. The HoloLens in this architecture was used as client to receive frames remotely rendered on a desktop server, via a signaling server. The use of remote rendering allows the of-floading of heavy GPU tasks from the HoloLens client, increasing the possibility to achieve a real-time framerate of 30 FPS.
At present the client-server system is still at an early stage, the integration of the tracking algorithm directly on the headset system is essential to trans-mit the marker pose to the robot allowing it to adjust its position accordingly. Nevertheless, the current state of the application provides an evidence that this architecture and current materials may be implemented with positive outcomes. In fact, with current tools, the tested application shows the 3DStreamingToolkit desktop client receiving the rendered frame, with 60 FPS obtained almost all the time. This result is promising as the final goal for the use of AR in the surgical world is the achievement of a real-time framerate of 30 FPS at least.
As a next step, deep learning techniques could also be included in the marker tracking to improve the detection process and provide better performances for pose estimation. However, to avoid delays and keep the real-time characteristics needed for this system, this step should be offloaded on the server side.
To conclude, it is acknowledged that additional research is required to im-prove the proposed architecture so that, once attained the required adjustments, the presented system has the potential to be used in the medical field.
References
1. Bernhardt, S., Nicolau, S.A., Soler, L., Doignon, C.: The status of augmented reality in laparoscopic surgery as of 2016. Medical Image Analysis 37, 66–90 (2017) 2. Bertelsen, A., Scorza, D., Cort´es, C., O˜nativia, J., Escudero, A., S´anchez, E., Presa, J.: Collaborative robots for surgical applications. ROBOT 2017: Third Iberian Robotics Conference Advances in Intelligent Systems and Computing p. 524–535 (2017)
3. Bradski, G., Kaehler, A.: Chapter 11. Camera Models and Calibration, p. 370–403. O’REILLY Media (2008)
4. Christiansen, M.: Adobe After Effects CC Visual Effects and Compositing Studio Techniques. Adobe Press (2013)
5. De Paolis, L.T.: Augmented Reality in Minimally Invasive Surgery, vol. 55, p. 305–320. Springer (2010)
6. Fiani, B., Quadri, S.A., Farooqui, M., Cathel, A., Berman, B., Noel, J., Siddiqi, J.: Impact of robot-assisted spine surgery on health care quality and neurosurgical economics: A systemic review. Neurosurgical Review 43(1), 17–25 (2018)
7. Garrido-Jurado, S., Mu˜noz-Salinas, R., Madrid-Cuevas, F., Mar´ın-Jim´enez, M.: Automatic generation and detection of highly reliable fiducial markers under oc-clusion. Pattern Recognition 47(6), 2280–2292 (2014)
8. Garrido-Jurado, S., Mu˜noz-Salinas, R., Madrid-Cuevas, F., Medina-Carnicer, R.: Generation of fiducial marker dictionaries using mixed integer linear programming. Pattern Recognition 51, 481–491 (2016)
9. Kunz, C., Genten, V., Meissner, P., Hein, B.: Metric-based evaluation of fiducial markers for medical procedures. Medical Imaging 2019: Image-Guided Procedures, Robotic Interventions, and Modeling (2019)
10. Kwoh, Y., Hou, J., Jonckheere, E., Hayati, S.: A robot with improved absolute positioning accuracy for ct guided stereotactic brain surgery. IEEE Transactions on Biomedical Engineering 35(2), 153–160 (1988)
11. Lau, D., Han, S.J., Lee, J.G., Lu, D.C., Chou, D.: Minimally invasive compared to open microdiscectomy for lumbar disc herniation. Journal of Clinical Neuroscience 18(1), 81–84 (2011)
12. Moccia, S., Foti, S., Routray, A., Prudente, F., Perin, A., Sekula, R.F., Mattos, L.S., Balzer, J.R., Fellows-Mayle, W., De Momi, E., et al.: Toward improving safety in neurosurgery with an active handheld instrument. Annals of Biomedical Engi-neering 46(10), 1450–1464 (2018)
13. Phillips, F., Lieberman, I., Polly, D.: Chapter 1: History and Evolution of Mini-mally Invasive Spine Surgery. Springer (2014)
14. Romero-Ramirez, F.J., Mu˜noz-Salinas, R., Medina-Carnicer, R.: Speeded up de-tection of squared fiducial markers. Image and Vision Computing 76, 38–47 (2018) 15. Sagitov, A., Shabalina, K., Lavrenov, R., Magid, E.: Comparing fiducial marker systems in the presence of occlusion. 2017 International Conference on Mechanical, System and Control Engineering (ICMSC) (2017)
16. Salzmann, S.N., Derman, P.B., Lampe, L.P., Kueper, J., Pan, T.J., Yang, J., Shue, J., Girardi, F.P., Lyman, S., Hughes, A.P., et al.: Cervical spinal fusion: 16-year trends in epidemiology, indications, and in-hospital outcomes by surgical approach. World Neurosurgery 113 (2018)
17. Schwender, J., Holly, L., Transfeldt, E.: Minimally invasive posterior surgical ap-proaches to the lumbar spine. Saunders/Elsevier, 5th edn. (2006)
18. Taha, A.A., Hanbury, A.: Metrics for evaluating 3D medical image segmentation: analysis, selection, and tool. BMC Medical Imaging 15(1) (2015)
19. Tandon, M.: Chapter 24: Spinal Surgery, p. 399–439. Hemanshu Prabhakar (2017) 20. Topcu, O., Karakayali, F., Kuzu, M., Aras, N.: Comparison of long-term quality of life after laparoscopic and open cholecystectomy. Surgical Endoscopy 17(2), 291–295 (2003)
21. Vadal`a, G., De Salvatore, S., Ambrosio, L., Russo, F., Papalia, R., Denaro, V.: Robotic spine surgery and augmented reality systems: A state of the art. Neu-rospine 17(1), 88–100 (2020)
22. V´avra, P., Zonˇca, P., Ihn´at, P., Nˇemec, M., Kumar, J.: Recent development of augmented reality in surgery: A review. Journal of Healthcare Engineering (2017) 23. Yoo, J.S., Patel, D.S., Hrynewycz, N.M., Brundage, T.S., Singh, K.: The utility of virtual reality and augmented reality in spine surgery. Annals of Translational Medicine 7(S5) (2019)
24. Zhang, Z.: A flexible new technique for camera calibration. IEEE Transactions on Pattern Analysis and Machine Intelligence 22(11), 1330–1334 (2000)
25. Zou, K.H., Warfield, S.K., Bharatha, A., Tempany, C.M., Kaus, M.R., Haker, S.J., Wells, W.M., Jolesz, F.A., Kikinis, R.: Statistical validation of image segmenta-tion quality based on a spatial overlap index. Academic Radiology 11(2), 178–189 (2004)