A REVIEW OF NUMERICAL MODELLING OF THE DYNAMICS
OF MICROSTRUCTURAL DEVELOPMENT IN ROCKS AND
ICE: PAST, PRESENT AND FUTURE
S. Piazoloa, P.D. Bonsb, A. Grierac, M.-G. Llorensb, E. Gomez-Rivasd,e, D. Koehnf,
J. Wheelerg, R. Gardnerh, J.R.A. Godinhoi, L. Evansj, R.A. Lebensohnk and M.W.
Jesselll
a School of Earth and Environment, University of Leeds, Leeds LS2 9JT, UK
b Department of Geosciences, Eberhard Karls University Tübingen, Wilhelmstr. 56, 72074 Tübingen,
Germany
c Departament de Geologia, Universitat Autònoma de Barcelona, 08193 Bellaterra (Cerdanyola del
Vallès), Spain
d Departament de Mineralogia, Petrologia i Geologia Aplicada, Universitat de Barcelona, 080280
Barcelona, Spain
e School of Geosciences, King's College, University of Aberdeen, Aberdeen AB24 3UE, UK
f School of Geographical and Earth Sciences, Gregory Building, University of Glasgow, Glasgow G12
8QQ, UK
g Dept. Earth, Ocean and Ecological Sciences, School of Environmental Sciences, Jane Herdman
Building, Liverpool University, Liverpool L69 3GP, UK
h Australian Research Council Centre of Excellence for Core to Crust Fluid Systems/GEMOC,
Department of Earth and Planetary Sciences, Macquarie University, NSW 2109, Australia
i Henry Moseley X-ray Imaging Facility, School of Materials, The University of Manchester, M13 9PL,
Manchester, UK
j School of Earth, Atmosphere and Environmental Sciences, Monash University, Clayton, Vic 3800,
Australia
k Los Alamos National Laboratory, MST8, MS G755, Los Alamos, NM, 87545, USA
l Centre for Exploration Targeting, School of Earth Sciences, The University of Western Australia, 35
Stirling Hwy, Crawley, 6009, Australia
ABSTRACT: This review provides an overview of the emergence and current status of numerical modelling of microstructures, a powerful tool for predicting the dynamic behaviour of rocks and ice at the microscale with consequence for the evolution of these materials at a larger scale. We emphasize the general philosophy behind such numerical models and their application to important geological phenomena such as dynamic recrystallization and strain localization. We focus in particular on the dynamics that emerge when multiple processes, which may either be enhancing or competing with each other, are simultaneously active. Here, the ability to track the evolving microstructure is a particular advantage of numerical modelling. We highlight advances through time and provide glimpses into future opportunities and challenges.
Keywords: Review; Evolution of microstructures; Numerical modelling; Dynamic recrystallization; Process interaction
This manuscript is published in the Journal of Structural Geology (2019), 125, 111-123.
DOI: 10.1016/j.jsg.2018.05.025. This is an author version of the article. For the final
copy-edited version, please visit:
2
1. Introduction
Structural geology studies how rocks deform under applied stress or strain. These studies are applied from the sub-grain scale to that of mountain belts and tectonic plates. To know what has happened to a volume of rock millions of years ago, or to predict what would happen to a rock volume under certain (future) conditions, we need to know the link between (i) the boundary conditions (e.g. applied stress or strain, pressure-temperature conditions), (ii) the intrinsic material properties (e.g. Young's modulus, crystal symmetry, slip systems) and (iii) the processes that may be activated (e.g. dislocation creep, pressure solution, mineral phase changes). These three together determine the evolution of the state of the rock (e.g. developing cleavage, folds, lineation, stylolites) and its bulk material properties (e.g. viscosity). The microstructure is thus a state variable of a rock, describing the state it achieved as a result of the interplay between various processes and boundary conditions. Importantly, the microstructure is not a passive log of events, but plays an active and central role in the evolution of a rock throughout its history (Gottstein, 2004). In this context non-linear feedback between a specific microstructural configuration and local changes in intrinsic and extrinsic parameters may be important but difficult to predict. Hence, the microstructure is the link that couples the material properties, boundary conditions and processes that together control the behaviour and evolution of a rock. Consequently, the analysis and correct interpretation of microstructures is crucial in gaining an understanding of how rocks, including ice, deform on Earth and other planets. Here we define microstructure as the full spatial, compositional and orientational arrangement of all entities in a rock, typically on the scale of a thin section to hand specimen (roughly μm to cm) (Hobbs et al., 1976). These entities include minerals, grain and subgrain boundaries, crystal lattice orientations, and chemical composition from the nano- to micro-scale.
While the rock's temperature or elastic strain are ephemeral, the microstructure may be preserved for the geologist to interpret millions to billions of years later. Therefore, microstructures are one of the prime forensic tools to unravel the history of a rock that allows us to deduce the succession of strain rates, stresses, diagenetic and metamorphic conditions and the rock's rheology during deformation (e.g. Hobbs et al., 1976; Vernon, 2004; Passchier and Trouw, 2005).
One major problem in microstructural studies is that we normally only have a static record as post-mortem “images” (grain arrangement in thin section, chemical and orientation characteristics derived using electron microscopy, 3D datasets from computer tomography, neutron diffraction and synchrotron beam analysis, etc.). To interpret microstructures, we need to know how they form and change. Means (1977) wrote: “a more valuable kind of kinematic investigation is that in which the time sequence of incremental strains or incremental displacements, the kinematic history, is correlated with progressive structural change. This promises to reveal more about the physics of rock deformation and to provide more sensitive structural methods for reconstructing tectonic history”. Such investigations first became possible using in-situ analogue experiments that were introduced to geology by influential scientists such as Cloos (1955) and Ramberg (1981), and at the microstructural scale by Means (1977). In in-situ analogue experiments by Means (1977), inspired by those of McCrone and Chen (1949), a thin-section sized sample of crystalline analogue material is sandwiched and deformed between glass plates to observe the changing microstructure under a microscope. These experiments were followed by a large number of studies that investigated deformation
3
related features such as dynamic recrystallization and crystal plasticity (e.g. Means, 1977, 1980; Means and Ree, 1988; Park and Means, 1996; Urai et al., 1980; Urai and Humphreys, 1981; Wilson, 1986; Jessell, 1986; Bons and Jessell, 1999; Ree and Park, 1997; Herwegh and Handy, 1998a; b; Nama et al., 1999; Wilson et al., 2014), melt or fluid-bearing microstructures (e.g. Urai, 1983; Rosenberg and Handy, 2000, 2001; Rosenberg, 2001; Schenk and Urai, 2004, 2005; Walte et al., 2005), the development of vein and fringe microstructures (e.g. Hilgers et al., 1997; Koehn et al., 2003) and the formation of δ-clasts (ten Brink and Passchier, 1995). Many of these experiments made clear that when a polycrystalline material deforms, multiple processes act upon the microstructure and govern its dynamic behaviour throughout its deformation and post-deformation history (Fig. 1a; see also movies at http://www.tectonique.net/MeansCD/). In addition, pre-existing heterogeneities and/or those developing during deformation can have a significant effect on the dynamics of the system since local variations in stress and strain play a significant role in the evolution of microstructures and material behaviour, with their effects on chemistry being particularly intriguing (Wheeler, 2018).
Although changes in microstructural characteristics (e.g. grain size) can be quantified in such experiments, the underlying principles of the active processes still need to be deduced. Therefore, an additional tool is needed. Here numerical models simulating microstructural development based on several concurrent processes become important. Such numerical simulations share the advantage of in-situ experiments that the full microstructural development can be traced in form of time-series, with the opportunity to systematically study the effect of different processes and/or pre-existing heterogeneities on the microstructural development. In addition, numerical simulations are neither constrained by time nor specific boundary conditions. Once calibrated against laboratory experiments (e.g. Piazolo et al., 2004) or analytical solutions, they can be applied to a wide range of conditions or materials including those not attainable or suitable for laboratory experiments. In many cases, the developed microphysical behaviour may be applied to problems on the continental scale.
In this contribution, we aim to give an overview of the concepts behind numerical modelling of microstructures, i.e. microdynamic modelling, and the achievements that have been made in this field. This is followed by a selection of examples of the current state of the art. Finally, future possibilities and directions are briefly discussed, including some work in progress. We focus on those studies that (i) are applied to geological materials, (ii) involve several processes and (iii) allow prediction and visualization of the development of the microstructure. Hence, we exclude studies where microstructures are not spatially mapped along with models in which grains are modelled as if embedded in a medium with averaged properties. Table 1 summarizes the microdynamic numerical models cited, the numerical method used and processes included in each model.
2. Numerical simulation of microstructures
2.1. Emergence and philosophy
Soon after the first in-situ experiments, computers had advanced to a stage allowing the first numerical simulations of microstructural development, with a full “image” of the microstructure, to appear in geology (Etchecopar, 1977; Jessell, 1988a,b; Jessell and Lister, 1990). When using such models we accept the fact that the scientific description of the phenomena studied does not fully capture reality. This is not a shortcoming but a
4
strength, as general system behaviour and interrelationships can be studied systematically and transferred to geological questions. In a numerical model the behaviour of a system emerges from the piece-meal enumeration of the behaviour of each of its component parts. As a consequence, numerical models are powerful and necessary when the bulk behaviour is influenced by the local interaction of the components. In contrast, global, averaged or mean field solutions cannot fully encompass the effect of processes that interact with each other on the small scale. In nature, patterns emerge (e.g. orientation and arrangement of high-strain zones, foliation, fractures) which may be used to deduce conditions of their formation. Numerical models are powerful tools to investigate this link between patterns observed in nature and processes that are responsible for their development.
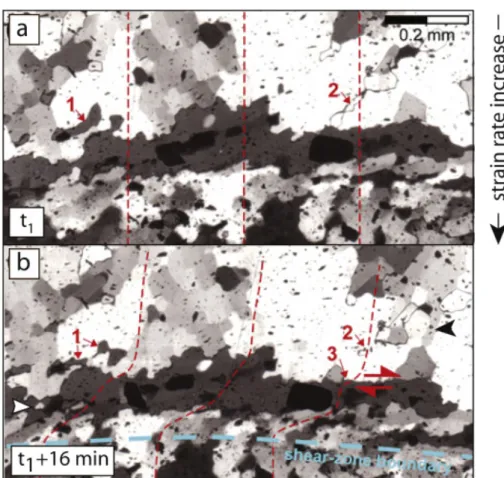
Fig. 1. Microstructural development during in-situ deformation of the rock analogue octochloropropane within a circular shear zone (Bons and Jessell, 1999); dashed red lines indicate the shear distribution between the two steps shown. Experiments run with top to the right shear at an average strain rate of 4.6·10−4 s−1 where the strain rate near edge of the shear zone (1.2·10−3 s−1) is 10× higher than in the top half of the image (1.2·10−4 s−1). (a) t1 at a bulk shear strain of ̴ 40; (b) t1+16 min. Note multiple concurrent
processes: grain boundary migration, leading to dissection of grains (locations 1 & 2), subgrain rotation (black arrow), nucleation (white arrow). The different shear rates lead to a different balance of recrystallization processes and differences in microstructures. At the low shear rate grains are equant, have straight sub-grain boundaries and basal planes at an angle to the NS and EW polarisers. The high-strain rate zone shows serrate grain boundaries, an oblique grain-shape foliation, basal grains approximately parallel to the shear-zone boundary, as well as shear localisation on grain boundaries (location 3), indicative of grain boundary sliding/shearing. Such “micro-shear zones” may now have been detected in polar ice sheets as well (Weikusat et al., 2009).
5
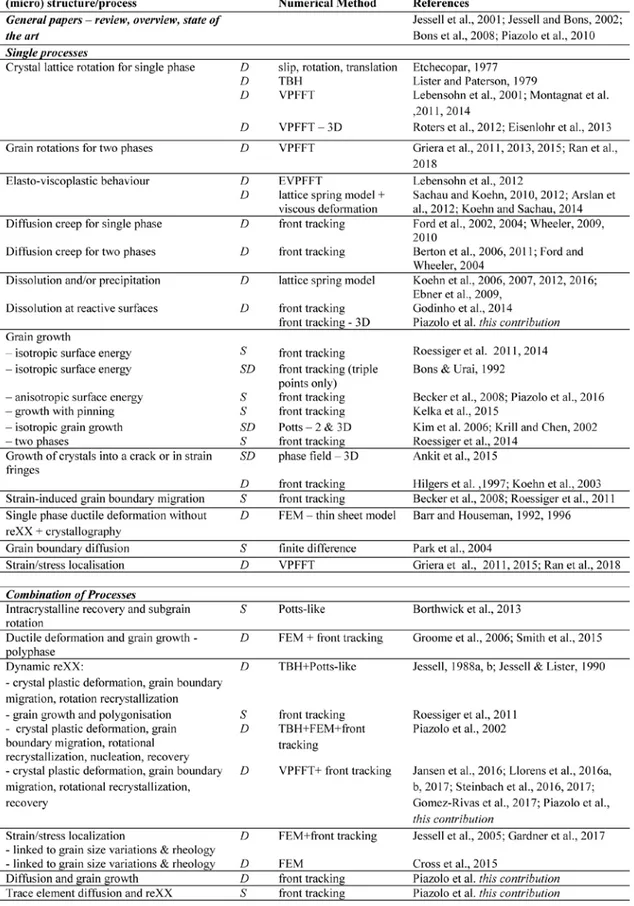
Table 1. List of numerical models of microstructural (mm to dm) development identifying processes modelled, numerical method used and providing relevant references. This list is restricted to geological applications and those referenced in the main text. Note processes are categorized as “S” for static (material points do not move) and “D” for dynamic (material points move). Furthermore, unless stated otherwise models are two-dimensional. Abbreviations: TBH – Taylor Bishop Hill calculation method for crystal lattice rotation, VPFFT – Viscoplastic Fast Fourier Transform based model, EVPFFT - Elasto-viscoplastic Fast Fourier Transform based model, FEM Finite Element, RXX – recrystallization.
6
2.2. Multiprocess modelling – approaches
As shown convincingly by the aforementioned experiments, several processes act concurrently on a microstructure and control the dynamics of the microstructural evolution and material properties (e.g. Means, 1977, 1980). While there are a large number of models that focus on one process alone, there are fewer systems that aim to model the effect of multiple interacting processes. Here, we focus on the latter. Solving all necessary equations simultaneously is only practical when the number of interacting processes is small. Alternatively, the set of equations, hence processes, needs to be reduced to a manageable number necessitating a user driven selection which may result in the omission of important feedbacks. Operator splitting provides an alternative approach, whereby each process acts sequentially on a microstructure that was incrementally changed by all operating processes in the previous step. In this case, the number of equations to be solved is not limited; hence there is no need to artificially reduce the number of modelled processes. Clearly, length scale and time steps have to be considered carefully for this approach to be valid. The operator splitting approach is fundamental to the numerical platform Elle (Jessell et al., 2001, Bons et al., 2008, Piazolo et al., 2010; www.elle.ws) which is, within the realm of microdynamic modelling, the most used numerical platform in geology. However, operator splitting has also been employed in other numerical schemes (e.g. Cross et al., 2015).
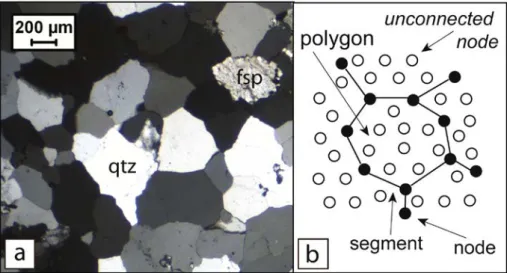
Fig. 2. Numerical representation of a microstructure. (a) Micrograph of quartzite; (b) numerical representation combining an element data structure with nodes (black circles), segments (black lines) and polygons (enclosed area) and a lattice data structure with unconnected lattice points (open circles). This structure is used in the numerical platform Elle (see text for details)..
2.3. The numerical representation of a microstructure
It is necessary to describe numerically the microstructure so that in the model the processes can act upon it spatially. Up to now, for rocks and ice, microstructural models have been mostly restricted to two-dimensions. Two basic approaches can be taken: (i) a lattice data structure or (ii) an element data structure. In the lattice data structure, the microstructure is mapped onto an irregular or regular lattice, like the pixels in a digital image or gridded analysis points obtained during chemical mapping and orientation mapping of geological samples. Potts, cellular automata, lattice-spring, particle-in-cell, phase field and micromechanical Fast Fourier Transform (FFT) based models utilize the
7
lattice data structure (Fig. 2; see also chapter 2 of Bons et al., 2008 for a detailed review of different numerical methods). Numerically the lattice data structure is easy to use and calculations are straightforward. In the element data structure, the microstructure is described by discrete elements which can be points, line segments, or polygons (Fig. 2). Finite-element models and boundary models typically use elements to describe a system. Element data structure is well suited for processes acting upon a surface, e.g. grain boundary migration, but is numerically more “expensive” due to necessary topology checks. Both elements and lattice points can have, in addition to their location in xy space, specific properties or store specific state variables, such as mineral phase, chemical composition, crystallographic orientation, and stress and strain (rate) values, respectively. The numerical platform Elle (Jessell et al., 2001) combines these two approaches: a microstructure is represented by boundary nodes connected by straight segments (Fig. 2). A polygon enclosed by boundary nodes represents a grain or subgrain. Property variations within the individual polygons are defined at interior points where information is recorded and tracked. Processes acting on the microstructure can move boundaries and/or interior points and/or change the properties at those points, e.g. composition, crystallographic orientation or dislocation density. The system has now matured to a stage that it can robustly be used for a large variety of models relevant to geology.
3. Examples of modelling several coupled processes
3.1. Dynamic recrystallization
3.1.1. A historical perspective
Dynamic recrystallization is the response of a crystalline aggregate to lower its free energy by formation and movement of sub- and grain boundaries (Means, 1983). It occurs by a number of concurrent processes that act upon the polycrystalline material. For decades, geologists have used microstructural characteristics developed during dynamic recrystallization to infer dominance of processes and linked boundary conditions (e.g. Urai et al., 1986; Hirth and Tullis, 1992; Stipp et al., 2002). Following the first attempts of such a model (Etchecopar, 1977), Jessell (1988a,b) and Jessell and Lister (1990) developed a numerical model incorporating rotation of the crystal lattice and dynamic recrystallization for quartz. The data structure used was a 100x100 hexagonal lattice structure where each lattice point represented a grain or subgrain (Fig. 3a inset). Calculation of the crystal lattice rotation in Jessell and Lister (1990) uses the Taylor-Bishop-Hill calculation method (Taylor, 1938; Bishop and Hill, 1951a, 1951b; Lister and Paterson, 1979) and the critical resolved shear stress of the different slip systems in quartz. This work reproduced the general microstructures seen in a mylonite. A major step forward was that the simulations showed that dynamic recrystallization can significantly modify crystallographic preferred orientation (CPO) development. Piazolo et al. (2002) advanced Jessell's model by utilizing the more robust Elle data structure to describe the local deformation and the dynamics of the grain boundary network (Jessell et al., 2001). The model now included a finite element solution for incompressible, linear or nonlinear viscous flow (BASIL; Barr and Houseman, 1992, 1996) to compute the local velocity field, the front tracking method for the motion of grain boundaries by moving nodes and segments (e.g. Bons and Urai, 1992), the Taylor-Bishop-Hill formulation (Lister and Paterson, 1979) and additional features such as crystal lattice rotation, formation of subgrains, recrystallization by nucleation, grain boundary migration, recovery, work hardening and tracking of dislocation densities. This list of additional
8
features shows the advance made in approximately a decade in reproducing natural microstructures (Fig. 3b).
Fig. 3. Numerical modelling of dynamic recrystallization – a historical perspective; mineral modelled is quartz; simple shear (see text for details); (a) numerical microstructure after γ = 1; different grey scales signify different crystallographic orientations; top inset shows data structure of hexagonal lattice points (modified after Jessell and Lister, 1990); (b) numerical microstructure after γ = 1; colours show crystallographic orientation, grain boundaries are red, subgrain boundaries black; for data structure see inset (modified after Piazolo et al., 2002)..
So far, the rheological anisotropy of minerals deforming by dislocation creep was not taken into account in the calculation of the stress-strain rate field and lattice rotation. About another decade after Piazolo et al. (2002), the viscoplastic implementation of the full-field crystal plasticity micromechanical code based on Fast Fourier Transforms (VPFFT; Lebensohn, 2001) was introduced in geological microstructural modelling (Griera et al., 2011, 2013, 2015). The VPFFT is a spectral method that specifically assumes that deformation is achieved by dislocation glide on crystallographic slip planes (each with their own critical resolved shear stress) whose orientations are mapped on a regular grid (for details see Griera et al. (2013), Montagnat et al. (2011, 2014) and Llorens et al. (2016a)). The simulations of Griera et al. (2011, 2013) and Ran et al. (2018) illustrate that heterogeneous stress within and between grains that emerge from inhomogeneous slip has a significant effect on the rotation rate of porphyroclasts and -blasts and the strain (rate) field around these objects.
More recently, Llorens et al. (2016a,b; 2017) and Steinbach et al. (2016, 2017) coupled dynamic recrystallization (DRX) by grain boundary migration (GBM), intracrystalline recovery and polygonisation with VPFFT crystal plasticity models, and applied them to study the deformation of polar ice. Llorens et al. (2016a) presents a comprehensive description of the method. They found that DRX produces large and equidimensional grains, but only marginally affects the development of the c-axes CPO. However, DRX can alter the activity of slip systems and does modify the distribution of a-axes. In simple shear, the strong intrinsic anisotropic of ice crystals is transferred from the crystal to the polycrystal scale, leading to strain localisation bands that can be masked by GBM (Llorens et al., 2016b). Llorens et al. (2017) compared the dynamics of pure polar ice polycrystalline aggregates in pure and simple shear deformation. It was found that, due to the vorticity of deformation, it is expected that ice is effectively weaker in the lower parts of ice sheets (where simple shear dominates) than in the upper parts (where ice is mostly deformed coaxially). The method was also applied to reproduce the development of tilted-lattice (kink) bands found in ice cores (Jansen et al., 2016) and crenulation cleavage during folding (Ran et al., 2018) as a result of mechanical anisotropy. Steinbach
9
et al. (2016) included air inclusions as a second phase to simulate DRX in porous firn and found that DRX can occur despite the low strain and stress in firn.
Apart from polar ice, the VPFFT-Elle model has also been used to analyse subgrain rotation recrystallization of halite polycrystals in simple shear (Gomez-Rivas et al., 2017) by coupling VPFFT with the Elle routines that simulate intracrystalline recovery (Borthwick et al., 2013) and subgrain rotation. They found that recovery does not affect CPOs, but strongly decreases grain size reduction. These authors also evaluated the use of mean subgrain misorientations as a strain gauge.
Fig. 4. Numerical modelling of dynamic recrystallization – testing the effect of process combination on microstructural development; model parameters: mineral modelled - ice; time step - 20 years, simple shear; Δγ - 0.04 per time step. FFT and GBM signify fast fourier transform formulation for crystal plasticity and grain boundary migration, respectively; (a) initial microstructure and results after γ = 2.4 for different process combinations. Results are shown as grain network with orientation related colour coding according to crystal orientations relative to the shortening direction y (see legend) and in pole figures. In the latter the colour bar indicates the multiples of uniform distribution; (b) grain area distribution normalized to the initial average grain area for all models shown.
3.1.2. Testing the effect of different combinations of recrystallization processes
We show results from three combinations of processes that occur during dynamic recrystallization. These processes act on the same initial 10 × 10 cm aggregate of ice Ih crystals (Fig. 4a). The numerical approach in these simulations is based on the VPFFT micromechanical model in combination with several Elle processes (Llorens et al., 2016a, 2016b, 2017; Steinbach et al., 2016, 2017). The deformation-induced lattice rotation and the estimation of geometrically necessary dislocation densities calculated from the stress and velocity field provided by the VPFFT algorithm are used to simulate recrystallization
10
by intra-crystalline recovery, grain boundary migration and nucleation. Grain boundary migration (GBM) is simulated based on the algorithm by Becker et al. (2008). Here, a front-tracking approach is used in which the movement of boundaries is mapped through time. Recovery reduces the intra-granular stored energy in a deformed crystal (Borthwick et al., 2013). Nucleation creates new grain boundaries with areas of misorientation values above a pre-defined threshold (Piazolo et al., 2002; Llorens et al., 2017; Steinbach et al., 2017). Dextral simple shear deformation is applied in strain increments of Δγ = 0.04. Three different combinations of recrystallization processes are tested: (1) GBM only, (2) GBM and recovery or (3) GBM, recovery and nucleation (Fig. 4a). Simulations including VPFFT viscoplastic deformation show a similar evolution of c-axis orientation, regardless of the dynamic recrystallization processes included (Fig. 4a). The lack of influence of nucleation on the CPO is due to the fact that new grains are modelled to have lattice orientations close to those of their parent grains. However, inclusion of the nucleation process results in grain size reduction (Fig. 4b). Results illustrate how different combinations of microdynamic processes affect the microstructural characteristics (e.g. CPO, grain size, shape and orientation) in different ways where no single microstructural parameter can grasp the full dynamics of polycrystalline deformation.
3.2. Diffusion creep
Diffusion creep is a physico-chemical process that operates in large regions of the Earth – in the upper Earth as “pressure solution” where diffusion is enhanced along fluid films and elsewhere at low strain rates, maybe in large parts of the lower mantle (Karato and Li, 1992). The mechanism involves diffusion driven by gradients in normal stress along boundaries. In simple models no other driving forces need to be included. It is implicit in our understanding of this mechanism that grain boundary sliding occurs in conjunction with diffusion. Ford et al. (2002) devised a numerical model to understand the evolution of grain shapes and CPO in grain boundary diffusion creep. The mathematical framework allows for the consideration of diffusion and sliding together. Operator splitting is not required and the evolution at each timestep is based on a single matrix inversion operation. The model couples the microstructure to an evolving system of local stresses (Fig. 5). The model predicts that grain shapes become somewhat elongate, in accordance with experiments on calcite (Schmid et al., 1987) and observations on an albite-bearing mylonite (Jiang et al., 2000) (Fig. 5). It also predicts that grain rotations are not chaotic and that CPO may be present to high strains (Wheeler, 2009), as seen in, for example, experiments on olivine-orthopyroxene (Sundberg and Cooper, 2008) and predicted by numerical simulations of Bons and den Brok (2000). A second phase, if insoluble, can be included and such a model was used by Berton et al. (2006, 2011) to prove the hypothesis that a different grain boundary diffusion coefficient along the two-phase boundaries could explain fibre growth in pressure shadows. Not all model predictions are in agreement with other investigations – for example some materials deformed by diffusion creep e.g. olivine show quite equant grains (Karato et al., 1986). In such experiments grain growth occurs but this process was not included in the numerical model, hence results differ. In a later section we address this issue, but this example illustrates that, in common with other numerical models, the applicability reflects the processes included.
11
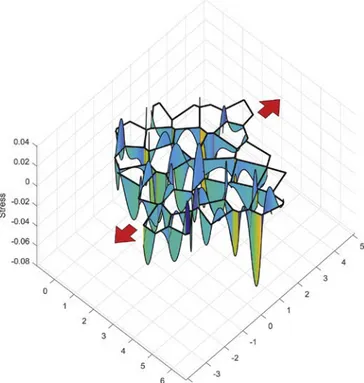
Fig. 5. Results from diffusion creep modelling in pure shear; 2D microstructure as in the starting frame of Fig. 1b of Wheeler (2009). Shown is the oblique view of microstructure with patterns of normal stress shown along grain boundaries in the 3rd dimension as “fences”. Red arrows show stretching direction, hence stresses are tensile (shown as negative) on boundaries at a high angle to stretching direction are tensile. Fences are colour coded according to dissolution rate with blue low and red high. When there is no relative grain rotation the fences have a single colour and the stress is parabolic. When there is relative grain rotation the fences vary in colour and the stress is a cubic function of position.
3.3. Stress driven dissolution, growth and dynamic roughening
Another example where stress leads to distinct micro- and macrostructures is the roughening of grain boundaries in the presence of a fluid. In this case dissolution and/or mineral growth are driven not just by normal stress gradients at the interface (c.f. section 3.2) but also by changes in elastic and surface energies. In addition to these driving forces, the detailed electrochemistry of interfaces has a kinetic effect on rates (Gratier et al., 2013). In the example presented here, the process is modelled in Elle by coupling a lattice spring code that calculates the strain with a background fluid that dissolves lattice elements. This process can produce transient patterns of interface geometry at the grain boundaries (Koehn et al., 2006). In addition, the process itself produces rough interfaces that can be seen on the larger scale as stylolites (Koehn et al., 2007; Ebner et al., 2009). The scaling behaviour of stylolites is important for stress inversion and compaction on the basin scale (Koehn et al., 2012, 2016) and the shape of stylolites is partly rooted in the microstructure of the host-rock (Fig. 6). Slower dissolving material on various scales, from small grains to fossils and layers, can influence the dissolution process and thus the development of patterns, whereas deformation leads to changes in long-range interactions (Koehn et al., 2016). Similarly, pinning behaviour in the presence of a fluid is seen in grain growth where grain boundary pinning results in restriction of grain growth. Pinning particles can also be moved around so that growing grains become clean. Such a process can lead to layered rocks, for example, zebra dolomites (Kelka et al., 2015).
12
Fig. 6. Dynamic development of stylolite roughness in numerical simulations; (a) time series (left to right) with the stylolite nucleating in the middle of a slow dissolving layer (layer in green and stylolite in black colour). Once the stylolite has dissolved the layer on one side the layer starts to pin and teeth develop. (b) Variation of the pinning strength of the layer in three different simulations showing a strong dependency. The compaction (movement of upper and lower walls) is shown in quite arrows. L in the picture on the right hand side is the initial position of the layer and P shown as black arrows indicates the pinning of the layer upwards and downwards during dissolution.
4. Numerical simulations of microdynamic processes: examples of ongoing work
4.1. Linking chemistry and microstructural evolution
Even now, most of the numerical models that incorporated more than one process are restricted to deformation processes alone. Although in diffusion creep there is an intrinsic chemical aspect, the model described in 3.2 involves just a single phase of fixed composition. There are some models that incorporate the growth of new mineral phases and investigate the rheological effect of such growth (e.g. Groome et al., 2006; Smith et al., 2015), however the location of new phase growth and/or growth rate is predefined. While Park et al. (2004) showed convincingly the effect of microstructure on the diffusion pathways and chemical patterns in garnet and biotite, there are now many opportunities available in a numerical system such as Elle (Jessell et al., 2001) to couple local chemistry and microstructural evolution. Below we present preliminary results from two current projects linking chemical changes and a dynamically evolving grain network.
4.1.1. Grain boundary diffusion creep and grain growth
Here we present the first results using a model combining, using operator splitting, deformation by diffusion creep (Ford et al., 2002; Wheeler, 2009) and surface energy driven grain boundary migration (GBM), i.e. grain growth (modified after Becker et al., 2008). Four different scenarios are shown: diffusion creep only, grain boundary migration only and two combinations with medium and high grain boundary migration GBM rates (Fig. 7a). The starting material is an almost regular hexagonal grain mesh with equant grains in which triple junctions have had small random perturbations imposed (Fig. 7a). The perturbations are required to avoid mathematical problems that arise in perfectly regular hexagonal networks (Wheeler, 2010). Topology checks such as neighbour switching routines are performed after each step in all simulations, ensuring that no topology problems arise. The microstructural development is markedly different if grain growth is coupled with diffusion creep (Fig. 7a) where with increasing GBM rate the
13
aspect ratios are generally reduced relative to that of comparable experiments modelling diffusion creep only. This is provisionally in accord with the hypothesis that there will be a ‘steady state’ grain elongation developed which is a function of the relative magnitudes of strain rate and grain growth kinetic parameters (Wheeler, 2009) but more simulations are required (with less regular starting microstructures). In contrast, for grain growth only, the microstructure does not change as the initial configuration consists of stable near 120° triple junctions (Fig. 7a). Grain numbers (i.e. grain size) do not change in any of the simulations.
4.1.2. Trace element partitioning between fluid and solid coupled with recrystallization Field and experimental studies illustrate the importance of the time and length scales on the evolution of grain networks during trace element diffusion (e.g. Ashley et al., 2014 and references therein). Therefore, understanding the influence of recrystallization on trace element distribution is essential for correctly interpreting patterns of trace element distribution (e.g. Wark and Watson, 2006). However, to our knowledge there are currently no numerical approaches able to simulate diffusion coupled with microstructure evolution. Recently, a new Elle finite difference process that solves Fick's second law to simulate trace element diffusion in a polycrystalline medium has been developed. The polycrystal is defined by n-phases where grain boundaries and grains are differentiated (Fig. 7b). The trace element partitioning coefficient between different phases is also considered. The approach uses an element data structure representing grain boundaries and a lattice data structure of a regular grid of unconnected lattice point to track diffusion along the grain boundaries and the physical and chemical properties within grains, respectively. To ensure elemental exchange between grain boundaries and grain interiors, a grain interior-grain boundary partition coefficient is implemented that takes the proximity to grain boundaries into account. This allows the simulation of coupled bulk and grain boundary diffusion. This approach can be fully coupled with other processes of the numerical platform Elle and therefore allows simulating simultaneous diffusion, deformation and static or dynamic recrystallization. The use of this approach is demonstrated through the modelling of diffusion of a tracer with fractionation during static grain growth of a single-phase aggregate (Fig. 7b) (after that presented by Jessell et al., 2001). Patterns of chemical concentration qualitatively resemble those of Ti-distribution observed in recrystallized quartz in shear zones and can help to understand the redistribution of Ti in quartz during dynamic recrystallization (e.g. Grujic et al., 2011), among many other geological problems.
14
Fig. 7. Example of new development in microdynamic numerical modelling; preliminary results (see text for details). (a) Coupling of diffusion creep and surface energy driven grain boundary migration (GBM); (left) starting microstructure; (middle) microstructure at stretch 2; (right) graph showing average aspect ratio versus stretch; note that the microstructure after a significant period of exclusive grain boundary migration is the same as the starting microstructure as no movement occurs as all triple junctions are 120°. Number of grains stays constant for all simulations. (b) Evolution of chemical concentration of an arbitrary element during surface energy driven GBM. The material is a single-phase polycrystalline aggregate with different initial chemical content. This example assumes very low bulk diffusion (Dbulk = 1e−20 m2/s) and
fast grain boundary diffusion (Dboundary = 1e−8 m2/s), hence grain boundary diffusion dominates. Colour code indicates
chemical concentration and white lines represent grain boundaries. (c) Dissolution of reactive surfaces in 3D using the example of fluorite dissolution. Microstructures after three dissolution periods are show (150 h, 180 h, 276 h); surfaces correspond to the {111} plane at the start of experiment/simulation; colours identify different depths where blue signifies low and red high; images are 60 μm width. Top panel row shows numerical results. Lower panel shows experimental results using confocal microscopy images of a grain of a sintered CaF2 pellet at the same three dissolution times as the numerical models. Note the formation of etch pits with similar triangular shape and the faster/enhanced dissolution of the grain boundaries in both experiment and numerical simulations.
15
4.2. Modelling in three dimensions
We restricted this review to two-dimensional numerical approaches, as very few models have been published that are in three dimensions and also specific to geological microstructures. An exception is the phase field approach by Ankit et al. (2015) who investigate the growth of crystals in an open fracture. However, within the material science community numerical models exist that investigate the behaviour of a microstructure in response to single processes in three dimensions (e.g. three dimensional crystal plasticity modelling platform DAMASK (Roters et al., 2012; Eisenlohr et al., 2013), which includes the option of solving the micromechanical problem using a 3D implementation of the FFT-based formulation (presently implemented in Elle in its 2-D version) and grain growth (e.g. Krill and Chen, 2002; Kim et al., 2006). With the technical advances made within the geological and material science community it is now in principle possible to extend currently available 3D models to geological questions and/or multi-process scenarios.
4.2.1. Dissolution of reactive surfaces in three dimensions
Mineral dissolution controls important processes in geoscience such as serpentinization (e.g. Seyfried et al., 2007), retrogression and replacement reactions (Putnis and Austrheim, 2010), deformation by dissolution-precipitation creep (e.g. Rutter, 1976) and also affects processes relevant to society such as the stability of spent nuclear fuel and mine waste. Recent work has shown that dissolution rates are linked to the evolving surface structure, and thus are time-dependent (Godinho et al., 2012). Different surfaces have different structures in three dimensions and the presence of etch pits play a major role in dissolution (Plümper et al., 2012). Hence, for accurate representation of dissolution behaviour, modelling in three dimensions is important. Here, we present a numerical model that simulates the dissolution process as a potential tool to quantify the links between dissolution rates, reactive surface area and topography over periods of time beyond reasonable for a laboratory experiment. The program uses empirical equations that relate the dissolution rate of a point of the surface with its crystallographic orientation (Godinho et al., 2012) to simulate changes of topography during dissolution, which ultimately results in the variation of the overall dissolution rate (Godinho et al., 2012, 2014). The initial surface is composed of a group of nodes with a xy position and a set height (z). For each lattice point a local surface orientation is calculated from the inclination of the segment node and its neighbours. This orientation together with the crystallographic orientation of the grain the surface belongs to is then used to calculate a dissolution rate (surface reactivity). Based on this the displacement of the node using the equations published in Godinho et al. (2012) is calculated. The model allows the graphical display of the three-dimensional topographic development of the surface, tracking of the variation of the surface area and calculation of the overall dissolution rate at each stage of the simulation. Results obtained with the 3D simulation at three consecutive stages of dissolution (150 h, 180 h, 276 h dissolution duration) show that numerical results are in accordance to experimental results (Fig. 7c).
16
5. Numerical simulations of microstructures: possibilities and challenges
5.1. Linking laboratory and natural data with numerical models
Over the last two decades numerical capabilities have advanced markedly and models have come of age. Consequently, a large range of models and process combinations is now available that can be utilized to gain further insight into the link between processes, material properties and boundary conditions. This also includes polymineralic systems making the models more appropriate to use to investigate processes occurring within polyphase rocks (e.g. Roessiger et al., 2014; Steinbach et al., 2016). New avenues of effective verification against laboratory and natural data are now opening up, due to the development of analytical tools allowing rapid complete microstructural and microchemical analysis providing dataset similar to those possible in numerical models (e.g. Steinbach et al., 2017; Piazolo et al., 2016a); many of the analytical data sets have a lattice data structure.
5.2. Linking chemistry and microstructural evolution
Advances in numerical methods, theoretical treatment of thermodynamic data, analytical tools and theoretical and experimental insights into the coupling between chemical and physical process that emerged over the last decade, call for a major effort in this area of research. Examples of areas of opportunities include investigation of the (1) significance of local stress versus bulk stress on mineral reactions and reaction rates (e.g. Wheeler, 2014), (2) characteristics of replacement microstructures and their potential significance for microstructural interpretation (e.g. Putnis, 2009; Spruzeniece et al., 2017), (3) mobility of trace elements enhanced by deformation that change significantly the local elemental distributions (e.g. Reddy et al., 2007; Piazolo et al., 2012, 2016b) and (4) coupling between reactive fluid-solid systems and hydrodynamics (Kelka et al., 2017). Increasing computer processing speeds will aid the running of such models. However, the technical challenges include the harmonisation of fundamentally different numerical approaches (crystal plasticity versus diffusion creep, for example) and the resolution of fundamental mathematical problems, e.g. the current lack of an internally consistent model for multiphase diffusion creep, highlighted by Ford and Wheeler (2004). 5.3. Linking brittle and ductile deformation: elasto-viscoplastic behaviour
When examining the rock record, it is clear that in many cases, brittle and ductile behaviour often occurs at the same time within a rock (e.g. Bell and Etheridge, 1973; Hobbs et al., 1976). With the potential significance of grain-scale brittle behaviour now measurable on seismic signals (e.g. Fagereng et al., 2014) there is an increased need in developing numerical techniques that allow us to model the dynamic link between brittle and ductile behaviour. Such elasto-viscoplastic behaviour combines the elastic reversible fast deformation with a viscous time dependent flow and a plastic behaviour. These behaviours can be included in continuous or discontinuous models. For example, in the numerical platform Elle, a lattice structure is used to deform the model elastically up to a critical stress where bonds fracture (plastic behaviour) and the particles themselves deform as a function of stress and time (viscous behaviour). In this case the viscous behaviour conserves the volume whereas shear forces and differential stresses converge to zero (Sachau and Koehn, 2010, 2012; Arslan et al., 2012; Koehn and Sachau, 2014). Alternatively, linking the elasto-viscoplastic FFT based (EVPFFT) (Lebensohn et al.,
17
2012) with models such as Elle would allow calculation of the Cauchy stresses that are the local driving force for grain scale damage processes. One of the major challenges is the large range of time-scales in these processes, with fracturing and fluid flow on fast to intermediate and viscous deformation and potentially reactions on very long time scales. This complexity either requires the assumption that some processes are instantaneous or it requires an “up-scaling in time” or non-linear time scales in models.
5.4. Expansion of capability to three dimensions
With the advent of supercomputers and new numerical approaches now is the time to develop techniques to investigate microstructural development in three dimensions. This is of particular importance if material transport such as aqueous fluid and/or melt flow is to be considered. This would enable, for example, modelling of strain fringes, shear veins and en-echelon tension gashes. However, these require models that link brittle and ductile behaviour along with modelling in three dimensions.
One of the biggest problems faced with three-dimensional models of microstructures are the three-dimensional topology changes that are common in dynamic microstructural development (e.g. Fig. 1, Fig. 2, Fig. 3, Fig. 4, Fig. 5, Fig. 6, Fig. 7). This is a major problem if an element data structure with segments, i.e. grain boundaries is used. However, the phase field approach does not work with such distinct boundaries, and is therefore well suited for 3D problems (e.g. Ankit et al., 2015). In addition, a three dimensional network of unconnected nodes, in which there is no physical movement of boundaries but only changes in the properties of the 3D nodes (voxels) (cf. Fig. 7c) may be a way forward (e.g. Sachau and Koehn, 2012).
5.5. Link between geophysical signals and microstructure
At a time where there is an ever-increasing amount of geophysical data being collected, numerical simulations that are used to test the link between microstructural development and geophysical signal will become increasingly important. Cyprych et al. (2017) showed that not only crystallographic preferred orientation but also the spatial distribution of phases i.e. the microstructure, has a major impact on seismic anisotropy. Therefore, a direct link between the microdynamic models such as Elle allowing tracking of microstructural changes through time and space and geophysical signal generation offers a wealth of new opportunities including interpretation of strong reflectors in the lower crust and mantle. Current efforts by Johnson, Gerbi and co-workers (Naus-Thijssen et al., 2011; Cook et al., 2013; Vel et al., 2016) are in line with this direction.
5.6. Application of numerical models to polymineralic rock deformation and ice-related questions
The dynamic behaviour of the Earth is strongly influenced by the deformation of polymineralic rocks. At the same time Earth's polar ice caps and glacial ice which often include ice and a second phase (e.g. air inclusions, dust, entrained bedrock) is of major importance to society, especially in view of changing climate (e.g. Petit et al., 1999; EPICA, 2004). Application of the current numerical capabilities to polycrystalline ice and polymineralic rocks is therefore urgently needed. Over the last years, there has been an increased effort in this direction (Roessiger et al., 2011, 2014; Piazolo et al., 2015; Llorens et al., 2016a, 2016b, 2017; Jansen et al., 2016; Steinbach et al., 2016, 2017), which
18
promises to continue. Here, the development of the link between elemental mobility and microstructural development is of major importance, as only with such models the can chemical signals of, for example, ice cores be correctly interpreted.
5.7. Upscaling: utilizing operator splitting and utilities developed for microdynamic systems to larger-scale problems
One of the strengths of the numerical approach taken by the microstructural community has been the close link between different processes and the ability of the models to take into account the local differences in properties such as stress, strain and chemistry. The technique of operator splitting has proven extremely powerful. Furthermore, the ability to model anisotropic material behaviour utilizing for example VPFFT viscoplastic deformation formulations (Lebensohn, 2001), has enabled realistic and dynamic models. Upscaling this approach to investigate problems at a large scale e.g. folding (Llorens et al., 2013a, 2013b; Bons et al., 2016; Ran et al., 2018) and shear deformation (Gardner et al., 2017) have shown to be very beneficial. There is great scope to expand further on this in view of fluid flow, mineralization and fault formation. 6. Numerical simulations of microstructures: lessons learnt and future challenges
Numerical simulations of microstructural development have caught our imagination over the last three decades. They have markedly advanced our ability to explain phenomena and patterns we observe in nature and experiments by allowing us to test the link between boundary conditions, material properties, processes, and microstructural development. Importantly, models, especially those that couple several process and/or investigate pre-existing heterogeneities can train the geologist to think of the dynamics of the system rather than a linear development. For example, different patterns of strain localization observed in nature can be explained by differences in the relative rates of interacting processes (e.g. Jessell et al., 2005; Gardner et al., 2017). At the same time, specific indicative microstructural parameters can be developed to help interpret natural microstructures (e.g. Piazolo et al., 2002; Gomez-Rivas et al., 2017; Llorens et al., 2017; Steinbach et al., 2017).
However, including chemistry coupled to other processes remains a particular challenge. Whilst, for example, trace-element diffusion can be enacted in parallel with other processes (section 4.1.2), chemical transport of major elements and diffusion creep cannot yet be fully integrated with many other processes. Indeed, when multiphase systems are considered, there are unsolved problems with diffusion creep modelling even in the absence of other processes (Ford and Wheeler, 2004). This challenge is closely linked to our current inability to confidently model grain boundary sliding.
Nevertheless, the studies we describe have shown that numerical models are extremely powerful in providing benchmark results to investigate what kind of microstructure may develop under certain conditions. These models are sophisticated mind experiments that are firmly based on physical and chemical laws for which the theory is well known individually but their interaction is difficult to predict analytically.
Acknowledgements
19
microstructures with his inspirational in-situ experiments. The authors thank the DFG, ARC, ESF, NSF, EU through Marie Curie Fellowship to SP, the Government of Catalonia's Secretariat for Universities and Research for a Beatriu de Pinós fellowship to EGR (2016 BP 00208), and NERC (NERC grant NE/M000060/1) for support of the numerical endeavours. The authors thank C. Gerbi for his helpful and constructive review as well as C. Passchier for editorial handling of the manuscript.
References
Ankit, K., Urai, J. L., and Nestler, B. 2015. Microstructural evolution in bitaxial crack‐ seal veins: A phase‐field study. Journal of Geophysical Research: Solid Earth, 120, 3096-3118.
Arslan, A., Koehn, D., Passchier, C.W. and Sachau, T. 2012. The transition from single layer to foliation boudinage: A dynamic modelling approach. Journal of Structural Geology, 42, pp. 118-126.
Ashley, K.T., Carlson, W.D., Law, R.D., and Tracy, R.J. 2014. Ti resetting in quartz during dynamic recrystallization: mechanisms and significance. American Mineralogist, 99, 2025-2030.
Barr T.D., and Houseman G.A. 1992. Distribution of deformation around a fault in a non-linear ductile medium. Geophys Res Lett 19:1145-1148
Barr T.D., and Houseman.G.A. 1996. Deformation fields around a fault embedded in a non-linear ductile medium. Geophys J Int 125:473-490
Becker, J.K., Bons, P.D., Jessell, M.W. 2008 A new front-tracking method to model anisotropic grain and phase boundary motion in rocks. Computers and Geosciences 34, 201-212.
Bell, T. H., and Etheridge, M. A. 1973. Microstructure of mylonites and their descriptive terminology. Lithos, 6(4), 337-348.
Bergman, H., and Piazolo, S. 2012. The recognition of multiple magmatic events and pre-existing deformation zones in metamorphic rocks as illustrated by CL signatures and numerical modelling: examples from the Ballachulish contact aureole, Scotland. International Journal of Earth Sciences, 101(5), 1127-1148.
Berton, J. R., Durney, D. W., Wheeler, J. and Ford, J. M. 2006. Diffusion-creep modelling of fibrous pressure-shadows. Tectonophysics, 425, 191-205.
Berton, J. R., Durney, D. W. and Wheeler, J. 2011. Diffusion-creep modelling of fibrous pressure-shadows II: influence of inclusion size and interface roughness. In: Deformation Mechanisms, Rheology and Tectonics: Microstructures, Mechanics and Anisotropy (eds Prior, D. J., Rutter, E. H. and Tatham, D.), pp. 319-328, The Geological Society.
Bishop J.F.W. and Hill R. 1951. A theory of the plastic distortion of a polycrystalline aggregate under combined stresses. Philosophical Magazine Series 6, 42, 414–427. Bishop, J.F.W. and Hill, R. 1951b. A Theoretical Derivation of the Plastic Properties of a
Polycrystalline Face-Centred Metal. Philosophical Magazine Series 6, 42, 1298-1307 Bons, P.D., Jessell M.W., and Passchier C.W. 1993. The analysis of progressive
403-20
411.
Bons, P.D. and den Brok, S.W.J. 2000. Crystallographic preferred orientation development by dissolution-precipitation creep. Journal of Structural Geology 22, 1713-1722.
Bons, P.D., and Urai J.L. 1992. Syndeformational grain growth: microstructures and kinetics. Journal of Structural Geology 14, 1101-1109. http://dx.doi.org/10.1016/0191-8141(92)90038-X
Bons, P.D., Koehn, D., and Jessell, M.W. (Eds) 2008. Microdynamic Simulation. Lecture Notes in Earth Sciences 106, Springer, Berlin. 405 pp. ISBN 978-3-540-44793-1. Bons, P.D., and Jessell, M.W. 1995. Strain analysis in deformation experiments with
pattern matching or a stereoscope. Journal of Structural Geology 17, 917-921.
Bons, P.D., Jansen, D., Mundel, F., Bauer, C.C., Binder, T., Eisen, O., Jessell, M.W., Llorens, M.G., Steinbach, F., Steinhage, D. and Weikusat, I. 2016. Converging flow and anisotropy cause large-scale folding in Greenland's ice sheet. Nature communications, 7, 11427.
Borthwick, V., Piazolo, S., Evans, L., Griera, A., and Bons, P.D. 2013. What happens to deformed rocks after deformation? A refined model for recovery based on numerical simulations. In: "Deformation Structures and Processes within the Continental Crust", Special Volume 394, Geol. Soc. London. doi: 10.1144/SP394.11
Cloos, E. 1955. Experimental analysis of fracture patterns. Geological Society of America Bulletin 66(3), 241-256.
Cook, A., Vel., S., Johnson, S.E., Gerbi, C., and Song, W.J. 2013. Elastic and Seismic Properties (ESP) Toolbox (beta version), http://umaine.edu/mecheng/faculty-andstaff/ senthil-vel/software/ESP_Toolbox/
Cross, A. J., Ellis, S., and Prior, D. J. 2015. A phenomenological numerical approach for investigating grain size evolution in ductiley deforming rocks. Journal of Structural Geology, vol. 76, p. 22-34.
Cyprych, D., Piazolo S.C., and Almqvist, B.S.G. 2017. Seismic anisotropy from compositional banding in granulites from the deep magmatic arc of Fiordland, New Zealand, Earth and Planetary Science Letters, 477, 156-167.
Doherty, R. D., Hughes, D. A., Humphreys, F. J., Jonas, J. J., Jensen, D. J., Kassner, M. E., King, W. E., Mc Nelley, T. R., Mc Queen, H. J. and Rollett, A. D. 1997. Current issues in recrystallization: a review. Materials Science and Engineering: A, 238(2), 219-274.
Ebner, M., Koehn, D., Toussaint, R. and Renard, F. 2009. The influence of rock heterogeneity on the scaling properties of simulated and natural stylolites. Journal of Structural Geology, 31(1), 72-82.
Eisenlohr, P., Diehl, M., Lebensohn, R.A., and Roters, F. 2013. A spectral method solution to crystal elasto-viscoplasticity at finite strains. International Journal of Plasticity 46, 37-53.
EPICA Community members, 2004. Eight glacial cycles from an Antarctic ice core. Nature 429, 623-628.
21
polycrystalline aggregate. Tectonophysics, 39(1-3), 121-139.
Etheridge, M.A., 1983. Differential stress magnitudes during regional deformation and metamorphism: upper bound imposed by tensile fracturing: Geology, 11, 231–234. Fagereng, Å., Hillary, G. W. B. and Diener, J. F. A. 2014. Brittle-viscous deformation,
slow slip and tremor. Geophysical Research Letters 41, 12, 4159-4167.
Ford, J. M., and Wheeler, J. 2004. Modelling interface diffusion creep in two-phase materials. Acta Materialia, 52(8), 2365-2376.
Ford, J.M., Wheeler, J. and Movchan, A B., 2002. Computer simulation of grain boundary creep. Acta Materialia, 50, 3941-3955.
Ford, J.M., Ford, N.J. and Wheeler, J. 2004 Simulation of grain boundary diffusion creep: analysis of some new numerical techniques: Proc R Soc, London, Series A 460:2395-2413
Gardner, R., Piazolo, S., Evans, L., and Daczko, N. 2017. Patterns of strain localization in heterogeneous, polycrystalline rocks - a numerical perspective, Earth and Planetary Science Letters, 463, 253-265.
Gratier, J.P., Dysthe, D.K. and Renard, F. 2013. The role of pressure solution creep in the ductility of the Earth's upper crust. In: R. Dmowska (Ed.), Advances in Geophysics, vol. 54, Elsevier, Amsterdam, pp. 47-179.
Griera, A., Bons, P.D., Jessell, M.W., Lebensohn, R.A., Evans, L., and Gomez-Rivas, E. 2011. Strain localization and porphyroclast rotation. Geology 39, 275-278.
Griera, A., Llorens, M.-G., Gomez-Rivas, E., Bons, P.D., Jessell, M.W., Evans, L.A., Lebensohn, R. 2013. Numerical modelling of porphyroclast and porphyroblast rotation in anisotropic rocks. Tectonpophysics 587, 4-29.
Gottstein, G. 2004. Integral materials modelling. Modelling and Simulation in Materials Science and Engineering, 12(1), I.
Godinho, J.R., Piazolo, S. and Evans, L. 2014. Simulation of surface dynamics during dissolution as a function of the surface orientation: Implications for non-constant dissolution rates. Earth and Planetary Science Letters, 408, pp.163-170.
Godinho, J.R.A., Piazolo, S., Evins, L.Z. 2012. Effect of surface orientation on dissolution rates and topography of CaF 2, Geochimica et Cosmochimica Acta, 86, pp.392-403.
Gomez-Rivas, E., Griera, A., Llorens, M-.G., Bons, P.D., Lebensohn, R.A., and Piazolo, S. 2017. Subgrain rotation recrystallization during shearing: insights from full-field numerical simulations of halite polycrystals. Journal of Geophysical Research, Solid Earth, 122, 8810-8827.
Grujic, D., Stipp, M. and Wooden, J.L. 2011. Thermometry of quartz mylonites: Importance of dynamic recrystallization on Ti‐in‐quartz reequilibration. Geochemistry, Geophysics, Geosystems, 12(6).
Groome, W.G., Johnson, S.E. and Koons, P.O.. 2006. The effects of porphyroblast growth on the effective viscosity of metapelitic rocks: implications for the strength of the middle crust. Journal of Metamorphic Geology, 24, 389-407.
Herwegh, M., and M. R. Handy. 1998. The evolution of high-temperature mylonitic microfabrics: Evidence from simple shearing of a quartz analogue (norcamphor). J.
22
Struct. Geol. 18, 689-710.
Herwegh, M., and M. R. Handy. 1998. The origin of shape preferred orientations in mylonite: inferences from in-situ experiments on polycrystalline norcamphor. Journal of Structural Geology 20, 681-694.
Hilgers, C., Urai, J.L., Post, A.D., Bons, P.D. 1997. Fibrous vein microstructures: Experimental and numerical simulation. Aardkundige Mededelingen 8, 107-109. Hirth, G. and Tullis, J. 1992. Dislocation creep regimes in quartz aggregates. Journal of
Structural Geology, 14, 145-159.
Hobbs B.E., Means W.O. and Williams P.F. 1976. An Outline of Structural Geology. John Wiley and Sons, 571 pp.
Jansen, D., Llorens, M.-G., Westhoff, J., Steinbach, F., Kipfstuhl, S., Bons, P.D., Griera, A. and Weikusat, I. 2016. Small-scale disturbances in the stratigraphy of the NEEM ice core: observations and numerical model simulations. The Cryosphere, 10, 359-370. Jiang, Z., Prior, D. J. and Wheeler, J., 2000. Albite crystallographic preferred orientation and grain misorientation distribution in a low-grade mylonite: implications for granular flow. Journal of Structural Geology, 22, 1663-1674.
Jessell, M.W. 1986. Grain boundary migration and fabric development in experimentally deformed octachloropropane. Journal of Structural Geology, 8, 527-542.
Jessell, M. W. 1988a. Simulation of fabric development in recrystallizing aggregates—I. Description of the model. Journal of Structural Geology, 10(8), 771-778.
Jessell, M. W. 1988b. Simulation of fabric development in recrystallizing aggregates— II. Example model runs. Journal of Structural Geology, 10(8), 779-793.
Jessell, M. W., and Lister, G. S. 1990. A simulation of the temperature dependence of quartz fabrics. Geological Society, London, Special Publications, 54(1), 353-362. Jessell, M.W. and Bons, P.D. 2002. The Numerical Simulation of Microstructure.
Geological Society of London Special Publication Special Publications, 200, 137-147. Jessell, M., Bons, P.D., Evans, L., Barr, T., and Stüwe, K. 2001. Elle: the numerical
simulation of metamorphic and deformation microstructures. Computers and Geosciences 27, 17-30.
Jessell, M.W., Siebert, E., Bons, P.D., Evans, L., and Piazolo, S. 2005. A new type of numerical experiment on the spatial and temporal patterns of localization of deformation in a material with a coupling of grain size and rheology. Earth and Planetary Science Letters 239, 309-326, http://dx.doi.org/10.1016/j.epsl.2005.03.030 Jessell, M.W., Bons, P.D., Griera, A., Evans, L.A., and Wilson, C.J.L. 2009. A tale of two
viscosities. Journal of Structural Geology 31, 719-736.
Karato, S.I. and Li, P. 1992. Diffusion creep in perovskite: implications for the rheology of the lower mantle. Science, 255(5049), p.1238.
Kelka, U., Koehn, D. and Beaudoin, N. 2015. Zebra pattern in rocks as a function of grain growth affected by second-phase particles. Frontiers in Physics, 3, 74.
Kelka, U., Veveakis, M., Koehn, D., and Beaudoin, N. 2017. Zebra rocks: compaction waves create ore deposits. Scientific Reports, 7, 14260.
two-23
dimensional and three-dimensional ideal grain growth. Physical Review E, 74(6), 061605.
Koehn, D., Bons, P.D. and Passchier, C.W. 2003. Development of antitaxial strain fringes during non-coaxial deformation: an experimental study. Journal of Structural Geology, 25(2), pp. 263-275.
Koehn, D., Malthe-Sørenssen, A. and Passchier, C. 2006. The structure of reactive grain-boundaries under stress containing confined fluids. Chemical Geology, 230(3-4), pp. 207-219.
Koehn, D., Renard, F., Toussaint, R. and Passchier, C. 2007. Growth of stylolite teeth patterns depending on normal stress and finite compaction. Earth and Planetary Science Letters, 257(3-4), pp. 582-595.
Koehn, D., Ebner, M., Renard, F., Toussaint, R. and Passchier, W. 2012. Modelling of stylolite geometries and stress scaling. Earth and Planetary Science Letters, 341, pp. 104-113.
Koehn, D. and Sachau, T. 2014. Two-dimensional numerical modeling of fracturing and shear band development in glacier fronts. Journal of Structural Geology, 61, pp. 133-142.
Koehn, D., Rood, M.P., Beaudoin, N., Chung, P., Bons, P.D. and Gomez-Rivas, E. 2016. A new stylolite classification scheme to estimate compaction and local permeability variations. Sedimentary Geology, 346, pp. 60-71.
Krill Iii, C. E., and Chen, L. Q. 2002. Computer simulation of 3-D grain growth using a phase-field model. Acta materialia, 50(12), 3059-3075.
Lebensohn, R. A. 2001. N-site modeling of a 3D viscoplastic polycrystal using fast Fourier transform. Acta Materialia, 49(14), 2723-2737.
Lebensohn, R.A., Kanjarla, A.K. and Eisenlohr, P. 2012. An elasto-viscoplastic formulation based on fast Fourier transforms for the prediction of micromechanical fields in polycrystalline materials. International Journal of Plasticity, 32, pp.59-69. Lister G.S., and Paterson, M.S. 1979. The simulation of fabric development during plastic
deformation and its application to quartzite: fabric transitions. J Struct Geol 1:99-115 Llorens, G.-M., Griera, A., Weikusat, I., Bons, P.D., Roessiger, J., Lebensohn, R.A.
2016a. Dynamic recrystallisation of ice aggregates during co-axial viscoplastic deformation: a numerical approach. Journal of Glaciology 62, 359-377.
Llorens, G.-M., Griera, A., Bons, P.D., Lebensohn, R.A., Evans, L.A., Jansen, D., Weikusat, I. 2016b. Full-field predictions of ice dynamic recrystallisation under simple shear conditions. Earth and Planetary Science Letters 450, 233-242.
Llorens, M. -G., Griera, A., Steinbach, F., Bons, P. D., Gomez-Rivas, E., Jansen, D., Roessiger, J., Lebensohn, R. A. and Weikusat, I. 2017. Dynamic recrystallization during deformation of polycrystalline ice: insights from numerical simulations. Phil. Trans. R. Soc. A, 375(2086), 20150346.
Llorens, M.G., Bons, P.D., Griera, A., Gomez-Rivas, E. and Evans, L.A. 2013a. Single layer folding in simple shear. Journal of Structural Geology, 50, 209-220.
Llorens, M.G., Bons, P.D., Griera, A. and Gomez-Rivas, E. 2013b. When do folds unfold during progressive shear?. Geology, 41, 563-566
24
McCrone W.C., and Chen, P.T. 1949. Grain growth in octochloropropane. J Appl Phys 20:230-231.
Means, W.D. 1977. A deformation experiment in transmitted light. Earth Planet. Sci. Letts. 35, 169-179.
Means W.D. 1980. High temperature simple shearing fabrics: a new experimental approach. J. Struct. Geol. 2, (112), 197202.
Means W.D. 1983. Microstructure and micromotion in recrystallization flow of octachloropropane: a first look. Geol. Rundsch. 72, (2), 511-528.
Means W.O. 1989. Synkinematic microscopy of transparent polycrystals. J. Struct. Geol. 11, (112), 163-174.
Means, W.D., and Ree, J.H., 1988. Seven types of subgrain boundaries in octachloropropane. Journal of Structural Geology, 10(7), 765-770.
Montagnat, M., Blackford, J.R., Piazolo, S., Arnaud, L. and Lebensohn, R.A. 2011. Measurements and full-field predictions of deformation heterogeneities in ice. Earth Planet Sci. Lett., 305, 153-160.
Montagnat, M., Castelnau, O., Bons, P.D., Faria, S.H., Gagliardini, O., Gillet-Chaulet, F., Grennerat, F., Griera, A., Lebensohn, R.A., Moulinec, H., Roessiger, J., Suquet, P. 2014. Multiscale modeling of ice deformation behavior. Journal of Structural Geology 61, 78-108. dx.doi.org/10.1016/j.jsg.2013.05.002.
Nama, T.N., Otoh, S., Masuda, T. 1999. In-situ annealing experiments of octachloropropane as a rock analogue: kinetics and energetics of grain growth. Tectonophysics 304, 57-70.
Naus-Thijssen, F.M., Goupee, A.J., Johnson, S.E., Vel, S.S and Gerbi, C. 2011. The influence of crenulation cleavage development on the bulk elastic and seismic properties of phyllosilicate-rich rocks. Earth Planet Sci. Lett., 311, 212-224.
Park Y., and Means, W.D. 1996. Direct observation of deformation processes in crystal mushes. J Struct Geol 18:847-858.
Park, Y., Park, D., Evans, L., and Ree, J. H. (2004). An Elle-based 2-D model for cation exchange reaction between garnet and biotite. Journal of the Virtual Explorer, 15. Passchier, C.W., Trouw, R.A.J., 2005. Microtectonics (2nd enlarged edition). Springer
Verlag, Berlin.
Petit, J.R., J. Jouzel, D. Raynaud, N.L. Barkov, J.-M. Barnola, I. Basile, M. Bender, J. Chappellaz, M. Davis, G. Delaygue, M. Delmotte, V. M. Kotlyakov, M. Legrand, V.Y. Lipenkov, C. Lorius, L.Pépin, C. Ritz, E.Saltzman, and M. Stievenard . 1999. Climate and atmospheric history of the past 420,000 years from the Vostok ice core, Antarctica. Nature 399, 429-436.
Piazolo, S., Bons, P.D., Jessell, M.W., Evans, L., Passchier, C.W. 2002. Dominance of microstructural processes and their effect on microstructural development: insights from numerical modelling of dynamic recrystallization. Geol. Soc, London, Spec. Publ. 200, 149-170.
Piazolo, S., Jessell, M. J., Prior, D. J., Bons, P. D. 2004 The integration of experimental in-situ EBSD observations and numerical simulations: a novel technique of microstructural process analysis. Journal of Microscopy, 213, 273-284.
25
Piazolo, S., Jessell, M.W., Bons, P.D., Evans, L., Becker, J.K. 2010. Numerical simulations of microstructures using the Elle platform: A modern research and teaching tool. Journal of the Geological Society of India 75, 110-127.
Piazolo, S., Montagnat, M., Grennerat, F., Moulinec, H., and Wheeler, J. 2015. Effect of local stress heterogeneities on dislocation fields: examples from transient creep in polycrystalline ice. Acta Mater., 90, 303-309
Piazolo, S., Kaminsky, F. V., Trimby, P., Evans, L., and Luzin, V. 2016. Carbonado revisited: Insights from neutron diffraction, high resolution orientation mapping and numerical simulations. Lithos, 265, 244-256.
Plümper, O., Røyne, A., Magrasó, A., and Jamtveit, B. 2012. The interface-scale mechanism of reaction-induced fracturing during serpentinization. Geology, 40(12), 1103-1106.
Putnis, A. 2009. Mineral replacement reactions. Reviews in mineralogy and geochemistry, 70(1), 87-124.Ramberg, H. 1981. Gravity, deformation, and the earth's crust: In theory, experiments, and geological application. Academic press.
Putnis, A., and Austrheim, H. 2010. Fluid‐induced processes: metasomatism and metamorphism. Geofluids, 10(1‐2), 254-269.
Ran, H., de Riese, T., Llorens, M.-G., Finch, M., Evans, L., Gomez-Rivas, E., Griera, A., Jessell, M., Lebensohn, R.A., Piazolo, S., and Bons, P.D. 2019. Time for anisotropy: The significance of mechanical anisotropy for the development of deformation structures. Journal of Structural Geology, 125, 41-47.
Ree, J. H. and Park, Y., 1997. Static recovery and recrystallization microstructures in sheared octachloropropane. Journal of Structural Geology, 19, 1521–1526.
Reddy, S. M., Timms, N. E., Pantleon, W., and Trimby, P. 2007. Quantitative characterization of plastic deformation of zircon and geological implications. Contributions to Mineralogy and Petrology, 153(6), 625-645.
Roessiger, J., Bons, P.D., Griera, A., Jessell, M.W., Evans, L. Montagnat, M., Kipfstuhl, S., Faria, S.H., Weikusat, I. 2011. Competition between grain growth and grain size reduction in polar ice. Journal of Glaciology 57, 942-948.
Roessiger, J., Bons, P.D., Faria, S.H. 2014. Influence of bubbles on grain growth in ice. Journal of Structural Geology 61, 123-132.
Rosenberg, C. L. 2001 .Deformation of partially molten granite: a review and comparison of experimental and natural case studies. International Journal of Earth Sciences 90.1: 60-76.
Rosenberg, C.L., and Handy, M.R. 2000. Syntectonic melt pathways during simple shearing of a partially molten rock analogue (Norcamphor‐Benzamide). J. Geophys. Res. 105, 3135-3149.
Rosenberg, C.L., and Handy, M.R. 2001. Mechanisms and orientation of melt segregation paths during pure shearing of a partially molten rock analog (norcamphor–benzamide). J. Struct. Geol. 23, 1917-1932.
Roters, F., P. Eisenlohr, C. Kords, D. D. Tjahjanto, M. Diehl, and D. Raabe. 2012. DAMASK: the Düsseldorf Advanced MAterial Simulation Kit for studying crystal plasticity using an FE based or a spectral numerical solver. Procedia IUTAM 3, 3-10.