1
DEVELOPMENT AND VALIDATION OF
ALLUVIAL RISK IDENTIFICATION
METHODOLOGIES THROUGH THE
INTEGRATED USE OF REMOTE
SENSING FROM SATELLITE AND
HYDRAULIC MODELING WITH
PARTICULAR REFERENCE TO
POST-EVENT ANALYSIS AND
NOWCASTING PHASES
Ph.D. in Environmental and Hydraulic engineering – XXXII cycle
Ph.D. candidate
Supervisor
Eng. Vincenzo Scotti
Prof. Francesco Cioffi
2
Summary
1 PREFACE ... 7
2 INTRODUCTION ... 12
2.1 FLOODING RISK ASSESSMENT FROM SATELLITE ... 13
2.1.1 REMOTE SENSING FROM SATELLITE FOR THE RETRIEVAL OF SOIL MOISTURE ... 17
2.1.2 REMOTE SENSING FROM SATELLITE FOR THE SUBSIDENCE PHENOMENA ASSESSMENT ... 20
2.1.3 REMOTE SENSING FROM SATELLITE FOR THE DETECTION OF FLOODING EXTENSION ... 23
2.1.4 REMOTE SENSING FROM SATELLITE FOR THE PRECIPITATION ESTIMATION ... 26
2.2 OTHER TECHNIQUES IN FLOODING RISK ASSESSMENT ... 27
2.2.1 HYDRAULIC MODELLING IN FLOOD RISK ASSESSMENT ... 28
2.2.2 FLOODING RISK ASSESSMENT USING SOCIAL MEDIA MARKER ... 29
2.2.3 ARTIFICIAL INTELLIGENCE ALGORITHMS IN THE NOWCASTING PHASE OF FLOOD RISK ASSESSMENT ... 31
2.3 AIM OF THE THESIS ... 35
3 APPLICATION TO CASE STUDIES OF THE REMOTE SENSING FOR FLOODING RISK ANALYSIS ... 37
3.1 ANALYSIS OF THE SUBSIDENCE IN THE COASTAL AREA AND HYDRAULIC RISK IN MAZZOCCHIO AREA (LT) ... 38
3.2 INTEGRATION OF SATELLITE INFORMATION (SAR) WITH HYDRAULIC MODELING: CASE STUDY OF THE STRYMON BASIN ... 52
3.3 RECONSTRUCTION OF FLOODING MAP IN INSTRUMENTED AREA (CASE STUDY: HARVEY HURRICANE, HOUSTON) ... 59
3.4 RECONSTRUCTION OF FLOODING MAP IN A NON-INSTRUMENTED AREA, CASE STUDY OF THE DIAMREY TYPHOON IN QUANG NGAI (VIETNAM) ... 73
3.5 ANALYSIS OF PRECIPITATION DATASET ALWAYS AVAILABLE AS INPUT OF HYDRAULIC MODELING IN A NOT INSTRUMENTED AREA ... 77
4 THE TWO-DIMENSIONAL MODEL FHM 2D ... 89
4.1 THE NECESSITY OF A MORE ACCURATE HYDRAULIC MODEL ... 89
4.2 GOVERNING EQUATIONS ... 94
4.3 NUMERICAL MODEL ... 95
4.4 TIME INTEGRATION ... 96
4.5 DISCRETIZATION OF NUMERICAL FLUXES ... 99
4.6 SOURCE TERM DISCRETIZATION ... 105
4.7 NUMERICAL TESTS ... 110
4.8 APPLICATION FHM-2D TO A REAL CASE STUDY ... 124
5 FLOOD RISK ASSESSMENT IN NOWCASTING PHASE... 133
3
5.2 A REAL TIME FLOOD SURROGATE MODEL ... 133
5.3 PRELIMINARY RESULTS ... 139
5.4 CONCLUSIONS AND ONGOING DEVELOPMENTS ... 142
6 SUMMARY AND PERSPECTIVES ... 144
6.1 SUMMARY ... 144
4
Figure 1 - Typology of sensors system onboard the satellite ... 13
Figure 2 - Satellite Radar Systems available now and into the future (from Tapete, D., & Cigna, F. (2019)). 15 Figure 3 - Example of soil moisture detection with ERS SAR satellite ... 19
Figure 5 - flooding detection from SAR satellite ... 24
Figure 6 - Social marker posted during hurricane Harvey in Houston that allows to localize the area affected to flood ... 30
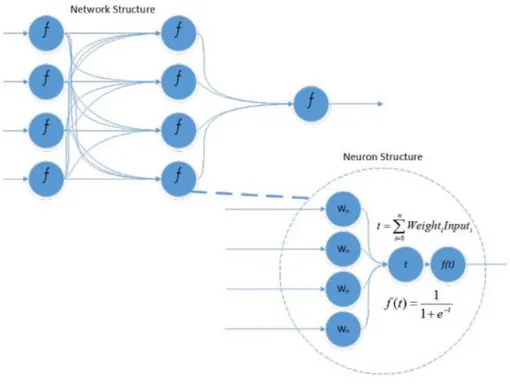
Figure 7 - Feed forward artificial neural network structure using a sigmoid activation function ... 34
Figure 8 - On the left in red the area of interest of Mazzocchio is highlighted, while on the right the Mazzocchio's basin ground elevation. ... 39
Figure 9- Examples of applications of satellite interferometry. ... 40
Figure 10 - PS-InSAR technique. ... 41
Figure 11 - Results of interferometric measurements (PS-InSAR) obtained from Sentinel-1 represented on Google Earth. In red it was delineated the boundary of Mazzocchio basin (AoI). ... 42
Figure 12 - Example of a historical series of movement of a PS. ... 43
Figure 13 - IDW interpolation of interferometric data - a) Vertical displacement velocity [mm / year]; b) Subsidence from January 2018 compared to October 2014. ... 44
Figure 14 - Identification of 16 targets in map of subsidence of January 2018. ... 45
Figure 15 - Subsidence trend for the 16 selected targets (2014-2018 period). ... 46
Figure 16 - Examples of photographs for the 10 and 12 targets that allowed to view the presence or absence of subsidence. ... 47
Figure 17 - Location ant typologies of wells presents in AoI ... 48
Figure 18 - Results of the correlation between PCA and Target (individual data of each target in the image on the left. Correlation map in the image on the right). ... 49
Figure 19- Precipitation and subsidence trends inherent to the 16 selected targets. ... 50
Figure 20 - SPI index values and subsidence trend inherent to the 16 selected targets. ... 50
Figure 21 - Subsidence - Drought Correlation (SPI elaborated by the pluviometric data of the Pontinia station)... 51
Figure 22 - Location map. In yellow was represented the SAR subset processed image; in black the Serres basin, and at least the meteo-stations (polygons) 1: Lithotopos, 2: Koimissi Serron, 3: Achladochori, water level telemetry stations (polygons) 4: Trimeristis, 5: Nigrita, 6: Aggitis. ... 53
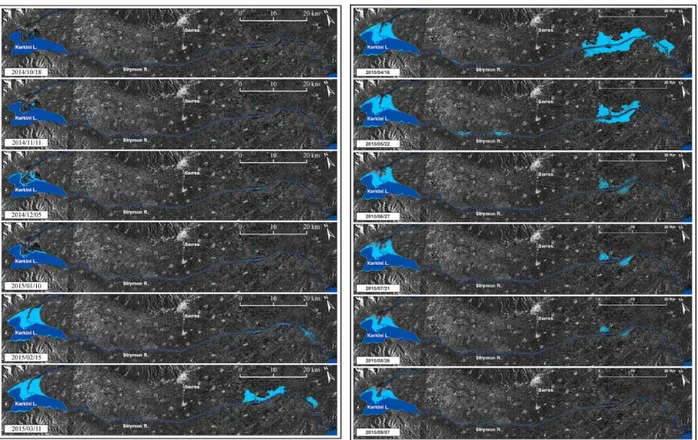
Figure 23 - Water/non-water. Binary images water/non-water from October 2014 to March 2015. ... 57
Figure 24 - Flooding maps obtained from Hydraulic modelling ... 58
Figure 25 - Flooding hazard maps of Harvey Hurricane of a) 28/08/2017, b) 30/08/2017 and c) 31/08/2018 ... 62
Figure 26 - Location of social media marker in Houston and b) example of photo used for the validation of hydraulic modelling (obtained from E2mC). ... 63
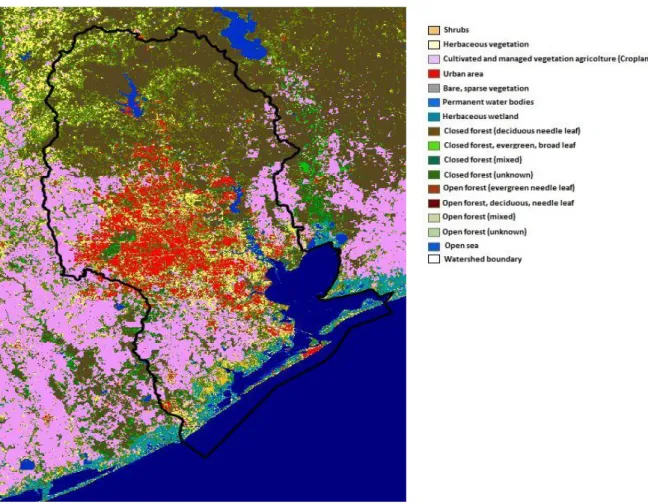
Figure 27 - Land cover by supervised classification algorithm on Copernicus images ... 64
Figure 28 - Rainfall amount (right) and runoff rate dR/dP for different values of k (left) ... 66
Figure 29 - Flooding map obtained from hydraulic modelling (k=0.1) ... 67
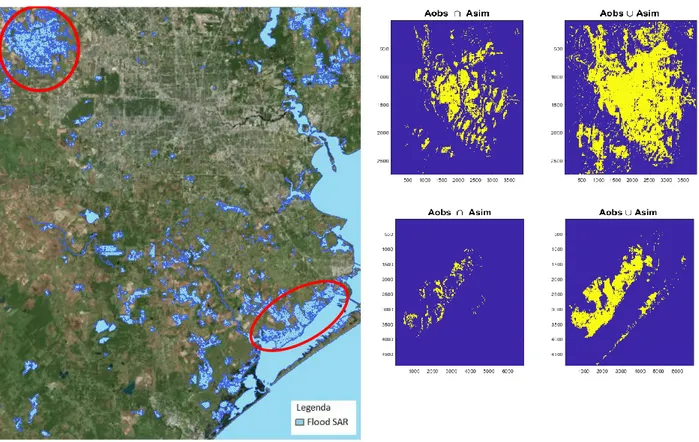
Figure 30 - Correspondence between the flooding areas obtained by hydraulic simulation and SAR satellite ... 68
Figure 31 - Location of measurement stations of the levels considered and hydrometric levels detected during the extreme event. ... 69
Figure 32 - Temporal trend of the floods in Houston during Hurricane Harvey from 26/08 to 31/08. Red symbols indicate the locations where the water level exceeds the top of the bank, the yellow where the level is near the top of the bank and the green when the water flows inside the bank. ... 70
Figure 33 - Social media marker referred at the same day of the flooding maps (28/08/2017) used for the validation of the results. ... 71
5
Figure 34 - Track of Diamrey Typhoon ... 74
Figure 35 - Result of the hydraulic modeling is shown on the left and the result of the Change Detection technique applied to Sentinel images 1 on the right. ... 75
Figure 36 - Zoom showing the occlusions presents on DEM used as input of hydraulic modelling for the rebuild of post event flooding map ... 76
Figure 37 - Validation of hydraulic modeling results with pictures of the AoI ... 76
Figure 38 - Number of gauge stations used in different databases in operation over time (Sun et al. 2018) 78 Figure 39 - GPM Costellation, Hou et al.(2014) ... 80
Figure 40 - Comparison between the amount of rain detected on the ground with that from satellite (TRMM); the rainfall from rain gauges are averaged for the stations, indicated in green square, in the figure on the left. ... 85
Figure 41 - a) DEM used for the tests; b) computational mesh with breaklines (visible as pink lines). ... 90
Figure 42 - Flow hydrograph used how input for the analysis ... 91
Figure 43 - Hydraulic simulation results for the depth and velocity at the mesh size 5x5 vs 10x10, 100x100 and 500x500. ... 92
Figure 44 - Momentum numerical fluxes through the face of the cells ... 100
Figure 49 - Shallow domain ... 105
Figure 46 - Schematization of Infiltration variables definition in the Green Ampt method variables used in FHM-2D ... 109
Figure 47 - Oscillating lake: well-balanced scheme. First-order scheme (times crosses). Second order scheme (plus crosses). Initial solution and bottom topography (solid and dotted lines). ... 111
Figure 48 - Oscillating lake with drag: well-balanced scheme. In a) is shown the analytical solution and bottom topography (black line).obtained in (Sampson et al., 2004); in b) the first-order scheme (times crosses) (light blue line) and in c) the second order scheme (plus crosses) obtained from FHM-2D (green line). ... 114
Figure 49 – Dam break test: a) analytical solution; b) with first order estension; and c) with second order estension. ... 116
Figure 50 - Z(x), h(x, t) + Z(x) transcritical flow without shock. In a is represented the analytical solution; in b that obtained from first order and in c that from second order extension. ... 117
Figure 51 - Z(x), h(x, t) + Z(x) Transcritical flow with shock. In a is represented the analytical solution; in b that obtained from first order and in c that from second order extension. ... 117
Figure 52 - Z(x), h(x, t) + Z(x) subcritical flow. In a is represented the analytical solution; in b that obtained from first order and in c that from second order extension. ... 118
Figure 53 - Elliptical hump used for the test case. The lowest contour level is at 0.01 and the bump has height 0.8. ... 119
Figure 54 - Bump test results in 2D ... 119
Figure 55 - Detailed topography of the catchment (from Cea et al, 2010) ... 120
Figure 56 - Velocity fields computed at time t = 20 s in runoff test with slope ... 121
Figure 57 – Outlet hyetograph obtained from FHM-2D using the first and second order of accuracy for differents number of cell computation 348x192 and 256x128. ... 121
Figure 58 - Outlet hyetograph obtained in Cea et al, 2010 used for the comparison with the FHM-2D results. ... 122
Figure 59 - The bottom setting of numerical examples. The figure illustrates the case of urban draining with obstacles like houses. ... 122
Figure 60 - Outlet discharge as a function of time obtained from (Chertock et al., 2015). On x-axis was reported the time in seconds and in y-axes the discharge. ... 123
Figure 61 - Outlet discharge as a function of time obtained with FHM-2D: figure a, b, c, d are referred at first
6
referred at second order of accuracy and respectively at 100, 200, 400 and 800 m of computational grid size.
... 123
Figure 62 - Area of Interest: Saint Lucia Island ... 124
Figure 63 - Tracks of nearly 150 years of tropical cyclones weave across the globe ... 125
Figure 64 - Rain gauge stations presents in Saint Lucia island and status of completeness of rainfall data in SLUMET and WRMA stations ... 127
Figure 65 - In yellow are shown the 12 extreme climatics events simulated and the sources where it were founded the social marker used for the validation of results. ... 127
Figure 66 - DEM of Saint Lucia island rebuilt for the simulation and zoom of urban area where is possible to see the good accuracy in the reproduction of the elements (houses, rivers, etc.) ... 128
Figure 67 - FHM-2D result of Tomas hurricane ... 129
Figure 68 - FHM-2D result of Tomas hurricane and zoom on three urban areas present on the island of Saint Lucia ... 130
Figure 69 - FHM-2D result of Tomas hurricane and map showing the damage that emerged during the extreme flooding event ... 131
Figure 70 - zoom of a part of the island floodinged in the CHARIM map and in the hydraulic model map .. 131
Figure 71 - social markers used in the validation of the results obtained by FHM-2D ... 132
Figure 72 - face recognition technique ... 135
Figure 73 - Hyetograph of a rainfall with 10 years return period ... 137
Figure 74 - Input and output features of matrix ... 138
Figure 75 - Operative frameworks of the algorithm ... 138
Figure 76 - The eight eigen-values derived from PCA transformation of training dataset ... 139
Figure 77 - cost of the validation dataset as a function of the number of epochs (left) and accuracy of the validation dataset as a function of the number of epochs (right) ... 140
Figure 78 - Results obtained from the algorithm for a) 10 years, b) 20 year and c) 50 year of return time . 141 Figure 79 - Flag classification classification obtained from the flow depth and velocity relationship ... 142
7
1 PREFACE
Flood risk assessment, as essential part of flood risk management, is a useful tool for the indication of economic damages and for the identification of the most vulnerable cities worldwide. In most cases, cities with a high concentration of people and goods are vulnerable to floods (Kubal et al., 2009). As a consequence there is a need to assess the flooding risk in all its entirety.
Risk is the outcome of the interaction between a hazard phenomenon and the elements at risk within the community (e.g. people, buildings and infrastructure) that are vulnerable to such an impact (Jacks et al., 2010). In risk assessment, one has to consider the probabilities of hazardous events affecting the community and the consequent harm to the community. Probability is a concept and skill that most people have problems understanding, as many cannot handle statistical concepts or effectively factor probabilities into their decision-making (“PWS Guidelines on Communicating Forecast Uncertainty” (PWS-18), WMO/TD No. 1422).
The flooding risk assessment consists on different phases: prevention, forecasting, real time monitoring and finally post-event.
In the prevention phase, all the actions that allow to reduce the risk of flooding for the most sensitive areas are implemented. These actions are different and the mains are intended to: a) introduce advance flood warning and pre-planning can significantly reduce the impact of flooding; b) modify homes and business to help the population to withstand the floods; c) Construct buildings above flood levels; d) tackle climate change; e) protect wetlands and introduce trees strategically; f) restore rivers to their natural courses; g) introduce water storage areas; h) put up more flood barriers; and at least l) improve soil conditions. All these phenomena are investigated through post event flooding maps. However, because of the ongoing climate change these flooding maps based on past extreme events are obsolete. In fact, the return period (intended as an average time or an estimated average time between events such as floods) of such floods is completely different from the ones happened in the past and therefore there is a need to update these maps.
The forecasting and nowcasting phases (the term forecast is referred to a very short time, generally from zero to six hours) are very important from the point of view of effective warnings and response in order to reduce the disaster risk. The forecast phase generally is based on four components: Observational Data and Monitoring Systems, Numerical Weather Prediction, Conceptual Models and Situational Awareness. For all of these components higher temporal and spatial resolution of the data (temperature, humidity pressure and wind data) are required to lead to a better weather diagnosis. These analyses allow to plan a better warning response. To date both these two phases are fundamental for the civil protection in providing information to
8
the citizens (from e.g. media, governance institutions, etc.), understanding the hazard and, at least, in the emergency response plans. Especially the nowcasting phase, that is characterized by shorts times, requires a wide range of tools that allow to evaluate the hazard immediately. However, in some cases it is not possible to give these technologies to the civil protection and therefore, sometimes they entrust themself to the experiences of the operators or/and to their knowledge based on the experiences of past extreme events. The monitoring phase, instead, is managed by collecting information on the territory thanks to the ground-based systems linked to the local databases available or through the rescue teams. The ground stations (i.e. sensors measuring precipitation and / or water levels at relevant sites in local waterways) often are not available or capable to monitor well the extreme event. In fact, it is of extreme importance for this phase that the spatial disposition of the stations is such as to cover the whole area of interest. Because of this usually does not happen, the local rescue emergency team are employed, hence, exposing them at risk. Finally, the post-event phase deals with the using of flooding maps obtained with numerical models and / or via photographic evidence of the damages happened. These maps, as mentioned above, usually are obsolete considering the ongoing climate change and, often, do not make possible to localize all the area affected by the flood. Moreover, often these maps are implemented with hydraulic modelling using old input data (Digital Elevation Model, land cover, etc.) that do not represent the real status of the environment at the time of the extreme event of interest. Finally, usually these tools are validated considering maps based on past extreme events. As a consequence, this methodology is not useful for the reconstruction of post event maps with high accuracy, because of the land and climatic changings lead to consider new flooding areas that were safety in the past. Regarding the post event analysis with photographic evidences, the goodness of the maps depends directly from the area considered for the analysis. In fact, if the zone is in a developed city it is simple to find pictures that show the situation and that allow to rebuild a flooding map, while it is very difficult if the area is in a developing country.
In flood risk assessment, satellite remote sensing constitutes a very useful tool in all above described phases. In fact, through the satellites it is possible to have, with regard to the prevention phase, a record of the floods that occurred in the past and the consequent location of the areas most exposed to the risk of flooding. For the forecast phase, information on the distribution and intensity of the rains that is about to fall can be obtained. In the monitoring phase, the satellites allow to follow the evolution of the extreme event and detect the flooding. Finally, in the post-event phase, satellites allow to a rebuilding of the flood maps and to the identification of flooded areas and to a consequently better organization of the securing of the areas most at risk.
Remote sensing from satellite, therefore, for all the phases of flooding risk assessment, allows obtaining important information in the detection of soil moisture, subsidence, precipitation and the extent of flooding.
9
Satellite technology is an excellent solution for obtaining information for flooding risk assessment for several reasons: a) allows analysis on a much larger scale compared to those made with ground instruments; b) involves less risk for rescue teams in action during floods; c) some sensors, such as radar, allows to get information in correspondence with any atmospheric configuration and during the night; finally d) in the near future satellites will be launched capable of providing ever better spatial resolutions and revisit time. At the same time, this technology also has some rather important limitations that lead us to integrate it with other existing techniques. Some of the most important limits are: a) of an instrumental nature (i.e. the radar is not able to capture flooding in the urban area); b) the spatial and temporal resolution not always able to capture the peak of flood during the extreme event; and finally c) that not all satellite missions are free and / or accessible;
For this reason the satellite instrument alone is not sufficient and must necessarily be associated with other existing and compatible technologies for flooding risk assessment.
Specifically, in this thesis we explore the possibility to improve flood risk assessment by the integration of hydraulic models with satellite data with reference at the two phases of post-event analysis and nowcasting. Regarding the post event, the aim was to understand if the remote sensing from satellite, considering its limitation, is a useful tool for the reconstruction of very accurate flooding maps that can perform the flooding risk assessment. Furthermore, also the possibility to integrate this technology with other available tools (social media marker and hydraulic modelling) was explored. Drawbacks arose about open source shallow water model (HEC-RAS) used in the case studies have suggested to develop a new 2D hydraulic model, that has been used in the carrying out of nowcasting phase.
Concerning the nowcasting phase, the possibility to integrate data of precipitation measured by radar with real time flood forecast model was explored. A flood model, following an artificial intelligence approach, was carried out. Such model was trained by a number of simulations carried out by the 2D hydraulic model. The development of the thesis has seen three main moments:
1) Analysis of the capabilities of remote sensing in flooding risk assessment by applying it to real cases and other available tools (hydraulic modeling and social media markers);
2) Application to the post-event phases in which it was first rebuilt the extreme event of Hurricane Harvey in Houston and then an assessment of the need to build more flexible numerical models than the one used for the simulations was done;
3) Application to the analysis of flooding risk assessment in the nowcasting phase through the construction of a real time artificial intelligence model.
10
In the first point, first of all was studied how remote sensing from satellite was used in the evaluation of flooding risk assessment for: detection of soil moisture and subsidence phenomenon; flood detection; and finally for estimating precipitation. For each of these applications the sensors and missions currently in orbit that are mostly used for these purposes have been presented. Such applications have been reported as case studies. Finally, other existing tools were investigated, such as hydraulic modeling and social media markers, useful for the flooding risk assessment.
In the second point, instead, considering the applications developed in point 1, in particular that of the reconstruction of the flooding emerged in Greece (river Strymon) and in Vietnam (Quang Ngai), remote sensing techniques from satellite with hydraulic modeling and social media markers were integrated. The numerical code used in these simulations was HEC-RAS 5.0.3. This hydraulic model was considered because suggested by FEMA and because of its excellent results in terms of robustness. The peculiarity of this hydraulic model is that it exploits the subgrid approach (Casulli et al., 2008). This method allows using large meshes to perform hydraulic simulations in large areas with reasonable computational times. The Hurricane Harvey, occurred in Houston, was adopted as a test case. In this study the technique of remote sensing from satellite was integrated with hydraulic modeling and social media markers. This methodology allowed us to reconstruct, using the information obtained from ground stations, extremely accurate flood maps for all days of the extreme flood event. Subsequently, tests were carried out on the robustness of the HEC-RAS code on a portion of the urban area of Houston. These analysis, conducted in correspondence of complex geometries (such as buildings, roads, slope changes, etc.), have allowed us to understand the goodness of the approach to the subgrid in returning the results of depth and velocity of the flow to the different spatial resolutions of the computational grid. The results of the tests led to the creation of a new numerical code that was able to overcome the limitations found in HEC-RAS and, in general, those that afflict the various models present in the literature. The model created was first of all object of a bench marking test and then of an application to a real case study. Twelve extreme events occurred in correspondence of Saint Lucia Island were simulated and the results were validated with social media collected by the local population.
Finally, the third and final point allowed us to explore the possibility of overcoming the main limitation in the application of hydraulic models in the nowcasting phase. In fact, the numerical codes for simulations require much longer times than those useful for the nowcasting phase (a few seconds). For this reason, an approach based on artificial intelligence has been used that allows, for a given atmospheric configurations that occurs, to obtain in a short time flooding maps based on past events similar to the extreme event that is coming. The surrogate model, in this thesis, has been trained with the simulated maps for the extreme events happened on Saint Lucia in past.
12
2 INTRODUCTION
There are very few places on earth where flooding is not a concern. In fact, any zone where heavy rain happened is vulnerable to flooding. A flooding occurs when water inundates land that is normally dry. This phenomenon can happen in a multitude of ways: heavy rainfall, a rapid melting of snow or ice, storm surge, presence of beaver dam in a particular position of a river; a breaking of a dam or a levee; and for subsidence phenomena, especially in a coastal area.
Most flooding take hours or several days to develop, giving residents and civil protection to prepare or evacuate. Others generate quickly and with little warning and are called flash floodings. This typology of events is extremely dangerous, in fact, can instantly turning a babbling brook or even a dry wash into rushing rapids that sweep everything in their path downstream.
Climate change is increasing the risk of flooding worldwide, particularly in coastal and low-lying areas, because of its role in extreme weather events and sea level rising.
Flooding cause more than 40 billion of dollars in damage worldwide annually, according to the Organization for Economic Cooperation and Development (OECD, 2016). Casualties have increased in recent decades to more than 100 people a year. When flooding waters recede, affected areas are often blanketed with silt and mud. The water and landscape can be contaminated with hazardous materials such as sharp debris, pesticides, fuel, and untreated sewage. Residents of flooding areas can be left without power and clean drinking water, leading to outbreaks of deadly waterborne diseases like typhoid, hepatitis A, and cholera. Because of the importance of the flooding issue, it is necessary to use strong monitoring technologies that allow to follow the extreme event and provide all the information for mitigate and assess the flooding risk. As mentioned above, the flooding risk assessment consists on different phases: prevention; forecasting; real time monitoring and finally post-event.
Several technologies for each of those phases, useful for the flooding risk assessment, have been reported in literature. Among such technologies, remote sensing from satellite is one of the most useful thanks to its ability to be used in all the phases. A wide range of information are provided by this technology: the analyses of soil moisture; subsidence phenomena; detection of the extension of inundation; estimation of precipitation intensity and monitoring of distribution. Hence, remote sensing from satellite is gaining, recently, considerable and increasing interest. Despite its advantages, there are some shortcomings that required to be overcome and for this reasons other technologies should be investigated and combined to it.
13
2.1 FLOODING
RISK
ASSESSMENT
FROM
SATELLITE
Remote sensing from satellite is defined as the science and art of obtaining information about an object, area or phenomena through the analysis of data acquired by a device that is not in contact with the object, area, or phenomena under investigation.
The sensors are divided into active and passive, the former receiving a back scattering fraction of their previously emitted signal, while the latter only pick up the electromagnetic waves naturally spread by the target (Figure 1).
Figure 1 - Typology of sensors system onboard the satellite
For the purpose of flooding risk monitoring, depending on the scale on which the analysis is performed, a variety of satellite data is used. In order to carry out effective monitoring, several conditions must be met: 1. data should be collected at the appropriate frequency depending on the mode (preventive/ operational); 2. the data should be adequately detailed to provide information on the state of the water and the status of the flooding embankments. Data from meteorological systems is useful to forecast precipitation and its intensity. Very high-resolution satellite images (VHRS) and high-resolution satellite images (HRS) can be used to monitor flooding embankments and their condition, and to monitor flooding plains. This applies to both radar and optical data. Radar data is weather independent and generally considered to be better suited for
14
water detection (Pluto-Kossakowska et al. 2017), while optical data is easier for photointerpretation and acts as a compaction of measurements from radar data.
The active sensors most used in remote sensing are the SAR (Synthetic Aperture Radar) with radar sensors (RAdio Detection And Ranging), which allow to detect an object and establish its distance from the sensor itself through radio waves. These waves can have wavelengths (𝜆) with values between microwaves and radio waves (with 𝜆 between 1 mm and 1 m and frequencies ranging from 0.3 to 30 GHz). The wavelengths are chosen according to the target to be analyzed and to the platform that supports the sensor, for example in the case of satellite RADAR the choice to use the typical frequencies of the microwave field depends on the fact that they have a transmissivity 100% in the atmosphere and therefore there is no signal loss, despite the presence of interference.
A RADAR device consists of four parts: a transmitter, a receiver, an antenna and a recorder. The ability of a RADAR sensor to observe an object depends on many factors including the intensity of the emitted signal, the sensor-target distance, the 𝜆 of the incident signal and finally the reflectivity of the object itself. This last parameter depends in turn on numerous factors both inherent to the characteristics of the RADAR such as: frequency, signal polarization and acquisition geometry; both intrinsic properties of the target such as: roughness, humidity, size and electrical properties of the object. The roughness of the surface of the object determines the amount of backscattered energy that will return to the sensor, the more it will be wrinkled the brighter it will be during acquisition. On the contrary smooth surfaces will appear black, due to the type of reflection of the waves, which in this case will be of specular type, without the possibility of returning to the receiver. A surface is considered smooth if the roughness on it is lower than the 𝜆 of the signal. The angular reflection instead depends on the presence of walls perpendicular to the ground, such as buildings, and has the effect of amplifying the backscattered signal as one or more signal reflections occur, this phenomenon typically occurs in densely populated areas. The humidity of the target is a very important parameter because, by virtue of the electrical properties of the water, it determines its greater or lesser capacity to allow itself to be penetrated by the incident signal. An object rich in water will be more reflective than one that is devoid of it, this property depends on the dielectric constant of the material and is particularly important in the case of vegetation as its properties vary considerably during the year. The RADAR sensors can operate with different bands and each one provides different information on the investigated targets. The most used bands are those that do not interfere with the atmosphere, i.e. that guarantee an atmospheric transmissivity close to 100%, in particular the most common sensors exploit the microwave portion corresponding to the X, C and L bands.
All satellites equipped with radar sensors (SAR - Synthetic Aperture Radar) orbit the earth on a near-polar orbit at an altitude ranging from 500 to 800 km above the earth’s surface, depending on the satellite platform
15
hosting the SAR sensor. The angle between true north-south and the satellite orbit varies slightly, depending on the satellite but, in general lies in the range of 10 degrees.
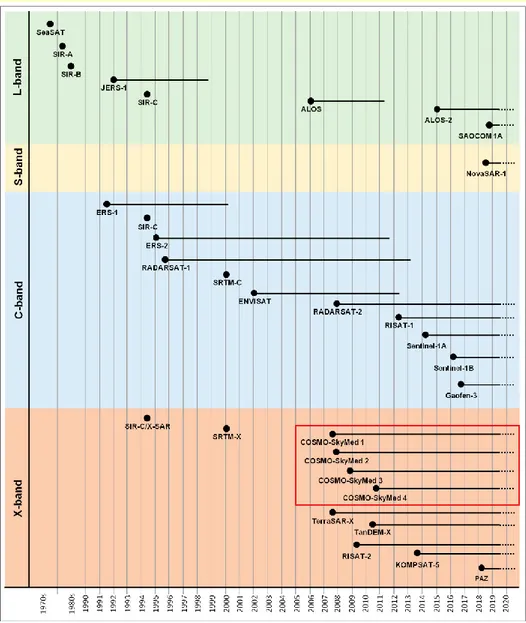
Figure 2 shows all the SAR satellites distinguished by the typology of radar band.
Figure 2 - Satellite Radar Systems available now and into the future (from Tapete, D., & Cigna, F. (2019)).
Satellite sensors are mounted on their platforms with the direction of transmission at 90° to the flight direction. The earlier satellites (ERS-1, ERS-2, Radarsat-1 and Envisat) were all right looking satellites, meaning that microwave beam transmits and receives on the right side only of the satellite, relative to its orbital path, i.e. the system cannot rotate. Newer satellites (Radarsat-2, TerraSAR-X and COSMO-SkyMed) have both right-looking and left-looking capabilities, thus they can ‘look’ to the right or the left of the craft, but not both directions simultaneously. The angle at which the sensor is pointed toward the earth’s surface is referred to as the off nadir, or look, angle.
16
Optical satellite remote sensing systems are characterized by a variety of technical parameters, including very important spatial and spectral resolution. Both of these parameters are crucial for monitoring the condition of embankments and forecasting the occurrence of floodings. For preventive monitoring this is a sufficient revisit time, but the possibilities of the usage of satellite optical systems are limited by the weather conditions and cloud cover.
Optical data, due to frequent cloudiness occurring in the period of increased flooding hazard, is less common for operational use in monitoring damage to levees (Weintrit et al., 2018). It is possible to use such data only in cloudless conditions or in the presence of slight cloud cover. This means that the identification of damage to flooding embankments with the use of optical data can be carried out as quasi-continuous monitoring, conducted in order to detect damages early. Examples of optical data with very high spatial resolution (IKONOS, QuickBird) being used to identify damage to flooding embankments are shown in the literature – these cover, for example, damage to the sod in the main body of the embankment and on the embankment slopes (Hossain et al. 2004). Optical data is much more frequently used to assess the state of damage after a flooding event or to determine the extent of flooding, or for flooding risk assessment (Stancalie et al. 2007; Ho et al. 2010; Skakun 2012; Shaker et al. 2012; Asare-Kyei et al. 2015; Byun et al. 2015; Hu et al. 2015; Malinowski et al. 2015).
The progress of satellite systems in the assessment of flooding risk open the way for a greater use of such techniques in the study, analysis and forecast of flooding events. In fact, remote sensing allows the monitoring of ongoing phenomena, which otherwise will be difficult to assess on a large scale, by means of change detection techniques (Singh A., 1989). The goal of change detection is to discern those areas on digital images that depict change in the feature of interest between two or more image dates. The reliability of the change detection process may be strongly influenced by various environmental factors that might change between image dates (Mishra et al., 2017).
There are different information that is possible to obtain with remote sensing useful for flooding risk assessment, beyond what has already mentioned before, as: analyses of land use/cover changes for understanding the complex relationships between human activities and their environmental impacts; to provide land use/cover information such as the degradation level of forests (Franci et al., 2015; Hayes & Sader, 2001) and wetlands; the evaluation of water resources (Frazier & Page, 2000); the urbanization rate (Maktav et al., 2005; Dewan & Yamaguchi 2009; Bagan & Yamagata, 2012); the intensity of agricultural activities (Akbari et al., 2006) and other man-induced changes (Khan 2000).
Their spatial resolution makes these images suitable for analyses on regional scale that allow to have a complete scenario of what are happens in the area of interest. It is important to underlain again that is not possible with the instrument locate in situ.
17
Both the type of sensors present onboard the satellite, optical or radar, allow to do flooding risk assessment. In the following sections it is reported how the remote sensing from satellite is exploited in the investigation of different elements that should be considered in the flooding risk assessment. Particular interest is given to the satellite missions and sensors used for this purpose.
2.1.1 REMOTE SENSING FROM SATELLITE FOR THE RETRIEVAL OF SOIL MOISTURE
As far as soil moisture is concerned, knowing this measure in the pre-event and monitoring phases would make it possible to assess the soil saturation rate and thus to obtain a better estimate of the flooding risk of the area involved from alluvial event. In fact, an extremely humid or saturated soil, decreasing its infiltration capacity, tends to favor the development of a superficial inundations and therefore to increase the flooding risk.
Soil moisture is traditionally measured in situ to obtain accurate information on the point level with high temporal resolution, but these measurements have limited spatial coverage (Dorigo et al., 2011). A good solution to solve this issue is represented by remote sensing from satellite.
Many satellite active and passive microwave sensors launched since the 1970s have been widely used to estimate regional and global surface soil moisture, including the Soil Moisture Active Passive (SMAP) (Entekhabi et al., 2010, Reichle et al., 2016), Scanning Multichannel Microwave Radiometer (SMMR) (Paloscia et al., 2001), Advanced Scatterometer (ASCAT) (Lindell and Long, 2016), Soil Moisture and Ocean Salinity Sensor (SMOS) (Kerr et al., 2012, Wigneron et al., 2017), Fengyun Satellites (FY) (Parinussa et al., 2014, Song and Jia, 2016), Advanced Microwave Scanning Radiometer on the Earth Observing System (AMSR-E) (Du et al., 2016, Njoku et al., 2003) and Advanced Microwave Scanning Radiometer 2 (AMSR2) (Parinussa et al., 2015) on board on Aqua satellite.
The production of soil surface moisture maps, up to 5 cm deep, with remote sensing can be carried out thanks to optical or SAR image processing.
For the optical data, the activity consists in the calibration of inversion models that use the electromagnetic information collected in the thermal and reflectance bands. The techniques for estimate surface soil moisture with data acquired in the visible band and in the NIR, VNIR, SWIR and thermal bands (TIR) are based on reflectance and emittance measurements (Sadeghi et al., 1984), and were partially revealed effective (Sommer et al, 1998). The methods most frequently founded in the literature refer to: multispectral indices of humidity / drought based on reflectance bands, surface energy balance, thermal inertia and apparent thermal inertia, and behavioral model radiative soil-vegetation (method of the triangle Ts / Fr).
18
Several study, in order to improve the retrieve of soil moisture, suggest the use of multiple microwave bands or brightness temperature observations of multiple satellite. This allow to overcome the main limits that afflict this technique, as the revisit time (days) and the spatial resolution (km) that are not always good for the monitoring of soil moisture. In (Zhang K. et al, 2019) it is underlined how (Njoku and Li, 1999) using satellite microwave radiometer data from multiple bands of AMSR; (Piles et al., 2016) used the triangle inversion technique to enhance soil moisture retrieval through synergies of SMOS microwave observations and Spinning Enhanced Visible and InfraRed Imager (SEVIRI) optical and infrared data onboard the Meteosat Second Generation (MSG) satellite; (Liu et al. 2012) developed a method to combine passive and active microwave products to improve the estimation of soil moisture; (Rodríguez-Fernandez et al., 2015) and (Kolassa et al., 2016) adopted artificial neural network methods to combine observations from active and passive satellite microwaves to retrieve soil moisture; (Aires et al., 2012) compared synergistic multi-wavelength remote sensing to a posteriori combination of retrieved products; (Kolassa et al., 2017) further investigated the assimilation of soil moisture retrieved from active and passive satellites into a land surface model. There is also the European Space Agency (ESA) Climate Change Initiative (CCI) project (Dorigo et al., 2015; Enenkel et al., 2016), that merges a long-term record of global soil moisture from SMOS, AMSR-E, and AMSR2 (Yao et al., 2017), and a record based on the SMOS and AMSR-E (Van der Schalie et al., 2018). All these studies, have revealed the effectiveness of synergistically using observations from multiple satellites or multiple sensors to improve the retrieval of soil moisture. However, in literature, this challenge is still open. In fact, it is rare to retreive studies on the merge of soil moisture data obtained from differents sensors. As mentioned before, one of the main limits of passive sensors measure is the poor spatial resolution (more than 40 km). Active sensors, instead, particularly the Synthetic Aperture Radar (SAR) have a spatial resolution better than 50 m and have been widely used in recent years.
The soil moisture retreivement with SAR sensors is based on the interpretation of backscattering signal (see Wagner et al., 1999). Despite the good spatial resolution, the SAR technique present some important limitations in the retreive of soil moisture. In fact, as reported in (Zribi et al., 2006), in case of presence of bare soil the backscattered radar signal depends strongly on soil moisture and surface roughness (Ulaby et al. 1986); in case of sparse vegetation, the return signal depends both on the vegetation backscattering characteristics and on the attenuation it introduces to backscattering from the soil (Ulaby et al. 1982, Prevot et al. 1993); in case of dense vegetation, such as in forests, the soil contribution, in the C band, is generally very weak, particularly at high incidence angles (Ulaby et al. 1986, Fung 1994). (Zribi et al., 2006) describe in his paper, that many models have been developed to understand the physics of the interaction between radar signal and surface or vegetation parameters. For bare soils, different theoretical and empirical approaches have been developed (Fung et al. 1992, Oh et al. 1992, Dubois et al. 1995, Wang et al. 1997, Shi et al. 1997, Zribi and Dechambre 2003). Among these, the ‘linear approach’ linking surface soil moisture to
19
calibrated and validated SAR radar measurements (ERS, SIRC, RADARSAT, and so on) is widely used (Cognard et al. 1995, Quesney et al. 2000, Le Hegarat-Mascle et al. 2002, Zribi et al. 2005).
W. Wagner et al. (1999) , in their paper, report how ERS (European Remote Sensing) technology is an excellent instrument that can provide the soil moisture of a given area with a good precision. ERS technology is part of the SAR (Synthetic aperture radar) systems. The fundamental principle on which the SAR systems are based is that of emitting electromagnetic radiation (in the microwave region, in particular, for ERS, in the C band with a frequency of 5.3 GHz) in the direction of the Earth's surface and recording the amount and the return time of the diffusion energy (backscattering). These sensors allow images to be acquired regardless of sunlight and clouds. The two SAR ERS-1 and 2 satellites, whose launch took place respectively in July 1991 and in April 1995 by the ESA (European Space Agency) of which the ASI (Italian Space Agency) is part, have the same characteristics: helium-synchronous orbit, circular, with inclination of 98.5 °, rotation around the Earth every 100 minutes at a height of 785 km. The two satellites are able to acquire images at every point on the surface of the Earth every 17 days in ascending and descending orbit, so that the entire coverage of the Earth is obtained in 35 days, with a ground resolution of approximately 25 meters .
Wagner et al. employed an algorithm for a series of 6 years data, also proposing a qualitative comparison between the results obtained using as input the data deriving from satellite with those obtained from direct instrumentation. The article shows how the data obtained from the ERS scatterometer very well approximate those obtained on land, thus demonstrating the soundness of the technique for estimating soil moisture. The figure 3 shows an application of phase-retrieved soil moisture, applied across agricultural fields (De Zan et al, 2014). Here, the differential phase (in degrees) between two SAR images clearly shows delineation along field boundaries, associated with differing moisture states.
Figure 3 - Example of soil moisture detection with ERS SAR satellite
Another interesting approach in which ERS technology is used is found in the article proposed by (Scipal K. Et al, 2008) which compares the results of soil moisture obtained from inputs provided by the satellite with
20
those of the date ERA INTERIM base. The ERA interim global atmospheric numerical modeling dataset is processed by the European Center for Medium-Range Weather Forecasts (ECMWF).
The comparison shows that the two technologies give very similar results, thus underlining the great flexibility of ERS technology.
The Advanced spatial resolution Advanced Synthetic Aperture Radar (ASAR) radar sensor on board the ENVISAT satellite owned by the European Space Agency (ESA) is operating in C band (5.33 GHz), which resumes with incidence angles between 15 ° and 45 ° with a temporal frequency of 35 days. Potentially it allows to have images on the ground with high spatial resolution (up to 12.5 m) and thanks to the possibility of acquiring images in Alternating Polarization modes, and therefore in double polarization, this sensor is today a promising and potential humidity monitoring tool on large spatial areas. The Advanced Synthetic Aperture Radar (ASAR) on board the ENVISAT satellite is an active radar sensor operating in the microwave frequencies (5.33 GHz). The antenna consists of a transmitter and a receiver (monostatic radar), and resumes in look side mode, ie from the side with respect to the direction of flight, with angles of inclination with respect to the vertical for the sensor between 15 ° and 45 ° . The radar estimates the backscattering coefficient σ0 of the soil, from which the dielectric constant ε directly connected to soil moisture is derived (Topp et al., 1980). The soil moisture is then derived from the dielectric constant of the soil. The dielectric constant was estimated using the physically based model with proven validity Integral Equation Model by (Fung et al., 1992). Once the dielectric constant ε is obtained, the soil moisture θ has been estimated by (Topp et al., 1980).
Other SAR satellites widely used for this type of application are Sentinel 1, RADARSAT-2, ALOS PALSAR and SAOCOM. All the missions have on board sensors operating in L band with frequency 0.39 - 1.55 GHz. Given their ability to operate a different mode of acquisitions, they are able to provide a good spatial resolution, of the order of the meter, and for these reasons their use is becoming more and more frequent in the study of soil moisture. The limit that characterizes the products deriving from these missions, except for the Sentinel product, is that the images are not free.
2.1.2 REMOTE SENSING FROM SATELLITE FOR THE SUBSIDENCE PHENOMENA ASSESSMENT
Subsidence is a process of slow lowering of the ground level (mm-cm / year) to a local or regional scale, which can be produced both from natural and/or anthropic causes. Like soil moisture, the phenomenon of subsidence is also very studied through the use of remote sensing, in particular through the Interferometric technique.
The main natural phenomena responsible for causing subsidence are: tectonic movements (Watts, 1982; Dokka, 2006), volcanic activity (Branney, 1995; Takada & Fukushima, 2013) and all the processes related to
21
land consolidation (Tovey & Paul, 2002; Van Asselen, 2011). A common characteristic of the majority of natural causes of subsidence is that the areas involved are very extensive (regional scale) and the rates of soil sinking are very low, therefore they do not involve immediate risk situations and the effects are observed after several years.
On the contrary, anthropic causes, which are usually associated with the construction of buildings and infrastructures (Stramondo et al, 2008; Manunta et al, 2008) and the extraction of fluids from the underground (Stramondo et al, 2007; Tomas et al, 2005; Klemm et al, 2010), involve consolidation processes on a local scale which can be much faster.
Interferometry is the study of the amplitude and phase difference obtained by comparing two SAR images inherent to the same scene, but which were taken at a different time and therefore with slightly different viewing angles. The image obtained by this comparison is called an interferogram. Interferograms are maps of relative ground-surface change that are constructed from InSAR data to help scientists to understand how tectonic or human activities, such as groundwater pumping and hydrocarbon production, can cause the land surface to uplift or subside. Interferograms require 2 images taken at intervals in time to determine if there has been any shift in land surface levels. If the ground has moved away from (subsidence) or towards (uplift) the satellite between the times of the two SAR images, a slightly different portion of the wavelength is reflected back to the satellite resulting in a measurable phase shift that is proportional to displacement. The map of phase shifts, or interferogram, is depicted with a repeating color scale that shows relative displacement between the first and the second acquisitions. The direction of displacement - subsidence or uplift - is indicated by sequence of the color progression of the fringe(s) toward the center of a deforming feature (Figure 4).
Figure 4 - left the Interferogram interpretation (left) and the SAR interferogram processed right) by TRE ALTAMIRA capturing the deformation occurred in the volcano Piton de la Fournaise (Reunion Island) in May 2015
This analysis is very useful for monitoring any type of land surface variation (Massonet & Feigl, 1998; Rosen et al, 2000), such as the effect of earthquakes, landslides and subsidence on the pre-existing topography.
22
Interferometric Synthetic Aperture Radar (InSAR), also referred to as SAR Interferometry, is the measurement of signal phase change, or interference, over time. When a point on the ground moves, the distance between the sensor and the point on the ground also changes and so the phase value recorded by a SAR sensor flying along a fixed orbit will be affected, too.
There are two different ways of acquiring InSAR images: single pass or dual pass. The first involves the presence of two antennas on board the satellite and the two acquisitions to be compared take place at the same time, with a minimal variation of the position. The second one involves the use of a single antenna and therefore the acquisition of the two SAR images to be compared takes place at different times. In the latter case the two orbits can undergo slight variations in space (from a few meters to hundreds of meters). To describe these imperfections of the orbit two parameters are used: the spatial baseline which is the distance between the two satellites at the time of acquisition and the temporal baseline, which instead describes the time interval between the two.
When a pair of images is subjected to interferometric analysis with a view to identifying movement and, thereafter, quantifying that movement, the process is referred to as Differential InSAR (DInSAR). Since change detection is now the goal, topographic effects are compensated for by using a Digital Elevation Model (DEM) of the area of interest, creating what is referred to as a differential interferogram (the word “differential” here refers to the subtraction of the topographic phase contribution from the SAR interferogram).
The DInSAR analysis was born at the Milan Polytechnic at the end of the 1990s and allows the measurement of extremely slow ground movements, in the order of mm / year. The SAR differential interferometry is particularly suitable for the study of ground deformation phenomena because it has numerous advantages, including: acquisition 24 hours a day in any weather condition and in any corner of the planet (even the least accessible areas), possibility to quickly analyze very large areas, the continuous implementation of ever-increasing technologies and new data belonging to different space agencies.
The two major limitations of this technique are: the inability to measure displacements greater than half a wavelength between adjacent resolution cells (using microwaves the measurable variability must be in the order of mm or cm) and the impossibility to measure the absolute displacements if not along the direction of the line of sight (LOS) and therefore the descending component of the displacement cannot be detected while all the intermediate displacements are detected as projections along the LOS.
The most advanced techniques using differential interferometry are called A-DInSAR (Advanced Differential Synthetic Aperture RADAR Interferometry) and include: PS (Ferretti et al, 2001), SBAS (Berardino et al, 2002), SqueeSAR (Ferretti et al, 2011), SPN (Arnaud et al, 2003), CPT (Blanco-Sanchez et al, 2008), MT-UnSAR (Hooper, 2008) and ISBAS (Sowter et al, 2013). There are numerous studies that highlight the effectiveness of these interferometric techniques in the applications to the study of subsidence (Tomas et al, 2005;
23
Strasmondo et al, 2007; Manunta et al, 2008; Sousa et al, 2010; Tomas et al, 2010; Teatini et al, 2012; Raspini et al, 2014) arguing that: the areas to be monitored are often the urbanized ones and that therefore the density of the permanent reflectors is sufficiently high in most cases, the subsidence is vertical and therefore the fact is important of not being able to measure the displacement N-S.
Moreover, thanks to these types of analysis it is possible to obtain a lot of different information, such as analyzing subsidence in vegetated areas (Tosi et al, 2016) combining HD images in X-band (studied with PS) and L-band images capable of penetrating the vegetation (studied with the SBAS), or to combine interferometric analysis and geological and geomorphological information to highlight the different deformative behaviors of the units present in the area studied (Conesa-García et al, 2016).
2.1.3 REMOTE SENSING FROM SATELLITE FOR THE DETECTION OF FLOODING EXTENSION
Active and passive sensors, operating in visible, infrared, thermal and microwave portions of the electromagnetic spectrum provide cost-effective and vital information on the flooding impacted areas (Anusha & Bharathi, 2019; Sanyal and Lu, 2004). With advancement in the technology over recent years, there is an increase in the availability of during and post event satellite products to the users both in terms of quality and quantity. ALOS PALSAR, RADARSAT-1/2, TerraSAR-X, ENVISAT ASAR, Sentinel-1A/1B etc., are prime examples for active sensors. AVHRR/3, SeaWiFS, MODIS (Chen and Zhang, 2004), Landsat, AWiFS, Sentinel-2A/2B etc., are few passive sensors.
A further application that is mostly carried out using SAR sensors is the extraction of the extension of flooding. The SAR, given the characteristics of the sensor, allows to obtain information about the flooding during an extreme event (Figure 5). This fact, which is impossible to achieve with optical sensors, since that they cannot be used when there is an important cloud cover or during the night, leads them to be considered the main sensors to be exploited for the detection of flooding extensions. The SAR systems operate in the micro-wave band, which are long waves and have the capability to penetrate through clouds, to some degree of vegetation, rain showers, fog and snow (Anusha & Bharathi, 2019). Also, SAR frequent revisits make it ideal for flooding monitoring. The radar, however, gives information, as in the case of humidity estimation, only in a suburban environment. In fact, the presence of buildings, dense vegetation, shadows and rough terrain do not allow the sensor to detect and delineate the flooding.
24
Figure 5 - flooding detection from SAR satellite
Active sensors transmit a signal and receive the backscatter characteristics of different surface features (Anusha & Bharathi, 2019; Martinis and Rieke, 2015). The strength of the radar backscatter depends on multiple factors, notably surface roughness, dielectric properties, and local topography in relation to the radar look angle (Klemas, 2014). The smooth open water surface acts as a specular reflector of the radar pulse, which scatters the radar energy away from the sensor (Anusha & Bharathi, 2019; Martinis and Rieke, 2015), resulting in minimal signal returned to the satellite. As a result, the stagnant water pixels appear dark in radar data which is in contrast with non-water areas. This makes water pixel differentiation and detection easy in the radar data. Due to its good capability to distinguish water with other land surfaces, SAR data is more suitable for flooding detection. Various methods have been proposed in literature to delineate the flooding waters and the most used is the change detection method.
From the simple observation of any SAR image, it is possible to clearly distinguish the sea area from the earth zones. The response on the sea, due to the action of the wind, is spatially constant, similar to an equally distributed background noise. The response on earth varies greatly from area to area, based on the morphological characteristics of the corresponding surfaces. The channels and areas flooded in these images appear black due to the smooth surface of the water.
The scenes that must be used for the analyses are interferometric pairs, that is, that do not have a difference between the phase values of the radar signal between the two on the same area. This fact is very important, in fact it indicates the possibility of measuring the phase variations of the SAR signal coming from the same target on the ground for each image.
25
As mentioned before, one of the most used technique that is applied to this type of images is the "change detection" (CD). This technique is the process of identifying changes in an object or a phenomenon that occur in a particular time interval. A fundamental assumption of this type of analysis carried out with remote sensing data is that a change in the coverage of the ground or of the surface observed by a sensor corresponds to a change in the radiometric spectral response, and that this spectral change is significantly more significant than the changes due to other factors, such as atmospheric conditions at the time of acquisition, or soil moisture or even differences in the conditions for acquiring remote sensing data. Precisely in order to take this fact into account, images must be chosen that do not have an important temporal distance, even if in any case one is always tied to what is the availability of these in the archive.
The most used SAR satellites for this application refer to those working in the X band. The most found in literature are referred to Cosmo-Skymed constellation, Sentinel 1, Terrasar-X and Radarsat-2 missions. The optical sensor, given the high resolutions that are in any case provided by the last missions launched in orbit (Sentinel 2, Landsat, Quickbird, Black-sky, etc.) and their excellent revisit time, are increasingly taken into consideration for those events persistent over time. In fact, if the water persists over an area the time that the cloud cover vanishes it is possible to deduce and define, in any type of area, the flooding.
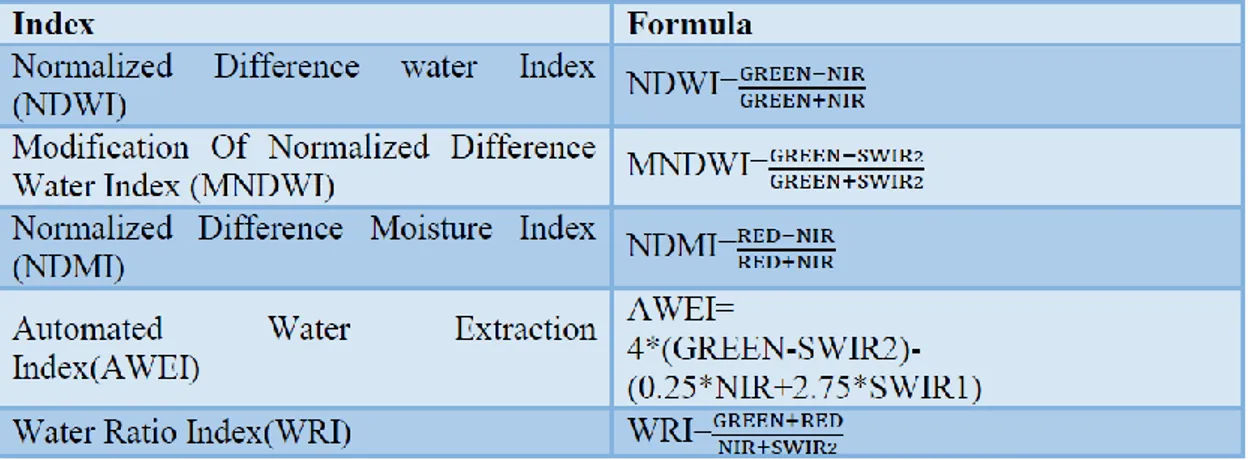
To extrapolate the areas flooded by the optical image an index that use the spectral reflectance signature can be used. The Normalized Difference Water Index (NDWI) (Mc Feeters S.K.,1996), Modification Of Normalized Difference Water Index (MNDWI) (Ko et al., 2015), Normalized Difference Moisture Index (NDMI) (Zhang, K. et al., 2016), Water Ratio Index (WRI) (Feyisa G.L. et al., 2014) and Automated Water Extraction Index (AWEI) (Mukherjee, N. R. et al., 2016) are among the best known,. In Table 1
the
formula of these indexes are shown.Table 1 - Indexes formula used for the flooding detection in optical images
A very useful approach, when the data is available, is to integrate the information obtained both from the SAR and from the optician in order to be able to overcome the previously explained limits that afflict the two technologies. An example is that, if there are no important cloud coverings in the optic, it is possible to
26
integrate the information extracted from the SAR so as to define the floodings also in the urban area, one of the most important areas for emergency planning.
2.1.4 REMOTE SENSING FROM SATELLITE FOR THE PRECIPITATION ESTIMATION
A final fundamental application of satellite sensing for the assessment of flooding risk is that of estimating precipitation. This information is fundamental because it would allow us to have data that can be used both in the early warning and nowcasting phases. In fact, for the forecast the data obtainable from satellite could be the basis for the forecast weather models (forecasts up to 15 days) and for the nowcasting, because they allow to estimate the precipitation amount that could happen in a specific area of interest.
Measurements of precipitation can be made using rain gauge stations, ground radar, or remote sensing technology. Rain gauge stations are traditional point measurements and have higher accuracy but it is difficult to obtain such precipitation measurements over oceanic and high-altitude areas where only sparse rain gauge stations are available.
The development of satellite remote sensing has provided several advantages, including its broad spatial coverage, automatic data acquisition and long-term continuity but the signals themselves are affected by the atmospheric and surface characteristics, which will lead to retrieval uncertainties (Zeng et al., 2018; Tang et al., 2012). However, remote sensing is an important method for retrieving high spatial and temporal resolution rainfall measurements over complex terrains and mountainous areas, where rain gauge stations are very limited or unavailable.
The satellite retrieval methodologies fall primarily into three categories, which are the visible and infrared (VIS/IR) methods, microwave (MW) methods and multi-sensor methods.
The VIS precipitation retrieval method mainly operates the empirical relationship between cloud brightness and rainfall because precipitation is considered to occur under highly bright clouds, which can be associated with cloud types, cloud areas and cloud growth rates (Zeng et al., 2018; Barrett, E.C et al., 1981; Kidd et al., 1999; Levizzani et al., 2001).
IR imagery is associated with cloud top temperatures and cloud growth rates can be obtained via the thermal emissions during both night and day; generally, heavier rainfall tends to be associated with larger, taller clouds with colder cloud tops (Kidd et al., 1999). Many researchers have developed different methods to retrieve precipitation based on VIS/IR data from geosynchronous earth orbit (GEO) and low-earth orbit (LEO) satellites, including the 3-hourly and monthly mean rainfalls (Levizzani et al., 2001; Atlas et al., 1981; Behrangi et al., 2009; Kühnlein et al., 2014; Stenz et al., 2015).
27
MW sensors can detect rain clouds directly and can provide information about the atmospheric constituents and hydro-meteorological profiles, which are more directly related to the ground precipitation rate (Joyce et al., 2003; Kidd et al., 2003; Welheit et al., 1977 and 2003; Sephens et al., 2008).
However, precipitation is not always associated with clouds and the VIS/IR methods cannot detect information below clouds (Kalinga et al., 2010). Meanwhile, MW instruments are restricted to polar-orbiting platforms, meaning that they obtain only a small amount of data and have the disadvantages of low spatial and temporal resolutions (Pan et al., 2010).
The idea of combining VIS/IR and MW observations to retrieve precipitation from multiple satellite sensors was proposed to compensate for the weaknesses of the two methods (Boushaki et al., 2008). Many products were developed by blending the MW and IR data, such as CMORPH (Climate Prediction Center’s morphing technique), PERSIANN (Precipitation Estimation from Remotely Sensed Information using Artificial Neural Networks), TRMM (Tropical Rainfall Measuring Mission), GPM (Global Precipitation Measurement), and at least GSMaP (Global Satellite Mapping of Precipitation).
There products, also if they combine different methods, in correspondence of heavy rainfall, produce an underestimation of peak of precipitation. This issue is due to several motivations, i.e. instrumental limits, morphology of the area of interest, atmospheric conditions, presence of high humidity, etc. In literature there are a lot of studies with the goal to quantify the underestimation but this issue is still open. In fact, due to the limits that afflict this technology, to date it is not possible to identify a parameter that allow the correction of the precipitation value estimate from remote sensing.
2.2 OTHER
TECHNIQUES
IN
FLOODING
RISK
ASSESSMENT
As widely reported in the previous section, remote sensing exhibits some limitations (mainly spatial and temporal resolution and instrumental limits). The need to overcome its disadvantages as well as the exigence of having very accurate information in the all phases of the flood risk assessment, are leading to the attempt to integrate this technique with other well-known techniques (i.e. hydraulic modelling in the prevention and post event phases) and/or other innovative tools (i.e social media marker for the monitoring and post event phases). In detail, hydraulic modelling and social media marker as supporting techniques for the post event investigation and machine learning for the nowcasting phase are described.
28 2.2.1 HYDRAULIC MODELLING IN FLOOD RISK ASSESSMENT
Modelling, in conjunction with hydrological analysis, allows determination of flooding extents, levels, depths, velocities, and overland flood routing. Modelling may also be used to determine scour, sediment and pollution dispersal. All these parameters are important in order to assess a flooding risk in the area of interest. Effective flooding management requires flooding inundation mapping, probabilistic estimates of potential damage and risks in flooding zones, and the design of a master plan for flooding risk mitigation (Pinos & Timbe, 2019).
Hydrodynamic–numeric models compute flooding by solving the hydrodynamic equations of motion for given geometric and hydraulic boundaries and initial conditions (Fohringer J. et al., 2015).
Usually, hydraulic modeling flooding maps are mainly obtained by 2-D flooding simulations, (see, for example, Proust et al., 2010; Costabile & Macchione, 2012), even if there are some applications with 3D models (Orton et al. 2018).
In general, computation time depends on the spatial resolution (Falter et al., 2013) and on the complexity level of the numerical algorithms for integrating model equations (Horritt and Bates, 2002; Vacondio et al., 2014).
The two-dimensional approach is preferred when the flooding must be simulated on a large scale (more than 10000 km2) (Hunter et al., 2008; Mignot et al., 2006). The information extractable from this numerical method refers to the depth, velocity and the extension of the flooding. These are the fundamental quantities required for damage evaluation (Grigg, N. S., & Helweg, O. J., 1975). Another approach that is widely found in the literature refers to 1D + 2D models, in which the river is discretized in one dimension while the surrounding environment in two-dimensional (Mazzoleni et al., 2013; Leandro et al., 2009). Generally, flooding hazard assessments by hydraulic models are affected by several sources of uncertainties which have significant consequences on the flooding maps accuracy. In particular, uncertainty could arise from scarcity of the hydrological data or knowledge of hydraulic parameters necessary to model calibration and validation, from a low spatial resolution assumed to limit the time consuming, especially in the case of flow simulation in urban areas where the motion resistances depend on the complex interaction of the flow with the structure (Di Baldassarre & Montanari, 2009; Bales & Wagner, 2009; Di Baldassarre et al., 2010; Grimaldi et al., 2013; Domeneghetti et al., 2013; Dottori et al., 2013; Jung and Merwade, 2015, Ferrari et al. 2019). Very accurate hydraulic simulations require the use of computational cell sizes of the same order of accuracy of the Digital Terrain Model (DTM). If the latter has very high spatial resolution, e.g. LiDAR, simulations are extremely time consuming.