JHEP01(2012)010
Published for SISSA by SpringerReceived: October 14, 2011 Accepted: December 9, 2011 Published: January 3, 2012
Jet production rates in association with W and Z
bosons in pp collisions at
√
s = 7 TeV
The CMS collaboration
E-mail: [email protected]
Abstract: Measurements of jet production rates in association with W and Z bosons for jet transverse momenta above 30 GeV are reported, using a sample of proton-proton collision events recorded by CMS at√s = 7 TeV, corresponding to an integrated luminosity of 36 pb−1. The study includes the measurement of the normalized inclusive rates of jets σ(V+ ≥ n jets)/σ(V), where V represents either a W or a Z. In addition, the ratio of W to Z cross sections and the W charge asymmetry as a function of the number of associated jets are measured. A test of scaling at √s = 7 TeV is also presented. The measurements provide a stringent test of perturbative-QCD calculations and are sensitive to the possible presence of new physics. The results are in agreement with the predictions of a simulation that uses explicit matrix element calculations for final states with jets.
JHEP01(2012)010
Contents
1 Introduction 1
2 The CMS experiment 2
3 Data and simulation samples 3
4 Signal selection 3
5 Jet rates 5
6 Acceptance and efficiency 7
7 Signal extraction 11 8 Unfolding 12 9 Systematic uncertainties 13 10 Results 15 11 Summary 23 The CMS collaboration 29 1 Introduction
The study of jet production in association with a W or Z vector boson (denoted by ’V’ in this paper) provides a stringent test of perturbative QCD calculations. The presence of a vector boson provides a clear signature of the process and allows comparison of different scattering amplitudes with respect to inclusive multijet production, which is dominated by gluon scattering. In addition, a precise measurement of the W (Z) + n jets cross sec-tion is essential since the producsec-tion of vector bosons with jets constitutes a background in searches for new physics and for studies of the top quark. At present, next-to-leading-order (NLO) predictions are available for V + n jets, with n up to four [1–4].
The W+ to W− cross-section ratio for an associated jet multiplicity is also predicted
by the theory [5] and larger than unity at a pp collider. Deviations of this ratio from the expected value may point to new processes that produce W bosons in the final state.
The CDF, D0 and ATLAS Collaborations have reported measurements of W (Z) + n jets production in [6–10].
JHEP01(2012)010
This paper presents results obtained with the 2010 data sample of the Compact Muon Solenoid (CMS) experiment at the Large Hadron Collider (LHC), based on an integrated luminosity of 35.9 ± 1.4 pb−1 [11], collected in proton-proton collisions at 7 TeV. To re-duce systematic uncertainties associated with the integrated luminosity measurement, the jet energy scale (JES), the lepton reconstruction, and the trigger efficiencies, we measure the V + n jets cross sections relative to the inclusive W and Z cross sections, σ(V+ ≥ n jets)/σ(V), and to the (n-1) jets cross sections, σ(V+ ≥ n jets)/σ(V+ ≥ (n − 1) jets). A clear advantage of using ratios of cross sections is also that theoretical uncertainties tend to cancel, improving the robustness of the results. We also measure the ratio of the W to Z cross sections and the W charge asymmetry as a function of the associated jet multiplic-ity. Finally, we test the scaling hypothesis [12–14]. Recent works show the scaling is left untouched by fixed order QCD corrections [1,2] and suggest to use it to estimate jet veto probability for weak boson fusion [15]. To compare the measurements with the predictions of the theoretical calculations, the results are presented at “particle level”, unfolding the detector efficiency and resolution.
2 The CMS experiment
The central feature of the CMS apparatus is a superconducting solenoid of 6 m internal diameter, providing an axial magnetic field of 3.8 T. Within the field volume are a silicon pixel and strip tracker, an electromagnetic calorimeter (ECAL), and a brass/scintillator hadron calorimeter (HCAL). Muons are detected in gas-ionization detectors embedded in the steel return yoke.
A right-handed coordinate system is used in CMS, with the origin at the nominal interaction point, the x-axis pointing to the centre of the LHC ring, the y-axis pointing up (perpendicular to the LHC plane), and the z-axis along the anticlockwise-beam direc-tion. The polar angle θ is measured from the positive z-axis and the azimuthal angle φ is measured from the positive x-axis in the x-y plane. The pseudorapidity is defined as η = − ln[tan(θ/2)].
The inner tracker contains 1440 silicon pixel and 15148 silicon strip detector mod-ules. It measures charged particle trajectories in the pseudorapidity range |η| ≤ 2.5. The ECAL consists of nearly 76000 lead tungstate crystals that provide coverage for |η| ≤ 1.479 in a cylindrical barrel region (EB) and 1.479 ≤ |η| ≤ 3.0 in the two endcap regions (EE). Preshower detectors, each consisting of two planes of silicon sensors interleaved with a total of 3 radiation length of lead, are located in front of both EEs. The HCAL is a sampling de-vice with brass as the passive material and scintillator as the active material. The combined calorimeter cells are grouped in projective towers of granularity ∆η ×∆φ = 0.087×0.087 at central rapidities and ∆η × ∆φ ≈ 0.17 × 0.17 at forward rapidities. Muons are detected in the pseudorapidity range |η| ≤ 2.4, with detection planes based on three technologies: drift tubes, cathode strip chambers, and resistive plate chambers. In addition to the barrel and endcap detectors, CMS has extensive forward calorimetry. The first level (L1) of the trigger system, composed of custom hardware processors, is designed to select event candidates in less than 3.2 µs using information from the calorimeters and muon detectors. The high
JHEP01(2012)010
level trigger (HLT) processor farm further reduces the event rate to a few hundred hertz, before data storage. A more detailed description of CMS can be found elsewhere [16].
3 Data and simulation samples
The L1 trigger system selected electrons with an energy deposit in the ECAL of at least 5 GeV or 8 GeV, depending on the luminosity conditions, and muons with a transverse mo-mentum exceeding 7 GeV. The events were then filtered by the HLT with algorithms that evolved in response to the rapid rise of the LHC luminosity during 2010. The pTthreshold
of the electrons and muons was adjusted periodically, to cope with the increasing instanta-neous luminosity. The largest sample of electrons was collected with an online requirement pT ≥ 17 GeV. For muons, most data were collected with a threshold of pT ≥ 15 GeV.
Simulated Monte Carlo (MC) samples are used for data/simulation comparison and to unfold the jet multiplicity distributions. Backgrounds are estimated from data, as ex-plained below.
Samples of simulated events with a W or a Z boson are generated with the Mad-Graph 4.4.13 [17] event generator, interfaced to the pythia 6.422 [18] program for parton shower simulation. The set of parton distribution functions used is CTEQ6L1 [19]. The MadGraph generator produces parton-level events with a vector boson and up to four partons on the basis of a matrix-element calculation. This sample serves as the baseline for comparisons with data. Additional samples of W and Z events are generated with pythia. For jet multiplicities greater than one, MadGraph is expected to be more accurate since it uses the exact matrix-element calculation, while in pythia only the hardest emission reproduces the exact matrix-element calculation. Top-pair (t¯t) and single-top production processes are generated with MadGraph. Processes of multijet, γ+jets, b-hadron and c-hadron decays to final states with electrons and muons are generated with pythia.
The full list of simulated samples is given in table 1. In order to compare with the data distributions, the simulation samples are normalized to the cross sections times the integrated luminosity, using or NLO or next-to-next-to-leading-order (NNLO) cross sec-tions [20–22], or the leading-order (LO) cross sections from the MC generator, as reported in the table.
Generated events are processed through a full detector simulation program based on GEANT4 [23,24], followed by a detailed emulation of the trigger and event reconstruction. Minimum-bias events are superimposed on the generated events to reproduce the distribu-tion of multiple proton-proton collisions in the same bunch crossing (pileup) observed in 2010. A signal sample without pileup is used for purpose of comparison. The PYTHIA parameters for the underlying event are set to the Z2 tune [25], which is a modification of the Z1 tune described in ref. [26]. Comparisons are also made to the D6T tune [27].
4 Signal selection
Signal selection begins with the identification of a charged lepton, either an electron or a muon, with pT > 20 GeV. This lepton, which will be called the “leading lepton”, must
JHEP01(2012)010
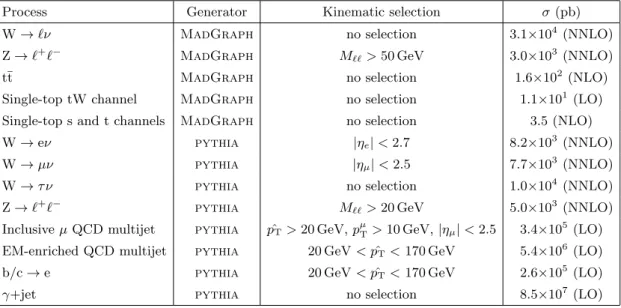
Process Generator Kinematic selection σ (pb)
W → `ν MadGraph no selection 3.1×10⁴ (NNLO)
Z → `+`− MadGraph M``> 50 GeV 3.0×10³ (NNLO)
t¯t MadGraph no selection 1.6×10² (NLO)
Single-top tW channel MadGraph no selection 1.1×101 (LO)
Single-top s and t channels MadGraph no selection 3.5 (NLO)
W → eν pythia |ηe| < 2.7 8.2×10³ (NNLO)
W → µν pythia |ηµ| < 2.5 7.7×10³ (NNLO)
W → τ ν pythia no selection 1.0×10⁴ (NNLO)
Z → `+`− pythia M``> 20 GeV 5.0×10³ (NNLO)
Inclusive µ QCD multijet pythia pˆT> 20 GeV, pµT> 10 GeV, |ηµ| < 2.5 3.4×10⁵ (LO) EM-enriched QCD multijet pythia 20 GeV < ˆpT< 170 GeV 5.4×10⁶ (LO)
b/c → e pythia 20 GeV < ˆpT< 170 GeV 2.6×10⁵ (LO)
γ+jet pythia no selection 8.5×10⁷ (LO)
Table 1. Summary of simulated samples for the various signal and background processes used in this analysis. The requirements applied to leptons pT and η, dilepton invariant mass (M``), and transverse momentum of the hard interaction ( ˆpT), are shown, and the corresponding cross section is given.
For electron candidates, we require that the ECAL cluster lies in the fiducial region |η| < 2.5, with the exclusion of the region 1.44 < |η| < 1.57. This exclusion allows us to reject electrons close to the barrel/endcap transition and electrons in the first endcap trigger tower, which lies in the shadow of cables and services. A series of quality requirements, following the standard established by the measurement of the inclusive W and Z cross sections [28], are then applied to the electron, as briefly described below.
For each electron candidate, a supercluster in ECAL is defined in order to correct for the potential underestimation of the energy due to bremsstrahlung. Thus the electron cluster is combined with the group of single clusters attributed to bremsstrahlung photons generated in the material of the tracker. Electrons are first selected based on the spatial matching between the ECAL supercluster and the silicon detector track in the η and φ coordinates, on the supercluster energy distribution in the η direction, and on the energy leakage into the HCAL detector. To reduce the contamination from converted photons, a minimal track transverse impact parameter significance is required. Electrons are rejected if no associated track hits are found in the first tracker layers or if a conversion partner candidate is found.
To reduce further the contamination from misidentified electrons and hadronic de-cays, we select electrons isolated from hadronic activity. This selection is based on max-imum values allowed for three isolation variables. The variables are computed relative to the electron ET and consist of the sums of track pT in the tracker, energy deposits in
ECAL, and energy deposits in HCAL, respectively. The sums are computed inside the cone ∆R =p(∆η)2+ (∆φ)2< 0.3, where ∆η and ∆φ are the differences in the pseudorapidity
and azimuthal angle between the electron and the track or energy deposit, with an inner exclusion region that removes the electron contribution.
JHEP01(2012)010
For the leading electron, the values of the different quality requirements are chosen such that they correspond to a lepton efficiency of about 80%, as evaluated with the MadGraph +pythia simulated sample described in section6.
After identifying the leading electron, we search for a second electron candidate called the “second leading electron”, within the ECAL fiducial volume and with pT > 10 GeV.
The quality requirements for the second leading electron are tuned to provide an electron efficiency of about 95%, as evaluated with the MadGraph +pythia simulated sample. If such a second leading electron is found, and its invariant mass with the first leading elec-tron M`` lies between 60 GeV and 120 GeV, the event is assigned to the Z + jets sample.
If such a second leading electron is not found, the event is assigned to the W + jets sample, thereby ensuring that there is no overlap between the two samples. Events including a muon with pT > 15 GeV and |η| < 2.4 are rejected from the W + jets electron sample to
reduce t¯t contamination.
The muon reconstruction and identification are identical to that used for the mea-surement of the W and Z cross sections [28]. A relative isolation variable, I =P(ptrack
T +
ETHCAL+ ETECAL)/pµTis defined, which includes the pTfor tracks, ECAL, and HCAL towers
in a cone ∆R < 0.3 around the muon direction. The muon and its energy deposits are excluded from the sum. A muon is considered to be isolated if I < 0.15. The V + jets muon event selection starts by requiring the presence of an isolated muon in the region |η| < 2.1 with pT > 20 GeV. It must be a high-quality muon as described in [28] with an impact
parameter in the transverse plane |dxy| < 2 mm, to suppress cosmic-ray background. As
for the electron channel, we then search for a second leading muon with pT > 10 GeV and
|η| < 2.4, such that the dimuon invariant mass lies between 60 GeV to 120 GeV. If such a second leading muon is (is not) found, the event is assigned to the Z+jets (W+jets) sample. An electron veto is not applied in the selection of W decays into muons as it would signifi-cantly lower the efficiency and increase the systematic uncertainty, because of fake electrons. For the W + jets samples in both decay modes, we compute the missing transverse energy /ET using a particle-flow (PF) algorithm [29] that reconstructs individually each
particle in the event based on information from all relevant subdetectors. We then use it to calculate the transverse mass, MT =
p
2pTE/T(1 − cos ∆φ), where ∆φ is the angle in
the x-y plane between the directions of the lepton pT and the /ET, and select events with
MT > 20 GeV.
For the charge asymmetry measurement, the charge assignment of the lepton is used to select W++ jets and W−+ jets candidates. For electrons, three algorithms are used to determine their charge [30]: the curvature of the electron track reconstructed by a Gaussian-sum-filter algorithm [31], the curvature of the silicon detector track associated with the electron, and the difference in φ between the track direction at the interaction vertex and the supercluster measured by the ECAL. In order to reduce uncertainties related to charge misassignment, we reject the event if the charge value differs amongst the three methods.
5 Jet rates
Jets are reconstructed from the particle collection created with the particle-flow algorithm and are formed with the anti-kT clustering algorithm [32] with a size parameter of R = 0.5.
JHEP01(2012)010
Jet energy corrections (JEC) are applied to account for the jet energy response as a function of η and ET [33].
We require the jet to have |η| < 2.4 to be in the tracker acceptance, and ET > 30 GeV.
Jets are required to satisfy identification criteria that eliminate jets originating from or seeded by noisy channels in the hadron calorimeter [34].
The pileup and the underlying event affect the jet counting by contributing additional energy to the measured jet energy and therefore “promoting” jets above the ET threshold
for jet counting. To minimize the uncertainty due to pileup and the underlying event, the ET threshold is set at 30 GeV. The average number of pileup events in the data sample is
2.7. Their effect is taken into account by evaluating event-by-event the energy not related to the hard-interaction activity [35,36]. This amount is subtracted from each jet [33]. Re-moving the average energy due to pileup does not remove the jets from pileup interactions. In a simulated sample, this additional contribution to the jet count, however, is found to be negligible for the chosen jet ET threshold.
Electrons can be reconstructed as jets or can overlap with a jet. Therefore, jets that fall within ∆R < 0.3 of an electron from W or Z decay are not included in the jet count. Muons can also overlap with a jet, thus, each selected muon is matched to one of the particles reconstructed by the PF algorithm and excluded from jet clustering.
One of the most important backgrounds in the W sample at high jet multiplicity comes from t¯t events. These contain two b-quark jets. We count the number of b-tagged jets,
nb-taggedjet , with a tagging algorithm that requires at least two tracks in the jet with a
sig-nificance on the transverse impact parameter greater than 3.3. The algorithm parameters chosen correspond to a working point with an efficiency of about 62% and a mistag rate of about 2.9%. The efficiency is measured from data using a sample of t¯t events with fully leptonic final states. The mistag rate is averaged over light jets in simulated W and top events, and corrected for measured differences between data and simulation [37]. The
nb-taggedjet value is then used in the fitting method to extract the number of signal events, as
described in section7.
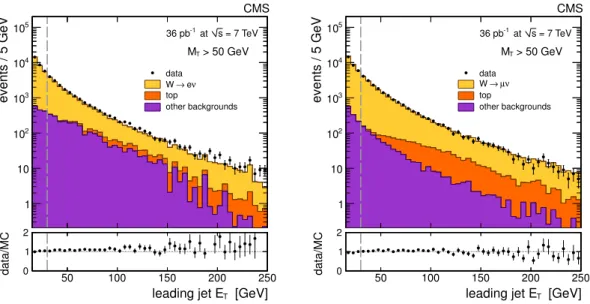
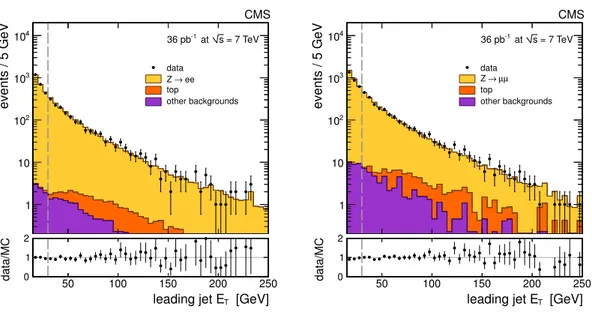
The observed transverse energy distributions of the leading jet in the W+ ≥ 1 jet and Z+ ≥ 1 jet samples are shown in figures 1 and 2, respectively. Figures 3 and 4 show the same distributions for the second-leading jet in the W + ≥ 2 jets and Z+ ≥ 2 jets samples. In addition to the selection described in section4, for the transverse energy distributions, W boson candidate are required to have MT > 50 GeV, thus reducing significantly the
QCD multijet contamination. The t¯t background is larger in the muon than in the electron channel because an electron veto is not applied, as explained in section4. The data are in good agreement with the MadGraph + pythia parton shower predictions normalized to the NNLO cross sections.
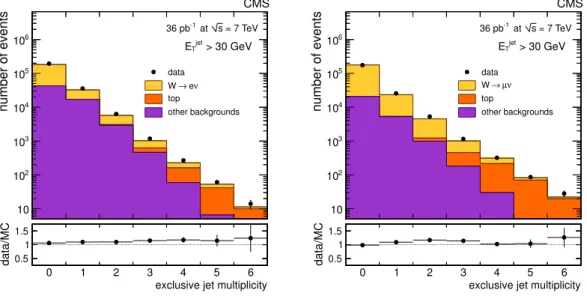
The selected events are assigned to bins of jet multiplicity by counting the number of jets with ET > 30 GeV. The number of events with a W (Z) candidate and at least
one jet are 43561 (1648) in the electron channel, and 32496 (2339) in the muon channel. The observed distributions of the exclusive numbers of reconstructed jets in the W and Z samples are shown in figures 5 and 6, respectively. The distributions from simulation are also shown. They are normalized to the integrated luminosity using the cross-section
JHEP01(2012)010
events / 5 GeV 1 10 2 10 3 10 4 10 5 10 data ν e → W top other backgrounds CMS = 7 TeV s at -1 36 pb > 50 GeV T M [GeV] T leading jet E 50 100 150 200 250 data/MC 0 1 2 events / 5 GeV 1 10 2 10 3 10 4 10 5 10 data ν µ → W top other backgrounds CMS = 7 TeV s at -1 36 pb > 50 GeV T M [GeV] T leading jet E 50 100 150 200 250 data/MC 0 1 2Figure 1. Distributions of the ET for the leading jet in the W + ≥ 1 jet sample for the electron channel (left) and for the muon channel (right), before the requirement of ET> 30 GeV (shown by the vertical dotted line) is imposed for counting jets. Points with error bars are data, histograms represent simulation of the signal (yellow), t¯t and single top backgrounds (orange) and other back-grounds (purple). The last includes multijet events, Z events, and events in which the W decays to a channel other than the signal channel. Error bars represent the statistical uncertainty on the data. The ratio between the data and the simulation is shown in the lower plots.
values in table 1. Comparisons between the data and simulation distributions show that there is a very good agreement, even prior to any attempt to fit the signal and background content of the data. For the W sample, QCD multijet processes constitute the most signif-icant source of background in the lower jet-multiplicity bins, while top quark production dominate in the higher jet-multiplicity bins. For Z events with one or more jets, the top quark production dominates the background, which overall is very small.
6 Acceptance and efficiency
In order to provide model-independent results, we do not correct for the detector accep-tance, but rather quote the results within the accepaccep-tance, as defined by the lepton and jet fiducial and kinematic selections given above.
The efficiencies for lepton reconstruction, identification, isolation, and trigger are ob-tained from Z + jets data samples. The sample for the measurement of a given efficiency contains events selected with two lepton candidates. One lepton candidate, called the “tag”, satisfies all selection requirements, including the matching to a trigger object. The other lepton candidate, called the “probe”, is selected with criteria that depend on the ef-ficiency being measured. The invariant mass of the tag and probe lepton candidates must fall in the range [60–120] GeV. The signal yields are obtained for two exclusive subsam-ples of events in which the probe lepton passes or fails the selection criteria considered. Fits are performed to the invariant-mass distributions of the “pass” and “fail” subsamples,
JHEP01(2012)010
events / 5 GeV 1 10 2 10 3 10 4 10 data ee → Z top other backgrounds CMS = 7 TeV s at -1 36 pb [GeV] T leading jet E 50 100 150 200 250 data/MC 0 1 2 events / 5 GeV 1 10 2 10 3 10 4 10 data µ µ → Z top other backgrounds CMS = 7 TeV s at -1 36 pb [GeV] T leading jet E 50 100 150 200 250 data/MC 0 1 2Figure 2. Distributions of the ET for the leading jet in the Z+ ≥ 1 jet sample for the electron channel (left) and for the muon channel (right), before the requirement of ET> 30 GeV (shown by the vertical dotted line) is imposed for counting jets. Points with error bars are data, histograms represent simulation of the signal (yellow), t¯t and single top backgrounds (orange) and other back-grounds (purple). The last includes multijet events, W events, and events in which the Z decays to a channel other than the signal channel. Error bars represent the statistical uncertainty on the data. The ratio between the data and the simulation is shown in the lower plots.
including a term that accounts for the background. The measured efficiency is deduced from the relative levels of signal in the “pass” and “fail” subsamples. An estimate of the systematic uncertainty on the efficiency is obtained by varying the shape used to fit the Z signal among several functional forms tested on the simulation. The lepton selection effi-ciency is the product of three components: the reconstruction effieffi-ciency, the identification and isolation efficiency, and the trigger efficiency. Each of these efficiencies is calculated as a function of the jet multiplicity in the event. The efficiency of additional selection requirements applied to W events is computed from the simulation.
For electrons we find that the efficiency is about 70% (60%) for the W + jets (Z + jets) signal events with variations of a few percent across different jet multiplicity bins, which are accounted for in the measurement. The uncertainty ranges from about 1% up to about 5%, increasing with the number of jets in the event. The additional requirement that the three methods to measure the electron charge agree, which is applied for the charge asymmetry measurement, has an efficiency of 97%. In the electron channel, the results are corrected for the electron reconstruction and selection efficiency after the signal extraction.
For muons, the efficiencies are measured as a function of pT, η and the jet multiplicity.
The efficiency dependence on pT and η is measured in events with zero and one jet. For
events with more than one jet, where the sample size is insufficient for a (pT, η) dependent
JHEP01(2012)010
events / 5 GeV 1 10 2 10 3 10 4 10 5 10 data ν e → W top other backgrounds CMS = 7 TeV s at -1 36 pb > 50 GeV T M [GeV] T second jet E 50 100 150 200 data/MC 0 1 2 events / 5 GeV 1 10 2 10 3 10 4 10 5 10 data ν µ → W top other backgrounds CMS = 7 TeV s at -1 36 pb > 50 GeV T M [GeV] T second jet E 50 100 150 200 data/MC 0 1 2Figure 3. Distributions of the ET for the second leading jet in the W+ ≥ 2 jets sample for the electron channel (left) and for the muon channel (right), before the requirement of ET> 30 GeV (shown by the vertical dotted line) is imposed for counting jets. Points with error bars are data, histograms represent simulation of the signal (yellow), t¯t and single top backgrounds (orange) and other backgrounds (purple). The last includes multijet events, Z events, and events in which the W decays to a channel other than the signal channel. Error bars represent the statistical uncertainty on the data. The ratio between the data and the simulation is shown in the lower plots.
measured in the n = 1 bin is assumed. The isolation efficiency is found to have the largest dependence on multiplicity, while the trigger, reconstruction, and identification efficiencies are consistent with being constant. The average efficiency is 85% and 86% for W and Z events, respectively. They are similar because the efficiency for selecting the second muon from Z candidates and for passing the MT criteria with W candidates are both near unity.
While the second muon efficiency in Z events is fairly flat across different jet multiplicity bins, the efficiency of the MT requirement for W candidates decreases to 90% for high jet
multiplicity. The uncertainty on the muon efficiency ranges from about 3% up to about 15%, increasing with the number of jets in the event. In the muon channel, results are corrected for muon reconstruction and selection efficiency by weighting the selected events by the inverse of the efficiency before the signal extraction.
Electron charge misidentification is estimated with simulated samples and data. It depends on the lepton η, with the largest misidentification in the endcap regions. The probability ranges from 4 × 10⁻⁴ up to 3 × 10⁻³ in the simulation, and from 1 × 10⁻³ up to 4 × 10⁻³ in the data. The difference between simulation and data is taken as uncertainty. The muon charge misidentification has been found to be smaller than 10−4 in cosmic-ray data [38], therefore yielding a negligible systematic uncertainty. Using the tag-and-probe method, the ratio of the selection efficiency for electrons to positrons is measured to equal unity within the statistical precision of 1.4% [30]. The efficiency ratio between µ+and µ−is found equal to one within 2% [30]. Effects related to charge measurements are propagated as systematic uncertainties to the final W charge asymmetry results.
JHEP01(2012)010
events / 5 GeV 1 10 2 10 3 10 4 10 data ee → Z top other backgrounds CMS = 7 TeV s at -1 36 pb [GeV] T second jet E 50 100 150 200 data/MC 0 1 2 events / 5 GeV 1 10 2 10 3 10 4 10 data µ µ → Z top other backgrounds CMS = 7 TeV s at -1 36 pb [GeV] T second jet E 50 100 150 200 data/MC 0 1 2Figure 4. Distributions of the ET for the second leading jet in the Z+ ≥ 2 jets sample for the electron channel (left) and for the muon channel (right), before the requirement of ET> 30 GeV (shown by the vertical dotted line) is imposed for counting jets. Points with error bars are data, histograms represent simulation of the signal (yellow), t¯t and single top backgrounds (orange) and other backgrounds (purple). The last includes multijet events, W events, and events in which the Z decays to a channel other than the signal channel. Error bars represent the statistical uncertainty on the data. The ratio between the data and the simulation is shown in the lower plots.
number of events 10 2 10 3 10 4 10 5 10 6 10 data ν e → W top other backgrounds CMS = 7 TeV s at -1 36 pb > 30 GeV jet T E
exclusive jet multiplicity
0 1 2 3 4 5 6 data/MC0.5 1 1.5 number of events 10 2 10 3 10 4 10 5 10 6 10 data ν µ → W top other backgrounds CMS = 7 TeV s at -1 36 pb > 30 GeV jet T E
exclusive jet multiplicity
0 1 2 3 4 5 6
data/MC0.5 1 1.5
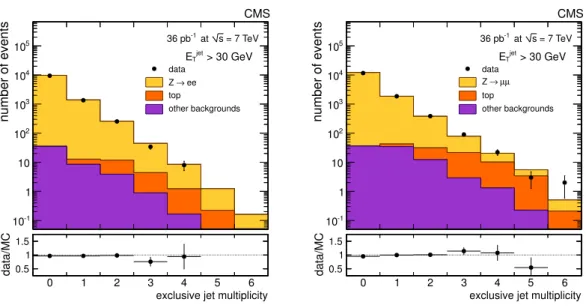
Figure 5. Exclusive number of reconstructed jets in events with W → eν (left) and W → µν (right). Points with error bars are data, histograms represent simulation of the signal (yellow), t¯t and single top backgrounds (orange) and other backgrounds (purple). Error bars represent the statistical uncertainty on the data. These distributions have not been corrected for detector effects or selection efficiency. The ratio between the data and the simulation is shown in the lower plots.
JHEP01(2012)010
number of events -1 10 1 10 2 10 3 10 4 10 5 10 data ee → Z top other backgrounds CMS = 7 TeV s at -1 36 pb > 30 GeV jet T Eexclusive jet multiplicity
0 1 2 3 4 5 6 data/MC0.5 1 1.5 number of events -1 10 1 10 2 10 3 10 4 10 5 10 data µ µ → Z top other backgrounds CMS = 7 TeV s at -1 36 pb > 30 GeV jet T E
exclusive jet multiplicity
0 1 2 3 4 5 6
data/MC0.5 1 1.5
Figure 6. Exclusive number of reconstructed jets in events with Z → e+e− (left) and Z → µ+µ− (right). Points with error bars are data, histograms represent simulation of the signal (yellow), t¯t and single top backgrounds (orange) and other backgrounds (purple). Error bars represent the statistical uncertainty on the data. These distributions have not been corrected for detector effects or selection efficiency. The ratio between the data and the simulation is shown in the lower plots.
7 Signal extraction
The signal yield is estimated using an extended maximum-likelihood fit to the dilepton invariant mass (M``) distribution for the Z + jets sample, and to the transverse mass (MT)
distribution for the W + jets sample; the number of observed events is included in the likelihood fit as a constraint on the normalization. The probability distribution functions are asymmetric Gaussians with tails. Their parameters are derived from the simulation or, for the background, from control data samples with inverted identification (isolation) requirement on the electrons (muons).
For the Z event sample, the contamination from the background processes, dominated by t¯t and W + jets, is small and does not produce a peak in the M`` distributions, so the
M`` distribution is taken to be the sum of two components, one for the signal and one that
accounts for all background processes.
For the W sample, the background contributions can be divided into two components, one which exhibits a peaking structure in MT, dominated by t¯t, and another which does not,
dominated by QCD multijet events. We perform a two-dimensional fit to the MT
distribu-tion and the number of b-tagged jets, nb-taggedjet . The MT distribution allows the statistical
separation of the signal from the non-peaking backgrounds, while nb-taggedjet distinguishes the signal and the background from t¯t. The likelihood function is built under the assumption that there are no b jets in the signal events. This implies that a fraction of W events pro-duced in association with heavy-flavour jets, i.e. the fraction with at least one heavy-flavour jet in the acceptance, is counted as background. Considering the statistical precision of the measurement, this assumption has a negligible effect on the W + jets cross-section result.
JHEP01(2012)010
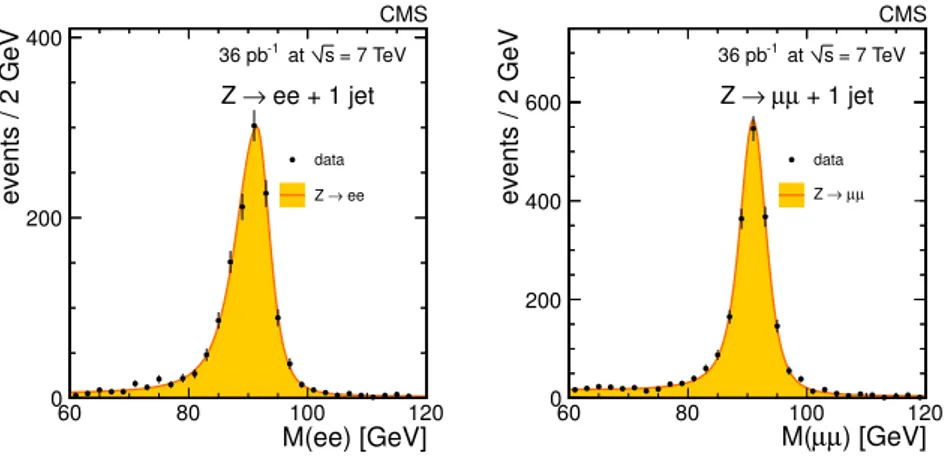
M(ee) [GeV] 60 80 100 120 events / 2 GeV 0 200 400 data ee → Z CMS = 7 TeV s at -1 36 pb ee + 1 jet → Z ) [GeV] µ µ M( 60 80 100 120 events / 2 GeV 0 200 400 600 data µ µ → Z CMS = 7 TeV s at -1 36 pb + 1 jet µ µ → ZFigure 7. Dilepton mass for the Z + 1 jet samples, in the electron channel (left) and the muon channel (right). Points with error bars are data. In the muon channel the data are corrected for muon reconstruction and selection efficiency by weighting the selected events by the inverse of the efficiency. The fit result for the signal is shown by the yellow-filled area. The background is too small to be visible in the figure.
The fits are done using the jet multiplicity bins for n ≤ 3; in contrast, the jet counting is done inclusively for the last bin of jet multiplicity, i.e. n ≥ 4. Examples of fits for Z+1 jet are shown in figure 7. Figures 8 and 9 show fits in MT and nb-taggedjet projections for the
W + n jets (n=1 and n=3) channel. The presence of the top quark background is evident from comparing the n = 1 and n = 3 multiplicity bins. The fit is repeated separately on the W++ jets and W−+ jets samples for the charge-asymmetry measurement.
In the electron channel, the observed exclusive V+jets yields determined from the fit are corrected a posteriori for electron efficiencies, which are discussed in section6. In the muon channel, efficiencies are available in bins of the lepton pT, η and the jet multiplicity. This
allows an efficiency-weighted fit to be performed, which returns efficiency-corrected yields.
8 Unfolding
In order to estimate the scaling behaviour of the jets at the particle-jet level, we apply an unfolding procedure that removes the effects of jet energy resolution and reconstruction efficiency. The migration matrix, which relates a number n0of produced jets at the particle level to an observed number n of reconstructed jets, is derived from simulated samples of Z + jets and W + jets. The unfolding procedure takes into account the statistical and systematic uncertainties in the signal yields.
The migration matrices are derived from simulated events with leptons and jets within the pT and η acceptance of the analysis. The simulation is performed using for the central
value the MadGraph generator with the Z2 tune and incorporates event pileup. The possi-ble bias due to the generator choice is estimated using D6T instead of Z2 tune, and pythia instead of MadGraph. The observed difference is quoted as systematic uncertainty, as explained in the next section.
JHEP01(2012)010
[GeV] T M 50 100 150 events / 2.5 GeV 0 0.5 1 1.5 2 2.5 3 10 × data ν e → W non-top top CMS = 7 TeV s at -1 36 pb + 1 jet ν e → W b-tagged jet n 0 1 ≥ 2 events / bin 0 10 20 30 40 3 10 × data ν e → W non-top top CMS = 7 TeV s at -1 36 pb + 1 jet ν e → W [GeV] T M 50 100 150 events / 5 GeV 0 20 40 60 80 100 120 data ν e → W non-top top CMS = 7 TeV s at -1 36 pb + 3 jets ν e → W b-tagged jet n 0 1 ≥ 2 events / bin 0 0.5 1 1.5 3 10 × data ν e → W non-top top CMS = 7 TeV s at -1 36 pb + 3 jets ν e → WFigure 8. Fit results for the W(eν) + n jets sample with n = 1 (upper row) and n = 3 (lower row). For each row, the MT projection is shown on the left, while the nb-taggedjet projection is shown on the right. Points with error bars are data. Fit results are shown by the colour-filled areas for the signal process (yellow), non-top backgrounds (purple), and top backgrounds (orange).
Two unfolding methods are employed. The baseline method is the “singular value decomposition” (SVD) algorithm [39]. As a crosscheck, the iterative method [40] is also applied. Both algorithms require a regularization parameter to prevent the statistical fluc-tuations in the data from appearing as structure in the unfolded distribution. For the SVD method, the regularization parameter is chosen to be kSVD = 5, corresponding to the
num-ber of bins. This algorithm corresponds to an inversion of the migration matrix, and gives the most accurate uncertainty estimate. For the iterative algorithm, the regularization parameter kBayes= 4 is used, as suggested in ref. [41].
9 Systematic uncertainties
One of the dominant sources of systematic uncertainties in the V+jets measurements is the determination of the jet energy, which affects the jet counting. We consider three sources
JHEP01(2012)010
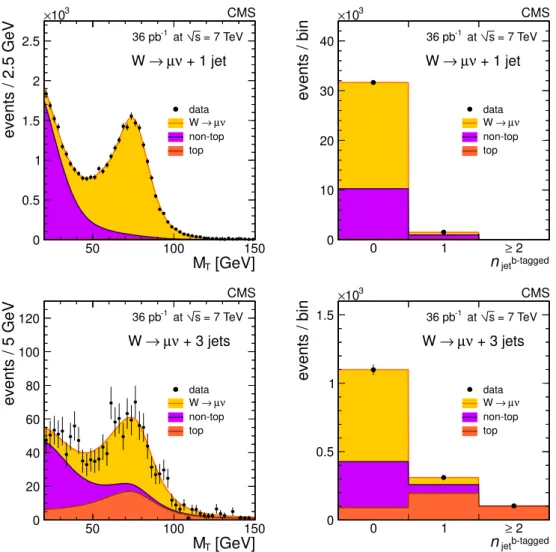
[GeV] T M 50 100 150 events / 2.5 GeV 0 0.5 1 1.5 2 2.5 3 10 × data ν µ → W non-top top CMS = 7 TeV s at -1 36 pb + 1 jet ν µ → W b-tagged jet n 0 1 ≥ 2 events / bin 0 10 20 30 40 3 10 × data ν µ → W non-top top CMS = 7 TeV s at -1 36 pb + 1 jet ν µ → W [GeV] T M 50 100 150 events / 5 GeV 0 20 40 60 80 100 120 data ν µ → W non-top top CMS = 7 TeV s at -1 36 pb + 3 jets ν µ → W b-tagged jet n 0 1 ≥ 2 events / bin 0 0.5 1 1.5 3 10 × data ν µ → W non-top top CMS = 7 TeV s at -1 36 pb + 3 jets ν µ → WFigure 9. Fit results for the W(µν) + n jets sample with n = 1 (upper row) and n = 3 (lower row). For each row, the MTprojection is shown on the left, while the nb-taggedjet projection is shown on the right. Points with error bars are data. The data are corrected for muon reconstruction and selection efficiency by weighting the selected events by the inverse of the efficiency. Fit results are shown by the colour-filled areas for the signal process (yellow), non-top backgrounds (purple), and top backgrounds (orange).
of uncertainty related to the jet energy scale:
• Corrections applied to the measured jet energy to account for the detector response and inhomogeneities. The corrections are derived from measured jet pT in dijet and
photon+jet events and are available as a function of η and pT [33].
• The dependence of the detector response on the jet flavour. The difference between the flavour composition of jets in V+jets events and the flavour composition of the jet sample used to extract the corrections is accounted for by an additional 2% un-certainty on the jet energy.
JHEP01(2012)010
due to the underlying event. We find that the jet energy is systematically decreased by 500 MeV in comparison with events without pileup. This amount is included as a systematic uncertainty on the jet energy.
The above uncertainties on the jet energy are added in quadrature and their effect is evaluated on the jet multiplicity distribution using simulation. Similar results are found in all the channels, for both W and Z events. For W events, the effect of the mismeasured jet energy on MT is evaluated in the fitting procedure.
Uncertainty on the jet energy resolution also affects the jet multiplicity. The resolution is underestimated in the simulation by (10 ± 10)% [42]. The effect of this uncertainty on the jet multiplicity has been studied in simulated W+jets events and found to be below 2%. The pileup subtraction method was tested by comparing the jet multiplicity in two simulated signal samples, one with pileup and one without, with the pileup subtraction applied in the former case. The difference, due to residual effects and jets in pileup events, is below 5%.
All the above uncertainties are added in quadrature and the resultant contribution to the relative systematic uncertainty on jet rates is shown in tables 2 and 3. Also shown in these tables are the uncertainties associated with the selection efficiency and the signal extraction procedure. The largest source of uncertainty related to signal extraction in W events comes from the uncertainty of the b-tagging efficiency and mistag rates. This uncer-tainty is estimated with a control sample of t¯t events decaying into e±µ∓and a pair of b jets. The uncertainty due to the selection efficiency in tables2and3includes the uncertainty on the lepton efficiency and on the selection procedure. As discussed in section 6, it is evalu-ated with Z+jets data samples, with different strategies for the electron and muon channels. This difference results in a larger systematic uncertainty on the muon channel. While the systematic uncertainty on the energy scale is correlated among the different jet multiplic-ities, all other uncertainties are not. The relative statistical uncertainty is also shown.
All statistical and systematic uncertainties are propagated in the unfolding proce-dure. Uncertainties due to the unfolding procedure itself are calculated as the differences between the unfolded rates using the SVD and the iterative algorithms, and the Mad-Graph, pythia, and Z2 or D6T tunes of MadGraph for the unfolding matrix. The resulting uncertainties are shown with the final results in the next section.
10 Results
Results are given for the leptons within the acceptance defined by the kinematical selec-tion cuts in the electron (muon) channels: leading-lepton pT > 20 GeV and |η| < 2.5
(2.1); second-lepton pT > 10 GeV and |η| < 2.5 (2.4). In addition, electrons in the
1.44 < |η| < 1.57 region are excluded, and jets are not counted if ∆R < 0.3 with re-spect to an electron from the W or the Z. Since the acceptance is different, we do not combine the results for the electron and muon channels.
Two sets of ratios from the unfolded jet multiplicity distributions are calculated. The first set of ratios is σ(V+ ≥ n jets)/σ(V), where σ(V) is the inclusive cross section, and
JHEP01(2012)010
Uncertainties on jet rate in W → eν events [%]
Jet multiplicity 0 1 2 3 ≥ 4
Energy scale and pileup ±5 ±8 +11−10 +14−12 +16−15
Selection efficiency ±0.5 ±0.3 ±1.0 ±1.7 ±4
Signal extraction ±0.1 ±0.4 ±3 ±9
Total systematic uncertainty ±5 ±8 +11−10 +14−12 ±17 Statistical uncertainty ±0.3 ±1.0 ±2.4 ±10 ±28
Uncertainties on jet rate in W → µν events [%]
Jet multiplicity 0 1 2 3 ≥ 4
Energy scale and pileup ±5 ±8 +11−10 +14−12 +16−15
Selection efficiency ±3 ±6 ±4 ±10 ±17
Signal extraction ±0.1 ±0.4 ±3 ±9
Total systematic uncertainty ±6 ±10 +13−12 +19−17 ±26 Statistical uncertainty ±0.3 ±0.9 ±2.4 ±5.6 ±21
Table 2. Relative systematic and statistical uncertainties on the measured jet multiplicity in W events, as a function of the jet multiplicity for electron and muon samples.
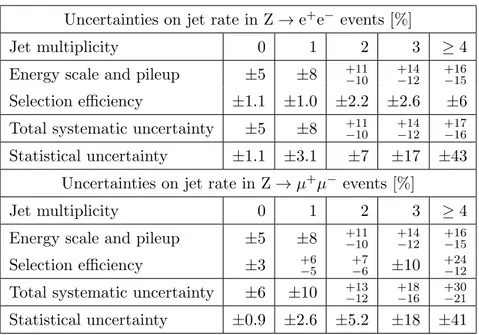
Uncertainties on jet rate in Z → e+e− events [%]
Jet multiplicity 0 1 2 3 ≥ 4
Energy scale and pileup ±5 ±8 +11−10 +14−12 +16−15
Selection efficiency ±1.1 ±1.0 ±2.2 ±2.6 ±6
Total systematic uncertainty ±5 ±8 +11−10 +14−12 +17−16
Statistical uncertainty ±1.1 ±3.1 ±7 ±17 ±43
Uncertainties on jet rate in Z → µ+µ− events [%]
Jet multiplicity 0 1 2 3 ≥ 4
Energy scale and pileup ±5 ±8 +11−10 +14−12 +16−15 Selection efficiency ±3 +6−5 +7−6 ±10 +24−12 Total systematic uncertainty ±6 ±10 +13
−12 +18−16 +30−21
Statistical uncertainty ±0.9 ±2.6 ±5.2 ±18 ±41
Table 3. Relative systematic and statistical uncertainties on the measured jet multiplicity rates in Z events, as a function of the jet multiplicity for electron and muon samples. The signal extraction uncertainty is not shown since it is negligible for Z events.
is presented in tables 4 and 5 and in the upper frames of figures 10–13. The second set of ratios is σ(V+ ≥ n jets)/σ(V+ ≥ (n − 1) jets), reported in tables 6 and 7 and in the
JHEP01(2012)010
(W) σ n-jets) ≥ (W + σ -3 10 -2 10 -1 10 data energy scale unfolding MadGraph Z2 MadGraph D6T Pythia Z2 CMS = 7 TeV s at -1 36 pb ν e → W > 30 GeV jet T Einclusive jet multiplicity, n
(n-1)-jets) ≥ (W + σ n-jets) ≥ (W + σ 0 0.1 0.2 1 2 3 4
Figure 10. The ratios σ(W+ ≥ n jets)/σ(W) (top) and σ(W+ ≥ n jets)/σ(W+ ≥ (n − 1) jets) (bottom) in the electron channel compared with the expectations from two MadGraph tunes and pythia. Points with error bars correspond to the data. The uncertainties due to the energy scale and unfolding procedure are shown as yellow and hatched bands, respectively. The error bars represent the total uncertainty.
lower frames of figures10–13. The contributions of the systematic uncertainties associated with the jet energy scale (including pileup effects) and the unfolding are given in the tables and shown as error bands in the figures. For n ≥ 2 jets, the pythia pure parton shower simulation fails to describe the data, while the MadGraph simulation agrees well with the experimental spectrum. Because of the jet threshold ET > 30 GeV, the sensitivity to the
tuning of the underlying event is negligible. The expectations from the simulation with the Z2 and the D6T tunes are identical. Thus, in the rest of the paper we will only consider the Z2 tune for comparison with the data.
The statistical uncertainty quoted in the third column of tables 4–7includes only the statistical contribution from the fit results. It is combined (fourth column) with the sys-tematic uncertainties from the fit and the statistical and syssys-tematic uncertainty on the efficiency, which are uncorrelated between the samples with different numbers of jets. To estimate the jet energy scale uncertainty, jet rates from the fits were scaled higher and lower according to this uncertainty. Those numbers were then unfolded and the difference in the output from the actual fit value is quoted in the fifth column. Finally, the uncertainty due to the unfolding algorithm is evaluated as explained above and is shown in the last column of the tables.
The ratios of W + jets and Z + jets cross sections are shown in figure 14. Many important systematic uncertainties, such as those on integrated luminosity and jet energy scale, cancel in the ratio. The most significant remaining systematic uncertainty is due to the selection efficiency, which could be correlated between different bins because of the MT
JHEP01(2012)010
n jets σ(W +≥n jets)σ(W ) stat. stat. + efficiency energy unfolding and signal extraction scale
electron channel ≥ 1 jets 0.133 0.002 0.002 +0.019−0.017 ±0.001 ≥ 2 jets 0.026 0.001 0.001 ±0.004 ±0.001 ≥ 3 jets 0.0032 0.0004 0.0004 +0.0006−0.0005 ±0.0001 ≥ 4 jets 0.00056 0.00017 0.00018 +0.00012−0.00010 +0.00006−0.00001 muon channel ≥ 1 jets 0.136 0.002 0.007 +0.019−0.017 ±0.001 ≥ 2 jets 0.026 0.001 0.002 ±0.004 +0.002−0.001 ≥ 3 jets 0.0041 0.0003 0.0005 +0.0008−0.0006 +0.0003−0.0001 ≥ 4 jets 0.00059 0.00011 0.00017 +0.00012−0.00010 +0.00001−0.00015
Table 4. Results for σ(W + ≥ n jets)/σ(W ) in the electron and muon channels. A full description of the uncertainties is given in the text.
n jets σ(Z+≥n jets)σ(Z) stat. stat. + efficiency energy unfolding and signal extraction scale
electron channel ≥ 1 jets 0.151 0.006 0.006 +0.021−0.019 ±0.001 ≥ 2 jets 0.028 0.003 0.003 ±0.004 ±0.001 ≥ 3 jets 0.0039 0.0009 0.0009 +0.0007−0.0006 +0.0003−0.0001 ≥ 4 jets 0.00070 0.00036 0.00036 +0.00014−0.00012 +0.00005−0.00004 muon channel ≥ 1 jets 0.149 0.005 0.011 +0.022−0.020 ±0.001 ≥ 2 jets 0.027 0.003 0.004 ±0.004 ±0.001 ≥ 3 jets 0.0042 0.0011 0.0012 +0.0008−0.0006 +0.0001−0.0003 ≥ 4 jets 0.00087 0.00050 0.00056 +0.00017−0.00015 +0.00010−0.00001
Table 5. Results for σ(Z+ ≥ n jets)/σ(Z) in the electron and muon channels. A full description of the uncertainties is given in the text.
cut in the W candidate selection. The maximal difference observed between the measured and expected values is at the level of one standard deviation, neglecting the uncertainties on the theoretical predictions. The difference between the expected value of the ratio in the electron and muon channels is due to the larger electron acceptance in η.
The charge asymmetry, defined as AW = σ(W
+)−σ(W−)
σ(W+)+σ(W−), is measured as a function of
JHEP01(2012)010
n jets σ(W +≥(n−1) jets)σ(W +≥n jets) stat. stat. + efficiency energy unfolding and signal extraction scale
electron channel ≥ 1 / ≥ 0 jets 0.133 0.002 0.002 +0.019−0.017 ±0.001 ≥ 2 / ≥ 1 jets 0.195 0.007 0.007 +0.002−0.001 +0.012−0.001 ≥ 3 / ≥ 2 jets 0.125 0.014 0.015 ±0.004 +0.002−0.004 ≥ 4 / ≥ 3 jets 0.173 0.046 0.049 +0.003−0.004 +0.017−0.003 muon channel ≥ 1 / ≥ 0 jets 0.136 0.002 0.007 +0.019−0.017 ±0.001 ≥ 2 / ≥ 1 jets 0.190 0.005 0.014 +0.004−0.003 +0.016−0.001 ≥ 3 / ≥ 2 jets 0.160 0.011 0.018 +0.004−0.003 +0.004−0.002 ≥ 4 / ≥ 3 jets 0.144 0.025 0.037 +0.002−0.003 +0.001−0.043 Table 6. Results for σ(W + ≥ n jets)/σ(W + ≥ (n − 1) jets) in the electron and muon channels. A full description of the uncertainties is given in the text.
n jets σ(Z+≥(n−1) jets)σ(Z+≥n jets) stat. stat. + efficiency energy unfolding and signal extraction scale
electron channel ≥ 1 / ≥ 0 jets 0.151 0.006 0.006 +0.021−0.019 ±0.001 ≥ 2 / ≥ 1 jets 0.185 0.017 0.017 +0.002−0.001 +0.006−0.001 ≥ 3 / ≥ 2 jets 0.138 0.030 0.030 ±0.004 +0.008−0.003 ≥ 4 / ≥ 3 jets 0.181 0.085 0.085 +0.003−0.004 +0.014−0.021 muon channel ≥ 1 / ≥ 0 jets 0.149 0.005 0.011 +0.022−0.020 ±0.001 ≥ 2 / ≥ 1 jets 0.180 0.016 0.023 ±0.003 +0.011−0.001 ≥ 3 / ≥ 2 jets 0.158 0.036 0.043 +0.002−0.001 +0.001−0.017 ≥ 4 / ≥ 3 jets 0.207 0.104 0.117 +0.002−0.003 +0.031−0.001 Table 7. Results for σ(Z+ ≥ n jets)/σ(Z+ ≥ (n − 1) jets) in the electron and muon channels. A full description of the uncertainties is given in the text.
the events with positive and negative lepton charge. The sample size does not allow a mea-surement in events with four jets or more. Table 8and figure15 show the measured value of the charge asymmetry for the electron and muon events. The systematic uncertainties include those from the jet energy scale, the charge misidentification, and the positive versus negative lepton efficiency difference. The results are compatible with the inclusive charge asymmetry measurement [30].
JHEP01(2012)010
(W) σ n-jets) ≥ (W + σ -3 10 -2 10 -1 10 data energy scale unfolding MadGraph Z2 MadGraph D6T Pythia Z2 CMS = 7 TeV s at -1 36 pb ν µ → W > 30 GeV jet T Einclusive jet multiplicity, n
(n-1)-jets) ≥ (W + σ n-jets) ≥ (W + σ 0 0.1 0.2 1 2 3 4
Figure 11. The ratio σ(W+ ≥ n jets)/σ(W) (top) and σ(W+ ≥ n jets)/σ(W+ ≥ (n − 1) jets) (bottom) in the muon channel compared with the expectations from two MadGraph tunes and pythia. Points with error bars correspond to the data. The uncertainties due to the energy scale and unfolding procedure are shown as yellow and hatched bands, respectively. The error bars represent the total uncertainty.
The charge asymmetry depends on the number of associated jets because the fraction of u (d) quarks contributing to the process is different in each case. The measured values are found to be in good agreement with the predictions based on MadGraph with the Z2 tune, while pythia does not describe well the W charge asymmetry, even for events with a single associated jet.
Finally, we test for scaling [13] and measure its parameters. Events are assigned to exclusive jet multiplicity bins (inclusive for n ≥ 4), and the corrected yields are fitted with the assumption that they conform to a scaling function:
Cn≡
σn
σn+1
= α , (10.1)
where σn = σ(V+ ≥ n jets), and α is a constant. Previous measurements have shown
that this ratio can be approximately constant [6,8,43]. Phase-space effects, however, can violate this simple proportionality. Therefore we introduce a second parameter, β, to allow for a deviation from a constant scaling law:
Cn= α + β n. (10.2)
Because of the different production kinematics of the n = 0 sample, where no reconstructed jets recoil against the vector boson, the scaling expressed in eq. (10.2) is not expected to hold, so we do not include the n = 0 sample in the fit. The results of the fit for α and β from the W + jets and Z + jets samples are shown in figure16. The values are given in the (α, β)
JHEP01(2012)010
(Z) σ n-jets) ≥ (Z + σ -3 10 -2 10 -1 10 data energy scale unfolding MadGraph Z2 MadGraph D6T Pythia Z2 CMS = 7 TeV s at -1 36 pb ee → Z > 30 GeV jet T Einclusive jet multiplicity, n
(n-1)-jets) ≥ (Z + σ n-jets) ≥ (Z + σ 0 0.1 0.2 0.3 1 2 3 4
Figure 12. The ratio σ(Z+ ≥ n jets)/σ(Z) (top) and σ(Z+ ≥ n jets)/σ(Z+ ≥ (n − 1) jets) (bottom) in the electron channel compared with the expectations from two MadGraph tunes and pythia. Points with error bars correspond to the data. The uncertainties due to the energy scale and unfolding procedure are shown as yellow and hatched bands, respectively. The error bars represent the total uncertainty.
n jets data MadGraph Z2 pythia Z2
electron channel ≥ 0 0.217 ± 0.004 (stat.) ± 0.006 (syst.) 0.228 ± 0.001 0.216 ± 0.003 ≥ 1 0.179 ± 0.010 (stat.) ± 0.007 (syst.) 0.179 ± 0.004 0.267 ± 0.007 ≥ 2 0.16 ± 0.03 (stat.) ± 0.01 (syst.) 0.183 ± 0.010 0.281 ± 0.020 ≥ 3 0.17 ± 0.08 (stat.) ± 0.06 (syst.) 0.19 ± 0.02 0.33 ± 0.05 muon channel ≥ 0 0.223 ± 0.003 (stat.) ± 0.010 (syst.) 0.224 ± 0.001 0.237 ± 0.003 ≥ 1 0.175 ± 0.010 (stat.) ± 0.011 (syst.) 0.179 ± 0.003 0.222 ± 0.008 ≥ 2 0.18 ± 0.03 (stat.) ± 0.02 (syst.) 0.190 ± 0.008 0.273 ± 0.023 ≥ 3 0.22 ± 0.07 (stat.) ± 0.02 (syst.) 0.19 ± 0.02 0.26 ± 0.06
Table 8. W charge asymmetry AW in the data and in the MadGraph and pythia (Z2 tune) simulations for the electron and muon channel. The uncertainties on the simulation values are statistical only.
plane and are compared with expectations from MadGraph with the Z2 tune for the un-derlying event description. Generator results are obtained at the particle jet level for events
JHEP01(2012)010
(Z) σ n-jets) ≥ (Z + σ -3 10 -2 10 -1 10 data energy scale unfolding MadGraph Z2 MadGraph D6T Pythia Z2 CMS = 7 TeV s at -1 36 pb µ µ → Z > 30 GeV jet T Einclusive jet multiplicity, n
(n-1)-jets) ≥ (Z + σ n-jets) ≥ (Z + σ 0 0.1 0.2 0.3 1 2 3 4
Figure 13. The ratio σ(Z+ ≥ n jets)/σ(Z) (top) and σ(Z+ ≥ n jets)/σ(Z+ ≥ (n − 1) jets) (bottom) in the muon channel compared with the expectations from two MadGraph tunes and pythia. Points with error bars correspond to the data. The uncertainties due to the energy scale and unfolding procedure are shown as yellow and hatched bands, respectively. The error bars represent the total uncertainty.
inclusive jet multiplicity, n
(W) σ (Z) σ n-jets) ≥ (Z + σ n-jets) ≥ (W + σ 0 0.5 1 1.5 2 data energy scale unfolding MadGraph Z2 Pythia Z2 CMS = 7 TeV s at -1 36 pb e channel > 30 GeV jet T E 1 2 3 4
inclusive jet multiplicity, n
(W) σ (Z) σ n-jets) ≥ (Z + σ n-jets) ≥ (W + σ 0 0.5 1 1.5 2 data energy scale unfolding MadGraph Z2 Pythia Z2 CMS = 7 TeV s at -1 36 pb channel µ > 30 GeV jet T E 1 2 3 4
Figure 14. Ratio of the W + jets and Z + jets cross sections for the electron channels (left) and the muon channels (right) as a function of the jet multiplicity. The ratios are normalized to the inclusive W/Z cross section. The expectations from MadGraph and pythia simulations, both with the Z2 tune, are shown. These expectations do not differ significantly and they are both in agreement with data. The difference between the expected values of the ratio in electron and muon channels is due to the larger electron acceptance in η. Error bars on data are shown for the statistical and total uncertainties. The uncertainties due to the energy scale and the unfolding procedure are shown as yellow and hatched bands, respectively.
JHEP01(2012)010
inclusive jet multiplicity, n
Charge asymmetry 0.1 0.2 0.3 0.4 data MadGraph Z2 Pythia Z2 CMS = 7 TeV s at -1 36 pb ν e → W > 30 GeV jet T E 0 1 2 3 4
inclusive jet multiplicity, n
Charge asymmetry 0.1 0.2 0.3 0.4 data MadGraph Z2 Pythia Z2 CMS = 7 TeV s at -1 36 pb ν µ → W > 30 GeV jet T E 0 1 2 3 4
Figure 15. W charge asymmetry AW versus the inclusive jet multiplicity. Data are compared with predictions from the MadGraph and pythia simulations. Error bars on the data points show the statistical and total uncertainties. Error bars on the simulation points correspond to the statistical uncertainty only. Left: electron decay channel, right: muon decay channel.
data stat. energy scale efficiency tune theory W α 4.5 ±0.5 +0.1−0.3 +0.2−0.4 +0.1 5.20 ± 0.05
β 0.6 ±0.4 +0.1
−0.4 +0.2−0.1 -0.3 0.20 ± 0.04
Z α 4.4 ±0.9 +0.8−0.2 ±0.05 +0.2 5.3 ± 0.1
β 1.1 ±0.8 +0.6−0.4 ±0.3 +0.1 0.17 ± 0.07
Table 9. Results for the scaling parameters in the electron channel compared with expecta-tions from the MadGraph Z2 simulation at the particle level. The prediction uncertainty is statistical only.
within the lepton and jet acceptance of the selection. The electron and muon expected values differ mostly because of the ∆R > 0.3 requirement between the jets and the leptons, which is applied only in the electron channel. The ellipses correspond to 68% confidence level contours using the statistical uncertainty only. The arrows show the displacement of the central value when varying each indicated parameter by its estimated uncertainty. The fit results are also reported in tables9and10. The data are in agreement with expectations within one or two standard deviations depending on the channel. Furthermore, the scaling hypothesis i.e., the relationship shown in eq. (10.1), is confirmed to work well up to the production of four jets. The β parameter lies within one standard deviation from zero for the W + jets case and within 0.5 standard deviations for the Z + jets case.
11 Summary
The rate of jet production in association with a W or Z boson was measured in pp collisions at √s = 7 TeV. The data were collected with the CMS detector in 2010 and correspond to an integrated luminosity of 36 pb−1. The W + jets and Z + jets samples were recon-structed in the electron and muon decay channels. The measurement was performed using
JHEP01(2012)010
α 4 4.5 5 5.5 β 0 0.5 1 1.5 n × β + α = (n+1) jets) ≥ (W + σσ(W + ≥ n jets) ν e → W data MadGraph Z2 stat. only 68% C.L. contoursCMS
uncertainties: efficiency jet energy scale MG+D6T migration matrix α 4 4.5 5 5.5 β 0 0.5 1 1.5 ν µ → W data MadGraph Z2
stat. only 68% C.L. contours
= 7 TeV s at -1 36 pb uncertainties: efficiency jet energy scale MG+D6T migration matrix α 4 6 8 β -2 0 2 n × β + α = (n+1) jets) ≥ (Z + σσ(Z + ≥ n jets) ee → Z data MadGraph Z2 stat. only 68% C.L. contours
CMS
uncertainties: jet energy scale MG+D6T migration matrix α 4 6 8 β -2 0 2 µ µ → Z data MadGraph Z2
stat. only 68% C.L. contours
= 7 TeV s at -1 36 pb uncertainties: jet energy scale MG+D6T migration matrix
Figure 16. Fit results for the scaling parameters α and β after pileup subtraction, efficiency corrections, and unfolding of detector resolution effects: (top) W + jets, (bottom) Z + jets, (left) electrons, (right) muons. The data are compared with the expectations from the MadGraph simulation with the Z2 tune. The ellipses correspond to 68% confidence level contours considering the statistical uncertainty only, for both data and simulation. The arrows show the displacement of the central value when varying each indicated parameter by its estimated uncertainty. The arrows labelled “MG+D6T migration matrix” correspond to the displacement when MadGraph simulation with the D6T tune is used for the unfolding.
particle-flow jets with ET > 30 GeV and clustered with the anti-kT algorithm with a size
parameter R = 0.5.
The ETspectra agree well with the predictions from simulations based on MadGraph
interfaced with pythia, and using the Z2 tune for the underlying event description. Detector resolution effects were unfolded to extract the exclusive jet multiplicity distri-butions and to measure the ratios of the normalized inclusive rates σ(V+ ≥ n jets)/σ(V). The ratio of the W + jets to Z + jets cross sections, [σ(W+ ≥ n jets)/σ(Z+ ≥ n jets)]/[σ(Z)/σ(W)], and the W charge asymmetry, AW, were also measured as functions
JHEP01(2012)010
data stat. energy scale efficiency tune theory W α 4.6 ±0.3 +0.1−0.3 +0.2−0.1 -0.5 5.17 ± 0.09
β 0.7 ±0.3 +0.3−0.2 ±0.3 +0.3 0.22 ± 0.07
Z α 6.4 ±1.2 +0.1
−0.3 ±0.1 -0.3 4.8 ± 0.1
β −0.5 ±0.9 +0.1−0.2 ±0.2 +0.1 0.34 ± 0.09
Table 10. Results for the scaling parameters in the muon channel compared with expectations from the MadGraph Z2 simulation at the particle level. The prediction uncertainty is statistical only.
of the jet multiplicity. Finally, a quantitative test of scaling, parametrized as a function of two parameters determined by a fit, was performed.
All results are in agreement with the predictions of the MadGraph generator, using matrix-element calculations for final states with jets, matched with pythia parton shower. In contrast, the simulation based on parton showers alone fails to describe the jet rates for more than one jet, and the W charge asymmetry, even in the case of only one jet.
Acknowledgments
We wish to congratulate our colleagues in the CERN accelerator departments for the ex-cellent performance of the LHC machine. We thank the technical and administrative staff at CERN and other CMS institutes. This work was supported by the Austrian Federal Ministry of Science and Research; the Belgium Fonds de la Recherche Scientifique, and Fonds voor Wetenschappelijk Onderzoek; the Brazilian Funding Agencies (CNPq, CAPES, FAPERJ, and FAPESP); the Bulgarian Ministry of Education and Science; CERN; the Chinese Academy of Sciences, Ministry of Science and Technology, and National Natu-ral Science Foundation of China; the Colombian Funding Agency (COLCIENCIAS); the Croatian Ministry of Science, Education and Sport; the Research Promotion Foundation, Cyprus; the Estonian Academy of Sciences and NICPB; the Academy of Finland, Finnish Ministry of Education and Culture, and Helsinki Institute of Physics; the Institut National de Physique Nucl´eaire et de Physique des Particules / CNRS, and Commissariat `a l’ ´Energie Atomique et aux ´Energies Alternatives / CEA, France; the Bundesministerium f¨ur Bildung und Forschung, Deutsche Forschungsgemeinschaft, and Helmholtz-Gemeinschaft Deutscher Forschungszentren, Germany; the General Secretariat for Research and Technology, Greece; the National Scientific Research Foundation, and National Office for Research and Tech-nology, Hungary; the Department of Atomic Energy and the Department of Science and Technology, India; the Institute for Studies in Theoretical Physics and Mathematics, Iran; the Science Foundation, Ireland; the Istituto Nazionale di Fisica Nucleare, Italy; the Korean Ministry of Education, Science and Technology and the World Class University program of NRF, Korea; the Lithuanian Academy of Sciences; the Mexican Funding Agencies (CIN-VESTAV, CONACYT, SEP, and UASLP-FAI); the Ministry of Science and Innovation, New Zealand; the Pakistan Atomic Energy Commission; the State Commission for Scien-tific Research, Poland; the Funda¸c˜ao para a Ciˆencia e a Tecnologia, Portugal; JINR
(Arme-JHEP01(2012)010
nia, Belarus, Georgia, Ukraine, Uzbekistan); the Ministry of Science and Technologies of the Russian Federation, the Russian Ministry of Atomic Energy and the Russian Founda-tion for Basic Research; the Ministry of Science and Technological Development of Serbia; the Ministerio de Ciencia e Innovaci´on, and Programa Consolider-Ingenio 2010, Spain; the Swiss Funding Agencies (ETH Board, ETH Zurich, PSI, SNF, UniZH, Canton Zurich, and SER); the National Science Council, Taipei; the Scientific and Technical Research Council of Turkey, and Turkish Atomic Energy Authority; the Science and Technology Facilities Council, UK; the US Department of Energy, and the US National Science Foundation.
Individuals have received support from the Marie-Curie programme and the European Research Council (European Union); the Leventis Foundation; the A. P. Sloan Foundation; the Alexander von Humboldt Foundation; the Belgian Federal Science Policy Office; the Fonds pour la Formation `a la Recherche dans l’Industrie et dans l’Agriculture (FRIA-Belgium); the Agentschap voor Innovatie door Wetenschap en Technologie (IWT-(FRIA-Belgium); and the Council of Science and Industrial Research, India.
Open Access. This article is distributed under the terms of the Creative Commons Attribution Noncommercial License which permits any noncommercial use, distribution, and reproduction in any medium, provided the original author(s) and source are credited.
References
[1] H. Ita et al., Precise predictions for Z + 4 jets at hadron colliders,arXiv:1108.2229
[INSPIRE].
[2] C.F. Berger et al., Precise predictions for W + 4 jet production at the Large Hadron Collider,
Phys. Rev. Lett. 106 (2011) 092001[arXiv:1009.2338] [INSPIRE].
[3] C.F. Berger et al., Next-to-leading order QCD predictions for W + 3-jet distributions at hadron colliders,Phys. Rev. D 80 (2009) 074036[arXiv:0907.1984] [INSPIRE].
[4] R.K. Ellis, K. Melnikov and G. Zanderighi, W + 3 jet production at the Tevatron,Phys. Rev.
D 80 (2009) 094002[arXiv:0906.1445] [INSPIRE].
[5] C.-H. Kom and W. Stirling, Charge asymmetry in W + jets production at the LHC,Eur.
Phys. J. C 69 (2010) 67[arXiv:1004.3404] [INSPIRE].
[6] CDF collaboration, T. Aaltonen et al., Measurement of the cross section for W− boson production in association with jets in p¯p collisions at√s = 1.96 TeV,Phys. Rev. D 77 (2008) 011108[arXiv:0711.4044] [INSPIRE].
[7] CDF — Run II collaboration, T. Aaltonen et al., Measurement of inclusive jet
cross-sections in Z/γ∗(→ e+e−) + jets production in p¯p collisions at √s = 1.96 TeV,Phys.
Rev. Lett. 100 (2008) 102001[arXiv:0711.3717] [INSPIRE].
[8] D0 collaboration, V.M. Abazov et al., Measurements of inclusive W +jets production rates as a function of jet transverse momentum in p¯p collisions at√s = 1.96 TeV,Phys. Lett. B 705 (2011) 200[arXiv:1106.1457] [INSPIRE].
[9] D0 collaboration, V. Abazov et al., Measurements of differential cross sections of
Z/γ∗+jets+X events in proton anti-proton collisions at √s = 1.96 TeV,Phys. Lett. B 678 (2009) 45[arXiv:0903.1748] [INSPIRE].
JHEP01(2012)010
[10] ATLAS collaboration, G. Aad et al., Measurement of the production cross section forW-bosons in association with jets in pp collisions at√s = 7 TeV with the ATLAS detector,
Phys. Lett. B 698 (2011) 325[arXiv:1012.5382] [INSPIRE].
[11] CMS collaboration, Absolute luminosity normalization, CMS Detector Performance SummaryDP-2011-002, CERN, Geneva Switzerland (2011).
[12] S. Ellis, R. Kleiss and W. Stirling, W’s, Z’s and jets,Phys. Lett. B 154 (1985) 435[INSPIRE]. [13] F.A. Berends, W. Giele, H. Kuijf, R. Kleiss and W. Stirling, Multi-jet production in W, Z
events at p¯p colliders,Phys. Lett. B 224 (1989) 237[INSPIRE].
[14] F.A. Berends, H. Kuijf, B. Tausk and W. Giele, On the production of a W and jets at hadron colliders,Nucl. Phys. B 357 (1991) 32[INSPIRE].
[15] E. Gerwick, T. Plehn and S. Schumann, Understanding jet scaling and jet vetos in Higgs searches,arXiv:1108.3335[INSPIRE].
[16] CMS collaboration, R. Adolphi et al., The CMS experiment at the CERN LHC,2008 JINST 3 S08004[INSPIRE].
[17] F. Maltoni and T. Stelzer, MadEvent: automatic event generation with MadGraph,JHEP 02 (2003) 027[hep-ph/0208156] [INSPIRE].
[18] T. Sj¨ostrand, S. Mrenna and P.Z. Skands, PYTHIA 6.4 physics and manual,JHEP 05 (2006) 026[hep-ph/0603175] [INSPIRE].
[19] J. Pumplin et al., New generation of parton distributions with uncertainties from global QCD analysis,JHEP 07 (2002) 012[hep-ph/0201195] [INSPIRE].
[20] K. Melnikov and F. Petriello, Electroweak gauge boson production at hadron colliders through O(α2
s),Phys. Rev. D 74 (2006) 114017[hep-ph/0609070] [INSPIRE].
[21] J.M. Campbell, R. Frederix, F. Maltoni and F. Tramontano, Next-to-leading-order predictions for t-channel single-top production at hadron colliders,Phys. Rev. Lett. 102
(2009) 182003[arXiv:0903.0005] [INSPIRE].
[22] R. Kleiss and W. Stirling, Top quark production at hadron colliders: some useful formulae,
Z. Phys. C 40 (1988) 419[INSPIRE].
[23] GEANT4 collaboration, S. Agostinelli et al., GEANT4: a simulation toolkit,Nucl. Instrum.
Meth. A 506 (2003) 250[INSPIRE].
[24] J. Allison et al., GEANT4 developments and applications,IEEE Trans. Nucl. Sci. 53 (2006)
270[INSPIRE].
[25] CMS collaboration, S. Chatrchyan et al., Measurement of the underlying event activity at the LHC with√s = 7 TeV and comparison with√s = 0.9 TeV,JHEP 09 (2011) 109
[arXiv:1107.0330] [INSPIRE].
[26] R. Field, Early LHC underlying event data — findings and surprises, arXiv:1010.3558
[INSPIRE].
[27] P.Z. Skands, Tuning Monte Carlo generators: the Perugia tunes,Phys. Rev. D 82 (2010) 074018[arXiv:1005.3457] [INSPIRE].
[28] CMS collaboration, V. Khachatryan et al., Measurements of inclusive W and Z cross sections in pp collisions at√s = 7 TeV,JHEP 01 (2011) 080[arXiv:1012.2466] [INSPIRE].
JHEP01(2012)010
[29] CMS collaboration, Commissioning of the particle-flow reconstruction in minimum-bias andjet events from pp collisions at 7 TeV, CMS Physics Analysis SummaryPAS-PFT-10-002, CERN, Geneva Switzerland (2010).
[30] CMS collaboration, S. Chatrchyan et al., Measurement of the lepton charge asymmetry in inclusive W production in pp collisions at√s = 7 TeV,JHEP 04 (2011) 050
[arXiv:1103.3470] [INSPIRE].
[31] W. Adam et al., Reconstruction of electrons with the Gaussian-sum filter in the CMS tracker at the LHC,CMS Note 2005/001, CERN, Geneva Switzerland (2005).
[32] M. Cacciari, G.P. Salam and G. Soyez, The anti-kt jet clustering algorithm,JHEP 04 (2008)
063[arXiv:0802.1189] [INSPIRE].
[33] CMS collaboration, S. Chatrchyan et al., Determination of jet energy calibration and transverse momentum resolution in CMS,2011 JINST 6 P11002[arXiv:1107.4277]
[INSPIRE].
[34] CMS collaboration, Identification and filtering of uncharacteristic noise in the CMS hadron calorimeter,2010 JINST 5 T03014[arXiv:0911.4881] [INSPIRE].
[35] M. Cacciari and G.P. Salam, Pileup subtraction using jet areas,Phys. Lett. B 659 (2008) 119
[arXiv:0707.1378] [INSPIRE].
[36] M. Cacciari, G.P. Salam and G. Soyez, The catchment area of jets,JHEP 04 (2008) 005
[arXiv:0802.1188] [INSPIRE].
[37] CMS collaboration, Performance of the b-jet identification in CMS, CMS Physics Analysis Summary,PAS-BTV-11-001, CERN, Geneva Switzerland (2011).
[38] CMS collaboration, V. Khachatryan et al., Measurement of the charge ratio of atmospheric muons with the CMS detector,Phys. Lett. B 692 (2010) 83[arXiv:1005.5332] [INSPIRE]. [39] A. Hocker and V. Kartvelishvili, SVD approach to data unfolding,Nucl. Instrum. Meth. A
372 (1996) 469[hep-ph/9509307] [INSPIRE].
[40] G. D’Agostini, A multidimensional unfolding method based on Bayes’ theorem, Nucl.
Instrum. Meth. A 362 (1995) 487[INSPIRE].
[41] T. Adye, Unfolding algorithms and tests using RooUnfold, arXiv:1105.1160[INSPIRE]. [42] CMS collaboration, Jet energy resolution in CMS at √s = 7 TeV, CMS Physics Analysis
SummaryPAS-JME-10-014, CERN, Geneva Switzerland (2010).
[43] D0 collaboration, V. Abazov et al., t¯t production cross-section in p¯p collisions at √