UNIVERSITÀ DEGLI STUDI DI FOGGIA
P
HD
C
OURSE“H
EALTHY FOODS:
INNOVATION AND MANAGEMENT”
(XXX
CYCLE)
PhD Thesis
Characterization Of Enzymes For The Food Industry
And Active Packaging
Supervisor: Dr. Rocco Caliandro
PhD candidate: Valentina Mirabelli
1
Contents
Introduction and aims ... 4
Experimental section ... 6
Purification of fungal laccase isoforms overexpressed in yeast ... 6
o Protein overexpression and purification by FPLC ... 6
o Purification by gravity flow Anion Exchange Chromatography ... 7
SDS-PAGE analysis ... 8
Protein assay and enzymatic activity assay ... 8
Protein stability in the medium and proteases inhibition ... 9
Protein glycosylation analysis ... 10
Overexpression in Escherichia coli and purification of the Ery3 laccase isoform .... 11
o Plasmid DNA amplification ... 13
o Plasmid DNA extraction and purification (Miniprep) ... 13
o DNA subcloning ... 14
o Vectors and insert digestion, gel extraction and CIAP treatment ... 17
o Ligation, DH5α E. coli cells transformation and screening ... 18
o Removal of the signal sequence for protein secretion ... 20
o Protein expression and purification... 21
o Small scale protein expression protocol ... 22
o Large scale protein expression and purification protocol ... 23
o Bradford assay, SDS-PAGE and Western blot analysis ... 25
Laccase immobilization on hydrogel film ... 27
Mycotoxin degradation with Ery4 laccase isoform and redox mediators ... 28
o Mycotoxin degradation assay with the enzyme free in solution ... 28
o Mycotoxin degradation assay with the immobilized enzyme ... 28
Antimicrobial activity of lysozyme crystals growth on hydrogel membrane composites (HMCs) ... 31
2
o Protein crystallization on HCMs ... 31
o Crystal dissolution rate analysis ... 32
o Antimicrobial activity of crystallized lysozyme ... 33
o Antimicrobial efficacy determination ... 34
Results ... 36
Purification of fungal laccase isoforms overexpressed in yeast ... 36
o Protein overexpression and purification by FPLC ... 36
o Protein stability in the medium and proteases inhibition ... 42
o Purification by gravity flow Anion Exchange Chromatography ... 43
Protein glycosylation analysis ... 44
Overexpression in Escherichia coli and purification of the Ery3 laccase isoform ... 48
Laccase immobilization on hydrogel film ... 54
Mycotoxins degradation with Ery4 laccase isoform and redox mediators ... 55
Antimicrobial activity of lysozyme crystals growth on hydrogel membrane composites (HMCs) ... 59
Conclusions and perspectives ... 62
References ... 63
List of Figures ... 64
List of Tables ... 66
3
4
Introduction and aims
The advantages of using enzymes instead of chemicals in the industrial processes and their wide range applications are nowadays of common knowledge, but over the last few decades we are experiencing a shift from the use of enzymes free in solution to the use of immobilized enzymes [Sheldon&Van Pelt, 2013]. Several immobilization techniques have been developed so far, depending on the application, employing chemical, or physical interactions between the supporting polymer and the biomolecules. In particular, in the food industry, an immobilized enzyme is often found as the functional agent in the so called “active packaging”, such as those with antimicrobial activity against spoilage [Villa et al., 2016]. In our age of global sharing and awareness about health, environment and food quality, the research in the field of food packaging and shelf-life is considered an open and challenging frontier.
Among the enzymes used for industrial applications, laccase (E.C. 1.10.3.2) is certainly one of the most exploited and versatile, thanks to its broad substrate-specificity and tunable redox potential at different working conditions [Kunamneni et al., 2008]. Laccases are multicopper oxidases which since long time are applied to the detoxification of water and waste, stabilization of wine and beverages, or also in the baking industry. In particular, it has been reported that fungal laccase can degrade some mycotoxins [Mot and Silaghi-Dumitrescu, 2012; Alberts et al., 2009].
In this PhD work, studies were carried out on recombinant fungal laccase isoforms, and on the immobilization of these and other enzymes for food packaging purposes.
5
6
Experimental section
*Purification of fungal laccase isoforms overexpressed in yeast
Protein overexpression and purification by FPLC
The overexpression of the Pleurotus eryngii laccase isoforms, namely Ery3 and Ery4, in Saccharomyces cerevisiae, and the culture broth filtration and concentration were performed as previous described [Bleve et al. 2008] by the Institute of Sciences of Food Production (ISPA-CNR) in Bari. At least one litre of culture broth was pre-filtered, concentrated, then added with 50 mM TRIS/HCl pH 7 and concentrated again to a final volume of about 50 ml.
Purification by Fast Protein Liquid Chromatography (FPLC) was performed by me at the Institute of Crystallography, (IC-CNR) in Bari, using the Bio-Rad NGC™ Quest 10 Plus Chromatography System equipped with a multi-wavelength detector.
The filtrate was fractionated using an Anion Exchange Chromatography (AEC) step followed by a Size Exclusion (SE) step. For the first AEC step, the 1 ml ENrich™ Q High-Resolution Ion Exchange Column (#7800001 Bio-Rad) was used, which contains a 10 µm particle-size separation medium with a strongly basic –N+(CH3)3 quaternary ammonium group. The column was equilibrated with TRIS/HCl 50 mM pH 7 and the protein was eluted with either a linear gradient of 0 to 100% NaCl 1 M, or an isocratic step-flow at 20 to 50% NaCl 1 M in TRIS/HCl 50 mM pH 7, at a flow-rate of 0.5 ml/min. Fractions of 0.3-0.5 ml containing enzymatic activity were pooled, dialyzed and further concentrated by filtration through the Amicon Ultra-0.5 Centrifugal Filter Unit with Ultracel-10 kDa cut-off membrane (#UFC501096 Merck-Millipore), to a final volume of about 0.25 ml. The concentrated sample was then loaded on a ENrich™ SEC 650 High-Resolution Size Exclusion Column (#7801650 Bio-Rad) equilibrated with TRIS/HCl 50 mM pH 7 and fractionated with 1 column volume (24 ml) of the same buffer, at a flow-rate of 0.2 ml/min. Fractions of 0.2-0.3 ml were collected, tested for enzymatic activity and SDS-PAGE analysis and finally stored at -20 °C. TRIS (Trizma® base, BioUltra) and NaCl reagents were provided by Sigma-Aldrich, Milan, Italy.
*
For a theoretical discussion on protein expression and purification strategies, refer to the book “Current protocols in Molecular Biology” (http://onlinelibrary.wiley.com/book/10.1002/0471142727).
7 Chromatographic runs were monitored at 215 nm, 255 nm and 280 nm wavelengths and then analyzed using the Bio-Rad ChromLabTM Software 3.3 (Figure 1). An extinction coefficient of 1.2 (mg/ml)-1 cm-1 and a molecular mass of 54 kDa were predicted by ExPASy ProtParam tool (http://web.expasy.org/protparam/), using the Ery3 FASTA sequence for the UniProt entry B0JDP8 without the 23 amino acids signal peptide at the N-terminal. Both parameters were considered for estimating the fraction concentration and amount of protein.
Figure 1 - Run analysis by Bio-Rad ChromLabTM software.
Purification by gravity flow Anion Exchange Chromatography
The Ery4 isoform overexpressed in yeast was alternately purified in batch using a gravity flow column packed with 10 ml bed volume of UNOsphereTM Q support (#1560103 Bio-Rad), equilibrated with TRIS/HCl 50 mM pH 8. Protein pool was eluted with 20 ml of 0.3 M NaCl. The pool was concentrated to a final volume of 1 ml with Amicon Ultra-15 Centrifugal Filter Unit with Ultracel-10 kDa cut-off membrane (#UFC901024 Millipore). The batch was then used for the laccase immobilization protocol described in §Laccase immobilization on hydrogel film.
8
SDS-PAGE analysis
Sodium dodecyl sulphate-polyacrylamide gel electrophoresis (SDS-PAGE) was carried out using the Bio-Rad Mini-PROTEAN® Tetra Cell System, running 1.5 mm gels of TGX Stain-Free™ FastCast™ Acrylamide Solutions, 10% (#1610182 Bio-Rad) for about 40 min at 200 mV in Tris/Glycine/SDS buffer (#1610732 Bio-Rad). The Precision Plus Protein™ Dual Color Standards (#1610374 Bio-Rad) and the laccase from Trametes versicolor (≥0.5 U/mg, code 38429 Sigma) were used as molecular weight references. Gels were stained with Bio-Safe™ Coomassie Stain (#1610786 Bio-Rad).
Figure 2 - Protein Bradford measurement by Nanodrop software.
Protein assay and enzymatic activity assay
Spectrophotometric measurements were carried out with the Thermo-Fischer UV-Vis NanoDropTM 2000c Spectrophotometer, using the cuvette measurement option.
The Bio-Rad Protein Assay Dye Reagent based on the Bradford method was used for the total protein amount estimation in the filtered broth (50 ml) and in the collected samples. Three standard curves were obtained with different concentrations of bovine serum albumin (BSA, Protein Assay Standard II Albumin, #5000007 Bio-Rad), that is 0.3 to 0.9 mg/ml for the standard procedure
9 (y=0,0009x+0,0659; R²=0,9875), 2 to 10.0 μg/ml for the microassay procedure (y=0,0471x+0,0194; R²=0,999) and 0.05 to 0.15 mg/ml as a customized intermediate range (y=0,0014x+0,005; R²=0,9831), following the procedures reported in the enclosed documentation. The absorbance at 595 nm was measured using the “Protein Bradford” option in the Nanodrop software (Figure 2).
For the enzymatic activity assay in the filtered broth (50 ml) and in the collected fractions, the 2 2'-azino-bis(3-ethylbenzothiazoline-6-sulfonic acid) (ABTS, code A1888 Sigma-Aldrich) was used as a laccase specific substrate, as reported in Bleve et al. 2008. A final volume of 1 ml containing ABTS 5 mM, sodium acetate 100 mM pH 4.5 and the sample to be tested was incubated for 10 min at room temperature and the absorbance at 420 nm was measured with the “UV-Vis” option and the default baseline correction wavelength.
Enzymatic units calculation (U/ml) was performed as follow:
U/ml =
(𝐴×𝑉𝑓×∆)(𝜀×𝑉𝑠) (1)
where A is the ABTS absorbance at 420 nm, Vf is the final volume (1 ml), Δ is the sample dilution (if necessary), is the ABTS extinction coefficient (36 when the enzymatic units are expressed as U/ml) and Vs is the sample volume tested.
Protein stability in the medium and proteases inhibition
To verify protein stability in the culture broth, two aliquots of 10 ml filtered broth were incubated at -20 °C for a week (T1) with a tablet of the cOmplete™ ULTRA, Mini, EDTA-free, EASYpack Protease Inhibitor Cocktail (#05892791001 Roche) and two aliquots were stored at 4 °C and at -20 °C respectively, without protease inhibitors. Results were compared to those at the initial time (T0) in the sample.
10
Protein glycosylation analysis
Putative N- and O-glycosylation sites in the laccase amino acid sequence have been predicted by the NetNGlyc 1.0 and NetOGlyc 4.0 servers respectively (see §Results). In order to assess the effective presence of overglycosylation isoforms in the sample, the Enzymatic Deglycosylation Kit GlycoPro (code GK80110 Prozyme) was used. Following the manufacturer's instructions, the non-denaturing protocol was performed treating 35 µl of the sample with different combinations of the three enzymes supplied in the kit, that is N-Glycanase, Sialidase A and O-Glycanase, at different times of incubation, ranging from 12 hours to 5 days. An aliquot was fully deglycosylated using the denaturing protocol to provide a gel standard. All samples were analyzed by SDS-PAGE (§SDS-PAGE analysis).
11
Overexpression in Escherichia coli and purification of the Ery3 laccase
isoform
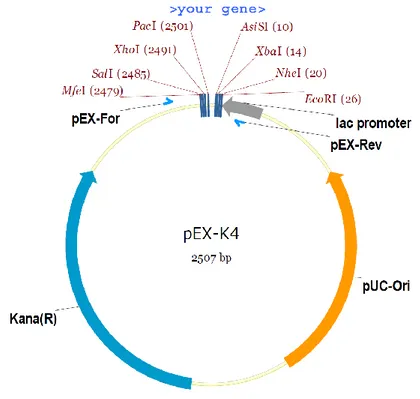
A synthetic gene (Figure 4) for the Ery3 isoform of Pleurotus eryngii laccase (Uniprot entry B0JDP8) was purchased from Eurofins Genomics. The sequence has been optimized and adapted to the codon usage in Escherichia coli K12, flanked with NdeI/XhoI restriction sites at 5’/3’ respectively, and supplied to us into the standard cloning vector pEX-K4. The pEX-K4 is a high copy number plasmid containing a pUC origin of replication, a lac promoter and the antibiotic resistance to kanamycin as selectable marker (Figure 3). The overexpression and purification activities described in the following were carried out at the Prof. di Luccio’s Structural Biology & Epigenetics Lab in Daegu, South Korea, during the visiting period of my PhD.
Figure 3 - pEX-K4 vector map and multiple cloning site.
12
a)
>ENA|AM773999|AM773999.1 Pleurotus eryngii mRNA for laccase (ery3 gene)
ATGTTTCCAGGCGCACGGATTCTCGCTACGCTTACATTAGCTCTTCACCTTTTACATGGCACTCACGCTGCCATCGGGCC CATTGCCGACATGTACATCGTCAACGAGGACGTCTCTCCTGACGGCTTCGCTCGTTCGGCTGTCGTCGCTCGCTCTGTGC CGGCCACAGATCCGACGCCTGCGTCGGTATCGGTTCCTGGCGTCCTCGTGCAAGGAAACAAGGGCGATAACTTTCAGCTG AACGTTCGCAATCAACTGTCGGACTCGACTATGTTGAAGACTACTAGTATCCATTGGCATGGCTTCTTTCAATCCGGCTC TACGTGGGCAGATGGACCCGCGTTCGTGAATCAGTGCCCCATCGCCTCGGGGAATAGCTTCCTATATGACTTTAACGTTC CCGACCAAGCTGGCACGTTCTGGTACCATTCGCATCTTTCCACCCAGTATTGTGATGGTCTTAGAGGACCATTCGTAGTA TACGATCCCTCCGATCCCCACCTGTCCTTATATGACGTTGACAACGCCGACACTGTCATTACACTTGAAGATTGGTACCA CGTTGCGGCCCCTCAGGGTGCAGTGCTTCCTACTCCTGATAGCACGCTCATCAATGGTAAAGGTCGCTTCGCCGGGGGGC CGACTTCCCCTTTGGCTATCATCAACGTCGAAAGCAACAAGCGATATCGTTTCCGACTTATCTCGATGTCTTGCGACCCC AATTTCACGTTCTCAATCGACGGTCACTCTTTGCAGGTCATTGAAGCAGATGCTGTCAATATTGTGCCCCTCGTCGTGGA TAGTATTCAAATCTTCGCGGGCCAACGCTATTCTTTCGTCCTGAATGCCAATCAGGCTGTCGACAATTATTGGATTCGCG CAAATCCCAACTTGGGATCGACTGGCTTCGAAGGTGGCATCAATTCCGCTATCCTTCGCTATGCTGGTGCCACTGAAAAT GACCCTGCCACGACTTCGTCGACGAGCACTCCCCTTCTGGAGACTAATCTTGTGCCACTCGAAAATCCTGGTGCTCCTGG TCCAGCTGTCCCTGGAGGCGCAGACATCAACATCAATCTTGCTATGGGCTTCGACTTTACTAACTTTGAAATGACCATCA ACGGTTCCCCCTTCAAAGCACCAACTGCTCCTGTTCTGCTCCAGATTCTGTCAGGTGCTACGCCTGCCGCTTCGCTTCTT CCTTCAGGTAGTATATACGCGCTAGAAGCCAACAAAGTTGTCGAAATCTCCATACCCGCCTTAGCTGTCGGAGGACCGCA TCCTTTCCATCTTCACGGACACACGTTCGACGTCATCAGGAGTGCGGGCTCTACTACGTATAACTTCGACACCCCTGCGC GACGCGATGTTGTCAACACTGGAATTGACGCGAACGACAACGTTACCATCCGCTTTGTGACGGATAATCCGGGCCCATGG TTCCTCCACTGCCACATTGACTGGCATCTCGAAATCGGTCTCGCGGTCGTTTTCGCCGAAGATGTGGCGTCCATCAAGGC CCCACCTGCCGCGTGGGACGACTTGTGTCCGATTTATGATGCTTTGAGCGATTCCGACAGAGGTGGCATAGCTTAG b)
CAT ATG TTT CCG GGT GCT CGT ATT TTA GCC ACC CTG ACT CTT GCG CTG CAT CTG CTG CAT
GGG ACA CAT GCC GCG ATT GGC CCG ATT GCG GAC ATG TAC ATT GTT AAC GAA GAT GTG TCC CCT GAT GGC TTT GCC CGT TCA GCA GTG GTA GCG CGT TCC GTG CCG GCT ACG GAC CCT ACG CCA GCA AGC GTG TCT GTA CCG GGC GTA CTG GTT CAG GGC AAC AAA GGC GAT AAC TTT CAG CTG AAT GTT CGC AAT CAG CTG AGC GAT TCA ACG ATG CTG AAA ACT ACC AGT ATT CAT TGG CAT GGG TTC TTT CAG TCA GGG TCG ACC TGG GCA GAT GGA CCA GCC TTT GTG AAT CAG TGT CCG ATT GCC TCA GGT AAC TCG TTC CTG TAC GAC TTC AAT GTG CCG GAT CAA GCG GGC ACG TTT TGG TAT CAC AGT CAC TTG AGC ACG CAG TAT TGC GAC GGT TTG CGC GGA CCG TTT GTT GTG TAC GAT CCG TCT GAT CCT CAT TTG AGC CTG TAT GAT GTC GAC AAC GCT GAC ACG GTG ATC ACA TTG GAG GAC TGG TAC CAT GTC GCG GCA CCT CAA GGC GCG GTA TTG CCG ACC CCG GAT AGC ACG CTT ATC AAT GGT AAA GGT CGT TTT GCC GGC GGT CCA ACC TCT CCT CTC GCG ATC ATT AAC GTG GAG TCT AAC AAA CGC TAT CGC TTT CGC CTG ATC TCC ATG AGC TGT GAT CCG AAC TTC ACC TTC AGT ATC GAC GGT CAC TCG TTA CAA GTC ATT GAA GCT GAT GCC GTC AAC ATT GTC CCA CTC GTC GTG GAT TCC ATC CAG ATC TTT GCG GGG CAA CGG TAT AGC TTC GTG CTT AAT GCC AAC CAA GCG GTA GAT AAC TAT TGG ATT CGC GCA AAT CCG AAT TTA GGC AGT ACC GGC TTC GAA GGT GGC ATT AAT AGC GCA ATT CTG CGC TAT GCT GGA GCC ACG GAA AAT GAC CCC GCG ACT ACG AGC AGC ACT TCT ACT CCA CTG CTG GAG ACA AAC CTC GTT CCC CTG GAA AAC CCG GGT GCA CCG GGT CCG GCG GTT CCT GGT GGG GCC GAT ATC AAC ATC AAT CTG GCA ATG GGA TTT GAC TTC ACC AAC TTC GAA ATG ACC ATT AAT GGC TCA CCG TTT AAA GCG CCG ACC GCA CCA GTC CTC TTA CAG ATT CTG AGT GGT GCG ACA CCC GCC GCC AGC CTG TTA CCG TCC GGC TCT ATC TAT GCG TTA GAA GCC AAC AAG GTG GTT GAG ATC TCG ATT CCC GCT CTG GCT GTT GGA GGG CCG CAT CCA TTT CAC TTG CAC GGC CAT ACC TTC GAC GTG ATT CGC AGT GCC GGC TCG ACC ACC TAC AAC TTC GAC ACA CCG GCT CGT CGC GAC GTT GTC AAT ACT GGT ATC GAT GCG AAT GAC AAC GTG ACC ATC CGG TTC GTA ACC GAT AAT CCC GGC CCT TGG TTT CTG CAT TGC CAC ATT GAT TGG CAC CTG GAA ATC GGT CTG GCC GTT GTC TTT GCG GAA GAT GTG GCT TCG ATT AAG GCA CCG CCA GCG GCA TGG GAT GAT CTG TGC CCG ATT TAC
GAT GCG CTT AGC GAT TCC GAT CGT GGC GGT ATT GCA CTC GAG
Figure 4 - Optimization and codon bias for the synthetic ery3 gene.
a) Original mRNA sequence (http://www.ebi.ac.uk/ena/data/view/AM773999); b) Synthetic sequence. Gene size=1602 bp. NdeI and XhoI restriction sites are painted in green and blue respectively. Sequence for the N-ter signal peptide (1-23 aa /1-69 bp) is highlighted in pale blue.
13
Plasmid DNA amplification
After eluting the 2.5 μg pEX-K4-ery3 plasmid in 50 μl of TE buffer, for a final concentration of 50 ng/μl, chemically competent DH5α E. coli cells were transformed for DNA amplification purpose before subcloning into the destination vectors.
One tube of competent cells was thawed and 50 µl of them were mixed with 0.5 µl of DNA in a new ice cold tube. The mixture was incubated on ice for 5 min, then streaked onto an LB+kan plate and incubated overnight at 37 °C. One picked colony was then cultured into 15 ml of LB medium containing 20 µg/ml of kanamycin, as in the plate. The culture was incubated overnight at 37 °C in a baffled flask and 1 ml of LB-kan medium was also incubated in a test-tube as control for contamination. From the starting 15 ml culture, 750 µl were mixed with 750 µl of 30% glycerol and stored at -80 °C, while 12 ml were used for plasmid extraction.
Plasmid DNA extraction and purification (Miniprep)
The amplified pEX-K4-ery3 plasmid was extracted according to the alkaline lysis method by using the FavorPrepTM Plasmid DNA Extraction Mini Kit (Favorgen® Biotech corp.). The 12 ml culture was split into 2x6 ml and centrifuged at 8000 rpm for 3 min into two 15 ml conical tubes. For each tube, the supernatant was discarded and the pellet resuspended with 400 µl of isotonic buffer (FAPD1) RNAse A added. The suspension was then split into 2x200 µl and transferred into two 1.5 ml microcentrifuge tubes (so that a total of 4 preparations were obtained), each tube was added with 200 µl of alkaline lysis buffer (FAPD2), inverted 10 times and incubated for 2 min at room temperature. Then, 300 µl of acidic buffer FAPD3 were added, the tubes were inverted gently 10 times and centrifuged at full speed for 20 min. The aqueous supernatant was then transferred to a FAPD column and spun down at full speed for 30 sec. The plasmid DNA was purified by two washing steps: a first washing step with 400 µl of W1 buffer and a second washing step with 600 µl of Wash buffer ethanol added, both followed by spin at full speed for 30 sec. After an additional centrifugation step of 3 min to dry the column and remove all the residual ethanol, 50 µl of sterile water were added and the column stood 2 min before eluting the plasmid DNA with 1 min spin at full speed.
14
DNA subcloning
For the protein expression and purification, the IMPACTTM system (New England BioLabs® Inc.) was used, which allows the overexpression of a target protein as a fusion to a self-cleavable affinity tag (§Protein expression and purification).
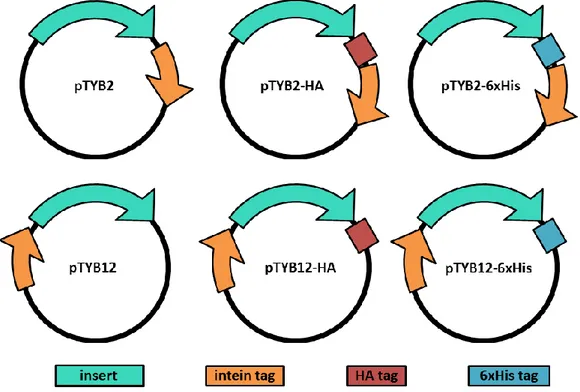
Six different cloning and expression vectors were tested for this project: the pTYB2 and pTYB12 vectors from the IMPACTTM Kit and 4 customized versions for the same vectors including an epitope tag at the C-terminus of the target, either the human influenza hemagglutinin (HA) tag, or the poly-histidine (6xHis) tag (Figure 5). The use of an epitope tag was required for the immunoblotting analysis as the specific antibodies for the target were not available.
All the vectors contained: a multiple cloning site (MCS), which is positioned to allow translational fusion of the Sce VMA intein tag to the C-terminus (pTYB2; NEB #N6702S), or N-terminus (pTYB12; NEB #N6902S) of the cloned target protein; the chitin-binding domain (CBD) fused to the intein tag; 2 origins of replication (pMB1 and M13); the inducible T7 promoter and the Shine Dalgarno sequence for translation; the antibiotic resistance to ampicillin as marker (Figure 6; Figure 7).
15
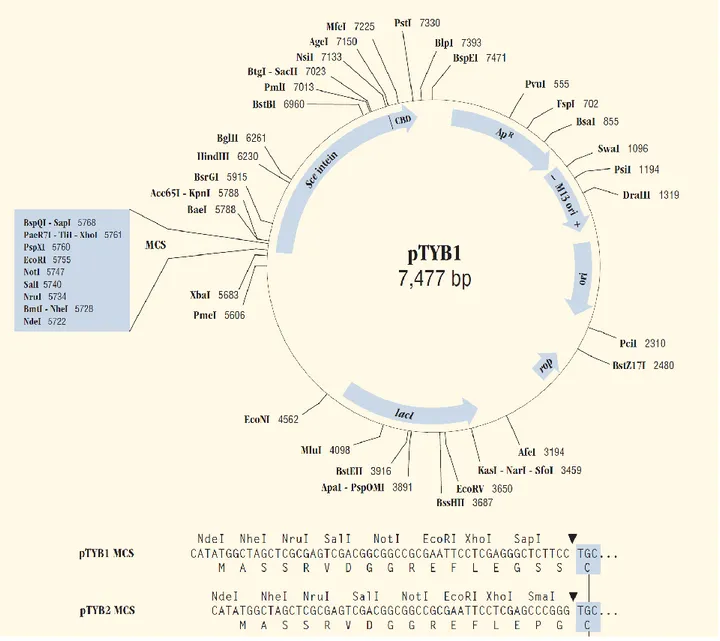
Figure 6 - pTYB1 map and multiple cloning sites.
16
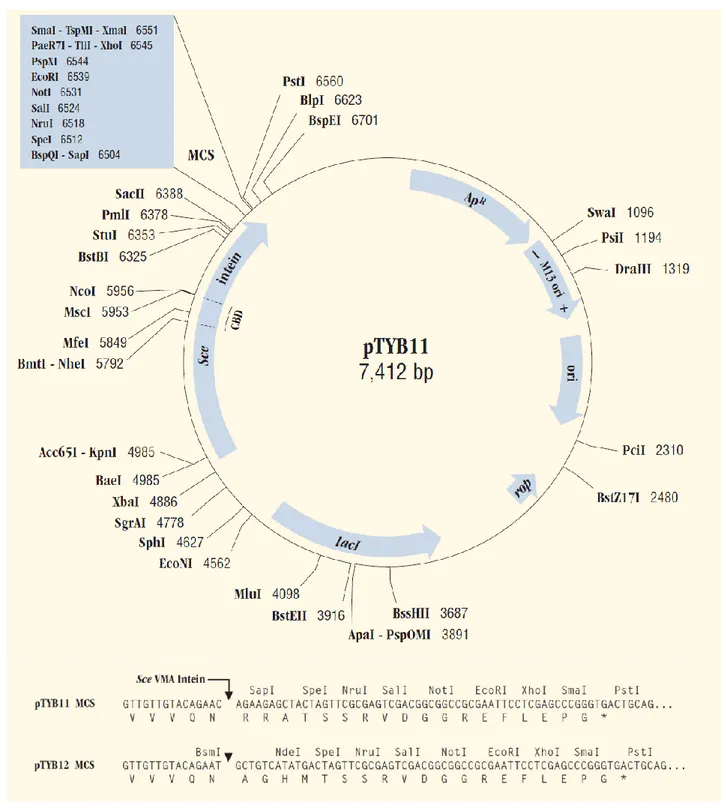
Figure 7 - pTYB11 map and multiple cloning sites.
pTYB12 map is identical except for the MCS region. Sequence file available at www.neb.com. Typo: one G in the GGT codon (glycine) before the NdeI restriction site (CATATG) is missing in the pTYB12 MCS sequence.
17
o Vectors and insert digestion, gel extraction and CIAP treatment
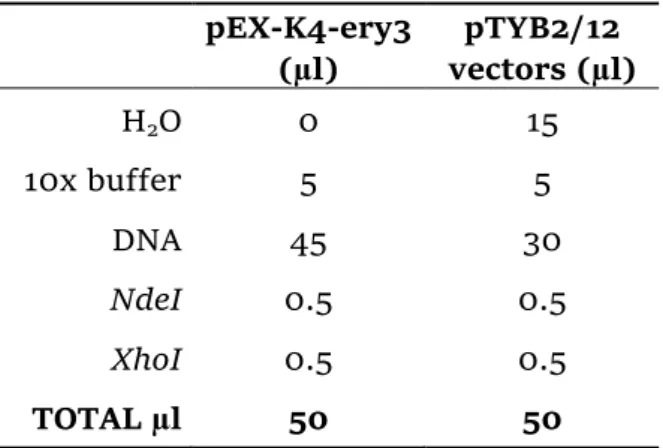
The pEX-K4-ery3 plasmid and the pTYB2/12 vectors were digested with the restriction enzymes NdeI and XhoI (Enzynomics co. Ltd.). The compositions of the digestion reaction mixtures are reported in Table 1. After an incubation of about 2 hours and half at 37 °C, the pEX-K4-ery3 was run on a 1% agarose gel (DNA gel) for 25 min at 100V in TAE buffer, using the 2-Log DNA ladder (New England BioLabs® Inc.) as standards.
The FavorPrepTM Gel/PCR Purification Kit (Favorgen® Biotech corp.) was then used to extract the ery3 insert from the gel. According to the “Gel extraction protocol” supplied with the kit, the gel slice containing the target DNA was transferred into a microcentrifuge tube and added with 500 µl of lysis buffer (FADF), mixed by vortexing and incubated at 55 °C until completely dissolution. The sample mixture was then transferred to a FADF column and centrifuged at full speed for 30 sec. After a washing step with 750 µl of Wash buffer ethanol added, the sample was eluted in 50 µl of sterile water.
Table 1 - Digestion mixture compositions.
pEX-K4-ery3 (µl) pTYB2/12 vectors (µl) H2O 0 15 10x buffer 5 5 DNA 45 30 NdeI 0.5 0.5 XhoI 0.5 0.5 TOTAL µl 50 50
Table 2 - CIAP treatment mixture composition.
All samples (µl) 10x buffer 5.5 CIAP 0.5 DNA 50 TOTAL µl 56
Calf-intestinal alkaline phosphatase (CIAP) treatment was performed for all the vectors and the insert, in order to avoid self-ligation. The composition of reaction mixtures is reported in Table 2. After an incubation of 1 hour at 37 °C, all the samples were purified following the “PCR Clean-up protocol” supplied with the
FavorPrepTM Gel/PCR Purification Kit. Briefly, each mixture was added with 5 volumes of FADF buffer, mixed and transferred to a FADF column. Hereinafter the
18
o Ligation, DH5α E. coli cells transformation and screening
To calculate the insert:vector molar ratio before the ligation reaction, all the CIAP-treated samples were run into a DNA gel, and the DNA ladder was used to estimate the sample molar mass. Two illustrative reaction mixtures compositions are reported in Table 3. When the vector concentration was too low to be clearly visible on gel, the maximum volume possible for that vector into the ligation mixture was considered (“blind ratio”). Ligation reactions without insert served as background control during the colonies count (see below). The reaction lasted for 1 hour at room temperature and then overnight (or over the week end if needed) at 4 °C. For this protocol the T4 DNA ligase was provided by Takara Bio Inc.
Table 3 - Ligation reaction mixtures compositions.
insert:vector 2:1 ratio (µl) vector only (µl) insert:vector blind ratio (µl) vector only (µl) H2O 6 8 0 2 10x buffer 1 1 1.5 1.5 Insert 2 0 2 0 Vector 1 1 11 11 Ligase 0.3 0.3 0.5 0.5 TOTAL µl 10 10 15 15
DH5α E. coli competent cells were then transformed with the ligation mixtures as follows: each ligation mixture was added with 200 µl of thawed cells and incubated on ice for 35 min. After a 1 min heat shock at 42 °C, the samples were cooled down immediately on ice again, added with 800 µl of SOB medium containing 20 mM glucose (SOC), inverted well and incubated under shaking at 37 °C for 1 hour. The cells were then descended by spinning down for 5 min at 2000 rpm, 900 µl of supernatant were discarded and the cells resuspended by pipetting into the 100 µl left medium. The resuspended cells were then plated on LB+amp plates and incubated at 37 °C overnight.
To quickly check the plates for positive clones, the “Colony PCR screening” procedure was performed. Depending on the colonies count in the test plates and in the corresponding background control plates, 4 to 15 colonies for each test plate
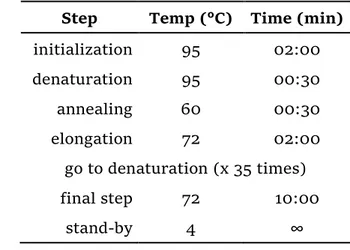
19 were screened. Each colony was picked with a toothpick and dissolved in 10 µl of sterile water. The same toothpick was then streaked on a Master plate and the latter was incubated at 37 °C. The vector-specific primers used for the reaction are listed in Table 4, while the composition for each reaction mixture and the thermocycling program are reported in Table 5 and Table 6 respectively.
Table 4 - Colony PCR vector-specific primers.
*T7 Universal primer
Primer Sequence
pTYB2 forward* 5'-TAATACGACTCACTATAGGG-3' pTYB2 reverse 5'-GAGGTTGGTAATAAGGTCATGGGT-3' pTYB12 forward 5'-CCCGCCGCTGCTTTTGCACGTGAG-3'
pTYB12 reverse 5'-AATGCGCTCATCGTCATCCTCGGCACCGTC-3'
Table 5 - Colony PCR reaction mixtures.
for each reaction (µl)
H2O 15 10x buffer 2 10 mM dNTPs 0.4 Primer forward 0.8 Primer reverse 0.8 DNA polymerase 0.1 Dissolved colony /empty vector 1/0.5 TOTAL µl 20
Table 6 - Colony PCR thermocycling program.
Step Temp (°C) Time (min)
initialization 95 02:00 denaturation 95 00:30 annealing 60 00:30 elongation 72 02:00 go to denaturation (x 35 times) final step 72 10:00 stand-by 4 ∞
Positive candidates were then cultured again, starting from the dissolved colonies or from the Master plate, into 15 ml LB+amp medium, the plasmid DNA was extracted and purified as described in §Plasmid DNA extraction and purification (Miniprep) and sent for sequencing (SolGent co., Ltd.). For this PCR protocol the SolgTM e-Taq DNA polymerase (SolGent co., Ltd.) was used.
20
Removal of the signal sequence for protein secretion
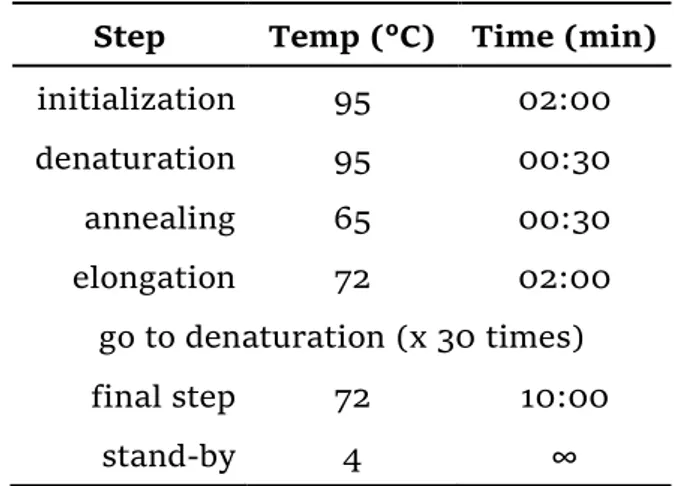
The N-ter signal peptide for protein secretion in the native organism could affect the solubility of the recombinant protein into the host organism. With the aim to increase the protein solubility, another gene was obtained, called ery3spΔ, in which the signal sequence for protein secretion was removed (see Figure 4). The pTYB2-ery3-HA construct was used as template and the insert was amplified with the primers pair shown in Table 7. PCR reaction mixture and thermocycling program are reported in Table 8 and Table 9 respectively. The PCR product was purified according to the “PCR Clean-up protocol” already mentioned, digested with NdeI and XhoI restriction enzymes and inserted into pTYB2/12 vectors following the same procedures described above (§DNA subcloning). Positive candidates were verified by sequencing (SolGent co., Ltd.) and glycerol stocks were made from Master plate for verified candidates.
For this PCR protocol the Solg™ Pfu-X DNA Polymerase (SolGent co., Ltd.) was used. AllInOneCycler™ thermocycle and primers were purchased from Bioneer Co.
Table 7 - PCR insert-specific primers.
Restriction sites for NdeI (forward) and XhoI (reverse) are in bold underlined.
Primer Sequence
NdeI_F70 (forward) 5'-ACACATATGGCGATTGGCCCGATTGCGGAC-3' XhoI_R1593 (reverse) 5'-AAACTCGAGTGCAATACCGCCACGATCGG-3'
Table 8 - PCR reaction mixture.
µl H2O 32.5 10x buffer 5 10 mM dNTPs 2 Primer forward 4 Primer reverse 4 DNA polymerase 0.5 Dissolved colony /empty vector 2 TOTAL µl 50
Table 9 - PCR thermocycling program.
Step Temp (°C) Time (min)
initialization 95 02:00 denaturation 95 00:30 annealing 65 00:30 elongation 72 02:00 go to denaturation (x 30 times) final step 72 10:00 stand-by 4 ∞
21
Protein expression and purification
The ery3 and ery3spΔ clones were then used to overexpress the ERY3 laccase isoform into E. coli competent cells, and purify it adopting a single-step chromatographic strategy. The IMPACTTM system (“Intein-Mediated Purification with an Affinity Chitin-binding Tag”, New England BioLabs® Inc. #E6901) utilizes the inducible self-cleavage ability of protein splicing elements (inteins) to separate the target protein from the affinity tag without proteases, and a chitin binding domain (CBD) for the affinity purification of the fusion protein on a chitin resin (Figure 8). The intein on-column cleavage is induced by a thiol reagent such as β-mercaptoethanol (βME). The pTYB2/12 vectors (Figure 6, Figure 7) allow for the fusion of the intein tag at either the C-terminus, or the N-terminus of a target protein, and all of them contain the T7 promoter for high level expression in E. coli strains such as BL21 (DE3).
Figure 8 - IMPACT system schematic representation.
22
o Small scale protein expression protocol
A preliminary protein expression step (named “small scale”) was carried out to optimize the expression conditions before the larger volume protein production and purification.
E. coli BL21 (DE3) cells were transformed with the pTYB2/12 plasmids, containing the ery3, or the ery3spΔ insert, following the same protocol as with DH5α strain for cloning purpose (§Ligation, DH5α E. coli cells transformation and screening), but starting from 2 to 5 µl of pure plasmid DNA, instead of 10 µl of ligation mixture, and streaking the cells on the plates, instead of spread them.
At least three candidates from the well-growth colonies were precultured in 5 ml of LB+amp and 0.8 to 1.6 ml of each preculture were then inoculated into 15 ml LB+amp using a baffled flask. The cultures were incubated with shaking at 37 °C until they reached an OD600 of 0.4-0.6, then they were cooled down on ice to about 15 °C and added with IPTG as expression inducer to a final concentration of 125 µM. The induction was then carried on for 4 to 6 hours at 12 °C with shaking.
The cells were harvested by centrifuging for 4 min at 7000 rpm, 4 °C, and frozen for at least 2 hours at -80 °C. Thawed cells were resuspended into 1 ml of 20 mM TRIS/HCl pH 8.5, 500 mM NaCl (“Column buffer”) containing 0.1% of Triton-X 100, added with PMSF to a final concentration of 1 mM, or a tablet of protease inhibitors cocktail (§Protein stability in the medium and proteases inhibition), and stood on a rocker for 20 min on ice. The resuspended cells were sonicated for 2 min on an ice-chilled water bath and cell debris was spun down for 10 min, at 13000 rpm, 4 °C.
Both the cell pellet and the supernatant were checked for the presence of the fusion protein. For the plasmids containing an immun0affinity tag (HA or 6xHis), the SDS-PAGE analysis and the immunoblotting (Western blot) gave us information about the protein size and solubility directly from the cell lysate. For the plasmids without immuno-tag, only the SDS-PAGE analysis was performed, but the proteins were transferred from the gel to a PVDF membrane and stored for future analysis with laccase-specific antibodies (§Bradford assay, SDS-PAGE and Western blot analysis). OD600 and UV-Vis measurements were carried out using a Jenway Genova UV-Vis spectrophotometer.
23
o Large scale protein expression and purification protocol
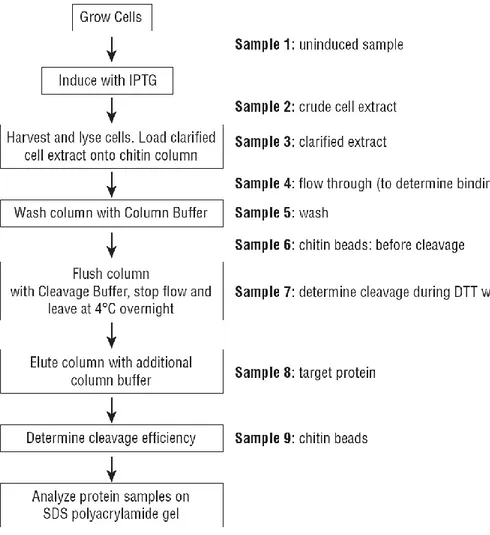
In Figure 9 it is shown a flow chart for the protein expression and purification protocol provided with the IMPACTTM system manual (www.neb.com).
The best transformant from the small scale protocol was cultured again in 250 ml of LB+amp as a preculture for the large scale protocol. An aliquot of the fresh preculture was stocked at -80 °C with 30% glycerol. From the 250 ml preculture, 20 ml were inoculated into 0.8 to 1 L of LB containing 100 mg/L ampicillin, into 2-L baffled flasks, for a total culture volume of 4 to 8 L, and incubated overnight at 37 °C with 180 rpm shaking, until the culture reached an OD600 of 0.4. Culture flasks were cooled down on ice to about 10 °C. At that point the Sample 1 (S1, uninduced sample) was prepared, taking 6 ml of uninduced culture, harvesting cells by spinning down for 5 min at 7000 rpm and freezing them until resume for SDS-PAGE analysis. The induction was then started with IPTG 125 µM as for the small scale protocol and the culture was incubated at 10-12 °C for 6 to 16 hours.
24 The Sample 2 (S2, crude cell extract) was taken before harvesting the cells and freezing them at -80 °C for at least 1 hour (when the ery3 gene was expressed, the culture broth was also tested for protein secretion, and thus the 0.8-1 L culture broth was not discarded). Thawed cells were resuspended in 150 ml of Column buffer on ice for at least 1 hour, added with PMSF 1 mM every 30 min, 0.15 µM Aprotinin, 1.45 µM Pepstatin A and 2.1 µM Leupeptin. Resuspended cells were sonicated for about 2 min x 20 times, under continuous stirring on an ice-chilled water bath, added with 1 mM PMSF every 30 min. Cell debris was removed by spinning down at 4500 xg for about 30 min. Again the cell lysate was sonicated for 1 min, spun down for additional 30 min and then filtered with 0.45 µm sterile vacuum filter (Corning®) in a 250 ml sterile bottle, for better clarifying the sample. At that point the Sample 3 (S3, clarified extract) was prepared before column loading, mixing 20-50 µl of sample with 4-10 µl of 6x SDS loading buffer containing 2% βME, and freezing it until resume.
Gravity flow column packed with 10 ml of chitin resin was then loaded very slowly at 4 °C with either the clarified lysate, or the culture broth without cells when the protein secretion was tested. Just before the end of the loading step, the Sample 4 (S4, flow through) was collected. The unbound proteins were removed by a first washing step with Column buffer containing 0.1% of Triton-X 100, which was left flow through the column very slowly overnight, and an additional washing step with at least 250 ml of Column buffer without detergent. Just before the end of the second washing step, the Sample 5 (S5, wash) was collected. An optional washing step with 100 ml Column buffer containing ATP 5 mM and MgCl2 5 mM was also performed to get rid of the chaperones eventually bound to the recombinant protein. At that point the Sample 6 (S6, chitin beads before cleavage) was taken. The on-column intein self-cleavage was induced by incubating the column with 20 ml of Column buffer containing βME 107 mM for about 60 hours at 4 °C. The target protein was then eluted in 50 ml Column buffer, dialysed and concentrated to 0.2-1 ml using the Amicon Ultra-15 Centrifugal Filters. Bradford protein assay was performed to estimate the protein concentration before SDS-PAGE analysis. At that point Sample 7 (S7, eluted protein) and Sample 8 (S8, chitin beads after cleavage) were taken.
25
o Bradford assay, SDS-PAGE and Western blot analysis
The Bio-Rad Quick Start™ Bradford Protein Assay was used to check the protein concentration, with the BSA as standard in the range of 0 to 2 mg/ml. The concentration analysis allowed calculating the sample volume to be loaded on the SDS-PAGE gel for having 10 µg of total protein amount.
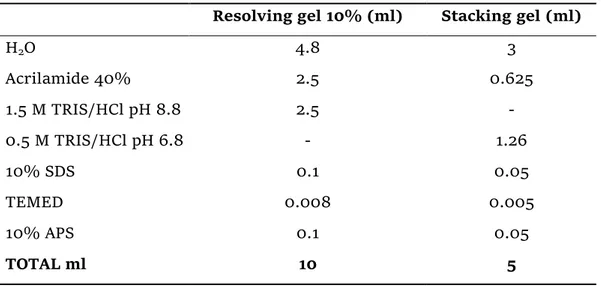
SDS-PAGE and Western blot were carried out using the Bio-Rad Mini-PROTEAN® Tetra Cell system and Tetra blotting module. A 10% acrylamide gel was prepared following the recipe reported in Table 10. Samples S1 and S2 were prepared as follows: the frozen cells were thawed and resuspended into 1 ml of Column buffer with detergent, transferred into a microcentrifuge tube, sonicated for 1 min and spun down for 5 min at 3000 rpm, 4 °C. The supernatant was then transferred into a new tube, centrifuged for 10 min at 12000 xg, 4 °C, and again the supernatant was transferred into another tube. These will be supernatant samples SS1 and SS2. For the pellet samples SP1 and SP2 the cell debris was resuspended into the same Column buffer volume (1 ml), but without detergent. For all the samples except the S6, 24 µl total volume were made by 20 µl sample + 4 µl of 6x SDS loading buffer containing 2% βME. All the samples were heated at 95 °C for 5 min and run on the gel at 40A for about 1 h 30 min, using the Thermo Scientific PageRuler™ Prestained Protein Ladder, 10 to 180 kDa, and the Trametes versicolor commercial laccase as standards. Gel was stained with Coomassie Blue G-250 dye and scanned using a clear file.
Table 10 - SDS-PAGE gel composition.
Resolving gel 10% (ml) Stacking gel (ml)
H2O 4.8 3 Acrilamide 40% 2.5 0.625 1.5 M TRIS/HCl pH 8.8 2.5 - 0.5 M TRIS/HCl pH 6.8 - 1.26 10% SDS 0.1 0.05 TEMED 0.008 0.005 10% APS 0.1 0.05 TOTAL ml 10 5
26 When the immuno-tag was available, the immunoblotting analysis was also performed. PVDF membrane pre-wet with methanol 100%, or nitrocellulose membrane was soaked into the Transfer buffer (25 mM TRIS base, 190 mM glycine) for 5 min and the transfer cassette (“sandwich”) was assembled as shown in Figure 10. Protein transfer ran at 100V for 1 hour in cold Transfer buffer. After the run, the membrane was rinsed with TBST buffer (50 mM TRIS base pH 7.6, 150 mM NaCl, 0.05% Tween-20), stained with Ponceau S solution (0.25% Ponceau S, 40% Methanol, 15% Acetic acid) for 5 min, rinsed again with MilliQ water and scanned using a clear file. Protein detection was performed using the chemiluminescence reaction involving the horseradish peroxidase (HRP) and one of its specific substrates. The membrane was incubated on shaking for at least 1 hour in 50 ml of Blocking buffer (5% Skim milk in TBST buffer), then in a solution made of Blocking buffer and the appropriate concentration of the primary rabbit anti-6xHis antibodies, unconjugated, or the rabbit anti-HA HRP-conjugated antibodies. The incubation lasted at least 1 hour at room temperature, or overnight at 4 °C on shaking, followed by a washing step in TBST buffer. When the anti-6xHis antibodies were used, a second incubation with the goat anti-rabbit IgG-HRP secondary antibodies was performed, followed by a second washing step in TBST buffer.
The chemiluminescence reaction was carried out using the Thermo Scientific SuperSignalTM West Femto Maximum Sensitivity Substrate, or the SuperSignalTM West Pico Substrate, by mixing with a 1:1 ratio the two reagents supplied in the kit for a total volume of about 0.7-1 ml and incubating the membrane with this reaction solution for about 30 sec to 1 min at room temperature. Signal image was then acquired with a Davinch Western Image System.
27
Laccase immobilization on hydrogel film
The laccase immobilization into hydrogel films composed of Acrylamide (AAm, Sigma Chemical Co, Milan, Italy) and Polyethylene Glycol Dimethacrylate 750 (PEGDMA, Sigma Chemical Co, Milan, Italy) was performed at the Department of Pharmacy, Health and Nutritional Sciences, University of Calabria, Rende (CS), according to the literature [Vittorio et al. 2016] with slight modifications.
Briefly, 534 mg Acrylamide were dissolved in 3 ml sodium citrate 3 mM pH 5, containing 0.3 ml of the Ery4 laccase isoform overexpressed in yeast and purified by anion exchange chromatography (§Purification by gravity flow Anion Exchange Chromatography). Then, 466 mg of PEGDMA and 20 mg of ammonium persulfate (NH4)2S2O8 were added as cross-linker and thermo-initiator, respectively. The solution was poured in a polymerization cell formed by two 10 x 10 cm2 glass plates, separated with Teflon spacers (thickness 1.6 mm), brought together using binder clips. The mixture was reacted at 40 °C for 18 h and the obtained hydrogel (labelled HEry4) was extensively washed with water to remove unreacted species and, then, dried for 12 h in an oven under vacuum at 40°C. Control hydrogels (labelled Hctrl) were also synthesized when the polymerization was performed in the absence of laccase.
The hydrogel swelling degree, protein amount determination and reusability assays were performed as already reported in , while for the enzymatic activity assay, the protocol used was the one described in §Protein assay and enzymatic activity assay.
28
Mycotoxin degradation with Ery4 laccase isoform and redox mediators
Mycotoxin degradation assay with the enzyme free in solution
Degradation assays were carried out at the Institute of Sciences of Food Production (ISPA-CNR) in Bari. An in vitro screening for different mycotoxins degradation with different mediator systems was performed in sodium acetate buffer 1 mM pH 5 by adding 5 U/ml of Ery4 and 1 or 10 mM of each mediator (see Table 11). Mycotoxin degradation was evaluated by HPLC analysis after 72 h of static incubation at 25°C. Toxin concentrations used are reported in Table 12. Remaining toxin was calculated with respect to the control not containing the enzyme.
As a further optimization starting from the screening results, a time course of the aflatoxin M1 (AFM1) degradation was performed in sodium acetate buffer 1 mM pH 6.5, by adding 0.036 ng/ml of AFM1, 5 U/ml of Ery4 laccase and 10 mM of syringaldehyde (SA) as mediator, for the preliminary evaluation in buffer, and then directly on food matrix, that is skim UHT milk (Granarolo, Italy) spiked with the same toxin concentration. Mycotoxin degradation was evaluated by HPLC analysis after 30 min to 3 days of static incubation at 25°C. For chemical analyses refers to Loi et al. 2016. All the reagents were provided by Sigma-Aldrich, Milan, Italy.
Mycotoxin degradation assay with the immobilized enzyme
Three U/g (dry weight) of Ery4 laccase were immobilized on acrylate hydrogel as described above (§Laccase immobilization on hydrogel film) and used for the in vitro study of the aflatoxin M1 (AFM1) degradation, as for the enzyme free in solution.
Two negative controls were considered, one containing only AFM1 and SA in buffer without enzyme (Ctrl buffer), one adding also the Hctrl, that is the hydrogel film without laccase (Ctrl film). As positive control, 1 U of Ery4 free laccase (Ery4 buffer) was incubated with the toxin and the mediator, and two sample replicates were prepared, with two different Hery4 film, called film A and film B, the former containing about 0.5 U of laccase and the latter about 1 U. The same films were recovered and reused twice (experiment #1 and #2) in a 20 days time lag, for testing also the reusability of the immobilized enzyme.
29 All the samples were hydrated overnight in MilliQ water. Each specimen was soaked in sodium acetate buffer 1 mM pH 5, on a Petri dish (Ø 5 cm), spiked with 36 ng/ml of AFM1 and added with 10 mM of syringaldehyde (SA). Samples were incubated under continuous shaking at 120 rpm, 25°C away from light. Mycotoxin degradation was evaluated by HPLC analysis after 3 h to 11 days.
In order to evaluate the possibility of an AFM1 adsorption on the hydrogel, the samples were washed with buffer solution and then with a solution of methanol:water 80:20 (w/w). Both washing solutions were then checked for the presence of the toxin. Each step, washing and extraction, were performed for 1 h under shaking conditions.
For all the degradation assays with both free and immobilized enzyme, experimental data have been fitted by using an exponential decay model:
𝑐 = 𝑎𝑒
−𝑏𝑡 (2)where the b coefficient is related with the variation of the toxin concentration (c) during the time (t), and it was used as a mean to compare the enzymatic degradation rate between different experimental systems.
30
Table 11 - Redox mediators used for the in vitro degradation screening.
Mediator Concentration
(mM)
acetosyringone (AS) 1, 10
syringaldehyde (SA) 1, 10
p-coumaric acid (pCA) 1, 10
ferulic acid (FA) 1, 10
1-hydroxybenzotriazole (HBT) 1, 10
(2,2,6,6-tetramethylpiperidin- 1-yl)oxyl (TEMPO) 1, 10 2,2-azino-bis (3-ethylbenzothiazoline-6-sulfonic acid) (ABTS) 1, 10
Table 12 - Toxins used for the in vitro degradation screening.
Toxin Concentration (µg/ml) aflatoxin M1 (AFM1) 0.05 ochratoxin (OTA) 0.5 aflatoxin B1 (AFB1) 1 deoxynivalenol (DON) 1 fumonisin B1 (FB1) 1 patulin (PAT) 1 T-2 (not abbreviated) 1 zearalenone (ZEN) 1
31
Antimicrobial activity of lysozyme crystals growth on hydrogel
membrane composites (HMCs)
Hydrogel composite membranes (HCMs) preparation
Hydrogel composite membranes (HCMs) were prepared at the Institute of Membrane Technology (ITM-CNR), Rende (CS) as described in Di Profio et al. 2014. Commercial hydrophobic polypropylene (PP) flat sheet membranes were purchased from Membrana Gmbh. Poly(vinyl alcohol) (PVA, average Mw = 150,000 g/mol; 98.9% hydrolysed) and poly(ethylene glycol) diglycidyl ether (PEGDE, average Mw = 500 g/mol) were obtained from Sigma-Aldrich, Milan, Italy.
Hydrogel composite membranes were prepared by the solution casting method as follow: PP flat sheet membranes were conditioned by soaking in methanol overnight at room temperature. Thereafter, they were dried between tissue papers. The PVA hydrogel solution 8% w/v was prepared by dissolving appropriate amount of PVA in distilled water with heating at 80 °C and constant stirring for 3 h. Then the cross-linker (PEGDE) 3 wt.% respect to PVA was added and mixed. The hydrogel solution was cast on the membrane surface using a manual film applicator adjusted at 50 µm thickness. Then the samples were placed in a thermostatic box at 30 °C to complete the cross-linking reaction.
Protein crystallization on HCMs
Hen egg white lysozyme (HEWL, code L4919), sodium chloride (code 13423) and sodium acetate (code 71183) were purchased from Sigma-Aldrich, Milan, Italy. PEG 4k was purchased from Hampton Research (code HR2-605).
HEWL was crystallized at 20 °C using the sitting-drop vapour diffusion technique. PP membrane and PP/PVA hydrogel composite membrane pieces of about 1 cm2 were stuck to sitting-drop bridges (Molecular Dimension, Newmarket, England, UK) on each VDX™ crystallization plate well (Hampton Research, Aliso Viejo, California, USA). A 10 μl drop of crystallization solution was put at the centre of each support. Drops were prepared by mixing 5 μl of protein solution with an equal volume of a reservoir solution. Three different crystallization conditions were implemented: 40 mg/ml protein solution in sodium acetate 0.1 M pH 4.6 and sodium chloride 3.5 %
32 as precipitant agent, referred to as the crystallization condition 1; 40 mg/ml protein solution in sodium acetate 0.1 M, pH 4.6 and sodium chloride 7%, as crystallization condition 2; 26 mg/ml protein solution in sodium acetate 0.5 M pH 4.2 with sodium chloride 5% and poly(ethylene glycol) 4k (PEG 4k) as crystallization condition 3. A HEWL solution was used as positive control in the antimicrobial activity test while PP and PP/PVA-HCM without HEWL were used as negative controls. Each crystallization condition was tested on glass without supports, on PP only and on PP/PVA-HCM, by preparing four drops for each test. Drops were equilibrated against 500 μl reservoir for few days.
Crystal growth was monitored by a Multizoom AZ100 microscope with Digital Sight Camera Control Unit DS-U, Nikon, in transmission mode for drops on glass, in reflecting mode for drops with membrane supports.
o Crystal dissolution rate analysis
Direct method for estimate crystals lifespan in solution consisted in monitoring under microscope the dissolution of both single crystal on glass, and many crystals in a single drop on PP and PP/PVA-HCM supports. In the first setup, a single HEWL crystal of 200-500 µm length was picked up with a loop from a drop on glass and moved in a new clear drop of 10 µl phosphate buffer, the same used for activity test. Also the dissolution of a single crystal in about 400 µl buffer volume was monitored, seeking the same surface:volume ratio as in the activity tests, in which a total of 20 to 50 crystals per trial were present in 8 ml of buffer. The drop was observed under transmitted light and pictures were taken every 1-5 min with the digital camera until complete dissolution. For crystals on membrane supports, a single drop on the membrane piece was stick to the bottom of a crystallization plate well and 2 ml buffer were then added slowly and carefully far from the drop. The crystals were observed under reflected light and pictures were taken every 5-10 min.
Indirect method consisted in measuring the HEWL concentration in buffer, which was expected to increase over the time during the crystals dissolution. The Protein A280 pedestal option in the UV-Vis NanoDrop 2000c Spectrophotometer (Thermo Fisher Scientific, Milan, Italy) was used, with default MW and parameters for Lysozyme, already set in the software. Both static and stirred setup were tested: the
33 former was obtained carefully resting one membrane-supported drop on 2 ml buffer surface, in a crystallization plate well, simultaneously taking the T0 sample, while the latter was made to reproduce the same setup as in the activity test, i.e. 4 membrane pieces, all supporting protein crystals, were put into a conical test tube containing 8 ml buffer and then it was kept under continuous stirring.
Antimicrobial activity of crystallized lysozyme
Antimicrobial activity assays were performed at the Department SAFE, University of Foggia. HEWL activity has been determined by measuring the decrease in absorbance of a Micrococcus lysodeikticus (ATCC 4698, Sigma, Milan, Italy) culture incubated with the tested sample [Shugar, 1952]. A suspension of lyophilized cells was growth at room temperature in 8 ml of 0.1 M sodium phosphate buffer pH 6.8 to reach a cell concentration of 107 cells/ml. The obtained cell culture was brought in contact with 4 membrane pieces of about 1 cm2 from each crystallization condition. The ratio between solution volume and membrane surface was 2:1.
Two HEWL solutions were used as positive controls. The first was prepared so that to contain the same amount of protein present in the tests with membrane supports for the crystallization conditions 1 and 2, i.e. 0.8 mg (each test was made of 4 drops containing each 5 µl of a 40 mg/ml protein solution). A 0.1 mg/ml HEWL solutions was then obtained in 8 ml of 0.1 M phosphate buffer at pH 6.8. A second HEWL solution (HEWL low) was prepared with a protein concentration lower than 0.1 mg/ml, to test the trend of the absorbance curve in this conditions.
The bacterial culture only and the culture incubated with membrane supports without HEWL were used as negative controls, the latter both with and without crystallization reservoir solution, to check if that solution could serve itself as an additional antimicrobial agent.
Cellular lysis was monitored under continuous stirring by the decrease in absorbance at 450 nm (OD450) until a constant value was reached (spectrophotometer UV 1601, Shimadzu model 1642, Shimadzu Europe Ltd., Duisburg, Germany). Each UV measurement was conducted in technical triplicates.
34
o Antimicrobial efficacy determination
The average values have been calculated from the three values of each UV measurement. Experimental data have been fitted by using the Gompertz equation as modified by Zwietering et al., 1990:
1)
(
A t e eAe
K
t
I
(3)where I(t) is the normalized absorbance at time t, obtained by dividing the absorbance measured at time t by that measured at t=0, λ can be interpreted as the lag time, and µ as the maximal decrease rate, which can be taken as a measure of the antimicrobial activity. The parameters K, A, µ and λ have been determined by a least square fitting procedure, implemented as a script of the Root package (Brun & Rademakers, 1997).
35
36
Results
Purification of fungal laccase isoforms overexpressed in yeast
Protein overexpression and purification by FPLC
The pre-filtrated culture broth was concentrated to a final volume of about 50 ml in pH 7 buffer (referred to as “mother sample”). The average total protein concentration in the mother sample for different batches was around 80 µg/ml, that is 4 mg total amount protein. The average enzymatic activity in the mother sample was around 5 U/ml, that is 250 U total. Either an aliquot, or the whole mother sample was then fractionated by Anion Exchange Chromatography (AEC) runs, at the beginning with a linear gradient of 0 to 100% NaCl 1 M. Best results are shown in Figure 11. The laccase eluted with 20 to 50% of NaCl 1 M, and the SDS-PAGE gel for fractions with enzymatic activity indicated the presence of different laccase populations, such as aggregates and multimeric forms. Notably, the smear at higher molecular weights, which retains also the highest enzymatic activity, is considered to be due to the overglycosylation occurring in the host organism, while the lower enzymatic activity detected in the fractions with the 60 kDa band on gel, that is the expected size for the laccase monomer, can be explain either by a lower protein concentration, or by the absence of glycosylation in those samples, which could affect the protein stability, or the substrate recognition and recruitment. A potential role for the glycosylation in laccases should be elucidated.
An isocratic step-flow AEC run (Figure 12A) confirmed that the most of laccase eluted with 20 to 30% NaCl 1 M. Enzymatic activity (not shown) was detected only in fractions under the first and second absorbance peak in the chromatogram. All fractions under the peaks were loaded on SDS-PAGE gel (Figure 12B), which confirmed the presence of a smear, a band of about 120 kDa (a putative laccase dimeric form) and two very close bands of about 55-60 kDa, compatible with the laccase predicted molecular weight of about 54 kDa.
It must be point out that when the purification by FPLC was carried out we were not aware about the fact that laccase gene names ery3 and ery4 were inverted by mistake, which was found out later as a result of further checks made by the authors and communicated to us. For this reason all the parameters were calculated
37 considering the Ery3 FASTA sequence, but actually the purified product was instead Ery4 with an estimated molecular weight of about 56 kDa and pI 5.96. The 35 kDa band is probably a truncated product of laccase translation, which retains a partial activity.
Figure 11 - Anion Exchange Chromatographic (AEC) run.
A) FPLC Chromatogram. Fractions 5 to 20 in linear gradient of 10 to 60% NaCl 1 M are shown. Green trapezia represent the colorimetric assay for enzymatic activity. B) SDS-PAGE. Red boxes show fractions with the highest enzymatic activity. C) Fractions data calculated by the ChromLabTM Software. Concentration, molarity and amount are referred to an ideal sample containing only laccase.
38
Figure 12 - Anion Exchange Chromatographic (AEC) run.
A) FPLC Chromatogram. Fractions 1 to 40 of an isocratic step-flow at 20 to 50% NaCl 1 M are shown. Enzymatic activity (not shown) was detected only in fractions under the first and second peak. B) SDS-PAGE. C) Fractions data calculated by the ChromLabTM Software. Concentration, molarity and amount are referred to an ideal sample containing only laccase. Lack of data for fractions 5 and 6 is due to a technical error in the fraction collector.
39
Fractions collected during AEC runs were then further fractionated on a Size-Exclusion Chromatography (SEC) column, in order to isolate a single laccase
population. However, even after several attempts, with different flow-rates and fraction volumes, it was not possible to obtain a single band on SDS-PAGE gel, with purity and concentration levels suitable for crystallization trials. Figure 13 and Figure 14 show two different SEC runs which gave similar results, starting from AEC fractions eluted with 30% (Figure 13) and 20% (Figure 14) NaCl 1 M. We concluded then that the presence of both overglycosylation and multimeric isoforms affected the protein separation during both SEC and SDS-PAGE runs.
Laccases from different sources in nature can be active as monomers, or multimeric forms, and in particular laccases from Pleurotus spp. are reported to be functional as monomers CIT, but due to the high concentration achieved after purification and the presence of free cysteines in the protein sequence available for disulphide bridges, dimers can be formed in the fractions and it can occur to find artificial bands on the gel. An intensive treatment with a reducing agent sometimes could solve the problem and restore the monomer fold, however in the case of an oxidoreductase with cysteines in the active site this strategy could also affect the function.
40
Figure 13 - Size-Exclusion Chromatographic (SEC) run.
A) FPLC Chromatogram. Fractions 2 to 16 of SEC1 are shown. Enzymatic activity (not shown) was detected in all fractions under the peaks. B) SDS-PAGE of fractions from two different SEC runs (SEC2 chromatogram not shown). C) Fractions data calculated by the ChromLabTM Software. Concentration, molarity and amount are referred to an ideal sample containing only laccase.
41
Figure 14 - Size-Exclusion Chromatographic (SEC) run.
A) FPLC Chromatogram. Fractions 1 to 41 are shown. B) SDS-PAGE. C) Colorimetric assay for enzymatic activity for fractions ranging from 3 to 33. The darker green color, the more activity in the sample. D) Fractions data calculated by the ChromLabTM Software. Concentration, molarity and amount are referred to an ideal sample containing only laccase.
42
o Protein stability in the medium and proteases inhibition
The protein stability in the mother sample was tested as described in §Experimental section. Results are shown in Figure 15. The average total protein concentration (µg/ml) was 61.5, 51.5, 63 and 64.5 for A, B, C and D respectively, compared to 61.8 µg/ml in the mother sample at initial time (T0), while the calculated enzymatic units (U/ml) were 5.6, 5.7, 5.5 and 5.7 for A, B, C and D respectively, compared to 8 U/ml in the M T0. It appears thus that even after 1 week (T1) of storage at 4 °C without protease inhibitors (A), the mother sample retained all its total protein content, compared to T0. Based on this result, we concluded that the low protein yield obtained during the purification was not due to a proteolytic cleavage occurring in the culture broth during the purification protocol, but rather to a low recombinant expression level in the host organism. The decrease in protein concentration observed in sample B is likely due to a freeze/thaw damage, while in samples C and D the protein concentration higher than in sample M can be explained considering that protease inhibitors are actually proteins and peptides themselves and probably some of them are more stable than laccase once thawed.
However, a loss in enzymatic activity was observed in all the aliquots with respect to T0, in particular in the defrosted samples, as expected because of the freeze/thaw damage. For this reason, the effective residual enzymatic units were checked just before use for each application. It is noteworthy that the mother sample tested was at pH 5, that is the optimal pH for laccase activity, while pH 7 buffer during purification steps. was chosen based on the predicted laccase pI.
Figure 15 - Protein stability assay.
M indicates the control sample at T0, A and B indicate aliquots stored for 1 week (T1) at 4 °C (A) and -20 °C (B)
without protease inhibitors, while C and D represent a biological duplicate of aliquots stored at -20 °C with a tablet of protease inhibitors cocktail.
43
Purification by gravity flow Anion Exchange Chromatography
The average total protein amount in the collected sample for different batches was about 2 mg (2 mg/ml) for 26 total enzymatic units (13 U/ml), starting from a 50 ml mother sample of about 4 mg total protein and 63 total U. Contrary to the purification by FPLC, in this case the protein pool was not further fractionated, in order to avoid a loss in enzymatic activity and keep together all the protein isoforms present in the sample, instead of obtaining a single protein population. Moreover, this time the protein was eluted in buffer pH 8, instead of the pH 7, because in the meanwhile we became aware that we were working on the Ery4 isoform, which has a computed pI of 5.96 (§Protein overexpression and purification by FPLC).
Although it has been observed that a high salt concentration in the sample (eluted with 0.3 M of NaCl) affected the enzymatic activity, on the other hand a moderate ionic strength can help in preserving the protein stability during the long term storage. For this purpose, the sample was stored at -20 °C without been dialysed, before using it for the immobilization protocol (§Laccase immobilization on hydrogel film), considering that the final NaCl concentration will be diluted later in the polymerization reaction mix.
44
Protein glycosylation analysis
N-glycosylation sites predicted in both Ery3 and Ery4 FASTA sequences are shown in Figure 16 and Figure 17. NetOGlyc 4.0 Server for O-glycosylation prediction (not shown) has detected 11 and 6 positive positions in the Ery3 and Ery4 sequences respectively.
As mentioned in §Protein overexpression and purification by FPLC, the presence on the SDS-PAGE gel of a smear in the fractions retaining the highest enzymatic activity, and the difficulties in isolating a single band with SEC run have been related to the overglycosylation that occurs when a recombinant protein is expressed in the host organism. The glycosylation analysis performed as described in §Experimental section have confirmed our hypothesis. Results are shown in Figure 18. AEC fraction eluted with 30% NaCl 1 M, incubated in the presence of N-Glycanase (lanes N, NS, NO, NSO) for 12 to 48 h at 37 °C, reduced the smear at molecular weights higher than 100 kDa, while Sialidase A and O-Glycanase (lanes S, O, SO) did not exert a significant effect. After 5 days incubation, some degradation occurred which has shift the protein band lower in the gel.
Crystallization of proteins for structural studies require large amount of pure sample which is often very hard to obtain, especially for recombinant protein overexpressed without tags for affinity chromatography. If that protein is also glycosylated in the host organism, the mission seems really impossible! Such a heterogeneity in protein isoforms and the low yield of protein expression in yeast was not compatible with the purpose of a structural investigation. To overcome these problems, then, we tried to overexpress this fungal laccase in bacteria, which are not able to perform post-translational protein modification.
45
Figure 16 - Predicted N-glycosylation in the Ery3 laccase isoform.
Upper: NetNGlyc 1.0 Server - prediction results (http://www.cbs.dtu.dk/services). Lower: Asparagines position in the Ery3 in silico structural model. Yellow beads represents the copper ions in the active site. Residue numbers refer to the full length sequence containing the N-ter signal peptide.
46
Figure 17 - Predicted N-glycosylation in the Ery4 laccase isoform.
Upper: NetNGlyc 1.0 Server - prediction results (http://www.cbs.dtu.dk/services). Lower: Asparagines position in the Ery4 in silico structural model. Yellow beads represents the copper ions in the active site. Residue numbers refer to the full length sequence containing the N-ter signal peptide.
47
Figure 18 - Deglycosilyation assay.
SDS-PAGE gels show fraction eluted with 30% NaCl 1 M in AEC run, incubated with different combinations of deglycosylation enzymes at 37°C for 12h, 24h, 48h and 5 days (5d). F = fraction not deglycosylated. D = sample completely deglycosylated with denaturing protocol (see §Experimental section).
48
Overexpression in Escherichia coli and purification of the Ery3 laccase
isoform
Cloning for ery3 gene was successful in all the vectors (Figure 19). However, when expressed in E. coli, both the HA and His-tagged Ery3-intein fusion proteins were detected mainly in the pellet, i.e. not in a soluble active form, and most of them at a different size than expected (Figure 20). Only for the pTYB12-ery3-HA plasmid, a band at the right size was detected in all the candidates, but due to the gel symmetry, it was unclear if the protein was in the pellet, or in the supernatant. In any case, we decided to go ahead with a large scale expression for that plasmid and the purification for the Ery3-HA protein (Figure 21). Unfortunately, no enzymatic activity was present in the collected fraction and some problem occurred with the chemiluminescence analysis, so that it was not possible to verify that the protein in the purified fraction was actually laccase, also because the intein tag itself has a similar size to laccase and the band detected on gel could be ascribed to both proteins.
Figure 19 - Colony PCR screening for ery3 subcloning.
A) pTYB12 / pTYB12-6xHis; B) pTYB12-HA; C) pTYB2 / pTYB2-6xHis; D) pTYB2-HA.
pTYB2-ery3-HA and pTYB2-ery3-6xHis plasmids were kindly provided by Dr. Masayo Morishita. Expected size empty MCS pTYB2/pTYB12 = 250/440 bp; expected size MCS+ery3 = 1.8/2.0 kb.
49
Figure 20 - SDS-gel run and WB for pTYB2/12-ery3-HA/6xHis small scale overexpression.
WB – Protein transfer at 100V 1h, PVDF membrane 0.45 µm, from SDS-PAGE 10%. Chemiluminescent substrate: SuperSignal FEMTO (Thermofisher).