Validazione e analisi dei gas di fissione in
combustibili MOX ad elevato burnup
D. Rozzia, N. Forgione, A. Ardizzone, A. Del Nevo
Report RdS/2013/023 Agenzia nazionale per le nuove tecnologie,
VALIDAZIONE E ANALISI DEI GAS DI FISSIONE IN COMBUSTIBILI MOX AD ELEVATO BURNUP
D. Rozzia, N. Forgione (UNIPI), A. Ardizzone (POLITO), A. Del Nevo (ENEA)
Settembre 2013
Report Ricerca di Sistema Elettrico
Accordo di Programma Ministero dello Sviluppo Economico -‐ ENEA Piano Annuale di Realizzazione 2012
Area: Produzione di energia elettrica e protezione dell'ambiente
Progetto: Sviluppo competenze scientifiche nel campo della sicurezza nucleare e collaborazione ai programmi internazionali per il nucleare di IV Generazione
Obiettivo: Sviluppo competenze scientifiche nel campo della sicurezza nucleare Responsabile del Progetto: Mariano Tarantino, ENEA
Il presente documento descrive le attività di ricerca svolte all’interno dell’Accordo di collaborazione “Sviluppo competenze scientifiche nel campo della sicurezza nucleare e collaborazione ai programmi internazionali per il nucleare di IV generazione” Responsabile scientifico ENEA: Mariano Tarantino
Abstract
The present document constitutes the contribution LP2.a.3_b to the task A.3 of ADP-2012. The aim of this report is the assessment of TRANSURANUS code version 2012 in simulating MOX fuel behavior with particular reference to the FGR phenomenon. This type of fuel has been selected as fuel for both GEN-IV systems as ALFRED or ASTRID and advanced thermal reactors as EPR. Since fuel pin mechanics codes are usually based on empirical correlations obtained from experiments, their applicability to new designs should be demonstrated by verification and validation processes. This complex task requires the large use of experimental databases. Due to the un-availability of public databases on FR fuel, the first step, is verification and validation of fuel pin mechanic codes against thermal reactor public databases. The International Fuel Pin performance Experimental database (IFPE) aims to provide in the public domain, a comprehensive and well-qualified database on Zr clad UO2 – MOX fuel for model development and validation. Two experimental databases in the burn-up range from 25 - 30MWd/kgMOX have been selected from the IFPE to fulfil the objective: the PRIMO experiment (1 rod) and IFA-597 experiment (2 rods). They have been released for benchmarking purpose.
The PWR Reference Irradiation of MOX Fuels (PRIMO) program sought to investigate the MOX fuel behavior under steady-state and transient conditions. It started in 1986. The aims were to investigate the capability of MOX to sustain normal operation conditions typical of commercial PWR, to study thermal and irradiation induced phenomena occurring in fuel and to obtain thermo-mechanical data under power ramp conditions. The PRIMO program included sixteen MOX fuel rods manufactured through different fabrication processes and ramp-tested at different burn-up levels between 20 and 60 MWd/kgHM. The irradiation history and the experimental data of one fuel rod named BD8 from the PRIMO program was included in the International Fuel Performance Experimental Database and released for benchmarking purpose. It was base-irradiated in the BR2 Pressurized Water cooled Reactor (PWR) at an average linear power of 18.5 kW/m up to a burn-up of about 30 MWd/kgHM. The fuel rod then underwent a ramp test in the Osiris PWR up to a peak linear power of 39.5 kW/m. Post irradiation examinations were carried out to investigate rod behavior such as fission gas release (FGR), clad creep, clad and fuel elongations.
The Instrumented Fuel Assembly 597 (IFA-597) experiment was carried out in the Halden Boiling Heavy water Reactor under the auspices of the Halden Reactor Project. The experiment aimed to study the thermal and fission gas release behavior of MOX fuel, and to explore differences in performance between solid and hollow pellets. Two MOX rods (labeled 10 and 11) were instrumented with a fuel center thermocouple and a pressure bellow transducer and irradiated in the Halden Reactor. The experiment consisted of four power cycles up to 33 MWd/kgMOX. The linear power was in the range 15-35 kW/m. Details of the fabrication data as well as irradiation data up to a burn-up of 26 MWd/kgMOX (reached at the end of the third cycle) were released with the aim of code benchmarking. The in-pile data on fuel temperature, rod inner pressure and results of the gas puncturing and mass spectrometry of the extracted gas were also released. The datasets of this experiment are included in the International Fuel Performance Experimental database.
This document consists of eight main sections and two attached appendixes. Section one points out the objective and the framework of the activity. In the second section, the MOX fuel is described and the main differences between MOX and UO2 are briefly discussed giving emphasis on modeling issues.
PRIMO and IFA-597 experiments are described in section three. Section four includes the procedure adopted to develop the TRANSURANUS reference input decks. The main capabilities of TRANSURANUS in treating the FGR phenomenon and its connected parameters and processes are described in section five. Sections sis and seven constitute the core of this report. They aim to validate TRANSURANUS code against PRIMO and IFA-597 experiments exploring its capabilities by systematic comparison between simulated and measured trends and by extensive sensitivity analysis. The section includes the comparison with the related benchmarks. Conclusions are finally given in section eight. Appendix A and B report detailed figures in support to the sensitivity analyses.
CONTENTS
A
BSTRACT... 3
A
BBREVIATIONS... 9
L
IST OF FIGURES... 11
L
IST OF TABLES... 15
1
I
NTRODUCTION... 17
1.1
Background ... 17
1.2
Objective of the activity ... 18
1.3
Validation domains ... 19
2
T
HEMOX
FUEL... 23
2.1
Fabrication processes ... 23
2.1.1 Fabrication of oxide powder ... 23
2.1.1.1 Precipitation of plutonium oxalate ... 23
2.1.1.2 Thermal de-nitration methods ... 24
2.1.2 MOX fuel fabrication ... 24
2.1.2.1 Conventional process ... 24
2.1.2.2 COCA process ... 26
2.1.2.3 MIMAS and OCOM processes... 26
2.1.2.4 SBR process ... 26
2.2
Current MOX use in NPP ... 27
2.3
UO
2– MOX fuels main differences ... 28
2.3.1 Melting temperature ... 28
2.3.2 Thermal Conductivity ... 29
2.3.3 Radial power and burn-up profile ... 30
2.3.4 Densification ... 31
2.3.5 Swelling ... 32
2.3.6 Fission gas release... 33
2.3.7 Helium generation and release ... 34
3
D
ESCRIPTION OF THE EXPERIMENTS... 35
3.1
The PRIMO program ... 35
3.1.1 The BR3 reactor ... 36
3.1.2 The OSIRIS reactor... 36
3.1.3 BD8 rod design ... 38
3.1.4 Base irradiation ... 42
3.1.5 Power ramp irradiation ... 43
3.1.6 Main Achievement from the Experiment ... 44
3.1.6.2 Destructive examination ... 46
3.2
The IFA-597 experiment ... 46
3.2.1 The Halden BHWR ... 47
3.2.2 Rods design ... 50
3.2.3 Irradiation history... 51
3.2.4 Main Achievement from the Experiment ... 55
4
D
EVELOPMENT AND SETUP OF THETRANSURANUS
MODELS... 61
4.1
TRANSURANUS code... 61
4.2
Description of the PRIMO input deck ... 62
4.2.1 Selection of the boundary conditions ... 62
4.3
Description of the IFA-597 input deck ... 64
4.3.1 Selection of the boundary conditions ... 65
5
T
HEFGR
PHENOMENON AND ITS MODELING INTU
CODE... 67
5.1
The FGR phenomenon ... 67
5.1.1 FGR models ... 68
5.1.2 Main parameters and processes that affect the simulation of FGR ... 69
5.2
Modeling of FGR in TU code ... 70
5.2.1 FGR models ... 70
5.2.2 Fuel conductivity correlations ... 71
5.2.3 Modeling of fuel relocation ... 73
5.2.4 Modeling of fuel swelling ... 75
5.2.5 Modeling of fuel densification ... 79
5.2.6 Modeling of fuel grain growth ... 79
5.2.7 Modeling of gap conductance ... 80
5.2.8 Modeling of cladding creep ... 81
5.2.9 Modeling of Helium release... 81
5.3
Summary of the reference models ... 82
6
V
ALIDATION OFTU
CODE AGAINSTPRIMO
EXPERIMENT... 85
6.1
Reference results ... 85
6.1.1 Burn-up analysis ... 85
6.1.2 FGR analysis ... 85
6.1.3 Grain size analysis ... 86
6.1.4 Deformation analysis at the end of the BI ... 86
6.1.5 Parametrical determination of the failure threshold... 87
6.2
Sensitivity analysis ... 95
6.2.1 Assessment of FGR models (runs M1) ... 97
6.2.2 Assessment on fuel conductivity correlations (runs C1) ... 100
6.2.3 Assessment on relocation models (runs M2) ... 101
6.2.4 Assessment on fuel swelling correlations (runs C2) ... 104
6.2.6 Assessment on fabrication density (runs D1) ... 108
6.2.7 Assessment on grain size (runs D2) ... 109
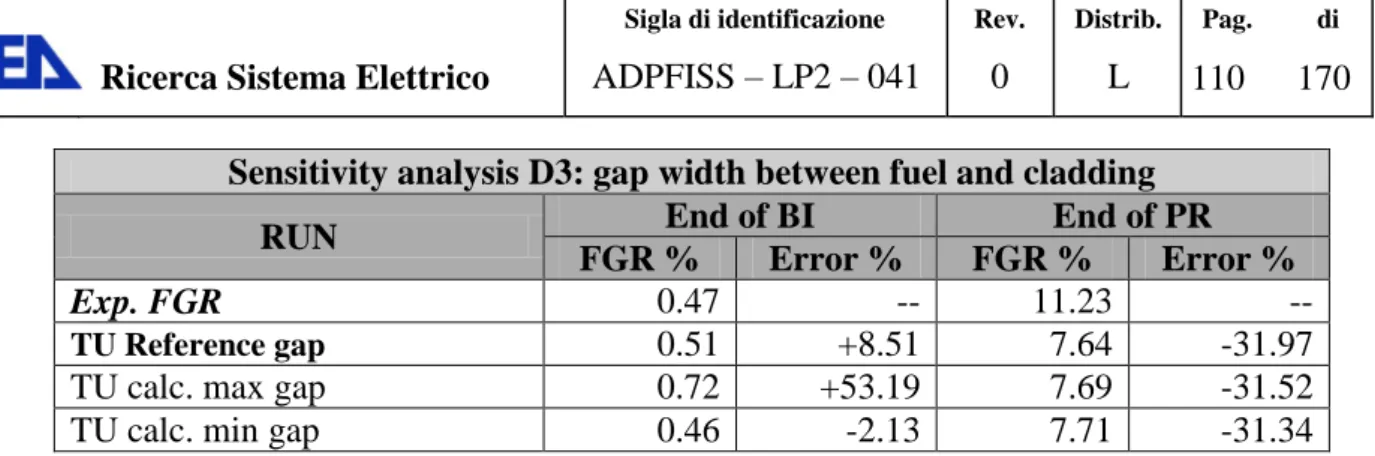
6.2.8 Assessment on initial gap width (runs D3) ... 109
6.3
Code to code comparison ... 110
7
V
ALIDATION OFTU
CODE AGAINSTIFA-597
EXPERIMENT... 113
7.1
Reference results ... 113
7.1.1 Burn-up analysis ... 113
7.1.2 Fuel temperature analysis ... 113
7.1.3 Rod inner pressure analysis ... 114
7.1.4 FGR analysis ... 114
7.2
Sensitivity analysis ... 121
7.2.1 Assessment of FGR models (runs M1) ... 122
7.2.2 Assessment on fuel conductivity correlations (runs C1) ... 127
7.2.3 Assessment on relocation models (runs M2) ... 128
7.2.4 Assessment on fuel swelling correlations (runs C2) ... 129
7.2.5 Assessment on fuel densification models (runs M3) ... 131
7.2.6 Assessment on Helium release model (runs M4) ... 132
7.2.7 Assessment on fabricated density (runs D1) ... 133
7.2.8 Assessment on grain size (runs D2) ... 133
7.2.9 Assessment on initial gap width (runs D3) ... 134
7.2.10 Assessment on initial free volume (runs D4) ... 135
8
C
ONCLUSIONS... 137
REFERENCES ... 141
APPENDIX
A:
PRIMO,
S
ENSITIVITY ANALYSES... 146
Abbreviations
ADS Accelerator Driven System
ADP Accordo Di Programma
ALFRED Advanced Lead cooled Fast Reactor
Am Americium
AR After Ramp
ASTRID Advanced Sodium Test Reactor for Industrial Demostration
BI Base Irradiation
BN Belgonucleaire
BNFL British Nuclear Fuels plc (UK)
BOL Beginning Of Life
CEA Commissariat à l’Energie Atomique
CIRTEN Consorzio Interuniversitario per la Ricerca Tecnologica Nucleare
CL Conditioning Level
COCA Cobroyage (co-milling) Cadarache
CRP Coordinate Research Program
Cu Curium
DIMNP Dipartimento di Ingegneria Meccanica Nucleare e della Produzione
ENEA Agenzia nazionale per le nuove tecnologie, l'energia e lo sviluppo economico sostenibile
EOL End of Life
EPMA Electron Probe Micro Analysis
F Failed
FBFC Franco Belge de Fabrication de Combustible
FBR Fast Breeder Reactor
FGR Fission Gas Release
FP Fission Product
FR Fast Reactor
FRAPCON-3 “Steady state fuel rod performance code”
FUMEX Fuel Modeling at Extended Burn-up
Gd Gadolinium
GEN-IV GENeration - IV
HBS High burn-up Structure
He Helium
HBWR Halden Boyling Water Reactor
HRP Halden Reactor Project
IAEA International Atomic Energy Agency
IFA Instrumented Fuel Assembly
IFE Institute For Energetik
ITU Institute for Transuranium Elements
IFPE International Fuel Performance
JNC Japan Nuclear Cycle development institute
JRC Joint Research Centre
KAERI Korean Atomic Energy Research Institute
Kr Kripton
LFR Lead cooled Fast Reactor
LVDT Linear Variable Differential Transducer
LWR Light Water Reactor
MA Minor Actinide
MHI Mitsubishi Heavy Industries
MHYRRA Multi-purpose HYbrid Research Reactor
MIMAS Micronized MASter blend
MLI Mean Linear Intercept
MOX Mixed OXide (fuel)
MTR Material Testing Reactor
NEA Nuclear Energy Agency
NF Non Failed
NFF Neutron Fast Flux
NITROX de-nitration process for PuO2 production (France)
NNL National Nuclear Laboratory (UK)
NPP Nuclear Power Plant
NSC Nuclear Science Committee
OECD Organization for Economic Co-operation and Development
O/M Oxygen to Metal ratio
PCI Pellet-Cladding Interaction
PCMI Pellet-Cladding Mechanical Interaction
PIE Post Irradiation Examination
PRIMO PWR Reference Irradiation of MOX fuels program
PTI Prior To Irradiation
PTR Prior To Ramp
Pu Plutonium
PWR Pressurized Water Reactor
SFR Sodium cooled Fast Reactor
RTL Ramp Terminal Level
RR Ramp Rate
SCC Stress Corrosion Cracking
SCK•CEN Studiecentrumvoor Kernenergie Centre d’Études de l’Énergie Nucléaire
TD Theoretical Density
TDN Thermal De-Nitration
TU TRANSURANUS
TWCA The Wah Chang Albany
U Uranium
UNIPI Università di Pisa
UO2 Uranium Oxide
Xe Xenon
XRF X-ray Fluorescence
List of figures
Fig. 1 – Precipitation of plutonium oxalate. ... 24
Fig. 2 – Conventional MOX fuel fabrication process adopted applied by JNC in PFPF. ... 25
Fig. 3 –MOX fuel fabrication processes. ... 27
Fig. 4 – Melting temperature of UO2 and MOX fuels as a function of burn-up according to Adamson at al. ... 29
Fig. 5 – Thermal conductivity as a function of temperature at different burn-ups for UO2 and MOX fuel according to the correlation of Lanning at al. ... 30
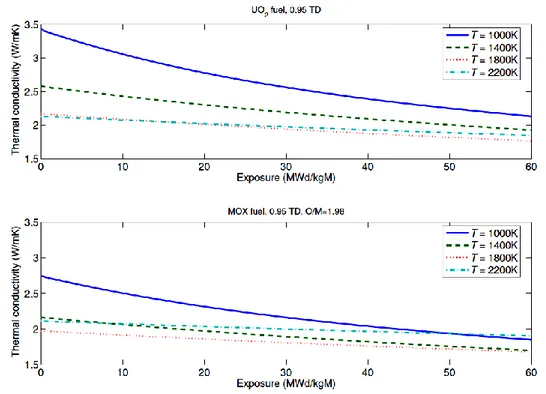
Fig. 6 – Thermal conductivity as a function of burn-up at different temperatures for UO2 and MOX fuel according to the correlation of Lanning at al. ... 30
Fig. 7 – Sinter-able porosity correlation. ... 32
Fig. 8 – Fission gas release fraction as a function of burn-up for UO2 and MOX fuel rods measured in PWRs (Blanpain et al., 2000 and IAEA, 2003). ... 34
Fig. 9 – OSIRIS reactor core layout. ... 38
Fig. 10 – PRIMO Program, general layout of rod BD8. ... 41
Fig. 11 – PRIMO Program, rod BD8, hold down spring and spacer tube. ... 41
Fig. 12 – PRIMO Program, rod BD8, linear heat rate at the peak point during base irradiation. ... 42
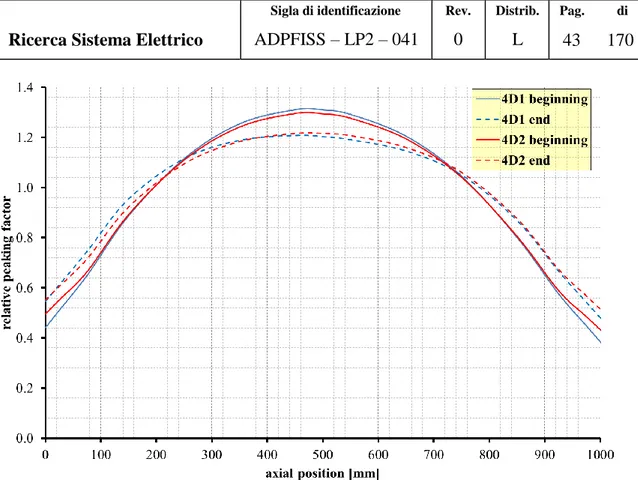
Fig. 13 – PRIMO Program, rod BD8, relative axial power profile, BR3-4D1 and BR3-4D2 cycle. ... 43
Fig. 14 – PRIMO Program, rod BD8, linear heat rate at the peak point during power ramp test. ... 44
Fig. 15 – PRIMO Program, rod BD8, relative axial power profile of the OSIRIS Reactor... 44
Fig. 16 – HBWR, scheme and main operational data. ... 49
Fig. 17 – HBWR, core plan view of reactor top lid and main data. ... 49
Fig. 18 – IFA-597, rod 10 and rod 11, LHR at the thermocouple position ... 53
Fig. 19 – IFA-597, power axial profile. ... 54
Fig. 20 – IFA-597, rod 10 and rod 11, fuel temperature and linear power history. ... 57
Fig. 21 – IFA-597, rod 10 and rod 11, pressure measurements. ... 58
Fig. 22 – IFA-597, rod 10 and rod 11, pressure measurements in IFA-597.6, pressure bursts. ... 59
Fig. 23 – PRIMO Program, rod BD8,cladding and coolant temperatures during base irradiation. ... 63
Fig. 24 – PRIMO Program, rod BD8, neutron fast flux during base irradiation. ... 64
Fig. 25 – PRIMO Program, rod BD8, BD8 rod axial mesh. ... 64
Fig. 26 – IFA-597, rod 10 and rod 11, LHR at thermocouple position. ... 66
Fig. 27 – IFA-597, rod 10 and rod 11, neutron fast flux at thermocouple position. ... 66
Fig.28 – PRIMO Program, rod BD8, burn-up analysis. ... 90
Fig.29 – PRIMO Program, rod BD8, fission gas release analysis, base irradiation. ... 90
Fig. 30 – PRIMO Program, rod BD8, linear power and gap width in peak axial position, base irradiation. ... 91
Fig.32 – PRIMO Program, rod BD8, linear power and gap width in peak axial position, power ramp. ... 92
Fig.33 – PRIMO Program, rod BD8, grain growth analysis. ... 92
Fig.34 – PRIMO Program, rod BD8, fuel and cladding axial deformation (before ramp) analysis. ... 93
Fig.35 – PRIMO Program, rod BD8, fuel and cladding radial deformation (before ramp) analysis. ... 93
Fig.36 –PCI-SCC failure threshold, comparison with similar ramp tests. ... 94
Fig. 37 – PRIMO Program, intra-granular diffusion coefficients as function of temperature. ... 99
Fig. 38 – PRIMO Program, rod BD8, sensitivity analysis on FGR models, gas saturation concentration to release gas from grain boundaries as function of temperature. ... 99
Fig. 39 – PRIMO Program, rod BD8, sensitivity analysis on FGR models, FGR, base irradiation. ... 100
Fig. 40 – PRIMO Program, rod BD8, sensitivity analysis on FGR models, FGR, power ramp. ... 100
Fig. 41 – PRIMO Program, rod BD8, sensitivity analysis on relocation models, gap width in peak axial position, base irradiation. ... 103
Fig. 42 – PRIMO Program, rod BD8, sensitivity analysis on relocation models, gap width in peak axial position, power ramp. ... 103
Fig. 43 – PRIMO Program, rod BD8, sensitivity analysis on fuel swelling correlations, gap width in peak axial position, base irradiation. ... 105
Fig. 44 – PRIMO Program, rod BD8, sensitivity analysis on fuel swelling correlations, gap width in peak axial position, power ramp. ... 106
Fig. 45 – PRIMO Program, rod BD8, sensitivity analysis on densification models, gap width in peak axial position, base irradiation. ... 107
Fig. 46 – PRIMO Program, rod BD8, sensitivity analysis on densification models, gap width in peak axial position, power ramp. ... 108
Fig. 47 – PRIMO Program, rod BD8, code-to-code comparison, fuel temperature, base irradiation. ... 111
Fig. 48 – PRIMO Program, rod BD8, code-to-code comparison, FGR, base irradiation. ... 111
Fig. 49 – PRIMO Program, rod BD8, code-to-code comparison, fuel temperature, power ramp. ... 112
Fig. 50 – PRIMO Program, rod BD8, code-to-code comparison, FGR, power ramp. ... 112
Fig. 51 – IFA-597, rod 10, burn-up analysis. ... 117
Fig.52 – IFA-597,rod 11, burn-up analysis. ... 117
Fig.53 – IFA-597,rod 10, fuel temperature analysis ... 118
Fig. 54 – IFA-597,rod 11, fuel temperature analysis. ... 118
Fig.55 – IFA-597,rod 10, inner pressure analysis. ... 119
Fig.56 – IFA-597,rod 11, inner pressure analysis. ... 119
Fig.57 – IFA-597,rod 10, FGR analysis... 120
Fig.58 – IFA-597,rod 11, FGR analysis... 120
Fig. 59 – IFA-597, sensitivity analysis on FGR, intra-granular diffusion coefficients. ... 125
Fig. 60 – IFA-597, sensitivity analysis on FGR models, gas saturation concentration to release from grain boundaries. ... 126
Fig. 61 – IFA-597, rod 10 and rod 11, sensitivity analysis on FGR, final results. ... 126
Fig. A. 1 - PRIMO Program, rod BD8, sensitivity analysis on FGR models, FGRMOD4, BI ... 147
Fig. A. 2 - PRIMO Program, rod BD8, sensitivity analysis on FGR models, FGRMOD4, PR. ... 147
Fig. A. 3 - PRIMO Program, rod BD8, sensitivity analysis on FGR models, FGRMOD6, BI. ... 148
Fig. A. 4 - PRIMO Program, rod BD8, sensitivity analysis on FGR models, FGRMOD6, PR. ... 148
Fig. A. 5 - PRIMO Program, rod BD8, sensitivity analysis on FGR models, FGRMOD9, BI. ... 149
Fig. A. 6 - PRIMO Program, rod BD8, sensitivity analysis on FGR models, FGRMOD9, PR. ... 149
Fig. A. 7 - PRIMO Program, rod BD8, sensitivity analysis on fuel conductivity, rod centerline temperature in peak axial position and FGR, base irradiation. ... 150
Fig. A. 8 - PRIMO Program, rod BD8, sensitivity analysis on fuel conductivity, rod centerline temperature in peak axial position and FGR, power ramp. ... 150
Fig. A. 9 - PRIMO Program, rod BD8, sensitivity analysis on fuel relocation models, FGR and fuel temperature in peak axial position, base irradiation. ... 151
Fig. A. 10 - PRIMO Program, rod BD8, sensitivity analysis on fuel relocation models, FGR and fuel temperature in peak axial position, power ramp. ... 151
Fig. A. 11 - PRIMO Program, rod BD8, sensitivity analysis on fuel swelling correlations, FGR and fuel temperature in peak axial position, base irradiation. ... 152
Fig. A. 12 - PRIMO Program, rod BD8, sensitivity analysis on fuel swelling correlations, FGR and fuel temperature in peak axial position, power ramp. ... 152
Fig. A. 13 - PRIMO Program, rod BD8, sensitivity analysis on densification models, FGR and fuel temperature in peak axial position, base irradiation. ... 153
Fig. A. 14 - PRIMO Program, rod BD8, sensitivity analysis on densification models, FGR and fuel temperature in peak axial position, power ramp. ... 153
Fig. A. 15 - PRIMO Program, rod BD8, sensitivity analysis on fuel density, FGR and fuel temperature in peak axial position, base irradiation. ... 154
Fig. A. 16 - PRIMO Program, rod BD8, sensitivity analysis on fuel density, FGR and fuel temperature in peak axial position, power ramp. ... 154
Fig. A. 17 - PRIMO Program, rod BD8, sensitivity analysis on fuel average grain size, FGR and fuel temperature in peak axial position, base irradiation. ... 155
Fig. A. 18 - PRIMO Program, rod BD8, sensitivity analysis on fuel average grain size, FGR and fuel temperature in peak axial position, power ramp. ... 155
Fig. A. 19 - PRIMO Program, rod BD8, sensitivity analysis on fuel gap initial size, FGR and fuel temperature in peak axial position, base irradiation. ... 156
Fig. A. 20 - PRIMO Program, rod BD8, sensitivity analysis on fuel gap initial size, FGR and fuel temperature in peak axial position, power ramp. ... 156
Fig. B. 1 - IFA-597,rod 10 and rod 11, sensitivity analysis on FGR models, FGRMOD4. ... 158
Fig. B. 2 - IFA-597,rod 10 and rod 11, sensitivity analysis on FGR models, FGRMOD6. ... 159
Fig. B. 3 - IFA-597, rod 10 and rod 11, sensitivity analysis on FGR models, FGRMOD9. ... 160
Fig. B. 4 - IFA-597, rod 10 and rod 11, sensitivity analysis on fuel conductivity correlations. ... 161
Fig. B. 5 - IFA-597, rod 10 and rod 11, sensitivity analysis fuel relocation models. ... 162
Fig. B. 6 - IFA-597, rod 10 and rod 11, sensitivity analysis on fuel swelling correlations. ... 163
Fig. B. 8 - IFA-597, rod 10 and rod 11, sensitivity analysis on Helium release models. ... 165
Fig. B. 9 - IFA-597, rod 10 and rod 11, sensitivity analysis fuel initial density. ... 166
Fig. B. 10 - IFA-597, rod 10 and rod 11, sensitivity analysis on fuel grain size... 167
Fig. B. 11 - IFA-597, rod 10 and rod 11, sensitivity analysis on initial gap width. ... 168
List of tables
Tab. 1 – PRIMO Experiment validation domain of TU v1m1j12. ... 20
Tab. 2 – IFA-597, validation domain of TU v1m1j12. ... 21
Tab. 3 – BR-3 Reactor, main characteristics. ... 36
Tab. 4 – OSIRIS Reactor main characteristics. ... 37
Tab. 5 – PRIMO Program, rod BD8, fuel pellets characteristics. ... 39
Tab. 6 – PRIMO Program, rod BD8, depleted uranium pellets characteristics. ... 39
Tab. 7 – PRIMO Program, rod BD8, cladding tube characteristics. ... 40
Tab. 8 – PRIMO Program, rod BD8, fuel pin characteristics. ... 40
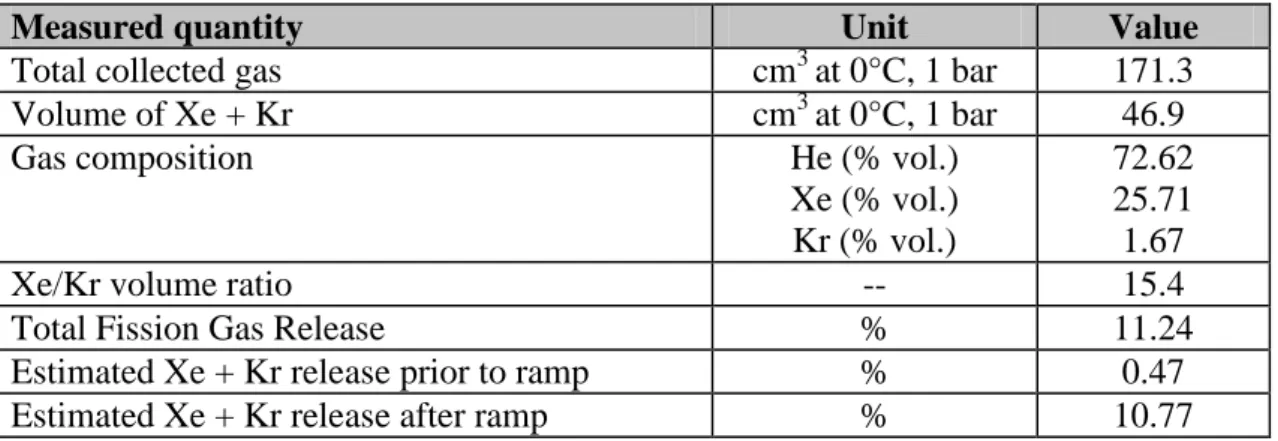
Tab. 9 – PRIMO Program, rod BD8, experimental data obtained from PIE performed PTR. ... 46
Tab. 10 – PRIMO Program, rod BD8, FGR measurements... 46
Tab. 11 – Summary of the driver fuel main data. ... 48
Tab. 12 – IFA-597, rod 10 and rod 11 design data. ... 51
Tab. 13 – IFA-597, rod 10 and rod 11, PIE, results of gas puncturing. ... 56
Tab. 14 – Main parameters and processes that affect the simulation of FGR. ... 69
Tab. 15 – PRIMO Program & IFA-597, summary of models and correlations assumed in the reference that may impact on the FGR simulation. ... 83
Tab. 16 – PRIMO Program, summary of reference analysis. ... 89
Tab. 17 – PRIMO Program, rod BD8, sensitivity analysis on RTL and failure threshold, results and relative errors. ... 89
Tab. 18 – PRIMO Program, rod BD8, list of sensitivity analysis. ... 96
Tab. 19 – PRIMO Program, rod BD8, sensitivity analysis on FGR models ,results and relative errors. ... 98
Tab. 20 – PRIMO Program, rod BD8, sensitivity analysis on fuel thermal conductivity, results and relative errors. ... 101
Tab. 21 – PRIMO Program, rod BD8, sensitivity analysis on relocation models, results and relative errors. ... 102
Tab. 22 – PRIMO Program, rod BD8, sensitivity analysis on swelling model, results and relative errors. ... 105
Tab. 23 – PRIMO Program, rod BD8, sensitivity analysis on densification models, results and relative errors. ... 107
Tab. 24 – PRIMO Program, rod BD8, sensitivity analysis on fuel initial density, results and relative errors. ... 108
Tab. 25 – PRIMO Program, rod BD8, sensitivity analysis on grain size, results and relative errors. ... 109
Tab. 26 – PRIMO Program, rod BD8, sensitivity analysis on gap width results and relative errors... 110
Tab. 27 – IFA-597, rod 10, summary of reference analysis. ... 116
Tab. 28 – IFA-597, rod 11, summary of reference analysis. ... 116
Tab. 29 – IFA-597 list of sensitivity analysis. ... 122
Tab. 30 – IFA-597, rod 10, sensitivity analysis on FGR models ,results and relative errors. ... 124
Tab. 32 – IFA-597, rod 10, sensitivity analysis on fuel conductivity correlations ,results and relative
errors. ... 128
Tab. 33 – IFA-597, rod 11 sensitivity analysis on fuel conductivity correlations ,results and relative errors. ... 128
Tab. 34 – IFA-597, rod 10, sensitivity analysis on relocation models, results and relative errors. ... 129
Tab. 35 – IFA-597, rod 1, sensitivity analysis on relocation models, results and relative errors. ... 129
Tab. 36 – IFA-597, rod 10, sensitivity analysis on swelling model, results and relative errors. ... 131
Tab. 37 – IFA-597, rod 11, sensitivity analysis on swelling model, results and relative errors. ... 131
Tab. 38 – IFA-597, rod 10, sensitivity analysis on densification model, results and relative errors. ... 131
Tab. 39 – IFA-597, rod 11, sensitivity analysis on densification model, results and relative errors. ... 132
Tab. 40 – IFA-597, rod 10, sensitivity analysis on Helium release model, results and relative errors. ... 132
Tab. 41 – IFA-597, rod 11, sensitivity analysis on Helium release model, results and relative errors. ... 132
Tab. 42 – IFA-597, rod 10, sensitivity analysis on initial porosity, results and relative errors. ... 133
Tab. 43 – IFA-597, rod 11, sensitivity analysis on initial porosity, results and relative errors. ... 133
Tab. 44 – IFA-597, rod 10, sensitivity analysis on average grain size, results and relative errors. ... 134
Tab. 45 – IFA-597, rod 11, sensitivity analysis on average grain size, results and relative errors. ... 134
Tab. 46 – IFA-597, rod 10, sensitivity analysis on gap width, results and relative errors. ... 135
Tab. 47 – IFA-597, rod 10, sensitivity analysis on gap width, results and relative errors. ... 135
Tab. 48 – IFA-597, rod 10, sensitivity analysis on free volume, results and relative errors. ... 135
1 Introduction
1.1 Background
In the last decades two main trends have been identified in the nuclear technology. The first one deals with the continuous increase of the discharge burn-up. In this framework, new cladding materials capable to sustain higher burn-ups have been developed and new experiments have been executed to better understand high burn-ups phenomena (i.e. the HBS formation, the in cladding hydrogen pick-up, the delayed hydride cladding failure mechanism etc…), to check the new materials performance and to check the existing safety criteria (that were defined at lower burn-ups and for old materials)[1][2]. The second deals with the introduction of commercial MOX fuel. Three temporal phases in the management of plutonium arising from nuclear power generation (civil plutonium) are identified[3].
The first phase has seen a gradual introduction of the recycling of mixed oxide fuel up to an industrial scale in light water reactors in several countries, is currently well established. MOX usage in LWRs is a well understood and mature technology and MOX can be managed in a very similar way to uranium fuel. The current inventory of separated civil plutonium is safely stored and has still to be recycled. The necessary safeguards arrangements have kept pace with these developments wherever plutonium is handled, fabricated, stored, transported and irradiated.
The second phase (up to, say, 2030) is beginning at the time of writing. It is characterized by an ongoing but irregular expansion of MOX recycling in which other countries will acquire MOX technology and additional nuclear plants will be licensed for MOX fuel. It could then be expected that the stockpiles of separated plutonium (both civil and weapons surplus) will begin to diminish and move to significantly lower levels during this phase. As well as extending the number of power plants loading MOX fuel, the technology now needs to be developed for advanced reactors such as the GEN-IV Fast Reactor (i.e. LFR or SFR) or Accelerator Driven Systems (i.e. MHYRRA). Additionally, more environmentally friendly reprocessing methods with reduced emissions will be needed to prepare for the third and long term phase of plutonium recycle and management.
In this preparation for the third phase of development, emphasis must be placed on both achieving greater public acceptance for plutonium fuel technology as well as making the power producing utilities more attractive economically. These same utilities will be the ultimate source of the financing needed to establish the stable development of nuclear power based on uranium and, over the longer term, plutonium fuels. A fuel that is more expensive than others or which may limit reactor operation is unacceptable for the power producers. If the economic and performance targets cannot be reached and negative public attitudes persist, there will be no third phase of plutonium recycle. However, if such a development can be realized, the third phase should see the progressive introduction of advanced thermal reactors as well as fast reactors, alongside new technologies specifically designed for MOX fuel. The aim will be to manage the production and use of plutonium effectively to avoid major stockpiling.
The fission process not only generates heat in the nuclear fuel pellets, it also produces a broad spectrum of fission products, most of which are radioactive and should not be released to the environment. In the defense in depth concept, the fuel matrix and the cladding constitute the first two barriers against the release of radio nuclides from a nuclear power plant[1]. In thermal reactors, it is generally accepted that MOX fuel behaves similar to UOx fuel and should therefore wind stand the same safety requirements. Compared to UOx, MOX fuel mainly differentiate by[4],[5]: lower conductivity, lower melting point, higher creep rate, higher FGR, lower gaseous swelling and production / release of He coming from alpha decay of heavy MA[4][5]. In general, the differences
depend on the fabrication process and on the PuO2 content. Since the experimental databases on MOX fuel are not so extended as for UOx, there is a growing interest in understanding the MOX fuel behavior both for the application in commercial LWR fuels with high burn-ups performance and next generation FRs. The exact description of all the physical phenomena occurring in fuel rods during irradiation is a complex task since it involves a wide range of disciplines ranging from chemistry, nuclear and solid-state physics, metallurgy, thermal-hydraulics, ceramics and applied mechanics. In particular, the characterization of MOX fuel for FR application is of great importance to develop advanced fuel design since FR MOX fuel has unique features: it contains larger quantities of PuO2 than LWR, it is operated at higher temperature and in harder neutron spectrum. Developing computer codes that allow the description of the general MOX fuel behavior is mandatory to support the development of safer and more effective fuels.
1.2 Objective of the activity
The Fission Gas Release (FGR) phenomenon is of primary interest since it is considered as one possible mechanism that limits the discharge burn-up of nuclear fuel rods. Gaseous fission products, in fact, either remain in the pellets and contribute to the swelling, or are released from the pellets to the pin free volume. The fuel swelling promotes the pellet-cladding interaction while the release of fission gases leads to two other undesirable effects: the increase of fuel rod’s internal pressure and the degradation of the gap conductivity. In addition, the use of MOX fuel implies the release of a non-negligible amount of He (that can be neglected in UO2 fuel) coming from the alpha decay of Pu238, Cm242, Cm244, and from ternary fissions. Deeper understanding of the fission gas release phenomenon, along with better modeling capabilities is the only way to move to best estimate predictions.
The aim of this report is the assessment of TRANSURANUS[6],[7],[8] code version 2012 in simulating MOX fuel behavior with particular reference to the FGR phenomenon. This type of fuel has been selected as fuel for both GEN-IV systems as ALFRED or ASTRID and advanced thermal reactors as EPR. Since fuel pin mechanics codes are usually based on empirical correlations obtained from experiments, their applicability to new designs should be demonstrated by verification and validation processes. This complex task requires the large use of experimental databases.
Due to the un-availability of public databases on FR fuel, the first un-avoidable step, is verification and validation of fuel pin mechanic codes against thermal reactor public databases. The International Fuel Pin performance Experimental database (IFPE)[9] aims to provide in the public domain, a comprehensive and well-qualified database on Zr clad UO2 – MOX fuel for model development and code validation. The data encompasses both normal and off-normal operation and include prototypic commercial irradiations as well as experiments performed in Material Testing Reactors. This work is carried out in close co-operation and co-ordination between the NEA, the IAEA and the IFE/OECD Halden Reactor Project. The database is restricted to thermal reactor fuel performance, principally with standard product Zircaloy clad UO2 fuel, although the addition of advanced products with fuel and clad variants is not ruled out. Emphasis has been placed on including well-qualified data that illustrate specific aspects of fuel performance. Of particular interest to fuel modellers are data on: fuel temperatures, fission gas release (FGR), fuel swelling, clad deformation (e.g. creep-down, ridging) and mechanical interactions. Data on these issues are of great value if measured in-pile by dedicated instrumentation and, in this respect, the IFPE Database is fortunate in having access to several diverse experiments. In addition to direct in-pile measurement, every effort is made to include PIE information on clad diameters, oxide thickness, hydrogen content, fuel grain size, porosity, Electron Probe Micro Analysis (EPMA) and X-ray Fluorescence (XRF) measurements on caesium, xenon, other fission product and actinides.
Two databases on MOX fuel included in the IFPE and released for benchmarking purpose have been modeled by means of TRANSURANUS code: PRIMO[10] experiment and IFA-597[11],[12].
1.3 Validation domains
TRANSURANUS is a computer program for the thermal and mechanical analysis of fuel rods in nuclear reactors[6][7][8] developed at ITU. It consists of a clearly defined mechanical–mathematical framework into which physical models can easily be incorporated. The mechanical–mathematical concept consists of a superposition of a one-dimensional radial and axial description (the so called quasi two-dimensional or 1½-D model). The code was specifically designed for the analysis of a whole rod. Besides its flexibility for fuel rod design, the TRANSURANUS code can deal with a wide range of different situations, as given in experiments, under normal, off-normal and accident conditions. The time scale of the problems to be treated may range from milliseconds to years. The code has a comprehensive material data bank for oxide, mixed oxide, carbide and nitride fuels, Zircaloy and steel claddings and several different coolants. It can be employed in two different versions: as a deterministic and as a statistical code.
The validation of TRANSURANUS code is performed against the PRIMO Experiment (1 rod) and IFA-597 (2 rods).
The PWR Reference Irradiation of MOX fuels (PRIMO) program sought to investigate the MOX fuel behavior under steady-state and transient conditions[10]. It started in 1986. The aims were to investigate the capability of MOX to sustain normal operation conditions typical of commercial PWR, to study thermal and irradiation induced phenomena occurring in fuel and to obtain thermo-mechanical data under power ramp conditions. The PRIMO program included sixteen MOX fuel rods manufactured through different fabrication processes and ramp-tested at different burn-up levels between 20 and 60 MWd/kgHM. The irradiation history and the experimental data of one fuel rod named BD8 from the PRIMO program was included in the International Fuel Performance Experimental Database and released for benchmarking purpose. It was base-irradiated in the BR2 Pressurized Water cooled Reactor (PWR) at an average linear power of 18.5 kW/m up to a burn-up of about 30 MWd/kgHM. The fuel rod then underwent a ramp test in the Osiris PWR up to a peak linear power of 39.5 kW/m. Post irradiation examinations were carried out to investigate rod behavior such as fission gas release (FGR), clad creep, clad and fuel elongations.
The Instrumented Fuel Assembly 597 (IFA-597) experiment was carried out in the Halden Boiling heavy Water Reactor (HBWR)[11],[12]. The experiment aimed to study the thermal and FGR behavior of MOX fuel, and to explore differences in performance between solid and hollow pellets. Two MOX rods (labeled 10 and 11) were instrumented with a fuel center thermocouple and a pressure bellow transducer and irradiated in the Halden Reactor. The experiment consisted of four power cycles up to 33 MWd/kgMOX. The linear power was in the range 15-35 kW/m. Details of the fabrication data as well as irradiation data up to a burn-up of 26 MWd/kgMOX (reached at the end of the third cycle) were released with the aim of code benchmarking. The in-pile data on fuel temperature, rod inner pressure and results of the gas puncturing and mass spectrometry of the extracted gas were also released.
The validation domains are reported in Tab. 1 and Tab. 2. They include:
the version of the code used for the independent assessment;
the main objective of the independent assessment;
the range of parameters for which the assessment is performed;
the parameters adopted for the comparison between the experimental data and the code results.
VALIDATION DOMAIN
Main phenomena Experiment No. rods Thermal modules Mechanical modules FGR modules Burn-up modules Notes PCI/SCC FGR PRIMO MOX ROD BD8 1 X X X X Version 2012
Range (parameters) of validity Parameters for validation
Parameter Unit Descript. # Rod BD8 TU
simulation
Pellet material -- MOX Burn-up ● X
Cladding material -- Zr-4 Cladding creep down in BI
1
(avg. and max) ● X
EnrichmentU235 %HM 5.246 Cladding expansion AR
2
(avg. and max) ● X
Enrichment Pu %HM 7.630 Grain size AR2 (pellet
centre/periphery) ○ X
Pellet outer diameter mm 8.041
Diametral gap size µm 200 FGR BI1 and AR2 ● X
Clad outer diameter mm 9.5 Elongation AR2 ● X
Active length mm 1004.7 Ridges height (avg. and
max) in BI1 ●
--$
Initial avg. grain size§ µm 5 Ridges height (avg. and
max) AR2 ●
--$
He filling pressure MPa 2.0 Clad ovality after BI1 ● --$
Average burn-up MWd/kgHM 30
Failure / Not Failure, AR2 ● X
Operative pressure MPa 15.0
Average LHR3 (BI1) kW/m 18.5 Average NFF4 (BI, 4D1-4D2 cycles) n/cm 2 s 4*1012 Ramp rate kW/mh 462
● suitable for code assessment ○ limited suitability
─ not suitable
RTL5 kW/m 39.5
LHR3 change kW/m 20.6
Holding time at RTL5 hrs 20
1 BI: Base Irradiation 2 AR: After Ramp 3 LHR: Linear Heat Rate
4 NFF: Neutron Fast Flux (>1 MeV)
5 RTL: Ramp Terminal Level
$ Not predictable by 1½D code (outside TU code capabilities) § Mean intercept length
VALIDATION DOMAIN
Main phenomena Experiment No. rods Thermal modules Mechanical modules FGR modules Burn-up modules Notes FGR IFA-597 2 X X X X
Range (parameters) of validity Parameters for validation
Parameter Unit Descript. # rod 10,
rod 11.
TU simulation
Pellet material -- MOX
Burn-up ● X
Cladding material -- Zr-4
EnrichmentU235 %HM 0.22
Fuel temperature ● X
Enrichment Pu %HM 6.07
Pellet outer diameter mm 8.04
Diametral gap size µm 180
Rod internal pressure ● X
Clad outer diameter mm 9.5
Active length mm 220 – 224
FGR ● X
Initial avg. grain size3 µm 5.45
He filling pressure MPa 0.5
Average burn-up MWd/kgMOX 27
● suitable for code assessment ○ limited suitability
─ not suitable
Operative pressure MPa 3.36
Average LHR1 kW/m 16
Average NFF2 n/cm2s 1.9*1012
1 LHR: Linear Heat Rate
2 NFF: Neutron Fast Flux (>1 MeV) 3 Mean intercept length
2 The MOX fuel
In every nuclear reactor there is both fission of isotopes such as 235U, and the formation of new, heavier isotopes due to neutron capture, primarily by 238U. Most of the fuel mass in a thermal reactor is 238
U. Part of this isotope transmutes to 239Pu (see reactions below) and by successive neutron capture to 240Pu, 241Pu and 242Pu as well as other transuranic isotopes. The plutonium (and uranium) created in the fuel can be recovered through reprocessing. The plutonium could then be used to produce mixed oxide (MOX) nuclear fuel. Today there is a significant amount of separated uranium and plutonium which may be recycled, including from ex-military sources.
Eq. 1
Plutonium reprocessed in LWR fuel contains five principal isotopes, namely, 238Pu, 239Pu, 240Pu, 241Pu and 242Pu. These isotopes have roughly the same probability of fission in FRs, however, in LWRs only 239
Pu and 241Pu experience fission and hence contribute to energy production[5].
2.1 Fabrication processes
2.1.1 Fabrication of oxide powder
Numerous methods have been used, and others are being developed, to obtain plutonium dioxide in a suitable form for MOX fuel fabrication. The methods deriving plutonium dioxide from the nitrate widely used followed by the processes to convert plutonium metal to oxide powder. Precipitation of plutonium oxalate and thermal de-nitration methods are briefly recalled in the following. Co-precipitation methods, gel Co-precipitation methods and methods of conversion of plutonium metal to oxide are not discussed in this section, we recommend Ref. [3] for a more detailed description of these methods.
2.1.1.1 Precipitation of plutonium oxalate
This precipitation method is the most widely used commercial method of converting plutonium nitrate solution to dioxide. The plutonium stream is concentrated in evaporators and conditioned to Pu (IV) with hydrogen peroxide before precipitation, Fig. 1. An excess of oxalic acid is used to reduce the solubility of the product. The oxalate is decomposed to oxide, which is suitable for ceramic fuel fabrication. The particle size and structure of the oxide are governed by the initial precipitation and, in turn, by the temperature and by concentrations of plutonium, nitric acid and oxalic acid.
Fig. 1 – Precipitation of plutonium oxalate. 2.1.1.2 Thermal de-nitration methods
As with uranium, the most straightforward way of converting from a nitrate to an oxide is by direct thermal degradation:
However, such methods are not presently used on a large scale in European plutonium feed production plants although wider use of them is being made in Japanese plants. Thermal de-nitration (TDN) of the oxalate has potentially the minimum number of stages and produces a low volume of liquid effluents that require further treatment. However, such benefits are outweighed by the micron particle powder quality of plutonium dioxide produced by direct TDN, rather than the free flowing powder generally desirable for subsequent processing. Different countries have investigated different de-nitration processes. I.e. the French NITROX process carries out the dehydration under reduced pressure to keep the temperature below the melting point of the hydrates.
2.1.2 MOX fuel fabrication
2.1.2.1 Conventional process
The conventional fabrication route is a direct application of the most common industrial fabrication process for uranium fuel, the enrichment of uranium being replaced by a mechanical blending of the feed powders: UO2 and PuO2, or (U–Pu)O2 for the plutonium. Fig. 2 reports atypical conventional process adopted by the JNC reprocessing plant. As the blended powder is not free flowing, and is therefore unsuitable for feeding to a pellet press, the powder is preconditioned by pre-compaction in a slugging press, followed by granulation, the granules being obtained by crushing the slugs. The challenge in this process is to obtain a uniform distribution of the plutonium in the product. Optimizing the ball (or attritor) mill is of paramount importance for achieving uniformity of the plutonium distribution, as well as a good dispersion of the lubricant and of the pore former, if the use of a pore former is required. The additives utilized include a binder, to improve granulation, a pore former, to achieve the low density specified for FBR fuel, and a lubricant, as universally used to optimize
pelletizing. In such processes, de-waxing of the green pellets is required prior to sintering. Excellent quality fuel can be fabricated by such a process.
2.1.2.2 COCA process
A simplification of the conventional feed powder processing route (which is to MOX fuel what the enrichment operation is to uranium fuel) was developed in the1970s by CEA and applied in the Cadarache fabrication plant under the name COCA, an acronym for Cobroyage (co-milling) Cadarache. It is based on the use of an optimized ball mill acting as a blender and of a forced extrusion of the lubricated micronized powder through a sieve, resulting in free flowing granules adequate for feeding the pellet press, Fig. 3. This process, originally developed for FBR fuel, has been adapted for LWR fuel and used from 1989 to 1994 for manufacturing MOX fuel for EDF’s PWRs.
2.1.2.3 MIMAS and OCOM processes
The MIMAS process, invented by Belgonucleaire in the early 1980s, is an adaptation of the reference fabrication process developed earlier and applied commercially in the 1970s at the Dessel plant. The reference process consisted of a single blending of PuO2 powder with free flowing UO2 powder, resulting in a blend of adequate flow-ability to feed the pellet press. However, when the re-processors decided that even un-irradiated MOX fuel had to be almost completely soluble in a pure nitric acid solution, the reference fuel was deemed to be no longer acceptable. To meet this new specification, the earlier single blending step was replaced by a two step blending approach: in the first step, the pure PuO2 feed and some UO2 are co-micronized resulting in a master mix of UO2–(typically) 30% PuO2, which is the fundamental principle of the MIMAS process (Fig. 3); in the second step, the master mix is blended down with free flowing AUC (Ammonium Uranyl Carbonate) or ADU (Ammonium Di-Uranate) UO2 to the specified plutonium content of the MOX fuel. The very close contact between the micronized UO2 and PuO2 particles provides for adequate inter-diffusion during sintering and therefore the required solubility. The final product is a fuel pellet in which Pu-rich particles are distributed in a UO2 matrix which is similar to ex-AUC UO2 microstructure regarding grain size and pore size distribution (average grain size is 7 to 10 μm and average pore diameter 2 to 4 μm). Thus the characteristic size in the MOX fuel can be the plutonium agglomerate (particle) size. These agglomerates are nearly spherical and contain most of the plutonium isotopes. There are very few published data on the details of these agglomerates, which may influence the retention and/or release of fission product gases during irradiation, and also other properties of the fuel, which will be discussed in this report. Lippens[16] and co-workers in a paper on MIMAS fuel note that plutonium is spatially distributed homogeneously on the pellet scale (millimetres), but is heterogeneous when is observed on the micron scale. According to Lippens et al. typical Pu particle size, determined by α-autoradiography, ranges from less than 1 μm to 100 μm with a frequency distribution centred at about 15 μm and an average size around 30 μm; and a much reduced population above 50 μm.
In parallel, Alkem (subsequently part of Siemens) had developed and applied commercially the sibling Optimized Co-milling (OCOM) process, with a similar success in fabric ability and improved fuel behavior. The main differences between MIMAS and OCOM were in the ball milling and powder conditioning steps. Integral fissile Pu content is in the range of 2.0 to 3.5 wt% with a density of 10.32 to 10.45 g/cm3. However, observations using Electron Probe Micro Analyser (EPMA) indicate areas enriched in Pu of dimensions 50 to 100 μm equivalent diameters.
2.1.2.4 SBR process
The SBR (Short Binderless Route), developed and produced by British Nuclear Fuels plc (BNFL), is a way for blending and conditioning of the MOX powder before pressing and sintering, Fig. 3. Homogenization is attained by means of a high energy attritor mill, which blends the oxide powders and a spherodizer in order to condition the powder to granules prior to pressing and sintering. At the milling stage, lubricant and Conpore pore former are added in order to control the pellet density and obtain similar characteristics as those of the UO2 pellets produced by BNFL from IDR (Integrated Dry Route) UO2 powder. The MOX produced by SBR has a mean grain size of about 7.4 μm with a
standard deviation of 0.6 μm, and for pores with a diameter ≥ 5 μm the median pore size has never been observed to exceed 15.4 μm during the production. The homogeneity of the fuel with respect to plutonium agglomerates is excellent when measured by α-radiography, which is a coarse scale.
Fig. 3 –MOX fuel fabrication processes.
2.2 Current MOX use in NPP
MOX fuel was first used in a thermal reactor in 1963, but did not come into commercial use until the 1980s. So far, about 2000 t of MOX fuel has been fabricated and loaded into power reactors. In 2006 about 180 t of MOX fuel was loaded into over 30 reactors (mostly PWR) in Europe[3]. Currently, about 40 reactors in Europe (in Belgium, Switzerland, Germany and France) are licensed to use MOX, and over 30 are doing so. France aims to have all its 900 MWe series of reactors running with at least one third of the core composed by MOX. Some advanced reactor will accept up to 50% MOX assemblies. Other advanced PWR such as the EPR or AP1000 are able to accept 100% fuel loadings of MOX if required. In Japan, about ten reactors are licensed to use it and several do so. These reactors are generally loaded with a mixed core where MOX fuel content is about one third.
An advantage of MOX is that the fissile concentration of the fuel can be increased easily by adding a bit more plutonium, whereas enriching uranium to higher levels of U-235 is relatively expensive. As reactor operators seek to burn fuel harder and longer, increasing burn-up from around 30 MWd/kg a few years ago to over 50 MWd/kg now, makes the use of MOX more attractive[13]. MOX fuel is designed to satisfy the same operational and safety criteria as uranium fuel under equivalent conditions. This is reflected in the parallel development of design codes to accommodate the specific characteristics of MOX fuel. MOX fuel assembly design has been universally based on uranium fuel design with only minor modifications relating to the neutronic and thermo-mechanical properties of the MOX fuel itself[14].
The main concerns for MOX fuel rod behavior are as follows[3]:
fuel center line temperature
fission gas release
in-pile densification and swelling
helium gas accumulation and release
pellet–cladding mechanical interaction (PCMI) under power ramping.
However, since the plutonium concentration of MOX fuel for LWRs is low and these differences from uranium fuel are relatively small, it is recognized that MOX fuel rod behavior is very similar to that of standard uranium fuel. No additional problems are apparent with the possible exception of higher gas release and hence an increase of rod internal pressure at high burn-up.
Because of the neutronic properties of the plutonium isotopes in MOX fuel, the reactivity decreases less rapidly with burn-up than in uranium fuel and thus MOX fuel dissipates more power later in its life, releasing more fission gas. In addition, the thermal conductivity of MOX is known to be lower than that of uranium by a few percent, which may give rise to higher fuel temperatures and thus higher fission gas release. Design changes, such as lowering the initial helium pressure and/or increasing the plenum volume in the rod, are sometimes applied to accommodate this higher gas release. With these exception, the fuel rod and assembly design are essentially unchanged from that of an equivalent uranium assembly. Generally, if a modification is applied to uranium fuel, then the same change will be incorporated in MOX fuel after, due evaluation of the experience with uranium fuel.
National and international programs to evaluate the performance of MOX fuel compared with that of uranium fuel have been carried out over a period of 35 years. These programs, which are still ongoing, are providing the data necessary to compare MOX fuel behavior with that of uranium, to develop specific MOX fuel performance models and to verify design codes. A wide range of variables has been investigated in these experiments, for example fabrication processes, cladding materials, fuel rod geometries and operating conditions. Post-irradiation examination (PIE) of commercial MOX fuel has also added a lot of data on performance and reliability. It has been concluded from both experimental and commercial irradiations that the reliability of MOX fuel remains as good as that of uranium fuel.
2.3 UO
2– MOX fuels main differences
Because of the extremely large uranium fuel performance database and the corresponding well validated codes, it is important to define differences in structure and performance of MOX and uranium fuels. In this section, we briefly review the thermo-physical properties of MOX fuel and compare them with those of UO2 fuel.
2.3.1 Melting temperature
Solidus and liquidus temperatures of uranium/plutonium dioxide data and correlations have been recently reviewed by Carbajo et al[4]. The Introduction of PuO2 in UO2 reduces the melting temperature of fuel being the melting temperature reduction an increasing function of the PuO2 content. The burn-up and/or the deviation from stoichiometry lowers the melting temperature too. In addition, since the stoichiometry of the fuel changes/redistributes depending on the burn-up these contributions are interrelated. An empirical correlation, based on curve fitting of the data introduced by Adamson et al.[15], is recommended for applications. These curves are reported in Fig. 4 for standard LWR fuels between 0 and 70 MWd/kgHM. The MOX melting temperature is about 50°C lower respect to the UO2.
Fig. 4 – Melting temperature of UO2 and MOX fuels as a function of burn-up according to Adamson at
al.
2.3.2 Thermal Conductivity
The thermal conductivity of oxide fuels is a function of temperature, composition, density, oxygen content (oxygen-to-metal ratio, O/M) or the deviation from stoichiometry, and the fuel burn-up. The thermal conductivities of both UO2 and MOX are reduced with temperature up to around 2000 K and then rise with temperature. The addition of PuO2 into the UO2 matrix reduces the thermal conductivity because of fuel heterogeneity. Moreover, the deviation of O/M from stoichiometry reduces the thermal conductivity. The fuel burn-up reduces the fuel conductivity due to the creation of FP with lower conductivity and due to the creation of new porosity. Furthermore, at high burn-ups (locally exceeding 75 MWd/kgU), the formation of the High Burn-up Structure at pellet rim locally degrades the conductivity.
There is a large amount of data and correlations for the thermal conductivity of fuel. The data are not so extensive for MOX fuel as they are for UO2 fuel. Since 1980, theoretical research and new measurements have led to improvements in equations for thermal conductivity of un-irradiated UO2. Recent reviews of the thermal conductivity of MOX fuel[16],[17] conclude that the presence of small quantities of PuO2 in UO2 slightly decreases the thermal conductivity. For example, KAERI[18] describes this degradation as a two phase material with different thermal conductivities in the matrix and in the plutonium-rich agglomerates (the reduction of thermal conductivity ranges from 7 to 10%). BNFL[19] applies a uniform degradation of 8%, while Framatome and Belgie-Nucleaire apply a linear degradation with the plutonium content[20],[21]. In-pile measurements of the centerline temperature of MOX fuel clearly indicate the slight degradation of thermal conductivity of fresh fuel[22],[23]. Measurement of the fuel center temperature of MOX irradiated to 50 MW·d/(kg HM) showed that the thermal conductivity degradation with burn-up in MOX is the approximately same as that in uranium fuel[20], Fig. 5 and Fig. 6.
Fig. 5 – Thermal conductivity as a function of temperature at different burn-ups for UO2 and MOX
fuel according to the correlation of Lanning at al.
Fig. 6 – Thermal conductivity as a function of burn-up at different temperatures for UO2 and MOX
fuel according to the correlation of Lanning at al.
2.3.3 Radial power and burn-up profile
The neutronic properties of MOX fuel are responsible for a decrease in reactivity with burn-up that is markedly less pronounced than that in uranium fuel. This leads to higher power densities at higher burn-ups in comparison with uranium assemblies. Moreover, the presence of plutonium in the pellet increases the thermal flux depression towards the centre, due to the large absorption of thermal
neutrons by the plutonium isotopes. At the beginning of the MOX fuel life, the radial power profile is therefore more depressed than that in uranium fuel, whereas at end of life the higher residual plutonium content at the fuel center leads to higher local powers[20].
2.3.4 Densification
Oxide ceramic fuels like UO2 and MOX are subjected to densification during the early stages of reactor irradiation. This phenomenon causes disappearance of submicron pores that led to a general fuel column lengthening, gap opening and pellet density increase. At a given burn-up, this process end. Furthermore, swelling and relocation oppose to its effects. Modeling fuel pellet relocation, swelling and densification is essential for the prediction of the thermal-mechanical behavior of fuel rod during irradiation.
The maximum fuel densification is reached at low burn-up (below 10 MWd/kg) and causes high fuel temperatures due to the gap thickness increase. The densification is therefore an important process to take in account for fuel safety evaluation. It is known that the irradiation induced densification of UO2 sintered fuel pellet is dependent on a combination of grain size, mean pore size and pore size distribution[24][25]. In particular, investigation on UO2 fuel showed that the stable fuel types (with low densifications) were characterized by grain sizes greater than 10 μm and median volume pores larger than 1 μm. The same general behavior was observed in MOX fuel, i.e., fuels with grain sizes greater than 10 μm and median pores larger than 6 μm were highly stable[24][25]. Moreover, in MOX fuel, because of the presence of Pu agglomerates one expects that Pu-rich zones give rise to high local fission rates and temperatures that affect fuel densification. In spite of the expected differences between UO2 and MOX fuel, the comprehensive study made by Freshley et al.[24][25] on a variety of MOX fuels indicated that:
The in-reactor densification of MOX fuel, as in UO2, is correlated to the density changes that occur under ex-reactor isothermal re-sintering tests, for a given fabrication process.
Generally, the densification behavior of MOX fuel is comparable with that of UO2 fuel, i.e., the Pu-rich agglomerates have no apparent effect on the densification.
The effects of fission rate and temperature on densification of MOX fuel are similar to those observed on UO2 fuel.
The majority of models used to describe in-reactor densification in fuel performance codes are empirically based, correlating the change in density ρD to fuel burn-up by a simple relation, for
example:
ρD = pD (1 - exp(-bu / buD)) Eq. 2
where pD is the maximum densification (or unstable porosity) and bu is the burn-up and buD is a
densification-related burn-up constant (burn-up at which densification end). We observe that at lower temperatures and lower fission rates, the densification is considerably smaller for both UO2 and MOX. These effects are taken in account changing the values of the constants in the equations. The maximum porosity reduction is related to the grain size as shown in the following equation based on experimental data of UO2 and MOX fuels[26],[27]:
pD =p0 (2.23 / d) Eq. 3
where p0 is the initial porosity and d is the average fuel grain size. However, Fig. 7 shows that the
Fig. 7 – Sinter-able porosity correlation.
2.3.5 Swelling
The swelling of fuel has two components: solid fission product swelling and gaseous swelling. The former is commonly taken to be an increasing linear function of burn-up, i.e,
ρs = c (bu) Eq. 4
where ρs is the change in fuel density due to solid swelling and c is a parameter in the range 0.6 to 1.0 % / 10MWd/kgHM[5]. These considerations apply both to UO2 and MOX.
The gaseous swelling is more complex depending on temperature and fission product gas inventory in fuel pellet. The gaseous swelling kinetics may be different in MOX fuel than in UO2 because of the difference in fission gas release of the two fuels. A more precise kinetic model for densification and swelling should account for both fuel macrostructure (median pore size, grain size, and Pu agglomerate size) and external fields (temperature and local fission rate).