Decomposition of Replacement Ratio of
Italian Generations at Differing Ages
F R A N C O B O N A R I N I University of Padua
1.Introduction.Italian women have continuously decreased over fertility time, so that those born since the early 20th century have not reached sufficient levels to ensure replacements at birth. Table 1 lists some values for the usual indicators: total fertility rate TFR, gross reproduction rate Rtand net reproduction rate R0,tfor the generations of Italian women born between 1860 and 1974, constructed with infor-mation available in the literature1. From 3.2 children per woman in the generations born at the beginning of the 20thcentury, the average number of children has grad-ually fallen to 1.4 among the 1970-74 generation – an average reduction of almost 2 children per woman over a period of 70 years. net reproduction rate R0,tis lower than one for all generations born during the 20th century, falling to 0.68 for the 1970-74 generation. R0,tis known to measure generation replacement at birth, and also takes into account mortality:
R0,t =∑xLx,tfx,t (1) where Lx,tand fx,trepresent person years lived in a female life table (with a unit radix) and the average daughter-only fertility rate for the cohort born in year t. The sum over age x is within the reproductive life-span, or between the ages of 15 and 49. The temporal decrease in mortality is clearly not sufficient to make up for the drop in fertility among generations and thus ensure replacement. The same indica-tor, calculated from the 1930s onwards, provides an entirely different picture of replacement of hypothetical generations: from 1930 to 1974, the indicator had a value greater than one – i.e., a sufficient level to ensure replacement – and only in 1975 did the value fall below one2. Thus, period indicators give a distorted image of generation replacement.
In a previous article published in this journal (Bonarini 2013), the replacement of Italian generations at various ages x was analyzed, also taking natural and migra-tory movements into account. The 20th-century generations born before the Second World War reached replacement level at later ages, whereas those born after the war remained below the replacement level, even at later ages. It should be noted here that I used a measure, replacement ratio RS, according to a comparison of the dimensions of two generations, daughters and mothers, both considered in their actual size at any given age x, due to mortality and migration patterns. The genera-tion of mothers born in year t was linked with that of their daughters, identified as the generation born at a distance from the former equal to the average interval
between generations, assumed here to be 30 years, or roughly equal to average age at childbirth3. The generation of mothers born in year t was thus considered in rela-tion to that of ‘daughters’ born in year t+30, and the total of the two generarela-tions at
Tab. 1. Fertility and reproductive measures at birth among cohorts of women born in year t
and period measures in the corresponding years t+30
Measures among the cohorts born in year t Period measures in year t+30
Birth years t Total fertility rate TFR Gross repro-duction rate R net repro-duction rate R0 Replacement rate at birth: RS0= B t+30 / B t Ratio (c)/(d) Ratio (d)/(e) Reference year t+30 Gross repro-duction rate R* net reproduc-tion rate R*0 -actual births estim-ated births
(a) (b) (c) (d) (e) (f) (g) (h) (i) (l)
1860-64 5.111 2.48 1.29 1.13 1.14 1865-69 5.04 2.44 1.21 1.11 1.09 1870-74 4.92 2.39 1.22 1.07 1.14 1875-79 4.68 2.27 1.20 1.04 1.15 1880-84 4.39 2.13 1.18 1.06 1.12 1885-89 4.002 1.94 1.10 0.73 1.50 1890-94 3.633 1.76 1.03 1.01 1.01 1895-99 3.34 1.62 1.00 0.96 1.04 1900-04 3.20 1.55 0.98 0.92 0.93 1.06 0.99 1930-34 1.54 1.19 1905-09 2.99 1.45 0.97 0.89 0.92 1.08 0.96 1935-39 1.50 1.19 1910-14 2.77 1.34 0.94 0.80 0.83 1.18 0.96 1940-44 1.35 1.06 1915-19 2.60 1.26 0.85 1.14 1.19 0.75 0.96 1945-49 1.42 1.22 1920-24 2.384 1.15 0.88 0.76 0.79 1.16 0.96 1950-54 1.17 1.06 1925-29 2.33 1.13 0.89 0.83 0.86 1.08 0.96 1955-59 1.13 1.05 1930-34 2.32 1.12 0.97 0.95 0.99 1.02 0.95 1960-64 1.19 1.12 1935-39 2.26 1.10 0.99 0.97 1.02 1.02 0.96 1965-69 1.23 1.17 1940-44 2.14 1.04 0.96 0.98 1.03 0.99 0.95 1970-74 1.14 1.10 1945-49 2.01 0.97 0.92 0.79 0.82 1.16 0.96 1975-79 0.96 0.93 1950-54 1.86 0.90 0.86 0.71 0.73 1.21 0.97 1980-84 0.77 0.76 1955-59 1.77 0.86 0.83 0.64 0.65 1.28 0.99 1985-89 0.66 0.65 1960-64 1.60 0.78 0.76 0.58 0.58 1.30 1.01 1990-94 0.64 0.63 1965-69 1.525 0.74 0.72 0.55 0.54 1.33 1.02 1995-99 0.59 0.58 1970-74 1.43 0.69 0.68 0.61 0.57 1.12 1.06 2000-04 0.62 0.61 1975-79 0.74 0.66 1.12 1980-84 0.89 0.74 1.19 1985-89 0.93 0.75 1.24
note: TFRvalues were: 1obtained from the 1931 fertility survey and reported on ever married women.
The cohorts were born respectively in the years 1861-65; 1866-70; 1871-75; 1876-80; 1881-85. 2
Estimated as half the sum in the neighbouring years. 3From Santini (1974). 4From ISTAT. 5The age
fer-tility rates from 2009 on are estimated.
age x was compared according to the following ratio:
RSx, t= (Wx, t+30+x) / (Wx, t+x) (2) where RSx,tindicates the replacement ratio at age x of the generation born in year t and Wx,t+x women at age x in year t+x. This ratio depends on the differing initial size of the two generations compared, and the intensity of mortality and migrations undergone by each generation from birth to the age in question. The overall measure can be decomposed into factors expressing the influence of their various components, in order to highlight their importance at various ages and in subsequent generations.
The above comparison can also be carried out at birth, according to the ratio between the number of annual daughter-only births (Bt) distanced by 30 years:
RS0, t= Bt+30/ Bt (3)
similar to the cohort net reproduction rate, as the two generations compared are understood as those of daughters and mothers. Since this measure is easier to obtain than net reproductive rate R0,t, it can be helpful in showing the formal rela-tions which exist between the indicators, in what condirela-tions the two measures take the same value, and still show when RS0,tcan be used as an estimate of R0,twith suf-ficient approximation.
Decomposition of RSx,tand relations between RS0,tand R0,tare the aims of this paper.
Specifically, I considered Italian generations born over the course of the 1900s, and first decomposed replacement ratio RSx,tinto its natural and migratory com-ponents, and then clarified the characteristics of RS0,t and relations existing between RS0,tand cohort net reproduction rate R0,t, both related to the generation born in year t.
2. Decomposition of RSxratio.As mentioned above, replacement ratio RSx,t com-pares, at the same age x, the actual size of two generations 30 years apart, allowing us to follow variations in replacements recorded at different ages. The observed val-ues of RSx,tare clearly associated with different numbers of births constituting the initial size of the two generations in question and the different intensity of mortali-ty and migrations (both in and out) experienced by each generation from birth to the age considered. Obviously, the numbers of a generation born in year t at age x, reached in year t + x, (Wx, t+x) can be expressed as the product of the number born in year t (Bt) to the probability of surviving until age x and a factor related to the intensity of migration undergone until that age. In addition, the initial size of the generation can be decomposed into the product of a factor related to the numbers of the female population in year t and to its level of fertility in the same year. Here, it is helpful to use the average generation in year t (Gmt), i.e., the average number of women of age x (Wx,t) obtained assuming as weights female fertility rates (f*x,t)
observed in year t (Calot 1984). That is:
Gmt= ∑x Wx,tf* x,t/ (∑xf* x,t) = Bt/ R*t. (4) In this ratio, as we have seen, Btare female births in year t, R*t= ∑xf*x,tis the period gross reproduction rate for year t, and f*x,tis the age fertility rate in the same year. Ratio (4) directly yields the number of births Btas the product of average gen-eration Gmtand the gross reproduction rate in the same year: Bt= GmtR*t.
RSx,tcan then be decomposed as follows:
RSx,t= (Wx, t+30+x) / (Wx ,t+x) = (Bt+30/ Bt) (lx, t+30/ lx, t) (mx, t+30/ mx, t) = (Gm t+30/ Gm t) (R*t+30 / R*t) (lx, t+30/ lx, t) (mx, t+30 / mx,t). (5) Here lx,tindicates survival up to age x (lx, t / l0, t) and mx,tthe net intensity of migration until age x of generation t. Decomposition of the size of a generation at age x into factors linked to total births in year t-x and the intensity of mortality and migrations from birth to age x is certainly not new. For instance, a similar approach was employed by Preston, Himes and Eggers (1989) in the decomposition of age-specific growth rates within a population. Our aim here is to analyse the impact of the above factors on the replacement of compared generations. Decomposition emphasises the importance of conditions which determine the total number of births in years t and t+30 – that is, the various age structures of the population of reproductive age and fertility levels in each of these two years – and the influence of the intensity of mortality and migration from birth until age x on both genera-tions. note that these factors express effects in comparative terms. A value of the ratio between migration coefficients greater than one can mean either less out-migration among the generation of daughters (generation t+30) with respect to that of the mothers (generation t) or a different quantum of immigration for the two generations. In practice, the first three factors above can easily be calculated direct-ly, whereas the fourth, linked to migrations, can be estimated as a residual by replacement ratio RSx,t.
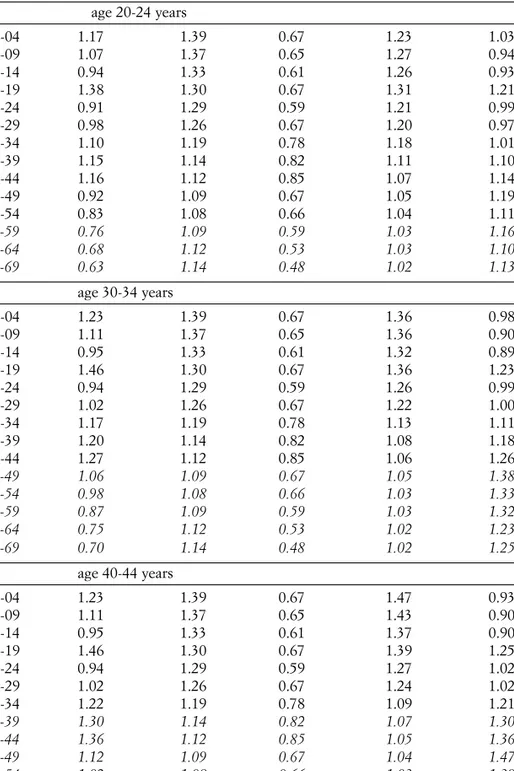
Table 2 lists the results of this decomposition applied to Italian generations born between 1900 and 1969, with reference to RSx,tvalues for three age classes4. Several indicators are estimated, as explained in note5. In particular, the replacement ratios for the more recent generations were constructed according to the expected cohorts in the medium scenario for the Italian population of by ISTAT (2007).
Similar results for generational replacement can be obtained from expected popu-lations in other scenarios6. These ratios, computed according to estimates of future populations or intensity of various phenomena are shown in italics in table 2.
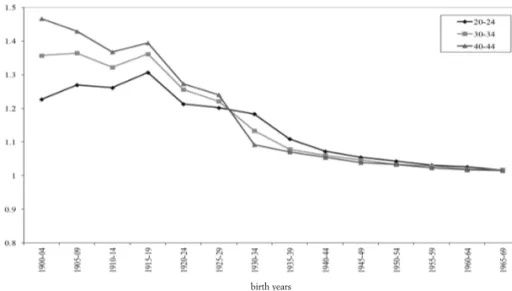
Almost all the generations born before the Second World War are replaced by generations of daughters in every age class after birth, whereas generations born later are not replaced at 20-24 years of age until those born from 1945 onwards, and not until after 1950 when all three age classes are taken into account (fig. 1). note the particularly high replacement ratios of the generations born during the First
Tab. 2. Decomposition of the replacement ratio RSx,tfor selected age groups Cohort (t) RS x,t Gm t+30/ Gm t R* t+30/ R* t l x,t+30/ l x,t m.x,t+30/ m x,t. age 20-24 years 1900-04 1.17 1.39 0.67 1.23 1.03 1905-09 1.07 1.37 0.65 1.27 0.94 1910-14 0.94 1.33 0.61 1.26 0.93 1915-19 1.38 1.30 0.67 1.31 1.21 1920-24 0.91 1.29 0.59 1.21 0.99 1925-29 0.98 1.26 0.67 1.20 0.97 1930-34 1.10 1.19 0.78 1.18 1.01 1935-39 1.15 1.14 0.82 1.11 1.10 1940-44 1.16 1.12 0.85 1.07 1.14 1945-49 0.92 1.09 0.67 1.05 1.19 1950-54 0.83 1.08 0.66 1.04 1.11 1955-59 0.76 1.09 0.59 1.03 1.16 1960-64 0.68 1.12 0.53 1.03 1.10 1965-69 0.63 1.14 0.48 1.02 1.13 age 30-34 years 1900-04 1.23 1.39 0.67 1.36 0.98 1905-09 1.11 1.37 0.65 1.36 0.90 1910-14 0.95 1.33 0.61 1.32 0.89 1915-19 1.46 1.30 0.67 1.36 1.23 1920-24 0.94 1.29 0.59 1.26 0.99 1925-29 1.02 1.26 0.67 1.22 1.00 1930-34 1.17 1.19 0.78 1.13 1.11 1935-39 1.20 1.14 0.82 1.08 1.18 1940-44 1.27 1.12 0.85 1.06 1.26 1945-49 1.06 1.09 0.67 1.05 1.38 1950-54 0.98 1.08 0.66 1.03 1.33 1955-59 0.87 1.09 0.59 1.03 1.32 1960-64 0.75 1.12 0.53 1.02 1.23 1965-69 0.70 1.14 0.48 1.02 1.25 age 40-44 years 1900-04 1.23 1.39 0.67 1.47 0.93 1905-09 1.11 1.37 0.65 1.43 0.90 1910-14 0.95 1.33 0.61 1.37 0.90 1915-19 1.46 1.30 0.67 1.39 1.25 1920-24 0.94 1.29 0.59 1.27 1.02 1925-29 1.02 1.26 0.67 1.24 1.02 1930-34 1.22 1.19 0.78 1.09 1.21 1935-39 1.30 1.14 0.82 1.07 1.30 1940-44 1.36 1.12 0.85 1.05 1.36 1945-49 1.12 1.09 0.67 1.04 1.47 1950-54 1.02 1.08 0.66 1.03 1.39 1955-59 0.91 1.09 0.59 1.02 1.40 1960-64 0.77 1.12 0.53 1.02 1.27 1965-69 0.69 1.14 0.48 1.01 1.24
World War, the rising ratios for the generations which had higher fertility levels during the baby boom and, lastly, the clear-cut decrease in ratio values for succes-sive generations, with lower fertility rates.
The role of fertility change in temporal variations of the replacement ratio is essential, as evidenced by the low values of the respective coefficients and the par-allel dynamics of the two indicators: RSx,tand R*t+30/ R*t. All the factors of the
Fig. 1. Replacement ratios of Italian cohorts in the age groups 20-24, 30-34 and 40-44
Fig. 2. Ratio between migration index in the cohorts of daughters and in the cohorts of mothers
(m x, t+30/m x, t: ) in the age groups 20-24, 30-34 and 40-44
birth years birth years ra ti o s ra ti o s
decomposition contribute to the recent decrease in the replacement ratio. The only exception is the factor linked to migrations, which is working in the opposite and positive direction, although it is insufficient to neutralize the negative impact of the other factors.
For the most part, migrations have had a positive effect on the generations examined here, with a coefficient greater than or close to one and, among the more
Fig. 3. Ratio between survival index in the cohorts of daughters and in the cohorts of mothers
(l x, t+30/ l x, t) in the age groups 20-24, 30-34 and 40-44
Fig. 4. Values of R0,t (net reproduction rate) and RS0,t ( replacement ratio at birth) for the cohorts born in the years indicated
birth years birth years ra ti o s ra ti o s
recent generations, even higher, especially in the older age classes (fig. 2). Instead, the contribution of the decrease in mortality, essential in the replacement of older generations, has constantly declining values until it becomes almost insignificant among the youngest generations, with coefficients near one (fig. 3). Also quite evi-dent is the decrease in the importance of the effect of population structure and the average size of cohorts of reproductive age, which resemble mortality except for the fact that we observe that coefficients increase with respect to the most recent gen-erations, reflecting moderately rising values due to a slight recovery of fertility and foreign immigration. A measure of the weight of each factor on the RSx,t replace-ment ratio can be seen in the absolute values of the logarithms of the respective coefficients and the relative percent distributions. Focusing on more recent gener-ations, fertility is observed to have a relative weight – on the sum of the coefficients – exceeding 60%, but it may even reach 70% in several cases. Migrations play an increasing role with age, slightly more than 10% in the 20-24 age class of recent cohorts, but as high as 30% in the older age classes, among cohorts born in the peri-od immediately after the Second World War. The structural component has a more modest weight of around 12% and mortality of less than 2%.
3. Generation replacement at birth.As already mentioned, the replacement ratio at birth of generation t is given by comparing the number of births in years t and t + 30, i.e., RS0, t= Bt+30/Bt. The values for this indicator are listed in table 1, column d, and were obtained from the ratio between the number of births during calendar years t+30 - t+34 and births during years t - t+4. Figure 4 also shows the values of the same indicator, calculated with reference to births in each calendar year, com-pared with those over a distance of 30 years.
The temporal dynamic of RS0,t mirrors the trend already highlighted by R0,t, although several peculiarities reflect conditions linked to WW1 and the baby boom of the 1960s. WW2 had less obvious repercussions on this temporal dynamic. The RS0,tratio is greater than one – and thus expresses the attainment of replacement at birth – among the generations born between 1862 and 1883. This ratio then falls to values lower than one, and these levels were maintained until very recently, except those relating to the generations born during the years of war. The decrease in births due to WW1 is echoed in the replacement ratio of the generations born around the year 1889. These are more numerous, compared with the relatively smaller groups born around 1919, and do not achieve replacement levels at birth. Instead, the generations born during WW1, due to their scarcity, are abundantly replaced by those born after WW2, i.e., around 1948. As a consequence, we observe a relatively high RS0,tvalue, near 1.6. Similarly, the value of RS0,t, greater than one, is observed for the generations born between 1934 and 1936, which are compared with the more numerous generations born between 1964 and 1966. A similar pattern emerges for the less numerous generations born in 1944-45 com-pared with those of 1974-75. As mentioned above, the decline in RS0,tpersists until the 1965-69 generation, associated with the next generation of births, when fertili-ty fell to an historic low (1995). This dynamic is then reversed, with rising values of
RS0,tuntil the most recent generations, due to the recovery of births over the last few years. The ratio for the 1985-89 generation was calculated according to births forecast by ISTAT. In sum, this indicator shows that the generations born during the
20thcentury did not replace themselves at birth, apart from a few exceptions. The RS0,t values provide roughly the same information as that obtained with R0,t but with a more extensive temporal framework.
Comparison of the two indicators shows that R0,tis usually greater than RS0,t– except among the generations affected by WW1 and those born in the baby boom years – particularly for those born after 1945. We can analyse the difference between the two indicators and generally see in what conditions the two indicators have the same value.
For this purpose it is useful to develop the ratio R0,t/ RS0,tas follows, taking into account that equation (4) gives Bt= GmtR*t.
R0,t/ RS0,t= R0 ,t(Bt/ Bt+30 ) = R0,t((GmtR*t) / (Gmt+30R*t+30)) ≈ Rtl30,t(Gmt/ Gmt+30) (R*t/ R*t+30) = (Gmt/ Gmt+30) R*tl30, t(Rt/ R* t+30). (6) R0,tand Rtindicate the net and gross reproduction rates of the generation born in year t, l30,texpresses survival of the same generation to age 30, and R*tindicates the period gross reproduction rate for year t7.
The ratio between R0,tand RS0,tfor generation t is decomposed as the product of four factors. The first (Gmt/Gmt+30) is related to the different age structure of the female population of childbearing age in the year of birth of the two cohorts. When this population grows over time, the factor assumes values of less than one. Instead, when such a population is not growing, the factor assumes values equal to or greater than one. Table 3 shows that, for Italian generations, this factor is consistently lower than one and grows in time, so that for the 1980 generation (not shown in table 3) it is 0.99.
The second factor, R*t, expresses the level of fertility in year t. It is known that
Tab. 3. Decomposition of the ratio R0,t/ RS0,t
Years Gm t/ Gm t+30 R*t l 30, t R t/ R* t+30 R0,t/ RS0,t t (a) (b) (c) (d) (e) 1930 0.81 1.70 0.81 0.96 1.07 1935 0.87 1.50 0.89 0.85 0.98 1940 0.88 1.54 0.93 0.89 1.10 1945 0.91 1.19 0.94 0.95 0.93 1950 0.93 1.26 0.95 1.14 1.23 1955 0.93 1.13 0.96 1.26 1.27 1960 0.91 1.17 0.97 1.25 1.26 1965 0.87 1.29 0.98 1.24 1.36
note: Gmt indicates the mean generation in year t , R*tthe gross reproduction rate in year t and Rtthe gross reproduction rate for the cohort born in year t.
Italian fertility was higher in the past, with R*tgreater than one, and that it then decreased to R*tequal to 0.65 in 1995.
The third factor expresses the level of survival from birth to average age at child-birth of generation t. Over time, mortality decreases and approaches one for younger generations.
The fourth factor (Rt /R*t+30) compares the fertility of the generation born in year t with that observed in year t + 30. If there were no temporal variations in aver-age aver-age at childbirth among the generations and if a linear dynamic of Rtis assumed, then factor (Rt/ R* t+30) would be one (Ryder 1964). When average cohort age at childbirth decreases, i.e., when the fertility age profile is rejuvenated, this ratio is less than one. Instead, when average age at childbirth increases – or fertility ages – the ratio is greater than one. We can describe this effect as cohort variations in aver-age aver-age at childbirth, or factor d. Table 3 shows that, from the 1950 generation onwards, this factor is greater than one and is almost stable.
The combination of these factors determines the value of the ratio between the indicators. In the generations born after 1945, this ratio is high and therefore the value of R0,tis appreciably higher than RS0,t. The difference is attributable to the fer-tility level in the year of birth of generations of mothers (born in year t) and to an increase in average age at childbirth in generations.
As in the latest generations, the first and third factors are both close to one; as dis-cussed above, in order to reach equality between the indicators for generation t, it is sufficient to assume a value of R*t= 1 and constancy of average age at childbirth over generations.
The estimate of R0,t for the most recent generations according to the values of RS0,tis easily obtainable, as we know the fertility of recent years (R*t) and can set the value on factor d, as the factors related to age structure and survival are almost equal to one. For example, at present, we do not know R0for 1975 and 1980 generations, but we do know RS0,t. Factor d may be assumed to be constant and equal to the last value listed in table 3. We thus obtain values of R0,1975= 0.80 and R0,1980= 0.87, start-ing from RS0,1975= 0.66 and RS0,1980= 0.87. The value of R0,1980is given by the prod-uct of the factor linked to population strprod-ucture, 0.99, R*t= 0.82 and d = 1.24.
The replacement ratio at birth, RS0,t, can also be used to estimate the effects of migration on the replacement of Italian generations. The decomposition made in the previous section, RSx,tallows us to assess the impact of migration from birth onwards, but migrations also include an indirect effect, due to changes in the pop-ulation, with repercussions on the number of births in the various years. Births Bt and Bt+30in ratio RS0,tare those recorded each year for the resident population and thus drawn from the resulting population net of mortality and migratory move-ments. We can evaluate the effect of migratory movements on the number of births each year – and thus on the replacement ratio value – by comparing the number of births with those which would have occurred in the population without migrations over a given time period or, in this case, over the whole of the 20thcentury. For this purpose, the Italian population, distinguished by sex and age at the beginning of each year from 1900 onwards, was reconstructed, beginning with the generations
born during the second half of the 19thcentury and projected with survivals taken from the respective life tables. This population was used to estimate births accord-ing to fertility rates by age for each year.
The actual number of births is lower than that estimated for all the years of the 20thcentury, with a ratio of 89% at the beginning of the century, decreasing to 82% in the decade 1975-84 and then foreseen to rise to over 102% in 2015-198. Replacement ratios RS0,t, calculated with estimated births (column e of table 1) reflect the dynamic described by the ratios calculated with actual births. However, until the generation born in 1960-64, the ratios obtained with estimated births take on values higher than those calculated from actual births and the opposite for cohorts born after 1964 (column g in table 1). Thus, past out-migrations reduced the replacement ratio at birth until the generation of 1960-64. Among successive generations, the effects of two convergent forces combine. On one hand, in the actual population, migratory flows changed direction and in-migration became more prevalent. On the other hand, in the reconstructed population, the temporal reduction in fertility caused a decrease in the number of births. Consequently, the replacement ratios calculated in the two populations have an inverse relationship with that observed among the previous generations.
In any case, replacement ratios calculated for the closed population are also less than one, with the exception of those for generations born during the years of the two World Wars. Thus, the non-replacement of generations at birth in the actual population is only partially attributable to the indirect effects of migrations, and is essentially due to the effects of natural components.
4. Conclusions.Generation replacement is analysed here by linking the generations of mothers with those of their daughters, identified as the generation born at a dis-tance equal to the average interval between the generations. Empirically speaking, we analyse the replacement of generations distanced by 30 years.
The measure used, RSx,t(replacement ratio at age x of the generation born in year t) was constructed with reference to birth (RS0,t) with the ratio between the number of births in year t+30 and year t and, in general, with reference to age x, with the ratio between the size of the two generations observed at the same age x in years t+30+x and t+x. This measure was relatively easy to calculate with informa-tion normally available and, unlike other similar measures recently proposed, was constructed taking into account both generations compared at the same age, at a distance of 30 years from one another. This procedure allowed an assessment of generational replacement in particular age ranges.
The RSx,tratio can easily be decomposed into factors linked to various compo-nents identified in the population structure and fertility levels in the years of birth (t and t+30) of the compared generations and levels of mortality and migration undergone by the two generations until age x. Decomposition thus allows us to measure the effect of migrations on generational replacement, obtained as a resid-ual effect, even in situations in which reliable direct data are not available. With regard to births, the RS0,tratio essentially mirrors the temporal dynamic of cohort
net reproduction rate R0,t in the time periods which were not particularly per-turbed. Comparison of the two indicators with reference to the Italian generations shows that R0,tis usually greater than RS0,t. Examination of the relations between the indicators for the most recent generations shows that the main factors deter-mining the difference between the indicators are the level of fertility in year t, or the period reproduction rate (R*t) in the year of birth of cohort t (that of the mothers), and variations in average age at childbirth among generations. If R*t=1 and aver-age aver-age at childbirth among the generations is constant, the two indicators are near-ly equal.
Italian generations born in the 20th century have an R
0value lower than one. However, those born before WW2 recovered replacement levels at successive ages, benefiting from improvements in survival and the differential effect of migrations. The generations born after that war did not recover these levels, at least for the young ages considered here. Decomposition of replacement ratios at various ages (RSx) highlights the essential importance of migrations in the replacement ratios at various ages. These last factors have a particularly significant impact at older ages and reach a weight near and sometimes greater than that relative to fertility. The age classes considered here are essentially exemplary in meaning, although replacement ratios could certainly be calculated with reference to other ages, e.g., that around retirement. The replacement ratios at 60-64 years of age for the 1915-19 generation are 1.65 and for the 1945-49 generation 1.15. This means that, in 2010, women in this age class were 65% more numerous that those recorded in 1980, and in 2040 they will be 15% more numerous than those recorded in 2010. If we consider less unique generations, such as those born in 1920-24 and 1950-54, replacement ratios at the same age are lower, 1.07 and 1.04 respectively, but they move in a similar direction to those above.
1For Italy, total fertility rates can be calculated
beginning with the generations of the mid-1800s onwards. More specifically, for generations born between 1851-56 and 1881-85, data are available from the 1931 fertility survey (ISTAT 1936), reprocessed and applied to cohorts of women, including those who did not marry, by Festy (1979). For generations born between 1890 and 1941, data from Florentine demographers are available, integrated and reported by Santini (1974) and carried out with data on civil status available from 1930 onwards. Lastly, for genera-tions born after 1920, ISTAT data are available (1997, 1998, 2000).
2Period indicators are marked with an asterisk
from now on, in order to distinguish them from those concerning generations.
3I verified that, considering alternatively
genera-tions born at a distance of either 30 years or a smaller number of years up to 27 years, replace-ment ratios at birth were almost identical. A more
accurate choice of this distance, as changes in the mother’s average age at birth would be irrelevant (Bonarini 2013).
4 For easier reading, in table 3 the subscripts
reported in the single coefficients refer to the ini-tial calendar year t or the iniini-tial year of age x in the generations (fiveyear groupings) born in years t -t+4 and of age x - x+4. RSx,t (as shown in the table) thus refers to the replacement ratio of generations born in the years t-t+4 and of age x-x+4 at the end of years t+4+x, compared with generations born in years t+30 – t+34 and of the same age x –x+4 at the end of year t+34+x. Gmtand R*tare average values referring to years t-t+4. Similarly, lx,tand mx,t are average values of survival and the net effect of migrations until age x for generations born in years t - t+4.
5For the years prior to 1930, the total fertility rate
(TFR*) and thus the gross reproduction rate (R*) were estimated according to the ratio (Bt/W15-49) x 35. For the years prior to 1930, average
genera-tion Gmtwas estimated according to age-specific fertility rates from 1930. Survival for the years until 2007 was extrapolated. The survival coeffi-cient used – lx,t– refers to the generation born in the median year of each five-year grouping.
6I verified that the replacement ratios for the
var-ious ages did not change significantly when ISTAT’s population projections, particularly the medium and high scenarios, were applied.
7It is assumed the equation R
0,t= lμ,t∑xfx,t= lμ,tRt.
This is valid if there is a linear variation of lx between ages 15 and 50, where μ is the average age at childbirth. In addition, μ is assumed to be 30 years.
8Obviously, comparisons made in the last few
years according to number of births estimated by ISTATalso includes migration.
Bibliography
F. Bonarini 2013, L’impatto delle migrazioni nella
sostituzione delle generazioni italiane e nella dinamica della popolazione italiana,
«Popo-lazione e storia», 2, 39-60.
G. Calot 1984, Une notion intéressante: l’effectif
moyen des générations soumises au risque,
«Population», 6, 947-976.
P. Festy 1979, La fécondité des pays occidentaux de
1870 a 1970, Presse Universitaire de France,
Paris (Travaux et documents. Cahier, 85). ISTAT1936, Indagine sulla fecondità della donna,
Censimento generale della popolazione 21 aprile 1936, 6.
ISTAT1997, La fecondità nelle regioni italiane.
Analisi per coorti. Anni1952-1993, ISTAT,
Roma.
ISTAT1998, La fecondità regionale nel 1994, ISTAT, Roma (Informazioni, 66).
ISTAT2000, La fecondità regionale nel 1996, ISTAT, Roma (Informazioni, 11).
ISTAT 2007, Previsioni della popolazione, in http://demo.istat.it.
S.H. Preston, C. Himes, M. Eggers 1989,
De-mographic Conditions Responsible for Popu-lation Aging, «Demography», vol. 26, 4,
691-704.
n.B. Ryder 1964, The process of Demographic
Translation, «Demography», vol. 1, 1, 74-82.
A. Santini 1974, La fecondità delle coorti. Studio
longitudinale della fecondità italiana dall’i-nizio del secolo XX. Dipartimento statistico
matematico dell’Università degli Studi di Firenze, Firenze.
Riassunto
Una scomposizione del rapporto di sostituzione delle generazioni italiane alle varie età
Questo articolo considera la sostituzione delle generazioni alla nascita ed alle età successive, tenendo conto delle componenti naturali e dei movimenti migratori. La generazione nata in un anno t (generazione delle madri) è confrontata con la generazione nata nell’anno t+30 (generazione delle figlie). Si costruisce un rapporto tra l’ammontare effettivo delle due generazioni a confronto considerate alla nascita (rapporto analogo al tasso netto di riproduzione) ed in generale ad ogni età x. Tale rapporto può essere facilmente scomposto nel prodotto di fattori legati alle diverse componenti che lo determinano: la dimensione iniziale delle generazioni, dovuta alla struttura per età della popolazione ed alla fecondità nell’anno di nascita, il livello di mortalità e le migrazioni sperimentate da ciascuna generazione fino all’età x. I risultati conseguiti riguardano le generazioni italiane nate nel ventesimo secolo.
Summary
Decomposition of replacement ratio of Italian generations at differing ages
This article considers generation replacement at birth and at successive ages, taking into account both natural and migratory movements. The generation born in year t (generation of mothers) is compared with the generation born in year t+30 (generation of daughters). We consider the actual size at any given age x for each of these generations. A measure is constructed with reference to birth, and, in general, with reference to age x. The relation with the net reproduction rate is explored. The measure can easily be decomposed into factors linked to the different components: population structure and fertility level in the years of birth of the compared generations and level of mortality and migration experienced by the two generations. We consider Italian generations born over the course of the 1900s, each of which recorded a net reproduction rate of less than one. The results allow for an evaluation of the impact of migrations and mortality on the replacement of Italian generations at various ages.
Parole chiave
Sostituzione delle generazioni; Scomposizione del rapporto di sostituzione; Impatto delle migrazioni; Impatto della mortalità; Stima del tasso netto di riproduzione.
Keywords
Generation replacement; Decomposition of generations replacement; Effect of migrations on generation replacement; Estimation of net reproduction rate.