ScienceDirect
Available online at Available online at www.sciencedirect.comwww.sciencedirect.com
ScienceDirect
Energy Procedia 00 (2017) 000–000
www.elsevier.com/locate/procedia
1876-6102 © 2017 The Authors. Published by Elsevier Ltd.
Peer-review under responsibility of the Scientific Committee of The 15th International Symposium on District Heating and Cooling.
The 15th International Symposium on District Heating and Cooling
Assessing the feasibility of using the heat demand-outdoor
temperature function for a long-term district heat demand forecast
I. Andrić
a,b,c*, A. Pina
a, P. Ferrão
a, J. Fournier
b., B. Lacarrière
c, O. Le Corre
c aIN+ Center for Innovation, Technology and Policy Research - Instituto Superior Técnico, Av. Rovisco Pais 1, 1049-001 Lisbon, PortugalbVeolia Recherche & Innovation, 291 Avenue Dreyfous Daniel, 78520 Limay, France
cDépartement Systèmes Énergétiques et Environnement - IMT Atlantique, 4 rue Alfred Kastler, 44300 Nantes, France
Abstract
District heating networks are commonly addressed in the literature as one of the most effective solutions for decreasing the greenhouse gas emissions from the building sector. These systems require high investments which are returned through the heat sales. Due to the changed climate conditions and building renovation policies, heat demand in the future could decrease, prolonging the investment return period.
The main scope of this paper is to assess the feasibility of using the heat demand – outdoor temperature function for heat demand forecast. The district of Alvalade, located in Lisbon (Portugal), was used as a case study. The district is consisted of 665 buildings that vary in both construction period and typology. Three weather scenarios (low, medium, high) and three district renovation scenarios were developed (shallow, intermediate, deep). To estimate the error, obtained heat demand values were compared with results from a dynamic heat demand model, previously developed and validated by the authors.
The results showed that when only weather change is considered, the margin of error could be acceptable for some applications (the error in annual demand was lower than 20% for all weather scenarios considered). However, after introducing renovation scenarios, the error value increased up to 59.5% (depending on the weather and renovation scenarios combination considered). The value of slope coefficient increased on average within the range of 3.8% up to 8% per decade, that corresponds to the decrease in the number of heating hours of 22-139h during the heating season (depending on the combination of weather and renovation scenarios considered). On the other hand, function intercept increased for 7.8-12.7% per decade (depending on the coupled scenarios). The values suggested could be used to modify the function parameters for the scenarios considered, and improve the accuracy of heat demand estimations.
© 2017 The Authors. Published by Elsevier Ltd.
Peer-review under responsibility of the Scientific Committee of The 15th International Symposium on District Heating and Cooling.
Keywords: Heat demand; Forecast; Climate change
Energy Procedia 141 (2017) 86–90
1876-6102 © 2017 The Authors. Published by Elsevier Ltd.
Peer-review under responsibility of the scientific committee of the 4th International Conference on Power and Energy Systems Engineering.
10.1016/j.egypro.2017.11.017
10.1016/j.egypro.2017.11.017
© 2017 The Authors. Published by Elsevier Ltd.
Peer-review under responsibility of the scientific committee of the 4th International Conference on Power and Energy Systems Engineering.
1876-6102
Available online at www.sciencedirect.com
ScienceDirect
Energy Procedia 00 (2017) 000–000
www.elsevier.com/locate/procedia
1876-6102 © 2017 The Authors. Published by Elsevier Ltd.
Peer-review under responsibility of the organizing committee of CPESE 2017.
4th International Conference on Power and Energy Systems Engineering, CPESE 2017, 25-29
September 2017, Berlin, Germany
Solar Photovoltaic Energy and Its Spatial Dependence
Sergio Copiello
a*, Carlo Grillenzoni
a a IUAV University of Venice, Dorsoduro 2206, 30123 Venice, ItalyAbstract
In the last decade, solar photovoltaic has started to play a significant role in the energy mix consumption. Although this growth has involved almost all the western countries, marked differences in the regional distribution of photovoltaic generation capacity have been observed. These differences appear to be weakly related to climate conditions in general, and to solar radiation specifically. The literature has started to investigate the other underlying determinants, suggesting to consider the occurrence of spatial proximity effects. Accordingly, this study aims to analyze whether and to what extent the photovoltaic energy production depends on local factors, such as climate, demand, income, innovative and responsible behavior, and so forth. Through a spatial autoregressive model, we find that the regional distribution of photovoltaic production capacity is affected by strong spatial dependence. We show that the availability of photovoltaic energy may be explained by peer effects, such as diffusion of habits and emulation of neighbors.
© 2017 The Authors. Published by Elsevier Ltd.
Peer-review under responsibility of the organizing committee of CPESE 2017. Keywords: solar photovoltaic; spatial energy; spatial data; peer effects; neighborhood effects
1. Introduction and background literature
The energy production and consumption models have experienced significant changes during the last decades [1]. On the supply side, although fossil fuels are still the most prominent sources, the transition to renewables is underway. Many countries have massively developed photovoltaic (PV) power generation systems. As a case in point, the share of electricity consumption met by solar energy is now more than 5% in Germany and up to 7% in Italy [2].
* Corresponding author. Tel.: +39 41 257 1387.
E-mail address: [email protected]
Copiello S. and Grillenzoni C. / Energy Procedia 00 (2017) 000–000
Nomenclature
Ci creativity index [%] Pp per capita photovoltaic production [kWh] Ec per capita electricity consumption [kWh] Ps consumption met by photovoltaic [%] Ef exogenous factors Sr solar radiation [MJ/m2]
Gdp per capita gross domestic product [Euros] constant
Hd housing density [Building/km2] ,,, regression coefficients Hm average size of households s spatial indicator
Ir innovative and responsible behaviour s-1 indicator for spatially lagged variables Worldwide, the installed capacity has grown to over ten times the level in 2007 [2]. According to IEA’s Outlook, solar energy is expected to play an increasing role in the years to come [3]. The above framework suggests investigating the PV deployment at regional and local scale and its determinants, the knowledge of which is rather limited. Balcombe et al. [4] have reviewed the motivations and barriers to the adoption of microgeneration technologies. Besides the local climate characteristics - especially the level of solar radiation [5] - several socioeconomic factors - such as age, income, investment cost, expected and actual return on investment - have been found to explain the consumers’ propensity to use renewable energy systems [6-11]. Balta-Ozkan et al. [12] show that also electricity demand, population density, pollution, and education are significant drivers.
Spatial dependence characterizes many ecological and social phenomena. It means that the behavior of a unit is affected by what happens in the surrounding areas, due to the so-called peer interaction effects, such as the diffusion of habits and the emulation of neighbors. A devoted research branch has stressed that proximity, neighborhood effects, and peer effects are important in shaping the spatial deployment of PV installations [11-17]. These effects turn out to play a prominent role, more than climate conditions [18]. A comprehensive review of the literature mentioned above can be found in Balta-Ozkan et al. [12].
2. Models, data, and method
We are interested in analyzing the dynamic relationship between the per capita PV production (Pp), the share of electricity consumption met by PV energy (Ps), and other explanatory covariates, in order to understand the behavior of the solar energy market. Our data are not simple cross-sectional because a spatial order characterizes the observations in the sample, which thus are not interchangeable. The spatial contiguity of the units raises a problem of serial correlation that seriously affects the statistical properties of the estimates. Analogous to the time series analysis, the issue can be solved by using spatial autoregressive (SAR) systems that include lagged terms [19,20,21]. SAR systems are useful to express the bivariate relationship between energy production and consumption.
Let us define the spatial index s=[latitude, longitude]. The first-order lagged dependent variables Pps-1 and Pss-1
are represented by the average values of Pps and Pss in the surrounding areas. Besides these lagged dependent
variables, the other explanatory variables we consider are as follows: Ecs represents the per capita electricity
consumption; Irs is the vector of variables assumed as proxy of innovative and responsible behavior; Efs is the vector
of exogenous factors. The three following variables approximate innovative and responsible behavior: creativity index (Cis); technology index; waste recycling rate. The vector of exogenous factors include several variables:
latitude; solar radiation (Srs); surface area; residential buildings; housing density (Hds); population density;
households; average number of members per household (Hms); per capita gross domestic product (Gdps),
manufacturing firms, share of Plc and Ltd companies.
If the errors s are mutually independent, then the estimation of the SAR system can be performed by separate
equations. Accordingly, the two regression models, with parameters , , , , and are as follows:
s s 1 -s s
α
β
Pp
γ
Ec
ε
Pp
δ'
Ir
s
ω'
Ef
s
(1) s s 1 -s sα
β
Ps
γ
Ec
ε
Ps
δ'
Ir
s
ω'
Ef
s
(2)Sergio Copiello et al. / Energy Procedia 141 (2017) 86–90 87
© 2017 The Authors. Published by Elsevier Ltd.
Peer-review under responsibility of the scientific committee of the 4th International Conference on Power and Energy Systems Engineering.
Available online at www.sciencedirect.com
ScienceDirect
Energy Procedia 00 (2017) 000–000
www.elsevier.com/locate/procedia
1876-6102 © 2017 The Authors. Published by Elsevier Ltd.
Peer-review under responsibility of the organizing committee of CPESE 2017.
4th International Conference on Power and Energy Systems Engineering, CPESE 2017, 25-29
September 2017, Berlin, Germany
Solar Photovoltaic Energy and Its Spatial Dependence
Sergio Copiello
a*, Carlo Grillenzoni
a a IUAV University of Venice, Dorsoduro 2206, 30123 Venice, ItalyAbstract
In the last decade, solar photovoltaic has started to play a significant role in the energy mix consumption. Although this growth has involved almost all the western countries, marked differences in the regional distribution of photovoltaic generation capacity have been observed. These differences appear to be weakly related to climate conditions in general, and to solar radiation specifically. The literature has started to investigate the other underlying determinants, suggesting to consider the occurrence of spatial proximity effects. Accordingly, this study aims to analyze whether and to what extent the photovoltaic energy production depends on local factors, such as climate, demand, income, innovative and responsible behavior, and so forth. Through a spatial autoregressive model, we find that the regional distribution of photovoltaic production capacity is affected by strong spatial dependence. We show that the availability of photovoltaic energy may be explained by peer effects, such as diffusion of habits and emulation of neighbors.
© 2017 The Authors. Published by Elsevier Ltd.
Peer-review under responsibility of the organizing committee of CPESE 2017. Keywords: solar photovoltaic; spatial energy; spatial data; peer effects; neighborhood effects
1. Introduction and background literature
The energy production and consumption models have experienced significant changes during the last decades [1]. On the supply side, although fossil fuels are still the most prominent sources, the transition to renewables is underway. Many countries have massively developed photovoltaic (PV) power generation systems. As a case in point, the share of electricity consumption met by solar energy is now more than 5% in Germany and up to 7% in Italy [2].
* Corresponding author. Tel.: +39 41 257 1387.
E-mail address: [email protected]
Copiello S. and Grillenzoni C. / Energy Procedia 00 (2017) 000–000
Nomenclature
Ci creativity index [%] Pp per capita photovoltaic production [kWh] Ec per capita electricity consumption [kWh] Ps consumption met by photovoltaic [%] Ef exogenous factors Sr solar radiation [MJ/m2]
Gdp per capita gross domestic product [Euros] constant
Hd housing density [Building/km2] ,,, regression coefficients Hm average size of households s spatial indicator
Ir innovative and responsible behaviour s-1 indicator for spatially lagged variables Worldwide, the installed capacity has grown to over ten times the level in 2007 [2]. According to IEA’s Outlook, solar energy is expected to play an increasing role in the years to come [3]. The above framework suggests investigating the PV deployment at regional and local scale and its determinants, the knowledge of which is rather limited. Balcombe et al. [4] have reviewed the motivations and barriers to the adoption of microgeneration technologies. Besides the local climate characteristics - especially the level of solar radiation [5] - several socioeconomic factors - such as age, income, investment cost, expected and actual return on investment - have been found to explain the consumers’ propensity to use renewable energy systems [6-11]. Balta-Ozkan et al. [12] show that also electricity demand, population density, pollution, and education are significant drivers.
Spatial dependence characterizes many ecological and social phenomena. It means that the behavior of a unit is affected by what happens in the surrounding areas, due to the so-called peer interaction effects, such as the diffusion of habits and the emulation of neighbors. A devoted research branch has stressed that proximity, neighborhood effects, and peer effects are important in shaping the spatial deployment of PV installations [11-17]. These effects turn out to play a prominent role, more than climate conditions [18]. A comprehensive review of the literature mentioned above can be found in Balta-Ozkan et al. [12].
2. Models, data, and method
We are interested in analyzing the dynamic relationship between the per capita PV production (Pp), the share of electricity consumption met by PV energy (Ps), and other explanatory covariates, in order to understand the behavior of the solar energy market. Our data are not simple cross-sectional because a spatial order characterizes the observations in the sample, which thus are not interchangeable. The spatial contiguity of the units raises a problem of serial correlation that seriously affects the statistical properties of the estimates. Analogous to the time series analysis, the issue can be solved by using spatial autoregressive (SAR) systems that include lagged terms [19,20,21]. SAR systems are useful to express the bivariate relationship between energy production and consumption.
Let us define the spatial index s=[latitude, longitude]. The first-order lagged dependent variables Pps-1 and Pss-1
are represented by the average values of Pps and Pss in the surrounding areas. Besides these lagged dependent
variables, the other explanatory variables we consider are as follows: Ecs represents the per capita electricity
consumption; Irs is the vector of variables assumed as proxy of innovative and responsible behavior; Efs is the vector
of exogenous factors. The three following variables approximate innovative and responsible behavior: creativity index (Cis); technology index; waste recycling rate. The vector of exogenous factors include several variables:
latitude; solar radiation (Srs); surface area; residential buildings; housing density (Hds); population density;
households; average number of members per household (Hms); per capita gross domestic product (Gdps),
manufacturing firms, share of Plc and Ltd companies.
If the errors s are mutually independent, then the estimation of the SAR system can be performed by separate
equations. Accordingly, the two regression models, with parameters , , , , and are as follows:
s s 1 -s s
α
β
Pp
γ
Ec
ε
Pp
δ'
Ir
s
ω'
Ef
s
(1) s s 1 -s sα
β
Ps
γ
Ec
ε
Ps
δ'
Ir
s
ω'
Ef
s
(2)88 Copiello S. and Grillenzoni C. / Energy Procedia 00 (2017) 000–000 Sergio Copiello et al. / Energy Procedia 141 (2017) 86–90 s s 1 -s s
)
α
β
ln(Pp
)
γ
ln(Ec
)
ln(
)
ln(
)
ε
ln(Pp
δ'
Ir
s
ω'
Ef
s
(3) s s 1 -s s)
α
β
ln(Ps
)
γ
ln(Ec
)
ln(
)
ln(
)
ε
ln(Ps
δ'
Ir
s
ω'
Ef
s
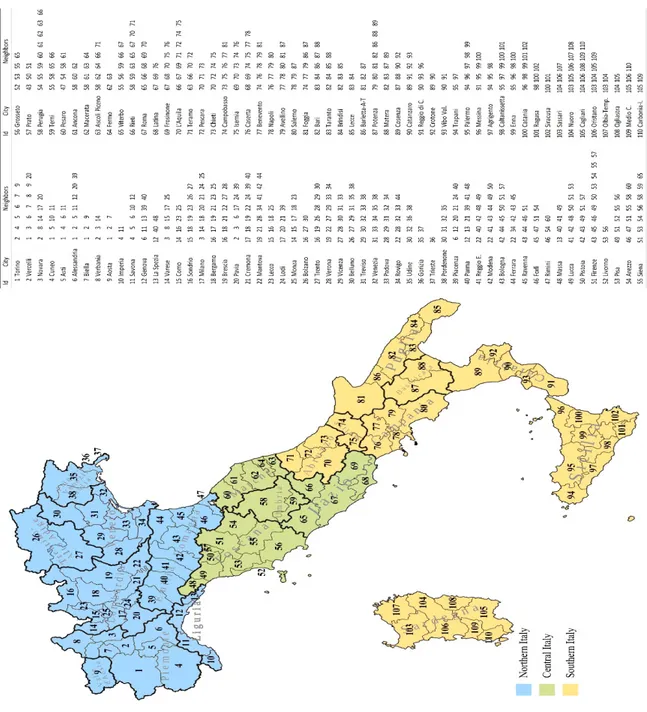
(4)The use of the logarithmic transformation is motivated by possible non-linear relationships between the variables. Eqs (1)-(4) are estimated using the Ordinary Least Squares method (with robust standard errors according to the White’s dispersion matrix), by performing a forward stepwise regression. The packages we use are R and Gretl. The data cover 110 provinces in Italy (according to the NUTS3 classification). The spatially lagged dependent variables are defined according to the proximity structure of the units (Fig. 1).
3. 3. Results and discussion
Tables 1 and 2 show the results. As expected, the share of electricity consumption met by solar photovoltaic energy depends on climate factors; however, their statistical significance is rather limited. The solar radiation Srs
hardly explains more than 5% of Pps variance, this raises questions about plant efficiency, network distribution and
location policies of solar facilities. Instead, latitude and surface area are excluded from the models due to collinearity issues.
Table 1. Results of the linear models according to Eqs. (1) and (2).
Dependent Pps Dependent Pss
t-stat p-value V.i.f. t-stat p-value V.i.f.
const 970.2840 2.397 0.0183 const 57.6107 5.678 0.0000 Pps-1 0.5111 4.136 0.0001 1.133 Pss-1 0.4393 2.573 0.0115 1.453 Ecs Ecs -0.0013 3.025 0.0031 1.392 Cis -92.5855 5.489 0.0000 1.033 Cis -1.9563 4.716 0.0000 1.181 Srs 0.2099 3.200 0.0018 1.164 Srs Gdps Gdps -0.0002 1.903 0.0598 1.771 Adj. R2 0.3486 Adj. R2 0.3739 F-stat 18.1196 0.0000 F-stat 14.1993 0.0000 White’s test 15.2935 0.0832 White’s test 13.2599 0.5062
Table 2. Results of the logarithmic models according to Eqs. (3) and (4).
Dependent ln(Pps) Dependent ln(Pss)
t-stat p-value V.i.f. t-stat p-value V.i.f.
const 5.3553 1.710 0.0903 const 13.6455 4.483 0.0000 ln(Pps-1) 0.6068 4.865 0.0000 ln(Pss-1) 0.5258 4.802 0.0000 1.534 ln(Ecs) 0.4209 2.846 0.0053 ln(Ecs) -0.4753 3.119 0.0024 1.397 ln(Cis) -2.9160 4.325 0.0000 ln(Cis) -3.3504 4.760 0.0000 1.283 ln(Hds) -0.3945 4.017 0.0001 ln(Hds) -0.3515 3.295 0.0013 1.385 ln(Hms) 4.1082 4.189 0.0001 ln(Hms) 3.0297 3.047 0.0029 1.476 Adj. R2 0.5265 Adj. R2 0.5854 F-stat 25.3647 0.0000 F-stat 39.9121 0.0000 White’s test 27.5117 0.1215 White’s test 26.2341 0.1582
Copiello S. and Grillenzoni C. / Energy Procedia 00 (2017) 000–000
Fig. 1. Proximity structure.
Other significant variables are Cis, Gdps, Hds, and Hms. The unexpected result is that they all have a negative sign.
The adoption of innovative and responsible behavior does not emerge as a driver of photovoltaic production. The fact that Pps and Pss are high where income and housing density are lower, as well as where the number of
household’s members is higher, confirms that photovoltaic production is strong in the less developed areas of the country. The role played by electricity consumption is controversial: Ecs positively affects Pps but negatively Pss.
The most notable outcome is that solar photovoltaic energy shows a strong spatial dependence, both at production and consumption levels. The logarithmic model enables to explain nearly the 53% of Pps variance, but more than 18%
Sergio Copiello et al. / Energy Procedia 141 (2017) 86–90 89
Copiello S. and Grillenzoni C. / Energy Procedia 00 (2017) 000–000 s s 1 -s s
)
α
β
ln(Pp
)
γ
ln(Ec
)
ln(
)
ln(
)
ε
ln(Pp
δ'
Ir
s
ω'
Ef
s
(3) s s 1 -s s)
α
β
ln(Ps
)
γ
ln(Ec
)
ln(
)
ln(
)
ε
ln(Ps
δ'
Ir
s
ω'
Ef
s
(4)The use of the logarithmic transformation is motivated by possible non-linear relationships between the variables. Eqs (1)-(4) are estimated using the Ordinary Least Squares method (with robust standard errors according to the White’s dispersion matrix), by performing a forward stepwise regression. The packages we use are R and Gretl. The data cover 110 provinces in Italy (according to the NUTS3 classification). The spatially lagged dependent variables are defined according to the proximity structure of the units (Fig. 1).
3. 3. Results and discussion
Tables 1 and 2 show the results. As expected, the share of electricity consumption met by solar photovoltaic energy depends on climate factors; however, their statistical significance is rather limited. The solar radiation Srs
hardly explains more than 5% of Pps variance, this raises questions about plant efficiency, network distribution and
location policies of solar facilities. Instead, latitude and surface area are excluded from the models due to collinearity issues.
Table 1. Results of the linear models according to Eqs. (1) and (2).
Dependent Pps Dependent Pss
t-stat p-value V.i.f. t-stat p-value V.i.f.
const 970.2840 2.397 0.0183 const 57.6107 5.678 0.0000 Pps-1 0.5111 4.136 0.0001 1.133 Pss-1 0.4393 2.573 0.0115 1.453 Ecs Ecs -0.0013 3.025 0.0031 1.392 Cis -92.5855 5.489 0.0000 1.033 Cis -1.9563 4.716 0.0000 1.181 Srs 0.2099 3.200 0.0018 1.164 Srs Gdps Gdps -0.0002 1.903 0.0598 1.771 Adj. R2 0.3486 Adj. R2 0.3739 F-stat 18.1196 0.0000 F-stat 14.1993 0.0000 White’s test 15.2935 0.0832 White’s test 13.2599 0.5062
Table 2. Results of the logarithmic models according to Eqs. (3) and (4).
Dependent ln(Pps) Dependent ln(Pss)
t-stat p-value V.i.f. t-stat p-value V.i.f.
const 5.3553 1.710 0.0903 const 13.6455 4.483 0.0000 ln(Pps-1) 0.6068 4.865 0.0000 ln(Pss-1) 0.5258 4.802 0.0000 1.534 ln(Ecs) 0.4209 2.846 0.0053 ln(Ecs) -0.4753 3.119 0.0024 1.397 ln(Cis) -2.9160 4.325 0.0000 ln(Cis) -3.3504 4.760 0.0000 1.283 ln(Hds) -0.3945 4.017 0.0001 ln(Hds) -0.3515 3.295 0.0013 1.385 ln(Hms) 4.1082 4.189 0.0001 ln(Hms) 3.0297 3.047 0.0029 1.476 Adj. R2 0.5265 Adj. R2 0.5854 F-stat 25.3647 0.0000 F-stat 39.9121 0.0000 White’s test 27.5117 0.1215 White’s test 26.2341 0.1582
Copiello S. and Grillenzoni C. / Energy Procedia 00 (2017) 000–000
Fig. 1. Proximity structure.
Other significant variables are Cis, Gdps, Hds, and Hms. The unexpected result is that they all have a negative sign.
The adoption of innovative and responsible behavior does not emerge as a driver of photovoltaic production. The fact that Pps and Pss are high where income and housing density are lower, as well as where the number of
household’s members is higher, confirms that photovoltaic production is strong in the less developed areas of the country. The role played by electricity consumption is controversial: Ecs positively affects Pps but negatively Pss.
The most notable outcome is that solar photovoltaic energy shows a strong spatial dependence, both at production and consumption levels. The logarithmic model enables to explain nearly the 53% of Pps variance, but more than 18%
90 Sergio Copiello et al. / Energy Procedia 141 (2017) 86–90
Copiello S. and Grillenzoni C. / Energy Procedia 00 (2017) 000–000
Similarly, nearly 59% of Pss variance is explained by the function based on natural logarithms, but Pss-1 explains up
to 31% of the same variance.
4. Conclusions
In this study, we demonstrate that spatial dependence is a key topic in the research strand that aims to delve into the determinants of the transition to the renewables, specifically the solar photovoltaic energy. The results we achieve pose at least two issues that call for further investigations. The first concerns the nonlinearity of the relationships between dependent and independent variables, because the goodness of fit of the logarithmic functions (0.53 < Adj. R2 < 0.59) is higher than in the linear models (0.35 < Adj. R2 < 0.37). The second issue consists of the
formulation of the proximity structure. The nearness between the units of observation may be measured using several indicators, such as distances, shared boundaries, and so forth. Hence, it should be analyzed whether and how much different nearness indicators lead to diverging results.
References
[1] Copiello S. Building energy efficiency: A research branch made of paradoxes. Renew Sustain Energy Rev 2017;69:1064–76. [2] International Energy Agency. Technology Roadmap - Solar Photovoltaic Energy, Paris; 2014.
[3] International Energy Agency. World Energy Outlook, Paris; 2016.
[4] Balcombe P, Rigby D, Azapagic A. Motivations and barriers associated with adopting microgeneration energy technologies in the UK.
Renew Sustain Energy Rev 2013;22:655–66.
[5] Westacott P, Candelise C. A novel geographical information systems framework to characterize photovoltaic deployment in the UK: Initial evidence. Energies 2016;9.
[6] Faiers A, Neame C. Consumer attitudes towards domestic solar power systems. Energy Policy 2006;34:1797–806. [7] Keirstead J. Behavioural responses to photovoltaic systems in the UK domestic sector. Energy Policy 2007;35:4128–41.
[8] Zhang Y, Song J, Hamori S. Impact of subsidy policies on diffusion of photovoltaic power generation. Energy Policy 2011;39:1958–64. [9] Sardianou E, Genoudi P. Which factors affect the willingness of consumers to adopt renewable energies? Renew Energy 2013;57:1–4. [10] Bonifaci P, Copiello S, Stanghellini S. Assessing policy measures on building energy efficiency through a multi-Actor multi-criteria
analysis, in: P. Hájek, J. Tywoniak, A. Lupíšek, K. Sojková (Eds.), CESB 2016 - Cent. Eur. Towar. Sustain. Build. 2016 Innov. Sustain. Futur., Grada Publishing, Prague, 2016: pp. 1343–1350.
[11] Dharshing S. Household dynamics of technology adoption: A spatial econometric analysis of residential solar photovoltaic (PV) systems in Germany. Energy Res Soc Sci 2017;23:113–24.
[12] Balta-Ozkan N, Yildirim J, Connor PM. Regional distribution of photovoltaic deployment in the UK and its determinants: A spatial econometric approach. Energy Econ 2015;51:417–29.
[13] Bollinger B, Gillingham K. Peer Effects in the Diffusion of Solar Photovoltaic Panels. Mark Sci 2012;31:900–12.
[14] Müller S, Rode J. The adoption of photovoltaic systems in Wiesbaden, Germany. Econ Innov New Technol 2013;22:519–35.
[15] Graziano M, Gillingham K. Spatial patterns of solar photovoltaic system adoption: The influence of neighbors and the built environment. J
Econ Geogr 2015;15:815–39.
[16] Rode J, Weber A. Does localized imitation drive technology adoption? A case study on rooftop photovoltaic systems in Germany. J
Environ Econ Manage 2016;78:38–48.
[17] Palm A. Local factors driving the diffusion of solar photovoltaics in Sweden: A case study of five municipalities in an early market, Energy Res Soc Sci 2016;14:1–12.
[18] Schaffer AJ, Brun S. Beyond the sun—Socioeconomic drivers of the adoption of small-scale photovoltaic installations in Germany. Energy
Res Soc Sci 2015;10:220–7.
[19] Anselin L. Spatial Econometrics: Methods and Models. Dordrecht: Springer Kluwer; 1988.
[20] C. Grillenzoni, Adaptive spatio-temporal models for satellite ecological data, J Agric Biol Environ Stat 2004;9:158–180.
[21] Copiello S, Grillenzoni C. Is the cold the only reason why we heat our homes? Empirical evidence from spatial series data. Appl Energy 2017;193:491–506.