University of Messina Department of Economics
LOGISTICS AND SUPPLY CHAIN
MANAGEMENT.
FOUR PAPERS ON ECONOMIC GROWTH,
COMPETITIVENESS AND EFFICIENCY
Ph.D. Candidate
Vittorio D’Aleo
Supervisor
Prof. Bruno S. Sergi
!
!
Summary
Introduction
a) Does Logistics Influence Economic Growth: The European Experience
1. Case Study: The Logistics Performance in the Balkans Area: TrendEvidence
b) Human Factor: The Competitive Advantage Driver Of The Eu’s
Logistics Sector
2. Case Study: Do Human Factor, Infrastructures and Institutions influence the Logistics sector? The case of Africa, Asia and the European Union
c) A Dynamic About Airport Efficiency: The Case Of Italian Airports’
Technical Efficiency
d) Supply Chain Management: Overview, Competition And Competences,
How To Exploit The Hidden Capabilities
SUMMARY
The thesis provides an innovative, comprehensive and structured path to understand how the analysed logistics phenomenon affects different economic aspects of economic growth. We aim to study the macroeconomic and microeconomic phenomena related to the goods and people flow. The thesis demonstrates the importance that the logistics sector on the variables that influence a nation-s growth and wealth. The thesis’ next step is the willingness to learn what are the internal factors that determine the performance of the entire logistics sector, and identify and figure out the key variables behind a decisive competitive advantage. The study would not be complete without a predominant parses the entire logistics sector sub-sector that is represented by the transport plane, then analyse the efficiency of the Italian airport sector and specifically the airports. Ultimately it was decided to insert a purely microeconomic and managerial study that providing a critical eye on what is the transposition of logistics inside the companies, an a critical analysis of the methods of "Supply Chain Management" and possible development factors due to supply chain inefficiencies.
INTRODUCTION
The thesis presented in fulfilment of this doctoral program is structured by following the "paper" size criteria. The thesis collects four independent papers structured according to the rules dictated by the scientific procedure. Each paper contains a reference literary review so you have worked out the framework in which the work is inserted; key paragraphs explain the chosen methodology and the econometric models used to conduct the study. Finally, ample space is reserved for the paper search results, the reflections that arise and possible future developments. Specifically, the work is composed of four chapters containing innovative and related papers from their general objective of the work outlined in the summary. The first chapter entitled "Does Logistics Influence Economic Growth: The European Experience," through the use of three econometric models, aims to demonstrate how the logistics sector is relevant and how it influences economic growth (Rivera et al., 2016; Belumole et al., 2015) in the European Union. This study was submitted to the scientific journal “Management
Decision” (listed as an A journal - ASN) edited by Emerald and is currently is "under review." In this study after analysing the relevant literature, I was able to identify the most
appropriate variables used to the scope: GDP; LPI (Ekici et al., 2016) (index developed by the World Bank that measures the efficiency of the logistics sector); GCI (Korez-Vide and Tominic, 2016) (index developed by the World Economic Forum with the aim to assessing the competitiveness of a nation) and the Export. The reference literature has guided to the choice to use a useful model to achieve its objectives. The aim has been chosen the "Mediator model" of Baron & Kenny (Baron and Kenny, 1986; Mackinnon and Pirlott, 2015; Preacher, 2015) supported by a system of simultaneous equations and panel analysis. The integration of the panel analysis and simultaneous equations were essential, as suggested by scientific publications (Zao et al., 2010), to overcome all the limitations of the "mediator" model (Heckman and Pinto, 2015). The research results have led to evidence that the competitiveness of a nation affects the economic growth but at the same time as the effect is more relevant when the logistics factor work as a mediating variable.
The second paper entitled "Human Factor: the competitive advantage driver of the EU’s
Logistics sector" was produced with the continuous support of Prof. Bruno Sergio Sergi,
designated tutor. This work is well framed and placed in the scientific research field suitable to identify the key factors determining the competitive advantage of the logistics sector. The
Production Research" (listed as an A journal - ASN) edited by Taylor & Francis and published in 2016. The aim of the paper is to identify the key that determines the competitive
advantage of the predominant European logistics sector in the global system (Coyle et al., 2016; Korinek and Sourdin, 2011). The study, after a careful analysis of the relevant literature, identified variables collected in three clusters (Beaudreau, 2016; Grosse et al., 2015; Puertas et al., 2014). The clusters created and identified with the names of "Infrastructure, Institutions and Human Factor" have been worked by an econometric model (Uca et al., 2015; Ding et al., 2015) in order to assess what more influence the performance of entire sector. The econometric evidence has shown that the human factor is the competitive advantage and how it is essential to invest in this variable.
The third paper analysed a dominant and distinctive sub-sector of the logistics system: the airport sector. The name of the work is "A dynamic about airport efficiency: the case of
Italian airports' technical efficiency" This study was submitted to the scientific journal “Journal of Air Transport Management” (listed as an A journal - ASN) edited by Elsevier. The reference literature is rich and proliferates of studies related to the field, it was
easy to understand the methodology to utilize, consistent in an application of the DEA method (Fernandes and Pacheco, 2002; Curi et al., 2011; Lai et al., 2015; Bezerra, 2016). Such a method as shown in academic studies is effective to identifying the airports efficiency. In my case I decided to analyse the Italian system and by identifying the correct inputs and outputs to be included in the model, have been able to rank twenty-six Italian airports according to efficiency criteria. The result shows that the system has a good efficiency rate geographically distributed throughout the peninsula and how the impact of public resources is positive to the Airport efficiency.
The last chapter inserted in the thesis consists in a quality management paper. In order to provide a complete view I analyse the logistics system from a business perspective. This work was published by me with the title "Supply chain management: overview, competition and
competences, how to exploit the hidden capabilities", in the International Journal of Management and Network Economics, dated 2016, published by Inderscience (inserted in the list of scientific journals). In this work I decided to do an excursus evolution of
managerial flow systems (Halldorsson and Aastrup, 2003; Hult et al., 2006; Lavassani et al., 2008) and then concentrate on the identification of "hidden capabilities" possible evolution of internal inefficiencies (Todorova and Durusin, 2007).
At the end of the first and second paper I thought of adding a cases study to deeper in the topic.
REFERENCES
Baron, R. M., & Kenny, D. A. (1986). The moderator–mediator variable distinction in social psychological research: Conceptual, strategic, and statistical considerations. Journal of
personality and social psychology, 51(6), 1173.
Beaudreau, B. C. 2016. “Competitive and Comparative Advantage: Towards a Unified Theory of International Trade.” International Economic Journal 30: 1–18
Bezerra, G. C., & Gomes, C. F. (2016). Performance measurement in airport settings: a systematic literature review. Benchmarking: An International Journal, 23(4), 1027-1050. Bolumole, Y. A., Closs, D. J., & Rodammer, F. A. (2015). The Economic Development Role of Regional Logistics Hubs: A Cross‐Country Study of Interorganizational Governance Models. Journal of Business Logistics, 36(2), 182-198.
Coyle, J. J., Langley, C. J., Novack, R. A., & Gibson, B. (2016). Supply chain management: a
logistics perspective. Nelson Education.
Curi, C., Gitto, S., & Mancuso, P. (2011). New evidence on the efficiency of Italian airports: a bootstrapped DEA analysis. Socio-Economic Planning Sciences, 45(2), 84-93.
D'Aleo, V. (2016). Supply chain management: overview, competition and competences, how to exploit the ‘hidden capabilities'. International Journal of Management and Network
Economics, 3(4), 336-346.
D’Aleo, V., & Sergi, B. S. (2016). Human factor: the competitive advantage driver of the EU’s logistics sector. International Journal of Production Research, 1-14.
Ding, M. J., B. H. Kam, J. Y. Zhang, and F. Jie. 2015. “Effects of Human Resource Management Practices on Logistics and Supply Chain Competencies – Evidence from China Logistics Service Market.” International Journal of Production Research 53: 2885–2903. Ekici, Ş. Ö., Kabak, Ö., & Ülengin, F. (2016). Linking to compete: Logistics and global competitiveness interaction. Transport Policy, 48, 117-128.
Fernandes, E., & Pacheco, R. R. (2002). Efficient use of airport capacity. Transportation research part A: Policy and practice, 36(3), 225-238.
Grosse, E. H., C. H. Glock, M. Y. Jaber, and W. P. Neumann. 2015. “Incorporating Human Factors in Order Picking Planning Models: Framework and Research Opportunities.” International Journal of Production Research 53: 695–717
Heckman, J. J., & Pinto, R. (2015). Econometric mediation analyses: Identifying the sources of treatment effects from experimentally estimated production technologies with unmeasured and mismeasured inputs. Econometric reviews, 34(1-2), 6-31.
Korez-Vide, R., & Tominc, P. (2016). Competitiveness, Entrepreneurship and Economic Growth. In Competitiveness of CEE Economies and Businesses (pp. 25-44). Springer International Publishing.
Korinek, J., and P. Sourdin. 2011. “To What Extent Are High-Quality Logistics Services Trade Facilitating.” OECD Trade Policy Papers, 108: 1–42
Lai, P. L., Potter, A., Beynon, M., & Beresford, A. (2015). Evaluating the efficiency performance of airports using an integrated AHP/DEA-AR technique. Transport Policy, 42, 75-85.
Puertas, R., L. Martí, and L. García. 2014. “Logistics Performance and Export Competitiveness: European Experience.” Empirica 41: 467–480.
Rivera, L., Gligor, D., & Sheffi, Y. (2016). The benefits of logistics clustering. International
Journal of Physical Distribution & Logistics Management, 46(3), 242-268.
Todorova, G. and Durisin, B. (2007) ‘Absorptive capacity: valuing a reconceptualization’,
Academy of Management Review, Vol. 32, No. 3, pp.774–786.
Uca, N., M. E. Civelek, and M. Çemberci. 2015. “The Effect of the Components of Logistics Performance Index on Gross Domestic Product: Conceptual Model Proposal.” Eurasian Business & Economics Journal 1: 86–93.
! ! ! ! ! ! ! ! ! ! ! ! ! ! ! ! ! ! ! ! ! ! ! ! ! ! ! ! ! !
Does Logistics Influence Economic Growth? The European
Experience
Vittorio D’Aleo
Department of Economics, University of Messina, Messina, Italy
Abstract
This paper sets a new model that includes variables that take account of the mediator effect of global competitiveness index in order to better understand the whole phenomenon behind the relationship between GDP and competition in Europe. We test the consistency of the Baron and Kenny mediator model through an explanatory linear regression model, and then we deploy a panel analysis and a simultaneous equation system to assess the model consistency to bypass much of the endogeneity problem. This paper’s findings show a positive influence of global competitiveness index on GDP and this effect is by far more evident when other variables (e.g., the logistics performance index) interact simultaneously.
1. Introduction
This paper examines the competitiveness of networks and public infrastructure systems, ports, airports and rail networks in Europe. While competitiveness may generate benefits in terms of lower prices and product quality improvement, the globalization process has extended such a competitiveness concept to how competition affects territories, operating systems that create the conditions of economic and social development and attract new entrepreneurship. Porter (1990) firstly emphasized the existence of exogenous factors that allow the creation of the competitive advantage of firms or nations. Exogenous factors that overlap with the “allocation of production factors,” which include physical resources and infrastructure in the surrounding area, and the “governance” related to public institutions and territorial policies characteristics become relevant.
The mediator model strives to identify and explain the process that underlines a relation between an independent and a dependent variable through the inclusion of a third explanatory variable. A mediator variable enlightens how an independent variable affects the dependent variable, although not necessarily a causal relationship. A moderator specifies the conditions under which a particular effect occurs, as well as the conditions that vary the direction or strength effect. Therefore, the moderator is a variable that alters the direction or relationship strength between independent or predictor variable and dependent or criterion variable (Baron and Kenny, 1986).
Baron and Kenny (1986) recommend three steps to establish the consistency of mediator model: regressing the mediator on the independent variable; regressing the dependent variable on the independent variable and regressing the dependent variable on both the independent variable and the mediator. This article tests the mediator model that moderate the relationship between the mediator and the dependent variable to emphasize the relations among variables. Baron and Kenny (1986) found evidence for mediation is strongest when there is an indirect effect, which they call “full mediation.” When there are both indirect and direct effects, they call it “partial mediation.” Some authors (Dearing and Hamilton, 2006; Gogineri et al., 1995; Frazier et al., 2004) investigated the existing difference related to mediation and moderation models and implement them separately. Others (Edwards and Lambert, 2007; Muller et al. 2005; MacKinnon, 2008) focused on models able to assess both effects (mediation and moderation) and how they work together.
Zhao et al. (2010) identify three patterns consistent with mediation and two with non-mediation: Complementary non-mediation: Mediated effect (a # b) and direct effect (c) both exist and point at the same direction. Competitive mediation: Mediated effect (a # b) and direct effect (c) both exist and point in opposite directions:
- Indirect-only mediation: Mediated effect (a # b) exists, but no direct effect. - Direct-only non-mediation: Direct effect (c) exists, but no indirect effect. - No-effect non-mediation: Neither directs effect nor indirect effect exists.
Heckman and Pinto (2015) do not suggest the use of the mediator model because the mediation literature would achieve its goals under implausibly strong assumptions. However, in our approach the mediation analysis proves to be extremely reliable as the measures employed to assess the mediator and the dependent variable are theoretically distinct one another and the independent variable and mediator cannot interact. Specifically, the two variables used to assess the mediator effect are theoretically distinct, that is, LPI represents an efficiency index of a specific field and sector (logistics sector) while GDP represents a macroeconomic greatness progress.
Some other authors apply the “bootstrapping technique” (Zhao, Lynch and Chen, 2010) as an alternative to the “Baron and Kenny” method. We did not follow the “bootstrap technique” because of some very critical aspects (Athreya, 1987). As an example, if one performs a naive bootstrap on the sample mean when the underlying population lacks a finite variance, then the bootstrap distribution will not converge to the same limit as the sample mean. Confidence intervals on the basis of a Monte Carlo simulation of the bootstrap could be misleading. And unless one is sure that the underlying distribution is not heavy tailed, we should hesitate to use the naive bootstrap, Athreya (1987) states.
In support of this article’s methodological approach, there are very recent scientific evidences too. Preacher (2015) described the mediation analysis like as fundamental for many classic and theoretical paradigms, and tried to underline the new developments of the mediation analysis. Mackinnon and Pirlott (2015) drew on new statistical developments in causal mediation analysis. Gobena and Van Dijke (2015) used the model to explore the moderating roles of legitimate and coercive power held by the tax authority in the relationship among procedural justice, trust in the tax authority, and voluntary tax compliance. Nguyen et al. (2015) have conducted a practical guidance for implementing a new technique to estimate
natural direct effects for mediation analyses. Bind et al. (2016) used mediation analysis to examine pathways in epidemiological research.
Our approach initially involves the use of Baron and Kenny technique that shows the logistics performance index (LPI) mediator effect’s presence. In order to verify the model to fully explain what really happens between the two variables we need to test the data with a Panel analysis (fixed effect) that show there is a positive influence of CGI on GDP, which goes to confirm the H3 assumption of the Baron and Kenny model. Finally in order to understand the influence of all the considered variables we apply the Simultaneous equation model which confirms the validity of the GCI as a predictor of economic growth, and his influence is greater when into the model takes the LPI variable.
2. Data and variables
In our paper we used GDP, GCI, LPI and Export. The first index is the GCI that measures the microeconomic and macroeconomic foundations of national competitiveness to define competitiveness as the set of institutions, policies, and factors that determine the level of productivity of a country. GCI use a scale ranges from 1.00 (less competitive) to 7.00 (high competitive). The GCI provides an overview of the competitiveness performance of 144 economies; it’s represent the most comprehensive assessment. It contains a detailed profile for each of the economies included in the study, as well as an extensive section of data tables with global rankings covering over 100 indicators. The World Economic Forum defines competitiveness as the set of institutions, policies, and factors that determine the level of productivity of a country (WEF 2014). The concept of competitiveness involves static and dynamic components that are grouped into twelve pillars of competitiveness:
1. Institutions 2. Infrastructures
3. Macroeconomic environment 4. Health and Primary education 5. Higher education and training 6. Labour market efficiency 7. Goods market efficiency 8. Financial market development 9. Technological readiness
10. Market size 11. Innovation
12. Business sophistication.
LPI. Initiated by the World Bank in 2004 to compare 150 countries, the Logistics
Performance Index – developed on information collected in a worldwide investigation of the companies responsible for goods carriage and trade – it is the most relevant indicator that assesses logistic competitiveness. The six indicators used by the World Bank are:
1. Customs - Transit efficiency from the border (speed, simplicity, predictability, formalities).
2. Infrastructure - Quality of trade and transport infrastructure.
3. International shipments - Ease of arranging competitively priced shipments. 4. Logistics competence - Logistics services competence and quality.
5. Tracking & Tracing - Ability track shipments 6. Timeliness
GDP and Export. The latter two variables are GDP and Export in 2007, 2010, 2012, and
2014. The sample is composed by 41 countries chosen from both the European Area and extra UE (Table 1).
!
We have a panel data, made from 164 observations, concerning 41 countries and 4 years for each of them. We analysed data for each observation, and we noted that GDP had a mean
Table&1&(&Country&
Albany& France& Moldova& Slovak&Republic& Austria& Germany& Montenegro& Slovenia& Belarus& Greece& Norway& Spain& Belgium& Iceland& Netherlands& Sweden& Bosnia&and&Herzegovina& Ireland& Poland& Switzerland&
Bulgaria& Italy& Portugal& Turkey& Cyprus& Latvia& United&Kingdom& Ukraine& Croatia& Lithuania& Czech&Republic& Hungary& Denmark& Luxembourg& Romania& &
Estonia& Macedonia,&
FYR& Federation&Russian& &
Finland& Malta& Serbia& !
value equal to 2,27 (D.S. ± 3,17), but median value is 1,9. This means that there was some data that influenced mean value
!
Table!2!(!Descriptive!statistics!
Variable! Obs.! Mean! Median! Std.!Dev.! Min! Max!
GDP! 164! 2,271341! 1,9! 3,169985! ,6,8! 11,1! GCI! 164! 4,578415! 4,45! 0,5606667! 3,48! 5,73! LPI! 164! 3,287744! 3,23! 0,5316721! 2,08! 4,18! EXPORT! 164! 352,5975! 282,75! 178,0812! 125,5! 891,5! ! ! !
To better understand the relationship between GDP e CGI, we report here two-way graph, in which it is possible to note that there is no determined linear relationship. This phenomenon is justifiable because there are other variable, as LPI or Export that can influence the real relationship between CGI and CGP.
! !
! !
We report now variables values with regard to panel data. In the following table 3, we register that GDP mean value is always equal to 2,27 (S.D. ± 3,17 if we observe overall sample, ± 1,53 if we read between sample and ± 2,79 if we analyse sample with reference to each yearly group).
Table!3!(!Descriptive!statistics!
Variable! ! Mean! Std.!Dev.! Min! Max! Obs.!
GDP! Overall! 2,271341! 3,169985! ,6,8! 11,1! N!=!164! Between! ! 1,526726! ,1,925! 4,9! N!=!!41! Within! ! 2,785824! ,5,903659! 9,921341! T!=!4! GCI! Overall! 4,578415! 0,5606667! 3,48! 5,73! N!=!164! Between! ! 0,556986! 3,7775! 5,67! n!=!!41! Within! ! 0,0991142! 4,265915! 4,825915! T!=!4! LPI! Overall! 3,287744! 0,5316721! 2,08! 4,18! N!=!164!
Between! ! 0,5137867! 2,465! 4,09! n!=!!41! Within! ! 0,1534826! 2,847744! 3,657744! T!=!4! EXPORT! Overall! 352,5975! 178,0812! 125,5! 891,5! N!=!164! Between! ! 165,2322! 146,825! 661,7! n!=!!41! Within! ! 70,0979! 102,9975! 582,3975! T!=!4! ! ! 3. Methodology
It is important to capture all possible effects derived from these moderator and mediator variables respectively. To assess the existence of two phenomena, we formulate a set of assumptions that follow the original model by Baron and Kenny.
Assumptions
H1: Global Competiveness Index positively influences Logistics Performance Index. H2: Logistics Performance positively influences Gross Domestic Product
H3: Global Competiveness Index positively influences Gross Domestic Product
H4: Logistics Performance Index has a mediator effect on the relationship between Global Competiveness Index and Gross Domestic Product.
H5: Logistics Performance Index positively influences Export H6: Export positively influences Gross Domestic Product
H7: Export moderates the relationship between Logistic Performance Index and Gross Domestic Product.
The hypotheses are tested applying linear and multiple linear regressions. The used time spam covers seven years due to the LPI editions, which saw the first edition in 2007 and the last one in 2014. We used the following regression formula:
(a) LPI = β0 + β1 GCI + ε (b) GDP = β0 + β1 LPI + ε (c) GDP = β0 + β1 GCI + ε (t) GDP = β0 + β1 GCI + β2 LPI + ε (d) EXP = β0 + β1 LPI + ε (e) GDP = β0 + β1 EXP + ε (z) GDP = β0 + β1 LPI + β2 EXP + ε
After testing the Baron Kenny model, the methodology in this study adopts a general equation that in its more simple form is written as:!
!
!!" = ! !!"+!!!"!∙!!!" +!!!"
where:
• !!" is dependent variable;
• !!" is independent variable or repressor; • !!"+!!!"!∙!!!" is regression straight line; • !!" is intercept of straight line;
• !!" is slope of straight line; • !!" is statistical error.
This defined model is one that regards different forms of heterogeneity: the parameters α!" (intercept), β!" (slope) and ε!" (statistical error) can change among countries (i = 1,…,N) and in time (t = 1,…T). The heterogeneity of each country is important to determine economic causality and we can explain coefficients that change per country and per time (α!" e β!"). Setting restrictions on parameters α!" e β!", it is possible to resume used methodology in three steps.
In the first step we have implemented an econometric analysis, fixing α!" = !α and β!"= !β, in the other words we have set that the intercept and the slope of straight line are constant and so that ε!" is able to capture possible differences among countries and years; the following model is estimated using Ordinary Least Squares (OLS):
!!" = !! + !!! ∙!!!" +!!!"
The suitability of Linear Regression model is verified using three different tests:
• Wald’s test, that refuses as null hypothesis the absence of significativity of parameters;
• Breusch-Pagan’s test, that refuses as null hypothesis of statistical error heteroscedasticity;
• Test RESET (Regression Equation Specification Error Test), called Ramsey’s test too, that refuses as null hypothesis that the specification of the model is right.
The OLS presents problems of heteroscedasticity and omitted variables, so it is necessary to use a model of Panel Analysis. Since the dataset is a panel data, we can carried out an econometric analysis based on estimate for two different models: Fixed or Random Effects.
Generally, the FE model is created setting α!" = α! = !α +!!! e β!" = !β, in other word we impose that the intercept of straight line changes only for countries and the slope remains constant:
!!" = ! !!+ !!! ∙!!!"+!!!"
The same model can be rewritten as:
!!" = !! + !!! ∙!!!"+! (!!⋅!!!") !!!
!!!
+ !!"
where D!" are N-1 dummies so that D!" = 1 if i = j and D!"= 0 if i ≠ j, while the N-1 parameters !! measure the deviation of intercepts of N-1 countries from that single intercept, considering as reference base.
Instead, the Random effects, created setting α!" = !α +!!!+!τ! e β!" = !β, in other word created imposing that the intercept of regression straight line changed for countries and in the time, while the slope remains constant:
!!" = ! !!"+ !!! ∙!!!"+!!!"
In particular, the same model can be rewrite as:
!!" = !! + !!! ∙!!!" +!!!"
where v!" = ! ε!"+!!!+!τ! is the error term, composed by different stochastic elements. The FE model, called Dummy Variable Model too, is estimated using Least Squares with Dummy Variables, LSDV, while the RE model, called Error Components Model too, is estimated Generalized Least Squares, GLS. The choice between these two models, in particular to determine what is more able to describe studied relationship between CGI and GDP, is performed using Hausman’s test.
In addition, we have formulated a simultaneous equation model (5 equations) to determine all possible and contemporary relationships among considered variables. This model allows evaluating the effective influence of CGI on GDP, observing, at the same time, the relationships and the influences of moderator and mediator variables.
In this third step, we suppose that a model of five simultaneous equation, in which:
• GDP is regressed on CGI, LPI and Export at the same time; • LPI is regressed on CGI;
• GDP is regressed on CGI; • Export is regressed on LPI;
• GDP is regressed on LPI and Export.
The first equation allows evaluating what is the effective influence of CGI on GDP, while the following equations allow verifying all influence among variables. This model is estimated using OLS.
4. Statistical Analysis
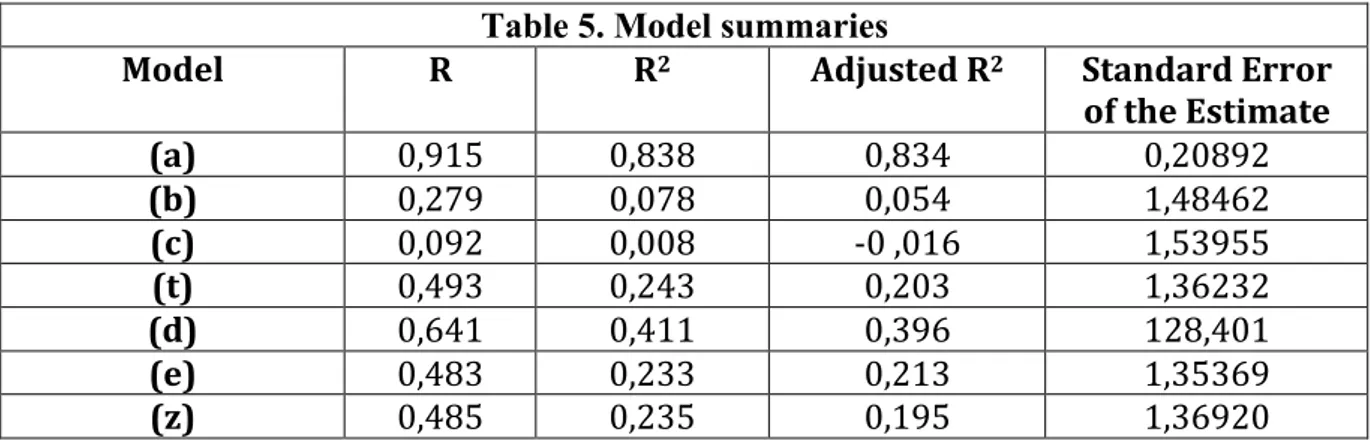
Table 4 reports Pearson’s correlation, and there is no a statistical significance between GDP and GCI and correlation between these variables is close to zero. The low value of correlation from one hand can be determined a lack of significance in the model, from the other hand is a good index of no endogeneity problems between these variables. On the contrary, LPI - moderator variable - has a negative weak significant correlation with GDP (-0,2076, p < 0,05): this means that the analysed relationship works out without LPI can be produced bias results. Finally, Export variable has a low correlation with GDP (0,0590) and no statistical significance.
!
Table!4!(!Pearson’s!correlation!
! GDP! GCI! LPI! EXPORT!
GDP! 1,0000! ! ! !
GCI! ,0,0572! 1,0000! ! !
LPI! ,0,2076*! 0,8823*! 1,0000! !
EXPORT! 0,0590! ,0,5280*! ,0,5116*! 1,0000!
4.1 Baron Kenny Model
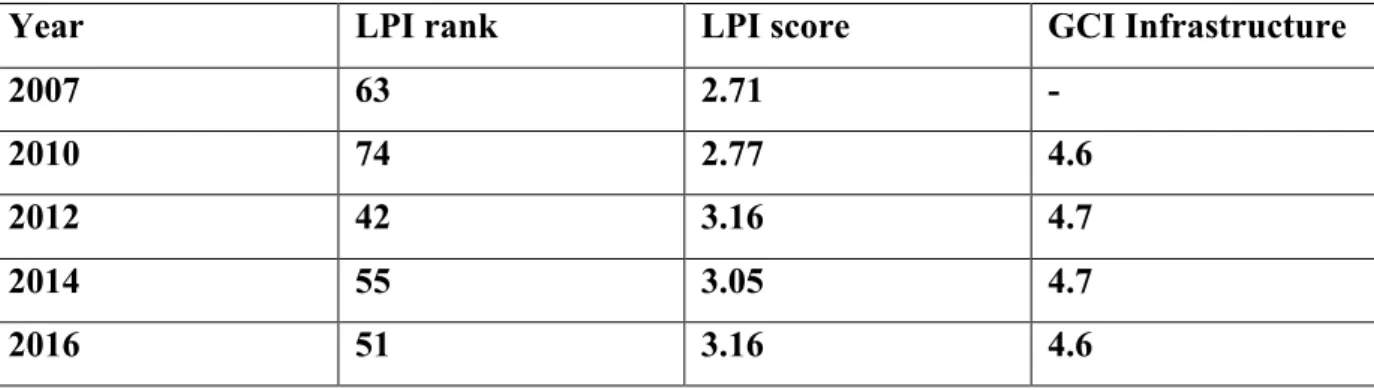
Table 5. Model summaries
Model! R! R2! Adjusted!R2! Standard!Error!
of!the!Estimate! (a)! 0,915! 0,838! 0,834! 0,20892! (b)! 0,279! 0,078! 0,054! 1,48462! (c)! 0,092! 0,008! ,0!,016! 1,53955! (t)! 0,493! 0,243! 0,203! 1,36232! (d)! 0,641! 0,411! 0,396! 128,401! (e)! 0,483! 0,233! 0,213! 1,35369! (z)! 0,485! 0,235! 0,195! 1,36920! !
As show in Table 5, the difference between R2 value Model (c) and R2 value Model (t) was found as 0,235 and the difference between R2 value Model (f= b) and R2 value Model (z) was found as 0,157. The determination coefficient, R2, is a proportion between the data variability and the correctness of the statistical model used. It measures the fraction of the variance of the dependent variable expressed by regression. All the values lean to one whereby the model used.
All the models are generally meaningful as shown in Table 6. The null hypothesis is that the variances are equal among themselves, and that the independent variable does not produce an
!
Table&6&Anova&
Model& Sum&of&Squares& df& Mean&Square& F& p&value&
(a)& Regression!! 8,856!Residual! 1,702! 1!39! 8,856!0,043! 202!! 4,838!!
Total! 10,559! 40! ! ! !
(b)& Regression!! 7,275!Residual! 85,960! 1!39! 7,275!2,204! 3,300!! 0,076!!
Total! 93,235! 40! ! ! !
(c)&
Regression!! 0,797! 1! 0,797! 0,336! 0,056!
Residual! 92,438! 39! 2,370! ! !
Total! 93,235! 40! ! ! !
(t)& Regression!! 22,710!Residual! 70,525! 2!38! 11,355!1,855! 76,118!! 0,004!!
Total! 93,235! 40! ! ! ! (d)& Regression!! 449075! 1! 449075! 27,238! 6,261! Residual! 642990! 39! 16486! ! ! Total! 109206! 40! ! ! ! (e)& Regression!! 21,768! 1! 21,768! 11,789! 0,001! Residual! 71,466! 39! 1,832! ! ! Total! 93,235! 40! ! ! !
(z)&& Regression!! 21,996!Residual! 71,239! 2!38! 10,998!1,874! 5,886!! 0,006!!
effect on the dependent variable. The p-value is the probability of getting the current result or one more extreme given that the null is true.
4.2 Panel Analysis Fixed Effect
Using explained methodology, we found that Hausman’s test had reported that difference in coefficients not systematic (28,03, p = 0,0000); this means that we can use Fixed Effects to analyse the relationship.
We carried out following table in which we reported four difference econometric models: with related coefficients, standard errors and level of significance. All models are created with robust standard errors to protect results from heteroskedasticity problems. In fact, our models report a Wald’s test for groupies heteroskedasticity equal to 3169,63 (chi2 value) and p-Value equal to 0,0000 (the Wald test defines as null hypothesis that sigma(i)2 = sigma2 for all i-units).
Regarding the following table, we can see that only model (4) presents a statistical significance for CGI (coefficient 3,455355 with p-Value equal to 0,08 on right tail). We can state that there is a positive influence of CGI on GDP and this impact is equal to 3,455355. That is, if CGI increases its value of one unit, GDP exhibits a growth of 3,455355 x (CGI)i.
The completed model is: !
! Table&7&(&Panel&Analysis&(&Fixed&effects.&
! (1)& (2)& (3)& (4)&
GCI& "2,494457! (3,468044)! 0,985997! (3,303258)! 2,286506! (3,276957)! 3,455355+! (2,506685)! LPI& ! "5,96067***! (2,106134)! ! "3,135218*!(1,705043)! EXPORT& ! ! "0,0187391***! (0,0026758)! "0,0161451***!(0,0037073)! cost.& 13,692! (15,87814)! 17,3542!(14,09272)! "1,589884!(14,67857)! 2,451799!(10,95004)! Test& F& (p( Value)& 0,52!(0,4762)! 4,34!(0,0197)! 26,63!(0,0000)! 11,49!(0,0000)! R2&overall& 0,0079! 0,1004! 0,2013! 0,2232! R2&between& 0,0086! 0,0981! 0,1625! 0,1216! R2&within& 0,0033! 0,0540! 0,0042! 0,0004! p"Value!***!1%!of!significance,!**!5%!of!significance,!*10%!of!significance,!+!level!of! 10%!one!tail! !
! !
4.3 Simultaneous Equations System
Finally, we made up a simultaneous equations system to calculate coefficients and statistical significances at the same time. Results are reported in the following tables 8 and 9.
Firstly, we find that all equation have statistical significance, reporting a p-Value (from F-test) less to 0,05.
Table&8&
Equation& Obs& Parms& RMSE& "R8sq"& F8Stat& P&
GDP& 164$ 3$ 3,010521$ 0,1147$ 6,91$ 0,0001$ LPI& 164$ 1$ 0,251034 8$ 0,7784$ 569,15$ 0,0000$ 3GDP& 164$ 1$ 3,110494$ 0,0431$ 7,29$ 0,0071$ EXPORT& 164$ 1$ 153,4844$ 0,2617$ 57,43$ 0,0000$ 5GDP& 164$ 2$ 3,115215$ 0,0461$ 3,89$ 0,0208$ $
From table 9, first equation, we found that GDP is positive influenced by CGI (3,203, p < 0,001), while LPI reports a negative influence (-4,234, p < 0,001); Export does not report statistical significance.
The second equation (influence of CGI on LPI) reports a positive influence (0,837, p < 0,001).
The third equation (influence of LPI on GDP) reports a negative impact (-1,238, p < 0,01). The relationship between Export and LPI is expressed in the fourth equation and from this we note that LPI has a negative impact on Export (-171,35, p < 0.000).
Finally, the fifth equation - referred to relationship among LPI, Export and GDP - denotes that LPI has always a negative impact on GDP (-1,433, p < 0,001), while Export does not register statistical significance.
5. Discussion
According to the Baron and Kenny model the mediator effect of Logistics Performance Index on the relation between Global Competiveness Index and GDP is statistically significant. LPI and GCI taken together are good predictors of economic growth. It results that a better
Table&9&
! Coef.& Std.&Err.& t& P>t&
GDP& ! GCI& 3,203407! 0,9099775! 3,52! 0,000! LPI& *4,233701! 0,9484419! *4,46! 0,000! EXPORT& *0,000091! 0,0015695! *0,06! 0,954! _cons& 1,55624! 2,629336! 0,59! 0,554! LPI& ! GCI& 0,8366607! 0,03507! 23,86! 0,000! _cons& *0,5428358! 0,161757! *3,36! 0,001! GDP& ! LPI& *1,23764! 0,4582386! *2,70! 0,007! _cons& 6,340386! 1,526025! 4,15! 0,000! EXPORT& ! LPI& *171,3539! 22,61136! *7,58! 0,000! _cons& 915,9653! 75,30027! 12,16! 0,000! GDP& ! LPI& *1,432651! 0,5341219! *2,68! 0,007! EXPORT& *0,0011381! 0,0015947! *0,71! 0,476! _cons& 7,382808! 2,114076! 3,49! 0,001! !
logistics system may have a positive effect on economic growth. The first model also demonstrated how Export plays a moderator role between LPI and GDP. When there are both indirect and direct effects, a “partial mediation” operates. There is a complementary mediation: mediated effect (a # b) and direct effect (c) both exist and point at the same direction. The panel analysis and the simultaneous equation model underline the goodness of GCI performance to evaluate the GDP evolution. On the contrary the two models have shown how the LPI taken individually is not a GDP good estimator and the Export is statistically insignificant in our analysis. Our findings show how the Mediator analysis is a useful method in economic studies but it is necessary to accompany this method with others (Panel and Simultaneous equation) in order for a proper data evaluation.
6. Conclusions and research implications
The importance of this study is to evaluate the impact of the role of competitiveness and logistics system on economic growth in Europe. According to our findings, the GCI is a correct variable to assess GDP. The study shows how the crisis has increased the importance of competitiveness for economic recovery as well as all strategic decisions aimed at growth and competitiveness. Europe has to lead all policies to improve the environment in which businesses operate, increase productivity, encourage innovation, exploit the growth potential of both traditional and emerging sectors, hence a strengthening of competitiveness policies. Investment in research and innovation is a proven growth factor and redirecting resources intelligently, especially when we perceive the first signs of recovery, would be essential to improve the efficiency and quality of public spending in Europe.
Finally yet importantly, the future of the European economy will evolve around the ability to maintain higher competitiveness. Above all the recent globalization and the EU’s eastward enlargement have placed the European logistics sector in the face of new challenges and the rapid growth of freight transport contributes to economic development, on the other hand it may cause traffic jams, noise, pollution and accidents. An improvement of the entire logistics sector – framed in a general perspective of the competitiveness growth – could become a winning factor for the entire Europe.
References
Amann, M., K. Roehrich, J., Eßig, M. and Harland, C. (2014). “Driving sustainable supply chain management in the public sector: The importance of public procurement in the European Union”, Supply Chain Management: An International Journal, 19 (3), 351-366. Andersen, B., Fagerhaug, T., Randmn ̃L, S., Schuldmaier, J., Prenninger, J., (1999). “Benchmarking Supply Chain Management: Finding Best Practices”, Journal Of Business &
Industrial Marketing 14 (5/6), 378–389.
Arvis, J. F., Mustra, M. A., Panzer, J., Ojala, L. and Naula, T. (2007), “Connecting to compete: Trade logistics in the global economy”, World Bank. Washington, DC, available at: http://www. worldbank.org/lpi.
Aschauer, G., Gronalt, M. and Mandl, C. (2015), “Modelling interrelationships between logistics and transportation operations–a system dynamics approach”, Management Research
Review, 38 (5), 505-539.
Athreya, K. B. (1987). “Bootstrap of the mean in the infinite variance case”, The Annals of
Statistics, 724-731.
Baron, K., Reuben, M. and A. Kenny (1986), “Moderator- Mediator Variables Distinction in Social Psychological Research: Conceptual, Strategic, and Statistical Considerations”,
Journal of Personality and Social Psychology, 51 (6), 1173 -82
Beamon, B.M., (1999). Measuring Supply Chain Performance. International Journal of
Operations and Production Management 19 (3), 275–292.
Bensassi, S., Márquez-Ramos, L., Martínez-Zarzoso, I., & Suárez-Burguet, C. (2015). Relationship between logistics infrastructure and trade: Evidence from Spanish regional exports. Transportation Research Part A: Policy and Practice, 72, 47-61.
Bind, M. A., Vanderweele, T. J., Coull, B. A., & Schwartz, J. D. (2016). Causal mediation analysis for longitudinal data with exogenous exposure. Biostatistics, 17 (1), 122-134.
Bolumole, Y. A., Closs, D. J. and Rodammer, F. A. (2015), “The Economic Development Role of Regional Logistics Hubs: A Cross Country Study of Interorganizational Governance Models”, Journal of Business Logistics, 36 (2), 182-198.
Civelek, M. E., Uca, N. and Cemberci, M. (2015), “The Mediator Effect of Logistics Performance Index on the Relation between Global Competitiveness Index and Gross Domestic Product”, European Scientific Journal, Vol. 11 No. 13.
Collins, R., Cordon, C., Julien, D., (1996). “Lessons From The Made In Switzerland Study: What Makes A World-Class Manufacturer?”, European Management Journal 14 (6), 576– 589.
Danese, P. (2007), “Designing cpfr collaborations: insights from seven case studies”,
Dearing, E. and Hamilton, L. C. (2006). “Contemporary advances and classic advice for analyzing mediating and moderating variables”, Monographs of the Society for Research in
Child Development, (December), No. 71, 88–104.
Donaldson S. (2001), “Mediator and moderator analysis in program development”, In: Sussman S, editor. Handbook of program development for health and behavior research and
practice. Thousand Oaks, CA: Sage; 470–496.
Edwards, J. R. and Lambert, L. S. (2007), “Methods for integrating moderation and mediation: A general analytical framework using moderated path analysis”, Psychological
Methods, No. 12, 1–22.
Erkan, B. (2014). “The Importance and Determinants of Logistics Performance of Selected Countries”. Journal of Emerging Issues in Economics, Finance and Banking, 3(6), 1237-1254.
Esfahani H.S., Ramirez M.T., (2002), “Institutions, Infrastructure and Economic Growth”,
Journal of Development Economics, 2002.
De Faria, R. N. D., Souza, C. S. D., & Vieira, J. G. V. (2015). “Evaluation Of Logistic Performance Indexes of Brazil In The International Trade”. Ram. Revista de Administração
Mackenzie, 16(1), 213-235.
Founou, R., (2002) “The Role of IT in Logistics, Competitive Advantage or Strategic Necessity?”, 2nd Swiss Transport Research Conference, Ascona, March 20-22, 1-21.
Frazier, P. A., Tix, A. P. and Barron, K. E. (2004), “Testing moderator and mediator effects in counseling psychology research”, Journal of Counseling Psychology, No. 51, 115–134. Garcia-Mila T., Mcguire T.J., Porter R.H. (1996), “The Effect Of Public Capital In State Level Production Function Reconsidered”, Review of Economics and Statistics, Vol. 78. Geary, S., Zonnenberg, J.P., (2000). “What It Means To Be Best In Class”. Supply Chain
Management Review 4 (3), 42–48.
Gobena, L. B., & Van Dijke, M. (2015). “Power, Justice, and Trust: A Moderated Mediation Analysis of Tax Compliance among Ethiopian Business Owners”. Journal of Economic
Psychology.
Gogineni, A., Alsup, R. and Gillespie, D. (1995), “Mediation and moderation in social work research”, Social Work Research, No 19, 57–63.
Grant, D. B. (2014). “Trends in Logistics and Supply Chain Management: A Focus on Risk”.
Journal of Supply Chain Management, 8(2).
Gunasekarana A., Patelb C., Mcgaugheyc Ronald E. (2004); “A Framework for Supply Chain Performance Measurement”. International Journal of Production Economics 87 (2004), 333– 347.
Harrington, H.J., (1991). “Business Process Improvement: The Breakthrough Strategy for Total Quality, Productivity, and Competitiveness”. McGraw-Hill, New York.
Hayes, A. F., and Scharkow, M. (2013), “The relative trustworthiness of inferential tests of the indirect effect in statistical mediation analysis: Does method really matter?”
Hazen, B. T., Overstreet, R. E. and Boone, C. A. (2015), “Suggested reporting guidelines for structural equation modeling in supply chain management research”, International Journal of
Logistics Management, 26 (3).
Hines, P., (1998). “Benchmarking Toyota’s Supply Chain: Japan Vs. U.K. Long Range Planning” 31 (6), 911–918.
Hoyle, R. H. and Kenny, D. A. (1999), “Statistical power and tests of mediation”, In R. H. Hoyle, Statistical strategies for small sample research. Newbury Park: Sage.
Ibrahim, H. W., Zailani, S. and Tan, K. C. (2015), “A content analysis of global supply chain research”, Benchmarking: An International Journal, 22 (7), 1429-1462.
Judd, C.M. and Kenny, D.A. (1981), “Process Analysis: Estimating mediation in treatment evaluations”, Evaluation Review, 5 (5), 602- 619.
Kee-Hung Lai, E.W.T. Ngai , T.C.E. Cheng (2002). “Measures For Evaluating Supply Chain Performance in Transport Logistics”; Transportation Research Part E, 38 (2002) 439–456. Knezevic, V., Ivkovic, D., & Vujicic, S. (2014). “Competitiveness and Development of National Economy”. Economic Analysis, 47, 111-126.
Lai, K.-H., Ngai, E.W.T., Cheng, T.C.E., (2004). “An Empirical Study of Supply Chain Performance in Transport Logistics”. International Journal of Production Economics 87, 321–331.
Lambert, D. M., Cooper, M. C. and Pagh, J. D. (1998), “Supply chain management: implementation issues and research opportunities”, The International Journal of Logistics
Management, 9 (2), 1-20.
MacKinnon, D. P. (2008). “Introduction to statistical mediation analysis”, Mahwah, NJ: Earlbaum.
MacKinnon, D. P., & Pirlott, A. G. (2015). “Statistical approaches for enhancing causal interpretation of the M to Y relation in mediation analysis”. Personality and Social
Psychology Review, 19(1), 30-43.
MacKinnon, D.P. and Dwyer, J.H. (1993), “Estimating mediated effects in prevention studies”, Evaluation Review, 17 (2), 144-158.
MacKinnon, D.P. Fairchild, A.J., & Fritz, M.S. (2007), “Mediation analysis”, Annual Review
of Psychology, No. 58, 593-614.
MacKinnon, D.P. Lockwood, C.M., Hoffman, J.M., West, S.G., and Sheets, V. (2002), “A comparison of methods to test mediation and other intervening variable effects”,
Martí, L., & Puertas, R. (2015). “The importance of export logistics and trade costs in emerging economies”. Maritime Economics & Logistics.
Martí, L., Puertas, R. and García, L. (2014), “The importance of the Logistics Performance Index in international trade”, Applied Economics, 46 (24), 2982-2992.
Maskell P. Et Al. (1998), “Competitiveness, Localised Learning and Regional Development: Specialization and Prosperity In Small Open Economies”, Routledge, London.
Mentzer, J.T., Konrad, B.P., (1991). “An Efficiency/Effectiveness Approach to Logistics Performance Analysis”. Journal of Business Logistics, 12 (1), 33–62.
Min, H., Joo, S. (2006) “Benchmarking The Operational Efficiency Of Major Third Party Logistics Providers Using Data Envelopment Analysis”, Supply Chain Management: An
International Journal, 11 (3), 259-265.
Min, H., Joo, S. (2009) “Benchmarking Third Party Logistics Providers Using Data Envelopment Analysis: An Update”. Benchmarking: An International Journal, 572-587. Mohan J.B., (2013), “The Impact of Logistic Management on Global Competitiveness”,
International Journal of Business and Management Invention, 2 (3), 39-42.
Muller, D., Judd, C. M. and Yzerbyt, V. Y. (2005), “When moderation is mediated and mediation is moderated”, Journal of Personality and Social Psychology, No. 89, 852–863. Munnel A. (1990), “How Does Public Infrastructure Affect Regional Economic Performance?, In “Is There A Shortfall In Public Capital Investment?” Edited By A. Munnel, Boston, MA, Federal Reserve Bank Of Boston.
Nguyen, Q. C., Osypuk, T. L., Schmidt, N. M., Glymour, M. M., & Tchetgen, E. J. T. (2015). Practical Guidance for Conducting Mediation Analysis with Multiple Mediators Using Inverse Odds Ratio Weighting. American Journal of Epidemiology, 181(5), 349-356.
Oberhofer, P., & Dieplinger, M. (2014). “Sustainability in the transport and logistics sector: lacking environmental measures”. Business Strategy and the Environment, 23(4), 236-253. Olhager, J., Pashaei, S. and Sternberg, H. (2015), “Design of global production and distribution networks: A literature review and research agenda”, International Journal of
Physical Distribution & Logistics Management, Vol. 45 No. 1/2, 138-158.
Pestana, Barros C., Peypoch, N. (2009). “An Evaluation of European Airlines’ Operational Performance”. International Journal of Production Economics 122, 525–533.
Pooler, J. A. (1995). “The Use of Spatial Separation In The Measurement Of Transportation Accessibility”. Transportation Research Part A: Policy And Practice, 29(6), 421-427.
Porter M.E. (1990). The Competitive Advantage of Nations. New York: Free Press.
Preacher, K. J. (2015). “Advances in mediation analysis: a survey and synthesis of new developments”. Annual Review of Psychology, 66, 825-852.
Puertas, R., Martí, L., & García, L. (2014). “Logistics performance and export competitiveness: European experience”. Empirica, 41(3), 467-480.
Randall, W.S. and Mello, J.E. (2012), “Grounded theory: an inductive method for supply chain research”, International Journal of Physical Distribution & Logistics Management, Vol. 42 No. 8/9, 863-880.
Sachan, A. and Datta, S. (2005), “Review of supply chain management and logistics research”, International Journal of Physical Distribution & Logistics Management, Vol.35 No.9, 664-705.
Saenz, M. J. and Koufteros, X. (2015), “Special issue on literature reviews in supply chain management and logistics”, International Journal of Physical Distribution & Logistics
Management, Vol. 45 No. 1/2.
Schuller, B. J., & Lidbom, M. (2015). “Competitiveness of Nations in the Global Economy. Is Europe Internationally Competitive?”. Economics and Management, (14), 934-939.
Shrout, P.E. and Bolger, N. (2002), “Mediation in experimental and nonexperimental studies: New procedures and recommendations”, Psychological Methods, No. 7, 422-445.
Șipoș, G., Bîzoi, C., Șipoș, C. and Popescu, A. (2015), “The Transportation and Logistics Sector’s Performance and the Social Development–A Comparison within the European Union”, Studia Universitatis Babes Bolyai-Oeconomica, No.1, 68-81.
Skjoett-Larsen, T. (2000), “European logistics beyond 2000”, International Journal of
Physical Distribution & Logistics Management, 30 (5), 377-387.
Sobel, M. E. (1982), “Asymptotic confidence intervals for indirect effects in structural equation models”, In S. Leinhardt (Ed.), Sociological Methodology 1982, Washington DC: American Sociological Association, 290-312.
Uca, N., Civelek, M. E., & Çemberci, M. (2015). “The Effect of the Components of Logistics Performance Index on Gross Domestic Product: Conceptual Model Proposal”. Eurasian
Business & Economics Journal, 1(1), 86-93.
Van Hoek, R. I., Chatham, R., & Wilding, R. (2002). “Managers in supply chain management, the critical dimension”. Supply Chain Management: An International Journal, 7(3), 119-125.
Van Hoek, R., Harrison, A., & Christopher, M. (2001). “Measuring agile capabilities in the supply chain”. International Journal of Operations & Production Management, 21(1/2), 126-148.
Vona, R. (2011). “Riflessioni Sul Concetto Di Distretto Logistico”. Sinergie Italian Journal
of Management, (56), 229-250
Walker, H., Di Sisto, L., & McBain, D. (2008). “Drivers and barriers to environmental supply chain management practices: Lessons from the public and private sectors”. Journal of
Wanke, P. (2012) “Determinants of Scale Efficiency in the Brazilian Third-Party Logistics Industry From 2001 To 2009”, Brazilian Administration Review, 9 (1), 66- 87.
Wanke, P. F. (2012). “Product, Operation, and Demand Relationships between Manufacturers and Retailers”. Transportation Research Part E: Logistics and Transportation Review, 48(1), 340-354.
World Economic Forum, 2014, ‘The Global Competitiveness Report 2013-2014’, Insight Report.
WTO, 2007, 2012, 2014 ‘Connecting to Compete-Trade Logistics in the Global Economy, the Logistics Performance Index and Its Indicators’, Trade Report, Washington.
Zhao, X., Lynch, J. G., & Chen, Q. (2010). “Reconsidering Baron and Kenny: Myths and truths about mediation analysis”. Journal of consumer research, 37(2), 197-206.
Case Study
The Logistics Performance In The Balkans Area: Trend Evidence
!! ! !
Vittorio D’Aleo and Bruno Sergio Sergi
Department of Economics, University of Messina, Messina, Italy
Journal!for!Labour!and!Social!Affairs!in!Eastern!Europe!(SEER),!II!issue!2017! ! ! ! ! AbstractThis article, through a critical analysis of one of the most important indices of the World Bank – the Logistical Performance Index – aims to highlight the efficiency of the performance in logistics of the Balkans. The evidence shows that the examined countries follow different efficiency trends but that the levels reached are still inadequate compared to the efficiency average of EU countries. The study shows that the area still needs funding aimed at integrating the entire system into the European continent.
Key words
Balkans, performance, logistics, public policy, EU
Introduction
This article examines the competitiveness of networks and public infrastructure systems – ports, airports and rail networks – across the Balkans. Competitiveness may generate benefits in terms of lower prices and product quality improvement, but the globalisation process has extended the concepts of competitiveness to how competition affects territories and operating systems in terms of creating the conditions for economic and social development and attracting new entrepreneurship. Porter (1990) has emphasised the existence of exogenous factors that allow the creation of competitive advantage for firms or nations. Exogenous factors that overlap with the ‘allocation of production factors’, which include physical resources and infrastructure in the surrounding area, and the ‘governance’ related to public institutions and territorial policies are characteristics that have become highly relevant.
‘Logistics’, as one of the most important elements of productive economic activities, is intertwined with many variables that affect, more or less directly, countries’ efficiency and growth. That is, a sustained effort to foster the logistics could help to boost countries’ competitiveness while positioning them to tackle structural impediments to productivity. However, logistics might be seen as a complex sequence of co-ordinated activities because they refer to both traditional logistics as well as management across the entire supply chain. That is, logistics:
Encompasses freight transportation, warehousing, border clearance, payment systems and increasingly many other functions outsourced by producers and merchants to dedicated service providers. (World Bank, 2014)
The capacity of developing countries efficiently to move goods and connect manufacturers and consumers with international markets is improving – albeit slowly. However, much more is needed to close the existing ‘performance gap’ between high and low performers. Supply chains are only as good as their weakest link and sustainable improvements require complex changes in a range of policy dimensions in areas including infrastructure, trade facilitation and services. These efforts require focus and persistence – a combination that few countries have achieved so far, according to a new World Bank Group survey on trade logistics.
Transport is a fundamental sector of and for the economy, since it embraces a complex network of private and public companies which convey goods and services to citizens and businesses in the EU and its trade partners. It also provides mobility for European citizens, thus contributing significantly to the free movement of people within the EU’s internal market. Efficient transport services and infrastructure are vital to exploiting the economic strengths of all EU regions and supporting the internal market and growth, thereby enabling economic and social cohesion. They also matter for trade competitiveness as the availability, price and quality of transportation services have strong implications for production processes and choice of trading partners. Given such a central role, transport is, by definition, also inter-related with various other policy areas such as, for example, environmental and social policies.
A road and rail network able to support businesses and links with foreign states is the goal being pursued in Serbia, Albania and Kosovo with the ultimate aim of promoting national economic growth by attracting chains of investment. The Belgrade and Tiranë governments are expected to refer to the European Union an ambitious project for the construction and upgrading of several sections of the road and rail network which interconnect Serbia, Kosovo, Albania and Montenegro; the goal is to establish approval for the plan from Brussels and then an allocation of funds for its implementation, which will require significant funding.
One of the works in question is a road that enables Serbia to have direct access to the Albanian ports on the Mediterranean Sea: this will start from Niš, the southern Serbian city, and will connect with the Albania-Kosovo Highway, completed in 2013, which connects the Albanian coastal city of Lezhë with the Kosovo capital Prishtinë. In this way, Belgrade will see established a faster connection for businesses with the countries of southern Europe while, simultaneously, allowing Albania to become a transit point for trade and additional support. This will aid the central regions of the Balkans peninsula which, in part, suffer from a lack of infrastructure that connects them to European markets.
However, this project does not concern only the road network: existing railway links will also be renewed, strengthened and adapted to the standards of current-day requirements, necessary to make Serbia and Albania attractive to foreign investment. Both being candidates for EU membership, this will allow them to meet the standards imposed by Brussels, which requires further efforts by both governments to improve the quality of infrastructure in the field of
transport. Involvement in this project will be extended to the Belgrade-Bar railway, whose 467 kilometres link the Serbian capital with the port city of Bar in Montenegro. Its construction dates back to the times of Yugoslavia; in fact, it was started in 1952 finally being completed in 1976, 24 years later. Time and the lack of maintenance work, however, have caused the degradation of the line which, in addition to being slow, has also become unsafe; in 1998 and 1999, it was a target of NATO air strikes because of its strategic importance. The damage was later repaired, but its modernisation and, in some places, its reconstruction from scratch are essential conditions to make the Belgrade-Bar infrastructure one that can still be useful to the development of the region.
That a project involving four different countries and, above all, combining Serbia, Kosovo and Albania into a single team, in an area where, after years of war, the relationship has always been tense, represents a big step forward in the difficult normalisation of relations between the different entities that occupy one of the hottest regions of the Balkans.
Literature review
Beškovnik and Twrdy (2015) present a wider perspective on the possibilities of developing a regional strategy for the efficient management of the transport industry in the Balkans. Their focus is mainly on ports – their actual and future role in the transport industry and the regional economy – and they present a complete overview of the actual situation of the port industry and inland infrastructure. Based on a seven-pillar model, other key elements, such as the information technology systems in use, documentary procedures and the management strategies of ports in the Balkans are also analysed. The main proposal of the authors is connected to the development of a regional role for the ports on the eastern coast of the Adriatic Sea in order to secure port regionalisation and specialisation. On this basis, the inland infrastructure and other supporting elements, such as IT platforms and documentary procedures, should be developed accordingly. The entire region and economy should benefit from such co-operation as new supply chains might be attracted.
In further development, Carbone and Stone (2005) report on research into the ways in which European providers of logistics and transport services develop and grow. The strategic behaviour adopted by the leading twenty third-party European logistics service providers between 1998 and 2004 is examined, particularly their approach to mergers and acquisitions
and logistics alliances. It shows that growth among such companies is aimed at providing more cohesive European logistical coverage, but national culture constrains their efforts. Consequently, a greater level of consolidation is expected within the industry. A few market leaders offer a wide range and scope of services, while most other firms have a diversified portfolio of interests.
The twenty-first century has, according to Tatham and Rietjens (2015), seen a significant rise in all forms of disasters, which has resulted in military and humanitarian organisations becoming more frequently engaged in the provision of support to those affected. Achieving an efficient and effective logistical preparation and response is one of the key elements in mitigating the impact of such events, but the establishment of mechanisms to deliver an appropriately integrated civil-military approach remains elusive. Not least because of the high percentage of assistance budgets spent on logistics, this area is considered to represent fertile ground for developing improved processes and understanding. In practice, the demands placed on civilian and military logisticians are broadly similar, as is the solution space. Speaking a common language and using common concepts, it is argued, therefore, that the logistics profession should be in the vanguard of the development of an improved civil-military interface.
D’Aleo and Sergi (2015) aim to test the weight that the main sub-components of the global competitiveness index might have on the logistics performance index. They deploy a novel technique based on three newly-particularised clusters (‘infrastructure’, ‘institutions’ and ‘human factor’) to look at whether such clusters are related to efficiency in the 28 European Union countries. It is manifest that the human factor is far more important in improving the logistics performance index than infrastructure and institutions. It follows that, in this new domain of analysis, all initiatives to prioritise investment in the human factor constitute an appropriate means of stimulating innovation and economic outlook, in the knowledge that the logistics sector accounts for an average of 10% of the European Union’s GDP.
Finally in this brief overview, Pupavac and Golubović (2015) analyse how trade between countries is operated within a network of increasingly global logistics operators. However, the ease with which traders can use this network to connect with international
markets largely depends on country-specific factors such as trade procedures, transport and telecommunications infrastructure and the domestic market for support services.
The Logistics Performance Index (LPI) and its component indicators provide a unique global point of reference in which we can better understand these key dimensions of logistical performance. The first worldwide LPI was developed by the World Bank to provide a better assessment of how respective countries rank in the managerial and physical effectiveness of their logistics. At the global level in 2010, Croatia ranks 74th, behind developed EU countries but also behind the Balkan countries which are also members of the EU: Bulgaria, Romania and Greece.
The initial hypothesis of this study is that improving LPI to acceptable levels (to an index level greater than 3.5) would significantly improve trade expansion, the ability to attract foreign direct investment and economic growth. The research results are based on primary and secondary research methods and the findings should provide a realistic way of improving national competitiveness in the European and global logistics market.
Conceptual framework
The Logistics Performance Index measures the competitiveness gaps that exist between various countries, especially with regard to international trade. The construction of the index attempts to identify the key variables that are the basis of a nation’s ability to move goods quickly and economically across its borders. The LPI takes account of the efficiency of the national supply chain operation on the basis that good logistics facilitates efficiency. The World Bank’s partnership with the International Association of Freight Forwarders, the Global Express Association and the Global Facilitation Partnership has seen the development of the LPI for transportation and trade under which countries are evaluated using six components:
• efficiency of customs and border management clearance • quality of trade and transport infrastructure
• ease of arranging competitively-priced shipments • competence and quality of logistic services • ability to track and trace consignments