the Creative Commons Attribution 3.0 License.
Use of a remotely piloted aircraft system for hazard assessment
in a rocky mining area (Lucca, Italy)
Riccardo Salvini1, Giovanni Mastrorocco1, Giuseppe Esposito1, Silvia Di Bartolo1, John Coggan2, and Claudio Vanneschi2
1Department of Environment, Earth and Physical Sciences and Centre of GeoTechnologies, University of Siena, Via Vetri Vecchi 34, 52027 San Giovanni Valdarno, AR, Italy
2University of Exeter, Camborne School of Mines (CSM), College of Engineering, Mathematics and Physical Sciences (CEMPS), Penryn, Cornwall TR10 9EZ, UK
Correspondence: Riccardo Salvini ([email protected]) Received: 31 May 2017 – Discussion started: 14 June 2017
Revised: 10 November 2017 – Accepted: 14 November 2017 – Published: 19 January 2018
Abstract. The use of remote sensing techniques is now common practice in different working environments, includ-ing engineerinclud-ing geology. Moreover, in recent years the de-velopment of structure from motion (SfM) methods, to-gether with rapid technological improvement, has allowed the widespread use of cost-effective remotely piloted aircraft systems (RPAS) for acquiring detailed and accurate geo-metrical information even in evolving environments, such as mining contexts. Indeed, the acquisition of remotely sensed data from hazardous areas provides accurate 3-D models and high-resolution orthophotos minimizing the risk for opera-tors. The quality and quantity of the data obtainable from RPAS surveys can then be used for inspection of mining ar-eas, audit of mining design, rock mass characterizations, sta-bility analysis investigations and monitoring activities. De-spite the widespread use of RPAS, its potential and limita-tions still have to be fully understood.
In this paper a case study is shown where a RPAS was used for the engineering geological investigation of a closed mar-ble mine area in Italy; direct ground-based techniques could not be applied for safety reasons. In view of the re-activation of mining operations, high-resolution images taken from dif-ferent positions and heights were acquired and processed us-ing SfM techniques to obtain an accurate and detailed 3-D model of the area. The geometrical and radiometrical infor-mation was subsequently used for a deterministic rock mass characterization, which led to the identification of two large marble blocks that pose a potential significant hazard issue for the future workforce. A preliminary stability analysis,
with a focus on investigating the contribution of potential rock bridges, was then performed in order to demonstrate the potential use of RPAS information in engineering geological contexts for geohazard identification, awareness and reduc-tion.
1 Introduction
In open-pit or quarry areas, personnel and equipment in-volved in mining operations can be exposed to different types of slope instability processes. Rock collapses can be due to a series of predisposing and triggering factors, mostly depend-ing on relationships between localized geological conditions and mining activities. According to Zajc et al. (2014), for ex-ample, hazardous situations may occur when unfavourable sedimentological characteristics and geological discontinu-ities (e.g. joints, faults) of rock masses are made even more critical by extraction of the resource or ore material. In ad-dition, Zheng et al. (2015) highlight the crucial role played by morphological features, such as sharp cuts and steep slopes, for potential triggering of rockfalls in mining areas. As widely demonstrated in the literature, the understanding of geometric relationships between geological discontinu-ities and slope morphology is essential to evaluate the po-tential occurrence of rock failures, since orientation of joint sets may influence both size and failure mechanisms of rock blocks prone to collapse (e.g. Stead and Wolter, 2015).
Generally, discontinuity characterization is carried out in the field by traditional engineering geological surveys (Priest, 1993). Measurements may be subjected to differ-ent source of errors which can result in either under- or overestimation of the discontinuity geometrical properties (Tuckey and Stead, 2016). In order to avoid this deficiency Sturzenegger and Stead (2009) suggest coupling traditional field measurements with remote sensing techniques. Indeed, techniques such as terrestrial laser scanning (TLS) and dig-ital terrestrial photogrammetry (DTP) for rock mass charac-terization are increasingly being used, especially in open-pit mines where rock slopes subjected to excavation are analysed (e.g. Kovaniˇc and Blišˇtan, 2014; Salvini et al., 2015; Tuckey and Stead, 2016). TLS and DTP allow accurate representa-tion of rock outcrops by means of 3-D point clouds or inter-polated models. A limitation of ground-based remote sens-ing is related to the survey of complex topography from sub-optimal camera or scanner positions, resulting in occlusion zones (Passalacqua et al., 2015). A solution to this problem is provided through use of remotely piloted aircraft systems (RPAS), which can be used as a platform to acquire light de-tection and ranging (lidar) or photogrammetric data. Indeed, RPAS photogrammetry for engineering geological investiga-tions has become widespread mainly because it is a cost-efficient, highly flexible and safe technique (Remondino et al., 2011; Siebert and Teizer, 2014; Tannant, 2015). There are several photogrammetric studies using RPAS for the geomor-phic feature characterization or mapping of the surface extent in open-pit mines (Lamb, 2000; Chen et al., 2015; Shahbazi et al., 2015; Tong et al., 2015; Esposito et al., 2017), and few studies are also associated with the use of RPAS for dis-continuity characterization of rock slopes affected by mining activity. Salvini et al. (2017), for example, used RPAS to map discontinuities in a marble quarry and to subsequently build 3-D discrete fracture network models. McLeod et al. (2013) explored the feasibility of using RPAS-acquired video im-ages to derive 3-D point clouds and to measure fracture ori-entations.
Digital images obtained from RPAS are commonly pro-cessed with the structure from motion (SfM) technique (Spet-sakis and Aloimonos, 1991; Fonstad et al. 2013; Colomina and Molina, 2014; Westoby et al., 2012). SfM is based on sophisticated algorithms of image matching that use pseudo-random redundant images acquired from multiple viewpoints to reconstruct the 3-D geometry of an object or surface. In or-der to analyse rock outcrops, the use of RPAS multicopter results particularly suitable because it allows different ge-ometric configurations for image acquisition (i.e. zenithal, frontal, oblique). Multiple images obtained from different angles help the image alignment procedure and limit non-linear deformations. Moreover, the relatively short distance to which multicopters can operate from rock faces allows ac-quisition of high-resolution images that can be used to pro-duce high-quality topographic products and subsequent in-vestigation.
In RPAS–SfM applications particular care is needed when georeferencing the 3-D model. As stated by Passalacqua et al. (2015), cameras fixed to RPAS typically do not have on-board navigation systems with sufficient accuracy for geode-tic positioning. In fact, the global navigation satellite system (GNSS) and inertial measurement unit (IMU) devices typi-cally mounted on RPAS are used for navigation and flight stabilization purposes and allow only a rough estimation of airborne camera exterior orientation (Gonçalves and Hen-riques, 2015). In order to obtain accurate and georeferenced 3-D models, the use of ground control points (GCPs) sur-veyed with geodetic GNSS receivers and a total station (TS) is generally employed (Francioni et al., 2015). Nevertheless, the final accuracy is dependent not only on the GCP-related accuracy, density and distribution within the surveyed area but also on image quality and percentage of overlapping be-tween single frames. Therefore, careful planning of an RPAS photogrammetric survey plays a crucial role in providing ac-curate results necessary for subsequent analysis, such as de-termination of discontinuity measurements in terms of atti-tude (dip direction and dip), spacing and persistence. The latter, for example, is among the controlling factors that can have a great influence on the stability condition of a block or slope and it cannot be fully determined. The presence of intact rock bridges, which represent intervals of intact rock between adjacent discontinuities (ISRM, 1978), can signif-icantly increase the stability of a rock slope, since the co-hesion of the intact rock is generally of at least 2 orders of magnitude greater than the shear strength of a discontinuity (Park, 2005). In general, joint persistence (K) is defined as the fraction area that is actually discontinuous (Einstein et al., 1983) and can be calculated with the following Eq. (1): K = lim AD→∞ P iaDi AD , (1)
where D is a region of the plane with area ADand aDiis the area of the joint in D.
The limit of the application of this method is that the dis-continuity area is practically impossible to measure deter-ministically in the field and, for this reason, persistence is commonly measured as trace length on rock outcrops. Jen-nings (1970) proposed the following Eq. (2) for persistence calculation starting from trace length values on rock expo-sure:
K = P JL
P JL + P RBR, (2)
where JL is the total length of the joints segment and RBR is the total length of rock bridges.
Mathematically, it is possible to consider the presence of rock bridges in terms of effective cohesion along the shear surface (Eberhardt et al., 2004) by using the following Eq. (3):
ci =c Ag
A, (3)
rock bridges along the shear surface and A is the total area of the shear surface.
Importantly, as recently reported by Tuckey and Stead (2016), in spite of the importance of intact rock bridges in slope stability, there are still no standard accepted methods for estimating the extent of rock bridges and incorporating rock bridges into slope stability analysis.
In this study, two RPAS-based photogrammetric surveys were carried out within an open-pit mine of the Apuan Alps marble district, Italy. These surveys aimed to obtain detailed topographic information of the area. The 3-D data were then used to perform a preliminary rockfall hazard assessment, re-quested in view of a potential restart of the mining operations interrupted some years ago. Indeed, the safety of the work-force represents a critical aspect for the exploitation of the marble quarries of the Apuan Alps. The geostructural condi-tions of the marble predispose the rock masses to different types of failures with different magnitudes. Slope stability analyses are therefore essential to improve safety conditions for personnel employed in the mines. However, a complete analysis of all the slopes characterizing an open-pit mine is often problematic, given their spatial extension and limita-tions of numerical models. For this reason, both geological and geomorphological information of the whole mining area are essential to detect and evaluate the most hazardous sit-uations. RPAS-derived data were therefore integrated with those acquired in the field from a traditional engineering ge-ological survey. The combined use of these data allowed pre-liminary 3-D analysis and evaluation of the stability condi-tions of a large rock block that was identified as posing a risk to the mining area.
2 Geographical and geological setting
The study area is located in the Apuan Alps marble dis-trict, in the province of Lucca (Tuscany, Italy; Fig. 1). The open pit or quarry, named Piastrone, is characterized by a V shape, with two principal slope directions oriented 50/90 and 323/90 (dip direction / dip). The bottom of the pit is lo-cated at 1180 m above sea level (m a.s.l.) and the top of the excavated rock face is at 1300 m a.s.l. The rock mass is char-acterized by different sets of discontinuities with persistence values that can vary from a few metres up to decametres.
From a geological point of view (Fig. 2) the Piastrone open pit is located in the Apuan Alps metamorphic complex, pre-cisely in the Mt. Altissimo Syncline (AS), belonging to the Apuane Unit (Meccheri et al., 2007). According to classical interpretation (Carmignani and Kligfield, 1990) AS resulted from a compressive tectonic phase which originated during the continental collision between the Sardinia–Corsica block and the Adria plate (Upper Oligocene–Lower Miocene). Successively, during the Early Miocene, a new ductile to brittle–ductile deformation caused by a post-compression
Figure 1. Plan view of the Piastrone open pit with indication of the two principal slope directions (dotted lines). Inset map shows the location of the study area.
tectonic uplift overprinted the earlier structures and gener-ated a widespread network of joints and faults. In the Mt. Al-tissimo area, the main set of brittle deformation strikes SW– NE to W–E with sub-vertical dip, generally with negligible displacement except for a few cases where offsets of some 10 m have been observed (Meccheri et al., 2007).
AS involves the oldest lithologies of the Apuane Unit sequence, including pre-Alpine basement rocks, Grezzoni dolostones, megalodont-bearing marbles with metabreccia and chloritoid-rich phyllites, local lenses of dolomitic mar-bles and Marmar-bles sensu stricto of lower Liassic age (Mec-cheri et al., 2005). Due to the compressive tectonic phase, a penetrative S1 foliation is also present in all the lithotypes (except for dolostones).
3 Methods
3.1 Geomatic survey
In order to assess and localize the slope stability hazard in the rocky mining area, two RPAS surveys were carried out with direction of photo acquisition in zenithal modality dicular to the open-pit floor) and in frontal modality (perpen-dicular to the rock faces). The surveys were performed in De-cember 2015 using the Aibotix™ Aibot X6 V1 multicopter, which has six electric rotors, and equipped with a Nikon™ CoolpixA digital camera (Table 1) and a GNSS–IMU system that allows recording of 3-D coordinates (X0, Y0, Z0) and orientation of the camera (pitch, roll, yaw – ω, φ, κ) at every shoot or image.
The zenithal survey was preliminarily designed in the lab-oratory with the Aibotix™ AiProFlight planning software and manually performed through single quasi-parallel flight lines. A total of 151 aerial images were acquired with a nom-inal overlap and sidelap of 80 and 60 %, respectively. Two flights were required to cover all sectors of the mining area (Fig. 3).
Figure 2. Geological map of the Mt. Altissimo area. The green rectangle indicates the location of the quarry (modified from Giglia and Paiotti, 1963).
Table 1. Utilized RPAS and camera specifications.
18
Table 1. Utilized RPAS and camera specifications.
RPAS Type Dimensions (cm) Engines Rotor diameter (cm) Empty weight (kg) Max. takeoff weight (kg) Aibotix Aibot X6 v1 Width 105
Height 45 Brushless motors 30.48 (12") 2.45 6.5
Camera Sensor type Sensor Size
(mm) Image size (pixel) Pixel size (mm) Focal length (mm) Nikon Coolpix A CMOS 23.6 x 15.6 4,928 x 3,264 0.0047 18.5 5 10 15 20 25
RPAS Dimensions Engines Rotor Empty Max. takeoff Type (cm) diameter weight weight (cm) (kg) (kg) Aibotix Width 105 Brushless 30.48 (1200) 2.45 6.5 Aibot X6 v1 Height 45 motors
Camera Sensor type Sensor size Image size Pixel size Focal length (mm) (pixel) (mm) (mm) Nikon Coolpix A CMOS 23.6 × 15.6 4928 × 3264 0.0047 18.5
An average estimated distance between pixel centres mea-sured on the ground (i.e. ground sample distance – GSD) of 2.4 cm was calculated. During the flight, a GNSS field sur-vey was also carried out in order to ensure the necessary spa-tial accuracy of the resultant images. Eight artificial targets, 50 × 50 cm large, were placed on the ground with the pur-pose of obtaining an optimum spatial distribution on the ac-cessible zones of the study area (Fig. 4) and used as GCPs and check points.
The GNSS survey was carried out in real-time kinematic (RTK), using geodetic receivers. A reference station was set up, recording continuous signals from the GNSS satellite
constellation for more than 3 h. The positional information obtained by the reference station was then sent to a mobile receiver, using radio modem communication. Each GCP was occupied for at least 2 min with a recording interval equal to 1 s. The reference station coordinates determined using this technique were corrected by post-processing procedures us-ing contemporary data recorded by three permanent GNSS stations (La Spezia, Pieve Fosciana and Pisa) allowing mil-limetric accuracy. Consequently, the rover data were shifted permitting centimetric accuracy for the eight artificial targets. The orthometric heights were also calculated by using Con-vergo, an Italian code for full coordinate conversion. The
Figure 3. Flight paths of the RPAS zenithal surveys (a). Plan view of the area with indication of camera locations (black dots) and image overlap percentage (b).
Figure 4. Example of a GCP measured during the RTK GNSS field survey (a) and spatial distribution of GCPs and check points for the RPAS zenithal flights (b).
ordinates of the GCPs were collected in ETRF2000 and then converted to the Italian National Gauss Boaga system.
The frontal survey, with direction of acquisition parallel to the rock face, was carried out manually, without the use of the Aibotix™ AiProFlight planning software. Six flights were needed in order to cover all sectors of the mining area, resulting in a total of 448 overlapping images. The flights were executed in sub-parallel straight lines approximately 60 m distant from the rock face (Fig. 5), providing an average estimated GSD of 1.5 cm.
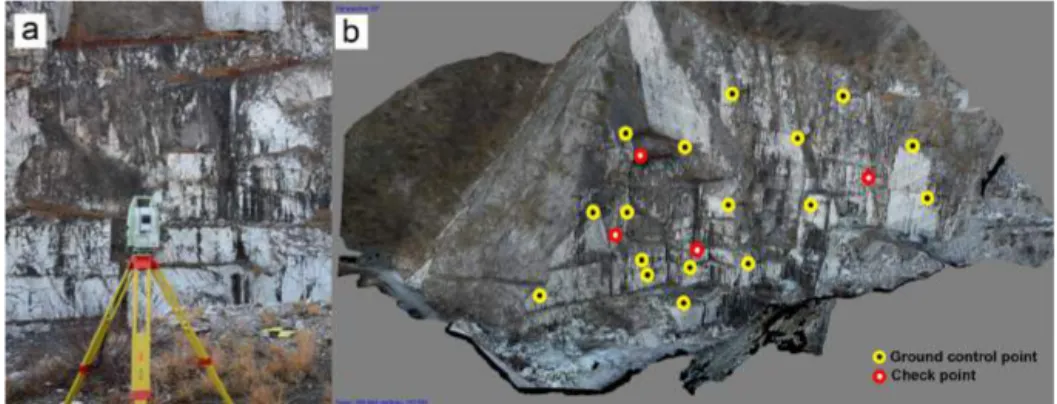
As for the zenithal flight, a series of GCPs and check points (21 targets in total; Fig. 6) were measured using a reflectorless TS. Their location was decided considering a balance between an optimum spatial distribution (Fig. 6),
both in space and elevation from the open-pit floor, and easy identification of points on the images. Due to the com-plex morphology of the slopes and the extent of the min-ing area, a large number of GCPs were used to orient the photogrammetric model. Two GNSS receivers, operating in static modality, were used to obtain the geographic coordi-nates of two points: the origin of the survey and its zero-azimuth direction. For this survey, GNSS data were corrected using contemporary data recorded by permanent GNSS sta-tions and ellipsoidal heights were converted to orthometric heights.
Figure 5. Plan view (a) and perspective view (b) of the RPAS frontal surveys (blue rectangles correspond to the photographs lo-cations, black lines to normals). Corresponding 3-D point clouds produced by the photogrammetric processing of natural colour dig-ital images are shown in background.
3.2 Application of structure from motion algorithms The software Agisoft™PhotoScan Professional version 1.2.5 (Agisoft, 2016) was used to process the images obtained from the two RPAS surveys (two zenithal flights plus six frontal flights). This software is capable of solving the cam-era interior and exterior orientation parameters and gener-ating georeferenced spatial data such as 3-D point clouds, digital surface models and orthophotos. All the images ac-quired from the two surveys were processed with identical photogrammetric processing, in two distinct Agisoft™ Pho-toScan projects; one for the zenithal flights and another for the frontal flights.
The first processing step consisted of image alignment, through which the interior and relative orientation parame-ters were solved. In order to improve the whole alignment process and to obtain low re-projection error, millions of tie points were automatically extracted without setting a point limit. Following image alignment, the second processing step involved georeferencing of the 3-D model in such a way as to solve the exterior orientation parameters by using the GCPs coordinates measured during the two GNSS–TS topographic surveys. The exterior orientation of images was necessary to
measure the orientation, with respect to the north, and in-clination of slopes and discontinuities, which are needed for the stability analysis (Firpo et al., 2011). For both surveys, a number of the measured points were used as check points to verify the model accuracy. Specifically, for the zenithal sur-vey 2 of the 8 measured targets were used as check points, while for the frontal survey (with direction of photo acquisi-tion parallel to the rock faces) 4 points out of 21 were used as check. Both natural and artificial targets were identified directly on the images, assigning a 3-D coordinate to each of them.
Subsequently, the “optimize” tool was utilized to ad-just the estimated camera positions and to remove possible non-linear deformations, minimizing the errors due to re-projection and misalignment of the photos. Moreover, the op-timization was improved by deleting all the tie points with a re-projection error greater than 1 pixel.
In a subsequent step, the zenithal and frontal dense 3-D point clouds were generated with medium quality and ag-gressive depth filtering settings. No automatic classification of clouds was necessary: no infrastructure was present as the mine was not operational and there was no vegetation within the area of interest.
Finally, a polygonal 3-D mesh model was created from the point cloud and used to create the orthophoto of the open-pit area. The orthophoto has image distortions removed due to camera characteristics (i.e. lens distortions), camera tilt and topographic relief displacement. Unlike an uncor-rected aerial photograph with a perspective projection, an orthophoto is geometrically corrected (“orthorectified”) and can be used to measure true distances since it is “scale-corrected”. The corrected orthophoto image with a spatial resolution of 1 cm pixel−1 was then projected into the Ital-ian National Gauss Boaga system.
3.3 Engineering geological investigation
In order to characterize the rock mass within the open-pit mine, a relatively large number of discontinuities were iden-tified directly on the dense point cloud. The orientation of the selected discontinuities was manually calculated by creating patches that best fit the identified discontinuity planes in the point cloud and extracting their orientation using the Leica™ Cyclone 9.0 software. Discontinuity sets were then identi-fied using stereographic representation (Schmidt equal-area method, lower hemisphere).
According to Mastrorocco et al. (2017), a manual deter-ministic fracture mapping was also adopted because it in-creases the level of control of the process, which is essen-tial where the morphology of the quarry slope surfaces is largely artificial (smooth cut surfaces). The collected point cloud-derived data were then compared with those manually measured by traditional engineering geological surveys. On the basis of engineering geological data, geological strength index (GSI; Hoek, 1994) and rock mass rating (RMR;
Figure 6. Topographic survey with TS (a) and spatial distribution of GCPs and check points for the RPAS frontal flights (b).
awski, 1989) characterization were also applied, and a kine-matic stability analysis was carried out using the Markland test (Markland, 1972). The latter testing was undertaken in order to identify potential kinematic failure mechanisms that affect the slopes. The tests for planar sliding, wedge slid-ing and direct topplslid-ing were conducted for the two princi-pal slopes (eastern slope dip direction / dip 323/90; western slope dip direction / dip 50/90).
Despite the importance of performing kinematic analysis to discover possible block instability, one of the principal limitations of this stereographic method is the inability to lo-cate the block source areas on the slope being analysed. For this reason, the most critical blocks have been identified di-rectly on the point cloud. The points representing the geom-etry of every single block were meshed in Leica™ Cyclone 9.0 and their volume estimated using reference planes corre-sponding to the discontinuities that demarcate or shape the respective blocks.
The collected orientation data were finally used for pre-liminary stability analyses using Rocscience™Swedge soft-ware. Swedge is a 3-D software for evaluating the stability of surface wedges in rock slopes. It considers the intersec-tion of discontinuities and allows the calculaintersec-tion of safety factors of the formed blocks. The software is based on clas-sical limit equilibrium methods that usually have some lim-itations, such as the lack of consideration of in situ stress, strains and intact material failure (Stead et al., 2006). Never-theless, Swedge does allow consideration of external forces by applying a force (vector with given orientation and inten-sity) to the formed blocks. From this, preliminary analysis of the impact of water content or other forces can also be per-formed. The software can also be used to assess the stability of wedges formed by a basal plane.
Table 2. Information related to the zenithal and frontal photogram-metric surveys and processing.
Zenithal RPAS Frontal RPAS
survey survey
Number of images 151 448
GSD1 0.024 m pixel−1 0.015 m pixel−1 Relative flying altitude 93.9 m 60.7 m Number of tie points 1 484 605 3 783 992
GCP2RMSE3 0.042 m 0.043 m
Check point RMSE 0.065 m 0.03 m
GCP reprojection error 0.41 pixel 0.48 pixel
1Ground sample distance.2Ground control point.3Root mean square error.
4 Results
4.1 Photogrammetric modelling
The image alignment process, described in Sect. 3.2, resulted in a re-projection error on the images of 0.41 pixel for the zenithal survey and 0.48 pixel for the frontal survey. The final root mean square error (RMSE) for the zenithal flights exte-rior orientation was equal to 0.042 m; RMSE for the frontal flights exterior orientation was equal to 0.043 m (Table 2).
The final 3-D frontal and zenithal point clouds contain more than 18 000 000 and almost 13 000 000 points, respec-tively, with a mean point spacing varying from 1 to 4 cm. 4.2 Rock slope engineering geological characterization A total of 154 discontinuity planes were selected on the 3-D point clouds derived from both frontal and zenithal surveys; related orientations were thus calculated taking into account geographic coordinates of the clouds and then plotted on a stereonet. Analysis of the stereonet allowed identification of four discontinuity sets, whose properties listed in Table 3 were obtained in the field through traditional engineering ge-ological survey.
By comparing the discontinuity planes obtained through traditional manual engineering geological survey (in Fig. 7a)
Table 3. Characteristics of the discontinuity sets measured based on traditional manual engineering geological survey in the study area. The joint roughness coefficient (JRC) and joint compressive strength (JCS) are also indicated.
Set Dip direction / dip Aperture Filling Persistence Spacing JCS JRC Weathering Water (◦) (mm) (m) (m) (MPa)
K1 231/60 0–1 None, hard filling 2–10 0.1–0.3 50 2–6 Slightly weathered Damp K2a 234/86 0–0.5 Hard filling 5.5 5–10 60 2–4 Slightly weathered Dry K2b 66/86 0-0.5 Hard filling 5.5 5–10 60 2–4 Slightly weathered Dry K3a 142/81 0–2 None < 20 10–15 50 2–6 Slightly weathered Damp K3b 177/84 0–2 None < 20 10-15 50 2–6 Slightly weathered Damp K4 291/67 1–2 None 1–3 0.5–1.5 55 2–4 Slightly weathered Damp
Figure 7. Stereonet plot of poles (Schmidt, equal area, lower hemisphere) of the discontinuities manually collected through classical engi-neering geological survey (a) and remotely collected by using photogrammetric data from RPAS surveys (b).
and that identified on the point cloud (in Fig. 7b), a good level of congruence has been highlighted, confirming the quality of the taken approach.
Based on the discontinuity characteristics derived from RPAS and traditional engineering geological surveys, the ba-sic RMR (RMRb) and GSI were calculated. The RMRb re-sulted equal to 67 (Table 4), while the GSI was estimated to be between 60 and 65 using the modified chart pro-posed by Hoek et al. (2013). In addition, application of Hoek et al. (2013) equation for GSI quantification – GSI = 1.5 JCond89+RQD/2, where JCond89 is the joint condition as defined by Bieniawski (1989) and RQD is the rock quality designation as defined by Deere (1963) – confirmed the re-sults of the qualitative chart interpretation with a value of 65. Both classifications indicate a rock mass of “good” quality.
These results agree with the authors’ field observations and what is described in the actual quarry excavation plan (Lorenzoni, 2012). In view of the rock competency, potential instability is not related to the strength properties of the rock mass, but the intersection of discontinuity planes can locally form rock blocks with the potential for sliding or toppling. For this reason, a kinematic stability analysis was performed.
A discontinuity friction angle of 35◦was used in the anal-ysis: this agrees with data from previous studies carried out by the quarry’s advisors (Lorenzoni, 2012; Dumas, 1999), by the Geomechanical Laboratory of the Centre of GeoTech-nologies of Siena University and literature (e.g. Chang et al., 1996; Perazzelli et al., 2009). Table 5 shows the potential failures identified through kinematic stability analysis (ex-amples are shown in Fig. 8) for both principal slope orienta-tions.
Three different possible kinematic modes were identified, with K2b and K4 systems having the most influence on po-tential instability. The majority of the popo-tential failures iden-tified relate to planar sliding or wedge sliding, in agreement with field and SfM-based observations. The results highlight the potential for blocks to form that may be subject to gravity induced instability but, as previously stated, traditional kine-matic analyses do not identify the location of these unstable blocks. Therefore, further analysis of the high-resolution im-ages and the dense point clouds was performed in order to lo-cate possible block source areas. More than 20 blocks were deterministically characterized in terms of size, shape and barycentric coordinates, varying from about a cubic metre to
Parameter K1 K2a K2b K3a K3b K4 A1 Strength of intact rock material 7
A2 RQD (75 %) 17
A3 Spacing of discontinuities 15 20 20 20 20 15 A4 Condition of discontinuities 19 19 19 18 18 20 A5 Groundwater 10 15 15 10 10 10
RMRb 67
Figure 8. Examples of kinematic stability analysis carried out using Rocscience™ Dips 6.0 stereographic projection through the Wulff equal-angle method (lower hemisphere): (a) planar sliding on the eastern slope; (b) wedge sliding on the eastern slope (with highlighted great circles of intersection K1/K3b as example); (c) direct toppling on the western slope; (d) aerial photo showing the two principal slope orientations.
a few hundred cubic metres. In addition, the analysis identi-fied two large blocks (Fig. 9), a few thousand cubic metres in size, with potential for sliding. These are formed by the inter-section of two different faults and a discontinuity basal plane with 5 cm aperture, no infill, smooth surface and high persis-tence. The basal plane appears not to correspond with any of the identified discontinuity sets but is probably connected to
planes of weakness of the marble in correspondence with a particular orientation of minerals crystallographic axes. The lateral and rear faults, however, may be associated with the K3a and K3b systems, respectively. The rear fault may also be associated with the E–W fault system that characterizes the geology of this area of the Apuan Alps complex (Fig. 2).
Table 5. Potentially unstable discontinuity systems along the two different slope orientations. Slope Planar sliding Wedge sliding Direct toppling
50/90 K2b K3a/K3b, K2b/K3a, K2b/K3b, K2b/K4, K2a/K4 K3a/K4, K1/K3a, K1/K4 (basal plane K2b) 323/90 K4 K1/K3b, K3b/K4, K1/K4, K2a/K4, K2b/K4 K3a/K3b, K2b/K3a, K2b/K3b, K1/K2b, K1/K2a,
K2a/K2b (basal plane K4)
Figure 9. Identification of two large blocks with potential for sliding; inset photo highlights the visible aperture of the basal plane.
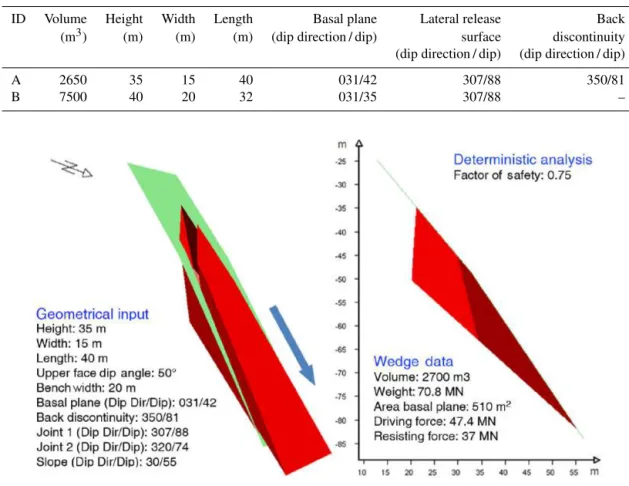
The geometric characteristics of the two blocks, including orientation of the intersecting discontinuities and volume of the meshed block, were obtained using Leica™Cyclone 9.0 and are shown in Table 6.
The first block, Block A, is of particular interest because it daylights in the slope face and prevents Block B from sliding (similar to an active-passive wedge; Prandtl’s prism transi-tion zone; Kvapil and Clews, 1979). A main road access to the quarry is located at the base of this slope, increasing the potential risk for the area. Due to the particular geometrical configuration, Block A can be described as the key block as it daylights the rock face. In the actual setting Block B does not hold the potential for sliding as it does not daylight in the slope face, but it could play a significant role in terms of additional weight force. Nevertheless, the following prelimi-nary stability analysis is focused on Block A. Further inves-tigation would require an analysis of the effect of Block B on the potential for instability as this provides the “active” component of the active–passive wedge.
4.3 Preliminary slope stability analysis
The geometry of Block A was deterministically re-created in Swedge using the geometrical information shown in Fig. 10. Initially the discontinuities were assumed to be fully per-sistent. This is a common approach in engineering geology, since reliable values of persistence are almost impossible to obtain from field mapping and most rock slope stability anal-yses assume that the 100 % persistent joint exists on failure surface (Park, 2005). The basal plane is a joint and the
possi-ble presence of rock bridges should be carefully considered. In this case the basal plane did not show the presence of seg-ments of intact rock along its trace on the rock exposure; consequently, application of Eq. (2) confirms a 100 % persis-tence of the basal plane, which was used in the first analysis. In addition, the lateral and rear or back surfaces correspond to geological faults and can be therefore considered fully per-sistent. In this regard, the western lateral surface has been in-cluded in the Swedge model has a discontinuity (Joint 1 in Fig. 10; dip direction / dip 307/88), while the back surface has been included as a tension crack (Back discontinuity in Fig. 10; dip direction / dip 350/81). It should be also noted that the eastern lateral surface observable in the model (Joint 2 in Fig. 10; dip direction / dip 320/74) was also necessary to re-create the block geometry in the software. A friction angle of 0◦was assigned to the latter so as not to induce a resist-ing force in the simulation. Water forces were also initially ignored within the preliminary analysis.
The adopted limit equilibrium solution for the slope stabil-ity analysis was based on the Mohr–Coulomb shear strength model with a friction angle of 35◦ and a unit weight of 0.026 MN m−3(Ertag, 1980; Dumas, 1999).
The result highlights a possible condition of instability for Block A which does not match with field observations, since the block under study has remained stable in this position for tens of years. In order to investigate the effect of uncertainty or variability of the input parameters, a sensitivity analysis was performed. In a sensitivity analysis (Fig. 11) specific parameters are varied across a range of values and the
ID Volume Height Width Length Basal plane Lateral release Back (m3) (m) (m) (m) (dip direction / dip) surface discontinuity (dip direction / dip) (dip direction / dip) A 2650 35 15 40 031/42 307/88 350/81
B 7500 40 20 32 031/35 307/88 –
Figure 10. Result of Rocscience™Swedge 3-D preliminary slope stability analysis.
fect on the factor of safety is observed. This helps to iden-tify the parameters that have the most effect on block sta-bility. Since the geometrical inputs are well defined through the accurate 3-D model, the subsequent analysis focused on waviness angle (it accounts for the undulations of the joint surface, observed over distances on the order of 1 to 10 m; Miller, 1988), cohesion and friction angle of the basal plane, and water pressure. These are also the parameters with the higher input uncertainty.
Results of the sensitivity analysis (Fig. 11) show that the cohesion is clearly the parameter that has the most effect on block stability. For this reason, the effect of this parameter was investigated in more detail in the following analyses. Ap-plication of Eq. (3) makes it possible to determine an effec-tive cohesion dependent on the continuity of jointing. From this the contribution of eventual rock bridges on the block stability can be investigated starting from intact rock cohe-sion material value, which has been determined to be approx-imately 16 MPa (Lorenzoni, 2012; Dumas, 1999; data from Geomechanical Laboratory of the Centre of GeoTechnolo-gies of Siena University). Table 7 shows the results in terms of factor of safety obtained from a parametric stability anal-ysis performed with increased values of effective cohesion, corresponding to 0, 0.5, 1, 2, 5 and 10 % of rock bridges on
the basal plane (total area of 510 m2), and a 20 % of water-filled fissures (considered reliable after field observation and high-resolution images analysis).
5 Discussion
The RPAS approach adopted in this case study, based on the combined use of high-resolution images from differ-ent perspective and accurate GNSS–TS topographic surveys, overcame data acquisition difficulties related to high steep quarry walls and provided high-resolution orthophotos of the site (1 cm pixel size). The application of RPAS instrumenta-tion was extremely successful for reconstructing the complex morphology of the mine site where ground-based techniques (e.g. TLS, terrestrial photogrammetry) have limitations due to potential “shadow” effects and several inaccessible set-up zones due to safety reasons. GCPs measured using a TS and GNSS receivers permitted a high level of accuracy in the im-ages exterior orientation, which is particularly important for subsequent discontinuity measurements. In particular, the fi-nal RMSE calculated on the check points (Table 2) was about 6 cm for the zenithal flight and 3 cm for the frontal flight. This small difference is mainly due to the fact that higher parts of
Figure 11. Result of sensitivity analysis relative to the parameters basal joint waviness, friction angle, cohesion and water percent filled. Table 7. Results of the parametric analysis increasing basal plane cohesion values.
Rock bridge Intact rock Total cohesion Driving force Resisting force Factor of safety
% (m2) (MN) (MN) (MN) 0 0 0 48.4 35.9 0.7 0.5 2.55 40.8 48.4 76.7 1.5 1 5.1 81.7 48.4 117.6 2.4 2 10.2 163.3 48.4 199.2 4.1 5 25.5 408.3 48.4 444.2 9.1 10 51 816.5 48.4 852.4 17.6
the quarry were inaccessible for safety reason, and GCPs of the zenithal flight were only located at the bottom of the cliff, slightly increasing the RMSE of related model (0.065 m). Differently, in the case of the frontal flights performed per-pendicularly to the rock faces, GCPs were collected at differ-ent heights using a TS, obtaining a frontal model of the cliff characterized by a lower error (0.03 m).
It should be underlined that GCPs for both zenithal and frontal flights are projected in the same reference system. In the end, analysis of the results confirms the good accuracy level of both models, widely adequate for the purpose of the work.
Possible limitations in the use of RPAS system can be re-lated to the need for a pilot license and user experience on topographic survey and imagery processing. Indeed, the ac-curacy of the final 3-D model can be greatly affected by the quality of data collected (photos and GCPs), hardware and software capability and user expertise. Nevertheless, in this work the 3-D models have been obtained using a medium-low performance computer (Intel i5 CPU at 3.20 GHz with 16 GB RAM), using images obtained from a light compact digital camera that can easily be mounted on a low-cost RPAS. In addition, the use of GCPs overcame the necessity of an expensive IMU system for accurate image alignment.
This confirms the reason of the widespread of RPAS for en-gineering geological investigation, mainly due to its low cost, speed of data acquisition and high safety.
In this work, the elaboration speed in terms of time em-ployed to identify and characterize rock discontinuities has been partially decreased to guarantee consistency and qual-ity in the interpretation of these elements. In fact, although several authors have demonstrated the reliability of auto-matic and semi-autoauto-matic processing of imagery and 3-D point clouds for fracture mapping (Mah et al., 2011; Vöge et al., 2013; Assali et al., 2014; Vasuki et al., 2014), a com-plete manual approach was adopted in this analysis because in most cases the flat and regular morphology of quarry walls only allow photointerpretation of discontinuity traces. More-over, final visual inspection and validation of outputs is al-ways required, even when using codes for the semi-automatic extraction of joints (Salvini et al., 2017).
In this work, the orientation of several discontinuity planes was calculated using Leica™Cyclone 9.0 on the point cloud once its high positional accuracy level was demonstrated. This allowed for a more complete characterization of the rock mass than that which could be obtained through tra-ditional engineering geological survey, due to limited safe access to the slopes within the site. This was particularly
Figure 12. Detail of the zenithal orthophoto with indication of ap-parent offset of a major fault acting as back release surface for Block A of Fig. 9.
portant also because discontinuity characteristics can vary at different heights of the rock mass due to stress relaxation in-duced by excavation activity. In this context, the possibility to inspect the mining area from different angles in high def-inition allowed identification of critical areas to be analysed in detail for safety purposes. Moreover, the possibility to use the point cloud for obtaining geometrical characteristics of blocks represented a major advantage because it allowed the correct geometrical reconstruction of a 3-D model to be used in specific software for slope stability analysis.
Characterization of the site highlighted a potential signifi-cant risk for the future workforce due to the presence of two major blocks with potential for sliding. With conservative as-sumptions the preliminary limit equilibrium analysis showed that the key Block A, in its present shape, is potentially un-stable. This is mainly due to the fact that the basal plane dips out of the slope and daylights on the face, with a dip angle higher than the friction angle of the surface. The block is separated from the rock mass by a major fault, which can be simulated in the Swedge analysis as a tension crack. The fault can be clearly identified from the orthophoto obtained from the application of SfM method. An apparent offset has been identified on the back fault (Fig. 12). The presence of catacl-asite with variable thickness is also an indication of potential for offset on the fault surface.
In the preliminary limit equilibrium analysis, the major un-certainty is on the basal plane (Fig. 12). Despite the presence of a continuous trace line on the rock exposure, its full per-sistence in the rock mass is not clear. In general, the pres-ence of rock bridges plays an important role in stabilizing removable rock blocks. Indeed, a rock block cannot fall or
Figure 13. Details of a series of tight discontinuities above and be-low the basal plane under study.
slide from a slope until the rock bridges have failed. Rock bridge failure involves fracturing of intact rock, which can be an order of magnitude stronger than the rock mass (Ke-meny and Donovan, 2005). From the undertaken sensitivity analysis, cohesion of the basal plane was the parameter that had the most significant influence on the block’s factor of safety. This suggests that it may not be completely persistent in this case, since the block has remained stable over time. In this regard, the parametric analysis carried out increasing the cohesion values showed how a small rock bridge, corre-sponding to 1 % of the basal plane surface (5.1 m2of intact rock) is sufficient for guaranteeing the stability of the block. Cohesion induced by the supposed rock bridge led to an ac-tual stability condition that seems to not be influenced by the higher dip of the basal plane respect to the friction angle of the surface that, commonly, can causes the failure of a rock block. In this case, 5.1 m2of rock bridge corresponds theo-retically to a resisting force of 81.7 MN. The results of this study are consistent with other studies, where failure back analyses highlighted low percentage of rock bridges (0 and 5 %) at the time of failure (e.g. Frayssines and Hantz, 2006; Grøneng et al., 2009; Sturzenegger and Stead, 2012; Matasci et al., 2015; Tuckey and Stead, 2016).
The calculated rock bridge percentage seems in contra-diction with the author’s field observations and their expe-rience in similar contexts, which suggest that a higher per-centage of rock bridges may exist. Hudson and Priest (1983) identified two kinds of persistence relative to impersistent or intermittent joints that should be considered. Differently from impersistent joints, intermittent discontinuities consist of joint segments and intact rock bridges on the same plane. Mauldon (1994) claims that the formation of intermittent joints is geologically unlikely, unless a preferential direction of weakness exists within the rock mass. In this case, the cohesion of rock bridges along intermittent joints could be much lower than that of the intact rock, and consequently the percentage of rock bridges could be greater. This could
be the case of Block A, and the presence of a series of dis-continuities with similar dip direction and dip to the basal plane seems to confirm the hypothesis of a preferential plane of weakness due to the geomechanical characteristics of the marble material in that portion of the mining area (Fig. 13).
The progressive degradation of rock bridge elements with time could cause a progressive failure mechanism that has the potential to lead to a final rockfall event. This is particu-larly important in small engineered slopes such as the present one, where the rock mass may be continuously disturbed by excavation activity driving the slope to instability. Such mechanisms of progressive brittle fracturing of rock bridges are not considered in limit equilibrium approaches, where a small content of rock bridges adds significant apparent co-hesion to the failure surface (Elmo et al., 2011; Tuckey and Stead, 2016). Therefore, in case of re-opening of mining ac-tivities, an in-depth engineering geological analysis together with the installation of a monitoring system for observing the behaviour of the rock mass over time should be considered.
6 Conclusions
The case study highlights the powerful use of RPAS tech-nology for rock slope characterization and acquisition of ac-curate 3-D data for subsequent stability analysis. Specifi-cally, an Aibotix™ Aibot X6 six-rotor multicopter was em-ployed to obtain high-resolution topographic data of a blocky rock mass located within a quarry prone to discontinuity-controlled instability mechanisms. A detailed 3-D model of the area allowed accurate identification and geometrical mea-surement of the geological discontinuities that isolate signif-icant volumes of rock. The stability analysis performed with Rocscience™Swedge software showed that rock bridges can have a significant influence on stability conditions. The anal-ysis highlighted the need for further detailed analanal-ysis and in-stallation of suitable monitoring systems for future quarry operations.
These results confirm the reliability of the employed tech-nologies to provide data for preliminary evaluation of the hazard affecting the study area. The RPAS allowed acqui-sition of high-resolution topographic data in an area charac-terized by a complex morphology where ground-based tech-niques would have significant limitations (e.g. TLS, terres-trial photogrammetry). It is worth noting that in mountainous environments, the use of RPAS has to be evaluated accord-ing to the local atmospheric and topographic conditions. The high temporal and spatial variability of the atmospheric con-ditions at high altitudes, as well as the presence of vegetation or steep and irregular slopes, could endanger the flight opera-tions. This requires pilots with relevant experience and RPAS equipped with innovative systems to manage emergency con-ditions. Future analysis at this site will concentrate on the evaluation of the most useful countermeasures to reduce the risk conditions by monitoring the unstable slopes and
under-taking further stability analysis including more complex 3-D discrete fracture network evaluation to assess the effects of rock bridges and elastoplastic numerical approaches to as-sess likely instability.
Data availability. Data come from a research project between Uni-versity of Siena and USL1 of Massa and Carrara (Mining Engineer-ing Operative Unit, Department of Prevention) related to slope sta-bility analyses in marble quarries. Data are in the public domain but authors do not have permission to make them publicly accessible via the internet.
Competing interests. The authors declare that they have no conflict of interest.
Special issue statement. This article is part of the special issue “The use of remotely piloted aircraft systems (RPAS) in monitor-ing applications and management of natural hazards”. It is a result of the EGU General Assembly 2016, Vienna, Austria, 17–22 April 2016.
Acknowledgements. Part of the present study was undertaken within the framework of an agreement with USL1 of Massa and Carrara (Mining Engineering Operative Unit, Department of Prevention). The authors acknowledge Maura Pellegri and Domenico Gullì (USL1) and Vinicio Lorenzoni (Professional geologist) for their support of this research.
Edited by: Yuichi S. Hayakawa Reviewed by: two anonymous referees
References
Agisoft: Agisoft PhotoScan User Manual Professional Edition, Ver-sion 1.2.5, 97 pp., 2016.
Assali, P., Grussenmeyer, P., Villemin, T., Pollet, N., and Viguier, F.: Surveying and modeling of rock discontinuities by terrestrial laser scanning and photogrammetry: Semi-automatic approaches for linear outcrop inspection, J. Struct. Geol., 66, 102–114, 2014. Bieniawski, Z. T.: Engineering Rock Masses Classification, Wiley,
New York, 251 pp., 1989.
Carmignani, L. and Kligfield, R.: Crustal extension in the Northern Apennines: the transition from compression to extension in the Alpi Apuane core complex, Tectonics, 9, 1275–1303, 1990. Chang, C. T., Monteiro, P., Nemati, K., and Shyu, K.: Behavior
of Marble under compression, J. Mater. Civil Eng., 8, 157–170, 1996.
Chen, J., Li, K., Chang, K.-J., Sofia, G., and Tarolli, P.: Open-pit mining geomorphic feature characterisation, Int. J. Appl. Earth Obs., 42, 76–86, 2015.
Colomina, I. and Molina, P.: Unmanned Aerial Systems for togrammetry and Remote Sensing: A Review, ISPRS J. Pho-togramm., 92, 79–97, 2014.
purposes, Rock Mech. Eng. Geol., 1, 16–22, 1963.
Dumas, F.: Variante al piano di coltivazione della cava Piastrone, sita in loc. Retro Altissimo comune di Seravezza (LU), Technical report, Henraux S.p.A., Querceta, Lucca, 36 pp., 1999.
Eberhardt, E., Stead, D., and Coggan, J. S.: Numerical analysis of initiation and progressive failure in natural rock slopes-the 1991 Randa rockslide, Int. J. Rock Mech. Min. Sci., 41, 69–87, 2004. Einstein, H. H., Veneziano, D., Beacher, G. B., and O’Reilly, K. J.: The effect of discontinuity persistence on rock slope stability, Int. J. Rock Mech. Min., 20, 227–236, 1983.
Elmo, D., Clayton, C., Rogers, S., Beddoes, R., and Greer, S.: Nu-merical simulations of potential rock bridge failure within a nat-urally fractured rock mass, Proceedings of the 2011 International Symposium on Slope Stability in Mining and Civil Engineering, Vancouver, Canada, 18–21 September 2011, 13 pp., 2011. ERTAG: I Marmi Apuani, Regione Toscana, Firenze, 175 pp., 1980. Esposito, G., Mastrorocco, G., Salvini, R., Oliveti, M., and Starita, P.: Application of UAV photogrammetry for the multi-temporal estimation of surface extent and volumetric excavation in the Sa Pigada Bianca open-pit mine, Sardinia, Italy, Environ. Earth Sci., 76, 16 pp., 2017.
Firpo, G., Salvini, R., Francioni, M., and Ranjith, P. G.: Use of Dig-ital Terrestrial Photogrammetry in rocky slope stability analy-sis by Distinct Elements Numerical Methods, Int. J. Rock Mech. Min., 48, 1045–1054, 2011.
Fonstad, M. A., Dietrich, J. T., Courville, B. C., Jensen, J. L., and Carbonneau, P. E.: Topographic structure from motion: a new development in photogrammetric measurement, Earth Surf. Proc. Land., 38, 421–430, 2013.
Francioni, M., Salvini, R., Stead, D., Giovannini, R., Riccucci, S., Vanneschi, C., and Gullì, D.: An integrated remote sensing-GIS approach for the analysis of an open pit in the Carrara marble district, Italy: Slope stability assessment through kinematic and numerical methods, Comput. Geotech., 67, 46–63, 2015. Frayssines, M. and Hantz, D.: Failure mechanisms and
trigger-ing factors in calcareous cliffs of the Subalpine Ranges (French Alps), Eng. Geol., 86, 256–270, 2006.
Giglia, G. and Paiotti M.: Carta Geologica delle Alpi Apuane, M. Altissimo, Geological map, 1963.
Gonçalves, J. A. and Henriques, R.: UAV photogrammetry for to-pographic monitoring of coastal areas, ISPRS J. Photogramm., 104, 101–111, 2015.
Grøneng, G., Nilsen, B., and Sandven, R.: Shear strength estimation for Åknes sliding area in western Norway, Int. J. Rock Mech. Min., 46, 479–488, 2009.
Hoek, E.: Strength of rock and rock masses, ISRM News J., 2, 4–16, 1994.
Hoek, E., Carter, T. G., and Diederichs, M. S.: Quantification of the Geological Strength Index Chart, Proceedings of 47th US Rock Mechanics/Geomechanics Symposium, San Francisco, USA, 23–26 June, 2013.
Hudson, J. A. and Priest, S. D.: Discontinuity frequency in rock masses, Int. J. Rock Mech. Min., 20, 73–89, 1983.
Jennings, J. E. B.: A mathematical theory for the calculation of the stability of slopes in open cast mines, Proceedings of Sympo-sium on the Theoretical Background to the Planning of Open Pits Mines with Special Reference to Slope Stability, Johannesburg, South Africa, 29 August–4 September, 87–102, 1970.
standardization of laboratory and field test: suggested methods for the quantitative description of discontinuities in rock masses, Int. J. Rock Mech. Min., 15, 319–368, 1978.
Kemeny, J. and Donovan, J.: Rock mass characterization using Li-DAR and automated point cloud processing, Ground Eng., 38, 26–29, 2005.
Kovaniˇc, L. and Blišˇtan, P.: Quarry wall stability assessment using TLS method, Advanced Materials Research Vols., 1044–1045, 603–606, 2014.
Kvapil, R. and Clews, K. M.: An examination of the Prandtl mecha-nism in large-dimension slope failures, Trans. Inst. Min. Metall., Sect. A: Mining Industry, 88, A1–A5, 1979.
Lamb, A. D.: Earth observation technology applied to mining re-lated environmental issues, Min. Tech., 109, 153–156, 2000. Lorenzoni, V.: Progetto di coltivazione della cava “Piastrone”
co-mune di Seravezza, provincia di Lucca, Technical report, Co-mune di Seravezza, Lucca, 18 pp., 2012.
Mah, J., Samson, C., and McKinnon, S.: 3-D laser imaging for joint orientation analysis, Int. J. Rock Mech. Min., 48, 932–941, 2011. Markland, J. T.: A useful technique for estimating the stability of rock slopes when the rigid wedge slide type of failure is ex-pected: Imperial College Rock Mechanics Research Reprints, 19, 10 pp., 1972.
Mastrorocco, G., Salvini, R., and Vanneschi, C.: Fracture mapping in challenging environment: a 3-D virtual reality approach com-bining terrestrial LiDAR and high definition images, B. Eng. Geol. Environ., 1–17, https://doi.org/10.1007/s10064-017-1030-7, 2017.
Matasci, B., Jaboyedoff, M., Ravanel, L., and Deline, P.: Stabil-ity Assessment, Potential Collapses and Future Evolution of the West Face of the Drus (3,754 m asl, Mont Blanc Massif), in: En-gineering Geology for Society and Territory Vol. 2, Springer In-ternational Publishing, 791–795, 2015.
Mauldon, M.: Intersection probabilities of impersistence joints, Int. J. Rock Mech. Min. Sci., 31, 107–115, 1994.
McLeod, T., Samson, C., Labrie, M., Shehata, K., Mah, J., Lai, P., Wang, L., and Elder, J. H.: Using video acquired from an Un-manned Aerial Vehicle (uav) to measure fracture orientation in an open-pit mine, Geomatica, 67, 173–180, 2013.
Meccheri, M., Berretti, G., Conti, P., and Molli, G.: Interference structures at the southern closure of the M. Altissimo Syncline, central Alpi Apuane, Italy, Rend. Soc. Geol. It., 1, 123–124, 2005.
Meccheri, M., Bellagotti, E., Berretti, G., Conti, P., Dumas, F., Mancini, S., and Molli, G.: The Mt. Altissimo marbles (Apuan Alps, Tuscany): commercial types and structural setting, Ital. J. Geosci., 126, 22–35, 2007.
Miller, S. M.: Modeling Shear Strength at Low Normal Stresses for Enhanced Rock Slope Engineering, Proceedings of 39th High-way Geology Symposium, 346–356, 1988.
Park, H. J.: A new approach for persistence in probabilistic rock slope stability analysis, J. Geosci., 9, 287–293, 2005.
Passalacqua, P., Belmont, P., Staley, D., Simley, J., Arrowsmith, J. R., Bodee, C., Crosby, C., DeLongg, S., Glenn, N., Kelly, S., Lague, D., Sangireddy, H., Schaffrath, K., Tarboton, D., Wasklewicz, T., and Wheaton, J.: Analyzing high resolution to-pography for advancing the understanding of mass and energy
transfer through landscapes: A review, Earth-Sci. Rev., 148, 174–193, 2015.
Perazzelli, P., Rotonda, T., and Graziani, A.: Stability analysis of an active marble quarry by DEM modelling, in: Proceedings of the International Conference on Rock Joints & Jointed Rock Masses, Tucson, Arizona, USA, 7–8 January 2009, 8 pp., 2009. Priest, S. D.: Discontinuity analysis for rock engineering, Chapman
& Hall, 473 pp., 1993.
Remondino, F., Barazzetti, L., Nex, F., Scaioni, M., and Sarazzi, D.: UAV PHOTOGRAMMETRY FOR MAPPING AND 3-D MOD-ELING – CURRENT STATUS AND FUTURE PERSPEC-TIVES, Int. Arch. Photogramm. Remote Sens. Spatial Inf. Sci., XXXVIII-1/C22, 25–31, https://doi.org/10.5194/isprsarchives-XXXVIII-1-C22-25-2011, 2011.
Salvini R., Vanneschi C., Riccucci S., Francioni M., and Gullì D.: Application of an integrated geotechnical and topographic mon-itoring system in the Lorano marble quarry (Apuan Alps, Italy), Geomorphology, 241, 209–223, 2015.
Salvini, R., Mastrorocco, G., Seddaiu, M., Rossi, D., and Vanneschi, C.: The use of an unmanned aerial vehicle for fracture mapping within a marble quarry (Carrara, Italy): photogrammetry and dis-crete fracture network modeling, Geom. Nat. Haz. Risk, 8, 34– 52, 2017.
Shahbazi, M., Sohn, G., Théau, J., and Ménard, P.: UAV-BASED POINT CLOUD GENERATION FOR OPEN-PIT MINE MOD-ELLING, Int. Arch. Photogramm. Remote Sens. Spatial Inf. Sci., XL-1/W4, 313–320, https://doi.org/10.5194/isprsarchives-XL-1-W4-313-2015, 2015.
Siebert, S. and Teizer, J.: Mobile 3-D mapping for surveying earth-work projects using an Unmanned Aerial Vehicle (UAV) system, Automat. Constr., 41, 1–14, 2014.
Spetsakis, M. E. and Aloimonos, J.: A multi-frame approach to vi-sual motion perception, Int. J. Comput. Vision, 6, 245–255, 1991. Stead, D. and Wolter, A.: A critical review of rock slope failure mechanisms: The importance of structural geology, J. Struct. Geol., 74, 1–23, 2015.
Stead, D., Eberhardt, E., and Coggan, J. S.: Developments in the characterization of complex rock slope deformation and failure using numerical modelling techniques, Eng. Geol., 83, 217–235, 2006.
Sturzenegger, M. and Stead, D.: Close-range terrestrial digital pho-togrammetry and terrestrial laser scanning for discontinuity char-acterization on rock cuts, Eng. Geol. 106, 163–182, 2009. Sturzenegger, M. and Stead, D.: The Palliser Rockslide, Canadian
Rocky Mountains: Characterization and modeling of a stepped failure surface, Geomorphology, 138, 145–161, 2012.
Tannant, D.: Review of Photogrammetry-Based Techniques for Characterization and Hazard Assessment of Rock Faces, Interna-tional Journal of Georesources and Environment, 1, 76–87, 2015. Tong, X., Liu, X., Chen, P., Liu, S., Luan, K., Li, L., Liu, S., Liu, X., Xie, H., Jin, Y., and Hong, Z.: Integration of UAV-Based Photogrammetry and Terrestrial Laser Scanning for the Three-Dimensional Mapping and Monitoring of Open-Pit Mine Areas, Remote Sens., 7, 6635–6662, 2015.
Tuckey, Z. and Stead, D.: Improvements to field and remote sensing methods for mapping discontinuity persistence and intact rock bridges in rock slopes, Eng. Geol., 208, 136–153, 2016. Vasuki, Y., Holden, E. J., Kovesi, P., and Micklethwaite, S.:
Semi-automatic mapping of geological structures using UAV-based photogrammetric data: an image analysis approach, Comput. Geosci., 69, 22–32, 2014.
Vöge, M., Lato, M. J., and Diederichs, M. S.: Automated rock-mass discontinuity mapping from 3-dimensional surface data, Eng. Geol., 164, 155–162, 2013.
Westoby, M. J., Brasington, J., Glasser, N. F., Hambrey, M. J., and Reynolds, J. M.: “Structure from-Motion” photogrammetry: A low-cost, effective tool for geoscience applications, Geomor-phology, 179, 300–314, 2012.
Zajc, M., Pogaˇcnik, Z., and Gosar, A.: Ground penetrating radar and structural geological mapping investigation of karst and tectonic features in flyschoid rocks as geological hazard for exploitation, Int. J. Rock Mech. Min. Sci., 67, 78–87, 2014.
Zheng, D., Frost, J. D., Huang, R. Q., and Liu, F. Z.: Failure process and modes of rockfall induced by underground mining: A case study of Kaiyang Phosphorite Mine rockfalls, Eng. Geol., 197, 145–147, 2015.