DIPARTIMENTO DI ECOLOGIA E SVILUPPO ECONOMICO SOSTENIBILE
D
D
E
E
C
C
O
O
S
S
DIVERSITY ANALYSIS IN SPACE AND TIME
OF AN ANNUAL SELFING SPECIES (COMMON BEAN,
Phaseolus vulgaris) AND A PERENNIAL OUTCROSSING
SPECIES, (CARDOON, Cynara cardunculus)
CORSO DI DOTTORATO DI RICERCA
ECOLOGIA E GESTIONE DELLE RISORSE BIOLOGICHE
XXIII CICLO
s.s.d. BIO/07
Coordinatore: Dr Roberta Cimmaruta
Tutors: Prof M.A. Pagnotta, Università della Studi della Tuscia
Dr M.E. Dulloo, Bioversity International
3 Acknowlegements
I would like to thank my tutors, Prof Mario A. Pagnotta at the University of Tuscia, and Dr Ehsan Dulloo at Bioversity International for their time, wisdom, guidance and patience in assisting me over these years. I would also like to thank the PhD Coordinator at the University of Tuscia, Dr Roberta Cimmaruta, for her support and valuable advice. The work undertaken would have been far more difficult without the guidance of Dr Nestor Rey at the University of Tuscia, whose guidance and positive attitude made the hard tasks that much easier. This undertaking would have been far more demanding without the partnership created with my fellow student and friend, Elena de Luca. Much gratitude goes out to my close friends and family who have been my guardian angels through this venture. None of this would have been possible without the unfailing support and
encouragement of my husband, Ronald L. Smith. Thank you all!
Dedicated to my daughters, Shiana and Saesha, and future generations, in the hope that the world can always be a better place.
4
Contents
Acknowlegements ... 3
ABSTRACT ... 7
Arshiya Noorani: List of Publications/Posters 2008-2011 ... 9
INTRODUCTION ... 11
1.1 Agricultural Biodiversity ... 11
1.1.1 Conservation Strategies... 14
1.1.2 Diversity Assessment ... 23
1.1.3 Genetic Erosion ... 39
1.1.4 Crop Wild Relatives ... 44
1.2. The Common Bean, Phaseolus vulgaris ... 49
1.2.1 Origin and diffusion ... 49
1.2.2. Botanical characteristics ... 52
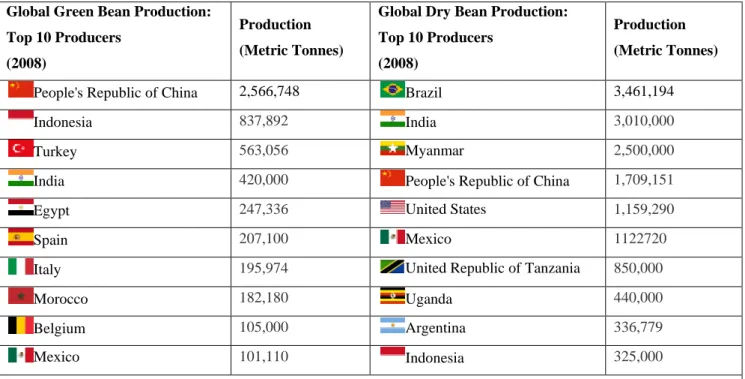
1.2.3. Economic importance ... 54
1.3 The Cultivated (Leafy) Cardoon Cynara cardunculus var Altilis... 57
1.3.1 Origin and diffusion ... 57
1.3.2 Botanical characteristics ... 60
1.3.3. Economic importance ... 61
2. MATERIALS AND METHODS ... 63
2.1 Materials... 63 2.1.1. Bean Populations... 63 2.1.2 Cardoon Populations ... 70 2.2. Methods ... 76 2.2.1. Agromorphological assessment ... 76 2.2.2. DNA extraction ... 77 2.2.3. Microsatellites (SSR) ... 77 2.2.4. ISSR markers ... 78 2.3. Genetic Analyses... 79
2.3.1. Genetic assessment of beans using microsatellites ... 79
2.3.2. Genetic assessment of cardoons using ISSR, a dominant marker ... 82
2.4. Statistical Analyses ... 83
3. BEAN DIVERSITY IN SPACE AND TIME... 86
5
3.1.1. Morphological data analyses for Lazio Populations ... 86
3.1.2. Molecular analyses of Lazio beans ... 92
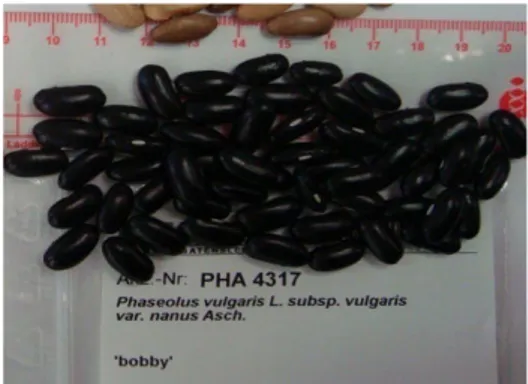
3.2. IPK Italian bean accessions from 1950, an Italian wild bean and a black variety ‘Bobby’ ... 97
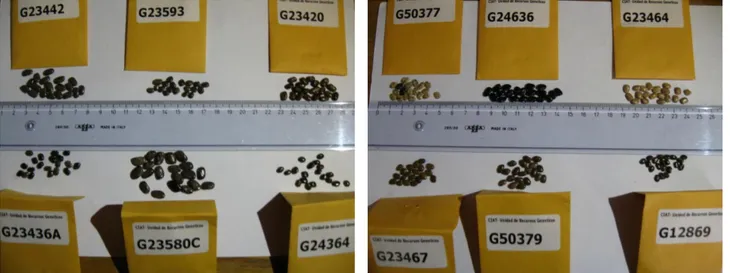
3.3. Wild bean populations from Latin America ... 100
3.4. Assessment of all bean populations in study ... 101
4. CARDOON DIVERSITY IN SPACE AND TIME ... 109
4.1. Morphological Data Analysis ... 109
4.2. MOLECULAR DATA ANALYSIS ... 120
REFERENCES... 128
ANNEX 1. Protocol Used for Phaseolus vulgaris DNA Extraction ... 150
ANNEX 2: DNA extraction manual for cardoon ... 153
ANNEX 3. Description of Lazio Bean Populations (Bruni 2008) ... 155
ANNEX 4. Protocol for assessing morphological diversity in Cardoon (Cynara cardunculus var. altilis DC) ... 229
Evaluating changes in diversity over space and time are key in utilising and conserving biological resources. The aim of this study is to assess diversity in two different species with different breeding systems: in the cardoon a cross-fertilized, perennial and in the common bean a selfing, annual species. The study was designed such that wild types and traditional landraces for each species were obtained from the CIAT, IPK and University of Tuscia seed banks.
A total of 62 bean populations, totalling 498 individuals, were assessed in this study. There were eight wild populations from Latin America, 42 populations from Lazio, Italy, one Italian wild type and 10 Italian bean populations collected in 1950. DNA was extracted from all individuals in the study and amplified using 10 microsatellite markers. Results, based on 26 polymorphic loci, showed that the Lazio population were distinct from the cultivated varieties and from the wild types. The latter two groups of beans, however, were closer to each other than to the modern beans. Levels of polymorphism were high in all populations so that even if the populations from Lazio were different from the 1950 beans, no genetic erosion was found: AMOVA showed 37% diversity among populations and 63% within populations (p<0.000). Morphological data were also analysed through PCA for the Lazio beans. None of the 26 descriptors were significant in ascribing the diversity found, although seed and pod morphometrics were the relevant among the descriptors used.
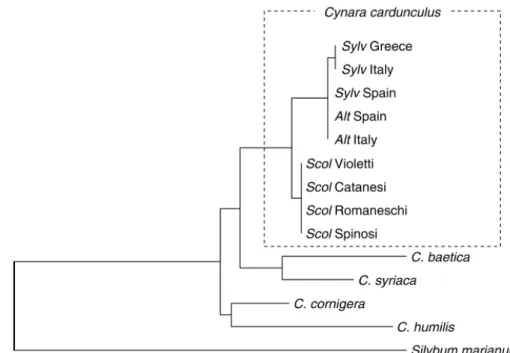
There were 27 populations of cardoon in the study, of which nine were wild cardoon populations. The cultivated cardoon populations comprised eight European (non-Italian) populations (two of which collected in 1950), one Algerian population, and nine Italian populations. Seeds were obtained, germinated and DNA was extracted and amplified with four ISSR primers. The resulting 398 loci showed that two of the wild populations clustered together, but that there was no clear pattern as to diversity related to geographical origin or year of collection. Levels of polymorphism remained high in this species too, however, such that no genetic erosion was found. The
morphological analysis involved data collection in the field and PCA performed. In contrast to the beans, diversity was defined by leaf length, plant height, total number of flowerheads and plant maturity.
8
Both species showed high levels of intra-varietal diversity, with the traditional varieties not clustering with the wild types. It is therefore possible that introgression has occurred from other sources of germplasm.
PUBLICATIONS
1. Noorani A., O. TemperiniO, A. Temperini A., M.E. Dulloo M.E. and M.A. Pagnotta. (In Prep.) Genetic and morphological assessment of traditional varieties of common bean (Phaseolus
vulgaris) from Lazio, Italy.
2. Noorani A., L. Mondini, and M. A. Pagnotta. (In Prep.) Conservation of Crop Genetic Diversity
– An Overview
3. Mondini L., A. Noorani and M. A. Pagnotta. 2009. Assessing Plant Genetic Diversity by
Molecular Tools. Diversity 1(1): 19-35
4. Pagnotta M.A., L. Mondini and A. Noorani. (In press). Plant Genetic Resources Conservation
and Plant Breeding. In Plant Breeding. (N. Huttunen and Taavi Sinisalo, eds). Nova Science Publishers.
5. Noorani A., A. Temperini, N. Rey, F. Saccardo and M.A. Pagnotta. (In press). Assessment of
Genetic Variation in Three Populations of Italian Wild Cardoon. Acta Horticulturae. (ORAL
PRESENTATION at the 7th International Symposium of Artichoke, Cardoon and their Wild Relatives, France, 2009)
6. Noorani A., P. Crinò, N. Rey, E. Dulloo, F. Saccardo and M.A. Pagnotta. (In press.) Diversity
Assessment of Seven Italian Globe Artichoke Varieties Using Agromorphological Parameters.
Acta Horticulturae.
7. Rey, N. A. Noorani, P. Crinò, E. Dulloo and M. A. Pagnotta. (In Prep). Genetic Variability in Italian globe artichoke of the Romanesco typology.
8. Pagnotta M.A. and A. Noorani. European genetic resources of Cynara spp - the CYNARES
Project. Bioversity International Newsletter for Europe. 36: 11
POSTERS
1. Noorani A., P. Crinò, N. Rey, E. Dulloo, F. Saccardo and M.A. Pagnotta. (2009) Diversity
Assessment of Seven Italian Globe Artichoke Varieties Using Agromorphological Parameters. 7th International Symposium of Artichoke, Cardoon and their Wild Relatives, Saint Pol de Léon, France, 2009
2. Rey, N. A. Noorani, P. Crinò, E. Dulloo and M. A. Pagnotta. (In press). Genetic Variability in Italian globe artichoke of the Romanesco typology. Plant Conservation for the Next Decade: A Celebration of Kew’s 250th Anniversary, 12-16 October, London, U.K.
3. PagnottaM.A., A. Noorani, N. Rey, P. Crinò, R. Tavazza, A. Alercia and F. Saccardo. (2009). Usability of Descriptors for Globe Artichoke. 19th EUCARPIA Conference – Genetic Resources Section, Slovenia, Ljubljana 26-29 May 2009.
10 4. Rey Muñoz N.A., A. Noorani, M.A. Pagnotta, P. Crinò, R. Tavazza, O. Temperini and F
.Saccardo (2008). The first four clones selected from the traditional artichoke Romanesco populations. Proceedings of the 52nd Italian Society of Agricultural Genetics Annual Congress, 14-17 September, 2008, Padova, Italy.
5. Rey N., M.A.Pagnotta, A. Noorani, P.Crinò, R.Tavazza, A. Alercia and F.Saccardo. (2009). Globe artichoke descriptors and their improvement. 53rd Annual Congress Societa’ Italiana Di Genetica Agraria,16 -19 September 2009, Torino, Italy.
6. Rey N., A. Noorani, And M.A. Pagnotta. 2009. Assessment of genetic and morphological
variation in Italian globe artichoke of the Romanesco typology. International Workshop: Plant Genetic Resources for Food and Agriculture - General Aspects and Research Opportunities. Rome, 5 - 6 November 2009.
11 INTRODUCTION
1.1 Agricultural Biodiversity
Crop genetic resources not only represent the basis of agricultural development, they are also an enormous reservoir of useful genes and gene complexes that endow plants with coping mechanisms for evolution and habitat changes (Fig.1.1). Fig.1.2 provides an overview of the plant diversity and its uses. The greater the diversity, the greater the chance that at least some of the individuals will possess an allelic variant suited to changing environments, and will produce offspring with that variant. The loss of genetic diversity can imply premature extinction due to a decrease in fitness through reduced genetic variation. Populations of endangered species are small and tend to lose genetic diversity as they have limited geneflows and are thus subject to genetic drift, founder effect and inbreeding (Jump and Peñuelas 2005). Diversity provides the basis for more productive and resilient production systems that are better able to cope with stresses such as drought or
overgrazing.
(Photo: O. Temperini)
12
The importance of crop genetic resources has been well recognized; however, the awareness of its importance and the danger of erosion and disappearance tended to be limited to scientists and farmers directly involved in plant breeding. Public opinion has tended to focus more readily on the extinction of endangered wild species, with less concern for the dramatic impact that the shrinking genetic variation in crop plants and their wild relatives may have on future agriculture. As well as providing resistance to biotic and abiotic stresses, the availability of a reserve of variation and different alleles allows the development of new products different in colour, shape, taste, etc. which is an additional factor in the use of socio-economically important species.
Fig.1.2. An overview of global plant genetic resources, diversity and uses (adapted from Maxted et al. 2008).
Unfortunately, the destruction of natural ecosystems has severely reduced the genetic variability in wild species. Exacerbating the situation is the replacement of local varieties with improved ones, thereby virtually eliminating traditional land races. As a result, most of the abundant genetic resources available even a few decades ago have been lost forever. Additionally, Brush (1995) showed that areas in marginal agronomic conditions, as those found in mountainous areas, and economically isolated areas, generally have a higher diversity. These areas are often most
13
vulnerable to climate change. Conversely, plains often have more homogenous environmental conditions, which could lead to stronger competition with commercial varieties.
Erosion of genetic resources in forest tree species is also a worrying and urgent issue. It is important to recognize that the variation in natural populations of forest species is key in devising the best strategies for their conservation and exploitation. The growth in molecular marker technologies, are particularly suitable for studying genetic variation and in assisting the breeder in forest planting.
Significant scientific and public concern for genetic resources began in the 1950s when scientists travelling on a global scale, and especially to developing countries, highlighted the cultivation of newly-acquired croplands and the spreading of modern, uniform varieties. A widespread movement from genetic resources to advanced biotechnology as possible source of variation and, to some extent, alleviated concerns of food production. The limitations of manipulations based on molecular and tissue culture techniques have been recognized during the last few years and it is becoming clear that only an integrated approach between traditional and advanced techniques will produce the best results.
In 1996, 186 nations’ Heads of State met in Rome at the World Food Summit with the aim of devising methods to eradicate hunger; a target of halving the number of undernourished people by 2016 was set, but despite only being 5 years away the target is still far from being reached. It is estimated that currently over 800 million people do not have enough to eat, 73% of which live in poverty, often in marginal environments which is where diversity is crucial to agriculture (FAO 2006). The maintenance of diversity in plant populations, then, is key to their survival (Cooper et al. 2001). This survival is of even greater importance when the plants in question are crops on which human survival depends. It is estimated that 60,000 plant species, roughly 25% of the world's total, could be lost by the year 2025 (ICARDA 1996). Loss of diversity is a major issue in crops as most food crop cultivation today is based on single variety monocultures, thus making them vulnerable to man-made and environmental disasters. Over 50,000 species of edible plants are thought to exist but only 15 species provide 90% of the world's food energy intake. Rice, wheat, and corn are the staple foods for nearly two-thirds of the world's population (Hinrichsen 1997), grown as monocultures and thus highly vulnerable to environmental changes. These widely cultivated varieties display a very small amount of intraspecific diversity, leaving them susceptible to loss of genetic diversity through
14
small population effects. Increasing and maintaining diversity, especially in species of socio-economic importance, is therefore essential to human well-being and survival.
1.1.1 Conservation Strategies
In Situ and Ex Situ Strategies of Plant Conservation
In situ conservation focuses on conserving organisms in their natural environment while ex situ
conservation entails the preservation of genetic resources in collections external to the natural environment in which the organisms are found. Table 3 gives an overview of the pros and cons of the two methods.
The conservation of plant genetic resources, and more specifically, crop genetic resources,
historically focused mainly on ex situ collections as seed collection and seed storage was the main method of plant breeders to maintain their collections. The conservation of PGR in situ and ex situ are often seen as competing conservation strategies. The CBD’s Article 9 stresses, however, that the two approaches must be complementary and applied in combination (CBD 1992). It is vital to maintain linkages between these two strategies. One of the key linkages is the use of ex situ material to improve in situ populations or to reintroduce extinct species or varieties into cultivation.
Consequently, ex situ materials also perform a role of a safety net as species and varieties may be lost in situ due to extreme events or habitat destruction. Often, however, it is the breeding system of the species which dictates the strategy for preservation. In the case of apomictic species (which form asexually produced seed) or in vegetatively propagated species, it may be possible to choose between on-farm conservation, field genebanks as well as techniques such as cryopreservation (Engels et al. 2008). Once again, the use of both methodologies would be the most successful path to maximising chances of survival.
In Situ Conservation
Conservation in situ maintains the organisms in their original habitat, or agroecological environment, the plants are still undergoing evolution in the field, hence this method of
conservation is dynamic. It tends to focus on protected areas such biospheres and nature reserves but also includes on-farm conservation which has now increased greatly in profile and importance (Brush 2000; Swaminathan 2002). This approach can target simply one species or can target the ecosystem as a whole. The latter is now preferred as the ecosystem functions can remain intact
15
while the former is used in cases where an extinct target species requires reintroduction or if there is a keystone/focal species whose presence is importance to the functioning of the ecosystem. Given below is an overview of the different forms of in situ conservation.
Genetic Reserves
These involve the establishment of protected areas, managed by conservationists with the aim of monitoring and maintaining the diversity present (Maxted et al. 2008). It is most likely that one area will not suffice to cover the diversity present and therefore a network of sites is required. A buffer zone and a transition zone for each reserve is also generally recommended (Dulloo et al. 2008).
On-Farm Conservation
The conservation of diversity within a farming system generally entails the preservation and use of agricultural varieties – landraces – which have been bred by farmers over time to allow for
adaptation to local environments. In this form of conservation, not only does the agroecosystem maintain its integrity but the traditional knowledge required for the propagation and survival of those crops and varieties is also conserved. On-farm management, however, includes the
introduction of modern cultivars in the agroecosystem, thus affecting landrace diversity originally present and is not generally included in the definition of on-farm conservation (Maxted et al. 2008).
Home Gardens
The resources conserved in home gardens are considered a form of in situ conservation as
significant amounts of diversity are often found conserved in these gardens. The produce here is for local consumption, and more specifically, for consumption by the household within which they are grown (Eyzaguirre and Linares 2004). They are valuable reserves of local fruit, vegetable,
medicinal and herb diversity.
Ex Situ Conservation
Conservation ex situ maintains the organisms in a place different from where they originated to maintain the original gene and allele frequency, hence the conservation is static. Breeders and researchers most often obtain their resources from genebanks and botanical gardens. There are approximately 1500 genebanks around the world, containing 6.5 million samples; 83% of these are held in national government genebanks (Global Crop Diversity Trust 2007). Since most of the collections have a redundancy of material which slows up its utilization, it was proposed to build up
16
core collections (Frankel and Brown 1984) of material from within existing collections, but containing the maximum of diversity and the minimum of repetitions.
The major crops (wheat, rice, potato, banana/plantain etc.) are well represented in ex situ
collections. Crop wild relatives and minor crops (such as yams, coconut and amaranth) are less well represented but these are now gaining in importance with genebanks now accepting regional
responsibility for local minor crops (Scarascia-Mugnozza and Perrino 2002). Ex situ collections are, however, also maintained in facilities other genebanks, such as botanic gardens and field genebanks (Swaminathan 2002). Engels et al. (2008) provide a comprehensive overview with a list of useful references for each of the below ex situ conservation methods. Given below is a summary of the different types of ex situ conservation.
Botanic Gardens and Arboreta
Plants of major socio-economic importance such as medicinal, ornamental, aromatic are the kind of species most often found in these facilities. The plants are most often displayed in gardens with the focus of high species diversity but on not varietal diversity. These gardens often also maintain seed banks to maximise the amount of diversity conserved (Laliberté 1997). The first botanical gardens were set up in Italy during the second half of XIV century, in Pisa (1544), Padua and Florence (1545) followed by Holland (1593), Paris (1635) and Edinburgh (1690).
Field Genebanks
Field genebanks are the principal method for conserving species that do not “breed true”, or retain the production characteristics of the parent (i.e. fruit trees, forest plants), or those of which the seeds cannot tolerate the desiccation and cooling used for storage (i.e. recalcitrant seeds) (Fowler and Hodgkin 2004). These plants are kept either in fields or in greenhouses.
Seed and Pollen storage
This is the most commonly used form of ex situ conservation with 90% of the world’s 6 million accessions stored as seed (de Vicente 2006). The seeds are dried to between 3-7% seed moisture content (5% for pollen) and stored at sub-zero temperatures. The seeds need to be assessed at regular intervals for viability (as this tends to decrease with time) and regenerated when necessary (Gómez-Campo 2006). The regeneration process should be undertaken taking into account that the
17
same diversity and allele frequency should be maintained, hence avoiding actions that select changes in the original gene frequencies.
In vitro Storage
In vitro storage involves the storing of plants in a synthetic nutrient medium in a sterile
environment. This approach is most commonly used for species with recalcitrant seeds, apomictic species and vegetatively propagated species. Endangered species are also being conserved using this method. A part of the plant (most often buds and embryos but also stems, leaves and flower buds) is maintained, often in a glass tube, with temperatures set according to the tolerance levels of the individual species. Pence et al. (2002) provide a detailed guide on in vitro collecting techniques.
Cryopreservation
Cryopreservation, very low temperature storage of seeds or embryos, is being developed as an alternative for a number of species. The germplasm is stored in liquid nitrogen (-196°C). A major disadvantage of this technique is that it is expensive as well as being specific to a particular species, sometime even variety-specific. The main advantage, however, the material may be stored,
theoretically, for an unlimited period of time.
DNA Storage
In this method, DNA is extracted and stored at -20°C in an ethanol solution. This is not a
conservation strategy per se but the information obtained is useful for monitoring genetic changes over time, assisting in the development of molecular markers and provide a greater understanding of taxonomy at the genetic level. Thus, alternative conservation measures are required to conserve the germplasm in its entirety. A detailed discussion of this subject is provided in de Vicente (2006).
Legal Frameworks for the Protection of (Plant) Biodiversity
In the 1960s genetic resources conservation started increasing in importance globally and its profile was further raised when the FAO organized two conferences in 1967 and 1972 to discuss the issue. In 1974, the International Board for Plant Genetic Resources (IBPGR) was established within FAO, which in 1992 later evolved into the International Plant Genetic Resources Institute (IPGRI), under the auspices of the Consultative Group on International Agricultural Research (CGIAR, also known as the CG), and is now known as Bioversity International.
18
During the 1970s, many countries and CG centres set up germplasm banks to collect and conserve plant genetic resources, possibly as a consequence of the ‘Green Revolution’ which so far has averted the pessimistic Malthusanian predictions. Thomas Robert Malthus (1809) noted that human population growth is geometric (exponential) while food was shown to have an arithmetic growth; the conclusion he therefore reached was that humanity was doomed to starvation. This was belied by the success of the Green Revolution, which occurred between 1960 and 1990, when there was a tremendous boom in agricultural productivity in the developing world. During these decades, in many regions of the world, especially in Asia and Latin America, the yield of the major cereal crops (rice, wheat and maize) more than doubled. India adopted IR8, a rice semi-dwarf variety developed by the International Rice Research Institute (IRRI) that produced more grains of rice per plant when grown properly with fertilizer and irrigation. These new varieties have been obtained through traditional plant breeding programmes (Swaminathan 2002).
Plant genetic resources developed by farmers over centuries were freely available and under international law, were considered as a “common heritage of mankind to be preserved and freely available for use, for the benefit of present and future generations” (FAO 1983 regarding the International Undertaking on Plant Genetic Resources for Food and Agriculture (IU); Le Buanec 2005). This free exchange ended during the last decade of the 20th century with the development of biotechnology and intellectual property rights. The IU in 1991 recognized the sovereignty of states of their own genetic resources.
With the International Congress of Rio de Janeiro and the signing of the Convention on
Biodiversity in 1992, attention shifted from genetic resources to overall biodiversity conservation.
The Convention on Biological Diversity (CBD) is a framework convention, with a broad mandate in relation to three goals:
• conservation of biodiversity
• sustainable use of the components of biodiversity
• the fair and equitable sharing of benefits arising from the utilization of such components
Article 2 of the CBD states that biological diversity is “…the variability among living organisms from all sources including, inter alia, terrestrial, marine and other aquatic ecosystems and the ecological complexes of which they are part; this includes diversity within species, between species and of ecosystems”. The CBD includes the whole range of methodologies of conservation from ex
19
sovereignty of the geo-political states over the resources within their national borders. It was recognized, however, that this impeded agricultural development, the global common heritage and the international interdependency of countries for food security (Laliberté 1997) as concerns over patenting and biopiracy decreased the access of PGR across borders.
The latest Conference of Parties of the CBD (COP 10) of the CBD was held in Nagoya, Japan, in October 2010 (http://www.cbd.int/nagoya/outcomes). It was of special importance as it was held during the UN-designated International Year of Biodiversity. The outcomes include a revised Strategic Plan, a mission and 20 targets, organized under five strategic goals which address the three objectives of the CBD. Of particular relevance to plant diversity in the revised Strategic Plan, and more specifically to crop diversity and the work undertaken here, is Strategic Goal C, Target 13:
“By 2020, the genetic diversity of cultivated plants and farmed and domesticated animals and of wild relatives, including other socio-economically as well as culturally valuable species, is maintained, and strategies have been developed and implemented for minimizing genetic erosion and safeguarding their genetic diversity.”
It was due to this recognition that the International Treaty for Plant Genetic Resources (ITPGR; referred to as the Treaty henceforth) was signed in Rome in 2001 and ratified by 180 nations and entered into vigour on 29th June 2004. The objectives of the Treaty are “the conservation and sustainable use of plant genetic resources for food and agriculture and the fair and equitable sharing of the benefits arising out of their use, in harmony with the Convention on Biological Diversity, for sustainable agriculture and food security” (Article 1.1). In particular, Article 5 addresses the
conservation, exploration, collection, characterization, evaluation and documentation of PGRFA, (the full text of the Treaty is available at http://www.fao.org/AG/cgrfa/itpgr.htm#text) and calls on contracting parties to:
• survey and inventory PGRFA;
• promote the collection of PGRFA that are under threat or of potential use, along with relevant associated information;
• promote or support farmers’ and local communities’ efforts to manage and conserve on-farm their PGRFA;
20 in protected areas;
• cooperate to promote the development of an efficient and sustainable system of ex situ conservation; • monitor the maintenance of the viability, degree of variation and genetic integrity of collections of
PGRFA and take steps to minimize or eliminate threats to PGRFA.
The Treaty also provides a platform for facilitated global exchange of plant genetic resources, the Multilateral System (MLS) of Access and Benefit Sharing (ABS).The Multilateral System applies to all PGRFA and is implemented under a Standard Material Transfer Agreement (SMTA), which was agreed in 2006. The MLS aims to conserve and use PGRFA and the fair and equitable sharing of benefits arising out of their use include all plant genetic resources for food and agriculture listed in Annex I that are under the management and control of the Contracting Parties and in the public domain and in particular “The Contracting Parties agree that benefits arising from the use of plant genetic resources for food and agriculture that are shared under the Multilateral System should flow primarily, directly and indirectly, to farmers in all countries, especially in developing countries, and countries with economies in transition, who conserve and sustainable utilize plant genetic resources for food and agriculture” (Lewis-Lettington et al. 2006).
At present, Annex 1 of the Treaty comprises only 35 crops and a few forage species (Table 1), which were selected based on food security and interdependence issues and cover roughly 80% of human calorific intake from plants (on a global scale) (GFAR/IPGRI 2003).
Table 1. List of crops under the Annex 1 of the Multilateral System.
FOOD CROPS FORAGES
Crop Genus Observations Breadfruit Artocarpus Asparagus Asparagus Oat Avena
Beet Beta
Brassica complex Brassica. Genera included are: Brassica, Armoracia, Barbarea, Camelina, Crambe, Diplotaxis, Eruca, Isatis, Lepidium, Raphanobrassica, Raphanus, Rorippa, and Sinapis. This comprises oilseed and vegetable crops such as cabbage, rapeseed, mustard, cress, rocket, radish, and turnip. The species Lepidium
LEGUME FORAGES
Astragalus chinensis, cicer, arenarius Canavalia ensiformis
Coronilla varia
Hedysarum coronarium
Lathyrus cicera, ciliolatus, hirsutus, ochrus, odoratus, sativus
Lespedeza cuneata, striata, stipulacea Lotus corniculatus, subbiflorus, uliginosus Lupinus albus, angustifolius, luteus
21
FOOD CROPS FORAGES
meyenii (maca) is excluded. Pigeon Pea Cajanus Chickpea Cicer
Citrus Citrus Genera Poncirus and Fortunella are included as root stock.
Coconut Cocos
Major aroids Colocasia, Xanthosoma; includes taro, cocoyam, dasheen and tannia.
Carrot Daucus Yams Dioscorea Finger Millet Eleusine Strawberry Fragaria Sunflower Helianthus Barley Hordeum Sweet Potato Ipomoea Grass pea Lathyrus Lentil Lens Apple Malus
Cassava Manihot Manihot esculenta only. Banana / Plantain Musa; except Musa textilis. Rice Oryza
Pearl Millet Pennisetum
Beans Phaseolus; except Phaseolus polyanthus. Pea Pisum
Rye Secale
Potato Solanum Section tuberosa included, except Solanum phureja.
Eggplant Solanum; section melongena included. Sorghum Sorghum
Triticale Triticosecale
Triticum; includes Agropyron, Elymus, Secale. Faba Bean / Vetch Vicia
Cowpea Vigna
Maize Zea; excludes Zea perennis, Zea diploperennis, and Zea luxurians.
truncatula
Melilotus albus, officinalis Onobrychis viciifolia Ornithopus sativus
Prosopis affinis, alba, chilensis, nigra, pallida Pueraria phaseoloides
Trifolium alexandrinum, alpestre, ambiguum, angustifolium, arvense, agrocicerum,
hybridum, incarnatum, pratense, repens, resupinatum, rueppellianum,
semipilosum, subterraneum, vesiculosum GRASS FORAGES
Andropogon gayanus
Agropyron cristatum, desertorum Agrostis stolonifera, tenuis Alopecurus pratensis Arrhenatherum elatius Dactylis glomerata
Festuca arundinacea, gigantea, heterophylla, ovina, pratensis, rubra
Lolium hybridum, multiflorum, perenne, rigidum, temulentum
Phalaris aquatica, arundinacea Phleum pratense
Poa alpina, annua, pratensis Tripsacum laxum
OTHER FORAGES
Atriplex halimus, nummularia Salsola vermiculata
22
The Millennium Development Goals (MDGs) are time-bound, quantifiable targets set by world leaders in 2000 at the Millennium Summit, with the aim of reducing poverty at a global scale.
(Source: http://www.unmillenniumproject.org/goals/index.htm)
Fig.1.3. The Millennium Development Goals.
Goal 7 is the most directly relevant to the assessment and sustainable management and use of biological (including crop) diversity. The initial target set in 2000 was to achieve a significant reduction in the rate of loss by 2010. This target has not been achieved, despite increases in
investment in conservation planning and action (UN 2010). High rates of consumption, habitat loss, invasive species, pollution and climate change currently threaten the poorest peoples, the most vulnerable as well as the most directly dependent on diverse plants and animals for their survival.
The European Environment Agency developed the Driver-Pressure-State-Impact-Response
(DPSIR) framework (EEA 1998), which the CBD also adopted. The abbreviation DPSIR stands for a conceptual framework for the description of the environmental problems and of their relationships with the socio-economic domain, and relevant to policy-makers. This framework is frequently used in decision making, especially in understanding pressures on the conservation of biodiversity.
23 Fig.1.4. The DPSIR framework
Fig.1.4 shows the relationships between the framework components: social and economic
developments (Driving Forces, D) exert Pressures (P) on the environment and, as a consequence, the State (S) of the environment changes. This leads to Impacts (I) on ecosystems, human health, and society, which may elicit a societal Response (R) that feeds back on Driving Forces, on State or on Impacts via various mitigation, adaptation or curative actions (Gabrielsen and Bosch 2003; Smeets and Weterings 1999). Thus, the DPSIR is described as a “causal framework for describing the interactions between society and the environment” (EEA 2006; Delbaere 2002).
1.1.2 Diversity Assessment
Adequate knowledge of existing genetic diversity, where it exists and how to best utilize it, is therefore vital for continued successful management of agricultural resources (see Table 1). Information regarding the threat and rate of genetic erosion is paramount, yet there is very little work in quantifying the magnitude of any trends. Standard methods for the collection and analysis of data over time for crops, forage and wild relatives have yet to be developed, although there is an increased awareness of the need. What work exists using time series data tends to focus only on specific crops based on small subsets stored in gene banks and using molecular techniques.
24 Table 1.2. Measures of genetic diversity
What diversity is measured and the methods employed Diversity in single genes
Biochemical analysis Mendellian analysis
Polygenic diversity
Multivariate analysis of morphological variation in traits whose expression is determined by more than one gene
Latent diversity of genome
Genealogical analysis
Analysis of cytoplasm donors
Molecular (DNA) analysis and probes
Pedigree complexity
Genealogical characteristics
Performance-based complexity
Analysis of genotypic variance and genotype by environment interactions Analysis of yield variance at farm, district, national, or regional level
Ex situ diversity
Analysis of numbers of accessions within and among species Morphological analysis of accessions
Spatial diversity
Number of cultivars by percentage of area Percentage distribution of area by cultivar
Temporal diversity
Average age of cultivars
Rate of cultivar replacement
25
Genetic diversity may be assessed at scales other than at the genetic level per se (see Table 2.). At the molecular level diversity within and between populations is typically measured using various laboratory based techniques such as allozyme or DNA analysis, directly measuring levels of
variation. A close correlate to genetic variation is that of morphological variation where appropriate physical traits can be used as a measure of genetic variation. At a species level various species diversity indices, taxonomic counts, population estimates, etc. can be used as an indicator of levels of diversity. Even at the landscape level, there are attributes that can be indicative of genetic diversity and erosion. For example field sizes, both in the present day and in historic reference can be related to numbers of different crops grown in an area in the past and compared to the current situation. This paper gives an overview of the main methodologies at each level and their potential for use in monitoring genetic erosion.
26 Table 1.3. Overview of levels at which genetic diversity may be assessed.
Measures/Assessments of Diversity and the Tools/Methods employed Genetic Level
Diversity within and between populations
Allozyme analysis DNA analysis
Assessment of morphological variation
Species Level Impacts
Species diversity indices
Functional diversity
Functional group analyses
Changes in number of species/varieties
Taxonomic counts Abundance indices Population estimates
Landscape Level
Changes in landscape diversity
Indices of landscape patterns Historic references
Remote sensing/GIS
Changes in habitat distribution
Indices of landscape patterns Historic references
Remote sensing/GIS
Changes in landscape elements (e.g. field sizes, usage)
Indices of landscape patterns Historic references
27
Genetic Diversity
There are several different ways of measuring diversity, and especially the diversity or ‘distance’ between two or more populations (Mohammadi and Prasanna 2003). In general the various methods will give the same rank order of diversity, but they may give very different numerical values.
Given any two measurements of the same trait, subtracting one from the other gives a raw
difference or interval. These intervals are themselves quantities in the same dimension as the trait itself, and can be added, multiplied, averaged, etc, to obtain such measures of diversity as the standard deviation, the Gini coefficient, the inter quartile interval, or the mean absolute-value deviation. The Unweighted Pair Group Method (UPGM) uses arithmetic averages to generate dendrograms that illustrate the genetic distances between different varieties (e.g. Garcia-Mas et al. 2000)
Genetic assessment is more complex given a non-quantitative trait, such as genetic material. Given any two stretches of DNA, one can identify and list the differences between them. It is in the weighting of the differences that the difficulties arise. For example, whether non-coding regions or synonymous codons should be included can be a major issue. This depends in part on the
underlying motive for measuring diversity. Measures of diversity, such as Wright’s FST, were devised mainly to reconstruct phylogenies and population history and all differences are therefore treated as equal (Nei 1973; Charlesworth 1998).
Genetic diversity may be spatially structured at different scales (geographic, population, subpopulation, etc.), due to environmental influence, life history, and demographic traits of the species (Loveless and Hamrick 1984; Slatkin 1985; Oostermeijer et al. 2003). Consequently, spatial genetic structure provides a valuable tool for inferring causal factors and underlying operating evolutionary forces such as selection, gene flow, and drift (Nevo et al. 1982; Nevo et al. 1986; Barbujani 1987; Epperson 1990; Wilson 2004). Levin (1974), Loveless and Hamrick (1984), Wade and McCauley (1988), Oostermeijer et al. (1994) and Grassi et al. (2004) have highlighted the influence of environmental factors (including human activities and various interactions) and life history traits of plant species on population viability and genetic variability.
An increasing number of studies have also integrated data from ecology, population biology, genetics, and reproductive biology in order to formulate reliable conservation and management
28
strategies of populations (Schaal and Levin 1976; Guerrant 1992; Widén 1993; Alvarez-Buylla et al. 1996; Oostermeijer et al. 2003). In these investigations, spatial analysis methods are of a special interest (Sokal and Oden 1978a; Sokal and Oden 1978b; Legendre and Fortin 1989; Escudero et al. 2003). Indeed, this technique may be helpful, for example, for the improvement of sampling strategies in collecting seeds for ex situ conservation, the selection of populations that should be protected in situ, the determination of the area size necessary for the conservation of a particular population, the selection of a specific site for the establishment of a corridor population, etc.
Molecular markers are divided into (see Fig.1.5 for an illustration of the types of methods; see Table 1.4 for an overview of the methods):
Non-Polymerase Chain Reaction (PCR) based techniques
These include Restriction length Polymorphisms (RFLPs) and minisatellites analysis (also known as Variable Number of Tandem Repeats (VNTR) analysis).
PCR based techniques
These include DNA sequencing and Sequence-Tagged Sites (STS). The latter method has
undergone technological development and has spawned a variety of methods; the most well known are microsatellite analysis (also known as Simple Sequence Repeats (SSR)), Random Amplified Polymorphic DNA (RAPD) analysis and Amplified Fragment Length Polymorphism (AFLP).
Non-PCR based techniques
Restriction fragment length polymorphism (RFLP) analysis was the first technology developed
which enabled the detection of polymorphisms at the sequence level. This approach involves: (i) digesting DNA with restriction enzymes; (ii) separating the resultant DNA fragments by gel electrophoresis; (iii) blotting the fragments to a filter, and; hybridizing probes to the separated fragments. A probe is a short sequence of oligonucleotides that share homology and are thus able to hybridize, with a corresponding sequence or sequences in the genomic DNA. RFLP analysis is used extensively in the construction of genetic maps and has been successfully applied to genetic
diversity assessments, particularly in cultivated plants (e.g. Castagna et al. 1994; Deu et al. 1994; Jack et al. 1995) but also in populations and wild accessions (e.g. Besse et al. 1994, Laurent et al. 1994, Bark and Harvey 1995).
Interspersed among the genomes of higher organisms are highly variable regions that are comprised of repeats of short simple sequences. These are known as "microsatellites", where the basic repeat
29
unit is around two to eight base pairs in length and "minisatellites" for longer repeat units of 16 to 100 base pairs. Because of the very high levels of polymorphisms detected, minisatellites are
recognized as powerful tools, particularly for fingerprinting and cultivar identification in plants (e.g. Beyermann et al. 1992; Vosman et al. 1992). They have also been used for studying within and between population variation, for ecological studies (e.g. Alberte et al. 1994; Wolff et al. 1994) and for estimating genetic distances (e.g. Lynch 1990; Antonius and Nyborn 1994).
The success of multilocus fingerprinting is dependent on the probe/enzyme combination used, which has to be tested out each time a new species is studied. However, due to the complexity of the patterns obtained, in combination with the presence of an infinite number of alleles at each locus, means that alternative statistical procedures are required for the use of minisatellite data in classical population genetic models. This makes the accuracy of analyzing relationships using minisatellite data very problematic (Lynch 1990; Scribner et al. 1994). The problem can be reduced by selecting single locus minisatellites (or VNTRs) but this increases the pre-screening and
selection process considerably. Taking all aspects of non-PCR based screening approaches into consideration, it is difficult to envisage that this would be the preferred choice today, given that alternative strategies are now available.
PCR based Techniques
The development of Polymerase Chain Reaction (PCR) sequencing allowed the amplification of any genomic region based on annealing a primer to a particular genomic site. Studying the distances between microsatellite loci, degrees of relatedness between organisms can be accurately measured, and there are various resources such as MoDAD (Measurement of Domestic Animal Diversity) which provides lists of such loci in various farm animals and recommendations of how to go about sampling individuals for genetic diversity studies (for examples of PCR based techniques see: Gonzalez et al. 2005, Fu et al. 2004, Budak et al. 2003, Guzman et al. 2003, Vergara and Bughara 2003, Negash et al. 2002, Potokina et al. 2002, Levi et al. 2001, Mengistu et al. 2000). The training required, laboratory work and the expense involved, may make this technique largely untenable in most field circumstances, although the results obtained from any such work carried out are
invaluable for use within the analysis of data obtained by other methods such as species counts. A further result of the relative expense and difficulty involved is that it is the more commercially important varieties that are most studied and well known, underutilized and rare varieties less so.
30
Restriction-site analysis of mitochondrial DNA has been used, most recently leading to
developments towards creating a ‘genetic barcode’ which can uniquely identify a species and how genetically distant it may be from its relatives. The barcode method holds great promise, but as mitochondria are organelles of animal cells is for now limited in its application to crops.
In a study by Bekessy et al. (2002), neutral DNA markers (RAPDs) and quantitative genetic
techniques were used to characterize genetic heterogeneity within and among populations. Both the level and pattern of genetic variation estimated using the different techniques were essentially uncorrelated. An important discrepancy was found with the neutral markers failing to detect an important quantitative genetic divergence across the Andean Range relating to drought tolerance. This study clearly demonstrates the potential problems associated with making recommendations for conserving the genetic resource of threatened species based solely on neutral marker studies.
31
PCR Polymerase Chain Reaction DGGE Denaturing Gel Gradient Electrophoresis
MAAP Multiple Arbitrary Amplicon Profiling RFLP Restriction Fragment Length Polymorphism DAF DNA Amplification Fingerprinting AFLP Amplified Fragment Length Polymorphism
RAPD Random Amplified Polymorphic DNA AP-PCR Arbitrary Primed PCR
SSCP Single Strand Conformational Polymorphism TGGE Thermal Gel Gradient Electrophoresis Fig.1.5. Diagram of the isozymes and molecular markers commonly used
MOLECULAR MARKERS
NON-PCR PCR
RFLPs Minisatellites
Arbitrary Targeted
MAAP
AFLP DAF RAPD AP-PCR
SSCP
32 Table 1.4. Description of the common molecular markers
Basic Description Uses Advantages Disadvantages
Restriction Fragment Length Polymorphisms (RFLP) RFLPs are bands corresponding to
DNA fragments (2-10kb), the result of digestion of genomic DNA with restriction enzymes. These are detected by agarose gel electrophoresis
Phylogenetic studies conducted at the intraspecific level and for closely related species
Widely used in mapping studies due to high abundance of restriction enzymes Studies in hybridization and introgression
Highly reproducible between laboratories and the diversity profiles generated can be reliably transferred RFLPs are codominant markers, enabling heterozygotes to be distinguished from homozygotes Sequence-specific information is not required and, provided suitable probes are available, the approach can be applied immediately for diversity screening in any system
A good supply of probes is needed that can reliably detect variation at the below species level
RFLPs are time-consuming and they are not amenable to automation without considerable capital investment RFLP analysis requires relatively large quantities of good quality DNA (e.g. 10µg per digestion)
Insufficient polymorphisms are detectable at the below species level by RFLP analysis
Minisatellites (also known as Variable Number of Tandem Repeats (VNTR)) Minisatellites are repeated sequences of
around 10-50bp. They can be multilocus or single locus. Relatedness can be estimated from percentage band-sharing
Studies involving identification and parentage
Identification of varieties and cultivars
High level of polymorphism High level of reproducibility
Random distribution of minisatellites across genome
Similar sized fragments may not be homologous
Hypervariability reduces value in taxonomic studies
Random Amplified Polymorphic DNA (RAPDs) RAPDs are random DNA fragments, amplified through PCR using arbitrary oligonucleotides primers. It is scored using the presence or absence of bands. Arbitrarily Primed PCR (AP-PCR) and DNA Amplification Fingerprinting are variants of this technique; they are collectively known as Multiple Arbitrary Amplicon Profiling (MAAP)
Studies at the individual level to related species
Gene mapping studies to fill gaps not covered by other markers
Quick and easy to assay
Low quantities of DNA required Random primers are available commercially
High genomic abundance and randomly distributed through the genome
Low reproducibility, making comparisons between researchers problematic
Purified, high molecular weight of DNA required – risk of contamination high RAPDs are not locus specific so band profiles cannot be interpreted in term of loci/alleles
33 for techniques using single arbitrary
primers.
Microsatellites (also known as Simple Sequence Repeats (SSR)) Microsatellites are repeated sequences
of around 1-6bp repeats, shorter than minisatellites. Microsatellites are amplified the by PCR through identifying flanking regions or by screening microsatellite sequence motifs and designing adjacent primers
Due to high levels of polymorphism shown by microsatellites, they are extremely useful in population genetics studies and gene mapping studies.
High genomic abundance
Low quantities and quality of DNA can be used
Multiple microsatellites (non-overlapping size ranges) can be amplified and scored during PCR and gel electrophoresis, decreasing costs Use of automatic sequencing allows for greater efficiency in time management
High development costs of primers No amplification of the intended PCR may occur (occurrence of null alleles), leading to errors in screening
“Stutter bands” may occur due to DNA slippage during PCR amplification, complicating the interpretation of band profiles
High mutation rates of microsatellite loci make them unsuitable for higher taxonomic studies.
Inter Simple Sequence Repeats (ISSR) ISSR analysis is a multilocus technique, consisting of DNA fragments made up of 100-3000bp, located between adjacent, oppositely-oriented microsatellite regions. Microsatellite core sequences are used as primers and amplified by PCR
ISSR analysis is used in gene mapping studies as well as studies of genetic identity, parentage, clone and strain identification, and taxonomic studies of closely related species.
No sequence data are necessary Low quantities of DNA are required
Problems with reproducibility
Possible non-homology of similar sized fragments
Amplified Fragment Length Polymorphism (AFLP)
(also known as Selective Fragment Length Amplification (SFLA) or Selective Restriction Fragment Amplification (SRFA)) AFLPs are DNA fragments digested by
restriction enzymes and then amplified by PCR. The AFLP banding profiles consist of variations in the restriction sites or in the intervening regions
AFLP analysis is used in gene mapping studies as well as studies of genetic identity, parentage, clone and strain identification, and taxonomic studies of closely related species.
High genomic abundance and reproducibility
Generation of many informative bands per reaction
No sequence data for primer construction is required
Purified, high molecular weight of DNA is required
Possible non-homology of co-migrating fragments belonging to different loci Subjectively determined criteria are needed for acceptance of bands in the analysis
35
For the purposes of this study the following two types of markers were used:
Microsatellites (simple sequence repeats, SSRs) are short sequences of nucleotides (typically 1 to
5 bp, and no more than 6 bases long) which are tandemly repeated. Microsatellites alleles are characterized by different numbers of repeats, are abundant (they can occur every 30 kb region of the higher plant genomes) and exhibit high levels of polymorphism (see Brown et al. 1996 for a review). The majority of microsatellites occur in gene introns or other non-coding regions of the genome; thus variation in the number of repeats has no consequence on gene function, hence these markers are known as “selectively neutral”.
As a marker, the specific number of repeats in a given microsatellite is not important, but rather the difference in the number of repeats between alleles. The degree of polymorphism in microsatellites is proportional to the underlying rate of mutation. The variation in number of repeats affects the overall length of the microsatellite (Ellegren 2004).
In the past, SSRs have been expensive to develop and thus often limited to applications to the major commercial crops (Scott et al. 2000). The first report (Condit and Hubbell 1991) on the isolation and cloning of plant microsatellites was for tropical tree species
The use of microsatellites involves the isolation of microsatellite-containing DNA clones from enriched genomic DNA libraries, synthesizing primer sets to amplify the microsatellite-containing region, and mapping SSR loci that are polymorphic (Holton 2001). These single locus markers are characterized by their very useful in germplasm characterization and hypervariability, abundance, reproducibility, Mendelian mode of inheritance, and codominant nature (Scott et al. 2000).
Inter simple sequence repeat (ISSR) markers are generated from single primer polymerase chain
reaction (PCR) amplifications in which the primers are based on dinucleotide or trinucleotide repeat motifs. The number of dinucleotide or trinucleotide repeats varies but is generally sufficiently long to make a primer sequence of at least 14 nucleotides. The microsatellite primer sequence may be anchored with one or two nucleotides on either the 5’ or the 3’ end of the oligonucleotide. An anchoring sequence on the 3’ end of the primer will eliminate the detection of fragment length differences resulting from simple sequence repeat variation, but this would be detectable only with the finest sieving gels and is not an issue for standard agarose gel techniques.
36
ISSR markers were introduced in 1994 (Gupta et al. 1994; Zietkiewicz et al. 1994) for studies of cultivated plants but have been used for studies of hybridization and hybrid speciation (Archibald et al. 2004; Wolfe et al. 1998a,b), population and conservation genetics (Culley and Wolfe 2001; Esselman et al. 1999), and systematic investigations in natural populations (Crawford et al. 2001; Mort et al. 2003; Wolfe and Randle, 2001). ISSRs are also being used in population studies of fungi (Kerrigan et al. 2003; Sawyer et al. 2003) and animals (Chatterjee and Mohandas 2003; Haig et al. 2003; Nagy et al. 2002). The hypervariable nature of ISSRs combined with minimal equipment requirements and ease of use has made them extremely useful and cost-effective molecular markers for many ecological and systematic investigations (Wolfe et al. 1998b; Yang et al. 1996).
A number of primers work on a wide range of angiosperm groups, including Acanthaceae, Asteraceae (Mort et al. 2003), Ericaceae, Lactoridaceae (Crawford et al. 2001), Orchidaceae, Orobanchaceae (Wolfe and Randle 2001), Poaceae (Esselman et al. 1999), Scrophulariaceae (Archibald et al. 2004; Wolfe et al. 1998a,b), and Violaceae (Culley and Wolfe 2001).
Studies of genetic diversity (e.g. population and conservation biology) require a quantitative approach in which the goal is to obtain as many ISSR bands as possible in as many individuals and populations as possible. A typical ISSR study will include 3–10 primers and several hundred individuals. Both qualitative and quantitative approaches require the assignment of ISSR bands to genetic loci. In practice, each ISSR band visualized on the gel is assigned as a locus identified by its molecular weight. After all molecular weights have been calculated and loci assigned, the data are converted to a matrix of 1s and 0s where 1 = band present and 0 = band absent for each locus individual combination.
Several studies using the ISSR technique have been described to properly assess genetic diversity in crops such as lentil (Sonnante and Pignone 2007a), mulberry (Kar et al. 2008), Chondrus crispus (Wang et al. 2008), Eruca vesicaria (Egea-Gilabert et al. 2009), and broccoli (Lu et al. 2009).
ISSR studies (Lanteri et al. 2004b; Crinò et al. 2008; Lo Bianco et al. 2010) have been performed in globe artichoke and cardoon (Sonnante et al. 2004; Raccuia et al. 2004; Itoiz et al. 2004; Portis et al. 2005a,b; Acquadro et al. 2006). Knowledge of genetic variation between different cultivars and within cultivars would provide great scope for crop improvement through judicious selection and
37
breeding to develop a desired genotype. Plant breeders can then use the knowledge of genetic relationships among cultivars as a parental line selection tool.
Analysis of Genetic Data
There are several different ways of measuring diversity, and especially the diversity or ‘distance’ between two or more populations (Mohammadi and Prasanna 2003). In general the various methods will give the same rank order of diversity, but they may give very different numerical values.
Given any two measurements of the same trait, subtracting one from the other gives a raw
difference or interval. These intervals are themselves quantities in the same dimension as the trait itself, and can be added, multiplied, averaged, etc, to obtain such measures of diversity as the standard deviation, the Gini coefficient, the inter quartile interval, or the mean absolute-value deviation. The Unweighted Pair Group Method (UPGM) uses arithmetic averages to generate dendrograms that illustrate the genetic distances between different varieties (e.g. Garcia-Mas et al. 2000)
Genetic assessment is more complex given a non-quantitative trait, such as genetic material. Given any two stretches of DNA, one can identify and list the differences between them. It is in the weighting of the differences that the difficulties arise. For example, whether non-coding regions or synonymous codons should be included can be a major issue. This depends in part on the
underlying motive for measuring diversity. Measures of diversity, such as Wright’s FST, were devised mainly to reconstruct phylogenies and population history and all differences are therefore treated as equal (Nei 1973; Charlesworth 1998).
Statistical analyses are also used to identify similar accessions and cultivars and assess genetic and phenotypic relatedness; one such method, cluster analysis, is used to perform a classification on a large collection of individuals (Anderberg 1973). Multiple characters for each individual are used to group accessions into cluster classes. Individuals within a given cluster class are similar, while individuals from different classes are not. Similarity measurements among clusters were also determined so that relationships between groups can be established.
Differences at the intraspecific level are seen in the frequency (proportion) of different alleles than in their simple presence or absence. Most measures of genetic diversity at the intraspecific (and
38
therefore varietal) level, are based on some index of heterozygosity: the probability that two genes at a given locus, selected at random from the relevant population(s), will be different (Gitzendanner and Soltis 2000).
With sufficient data on the frequency of different alleles, it is possible to calculate the probability that two genes at a given locus, selected at random from the relevant population or populations, will be either identical (homozygous) or different (heterozygous). The result provides an average
expected number of genetic differences between individuals. Diversity is said to be higher, other things being equal, when there are more alleles in the system, and when their frequencies are evenly spread rather than concentrated in one or a few alleles. Conversely, diversity is said to be low when most of the frequency is concentrated in one or a few alleles.
A simple equation that can be used to discover the probable genotype frequencies in a population, and to track their changes from one generation to another, is the Hardy-Weinberg equilibrium equation. In this equation (p² + 2pq + q² = 1), p is defined as the frequency of the dominant allele and q as the frequency of the recessive allele for a trait controlled by a pair of alleles (A and a). In other words, p equals all of the alleles in individuals who are homozygous dominant (AA) and half of the alleles in people who are heterozygous (Aa) for this trait in a population. The
Hardy-Weinberg law is an essential theory in investigating genetic varieties in a population, and
interpreted as following: the gene frequencies in a large population remain constant from generation to generation, if mating is at random and there is no selection, migration or mutation. If two alleles A and a are segregated at a locus, and each has a frequency of p and q respectively, then the frequencies of the genotypes AA, Aa and aa are P2 2pq and q2 respectively (Groombridge 1992; Mallet 1996). By comparing genotype frequencies from the next generation with those of the current generation in a population, one can also learn whether or not evolution has occurred and in what direction and rate for the selected trait. However, the Hardy-Weinberg equation cannot determine which of the various possible causes of evolution were responsible for the changes in gene pool frequencies.
The effective population size (Ne) based on the frequency of marker alleles measured over time is a
well known method for estimating the rate of change due to genetic drift, which is especially salient in small populations (see Wang and Whitlock 2002, for a current overview) .
39
Once genetic material has been classified into a number of variant forms or ’alleles’ (at whatever level), the level of diversity within a population can then be measured by the number of different alleles within that population, while the diversity between two populations can be measured by the number (and/or proportion) of alleles found in one population and not the other. This approach is valid at the inter specific level but at the intraspecific level, most alleles are common to most populations (except perhaps for mitochondrial or Y chromosome haplotypes).
1.1.3 Genetic Erosion
Genetic erosion generally refers to the loss of genetic diversity within a species, and ranges from the loss of an entire species to the gradual loss of alleles/allele combinations within a species. Once this intraspecific diversity is decreased, the potential for extinction is greater due the concurrent loss of elasticity in adaptability. Even if restoration efforts are carried out, there is no guarantee that the original levels of diversity will be restored, leading to either inbreeding depression or outbreeding depression (Williams and Davis 1996; Frankham et al. 2005).
Fig.1.6. The extinction vortex, with the arrows indicating positive feedback mechanisms, leading to subsequent decreases in genetic variance, and therefore, a corresponding decrease in population fitness (Frankham et al. 2005)
40
Harlan (1970), one of the early contributors to the science of plant genetic resources, stated: ‘The varietal wealth of the plants that feed and clothe the world is slipping away before our eyes, and the human race simply cannot afford to lose it’.
In order to mitigate the effects of the extinction vortex (first coined by Gilpin and Soulè in 1986), studies have to take into account the demographic and environmental stochasticity (Fig.1.6). The elements involved in assessing the effects of include reproduction rates, number of offspring per generation, sex determination, and mortality rates (Fagan and Holmes 2006; Blomquist 2010). This is easier in animals as their reproductive biology, strategies and sexual reproduction is clearer those that of plants.
Estimating genetic erosion is not straightforward. Some studies have used species abundance over time as an estimate of genetic erosion (Hammer et al. 1996). In those cases, the sites selected for assessment need to be taken into account, where factors such as the geology and geography will be of major relevance.
“Genetic erosion may thus be defined as a permanent reduction in richness or evenness of common localized alleles or the loss of combination of alleles over time in a defined area” (IPGRI/Bioversity International). Drivers of genetic erosion in agricultural biodiversity include (Guarino 1995):
• Introduction of modern varieties and exotic crops
• Loss of seed-saving and vegetative and propagation skills • Acculturation of traditional farmers (or their death) • Change in economic base
• Conversion of land to industrial agriculture
• Destruction (urbanization) of habitat and farmland • Impact of herbicides and pesticides
• Environmental contamination • Introduction of exotic pests • Loss of seeds to pests