Keywords: Near infrared spectroscopy; Delignification;
Pre-treatments; Banana rachis; Cluster analysisIntroduction
Lignocellulosic biomass has become an alternative source for production of chemicals and fuels, because it is renewable and could reduce greenhouse gas emission [1]. The major components of lignocellulosic biomass are cellulose, hemicellulose and lignin. Cellulose and hemicellulose are polysaccharides, which could be hydrolysed to molecules of lower degree of polymerization for further biological/chemical utilization [2]. For example, a significant attention has been recently paid to new uses of vegetable fibres as new reinforcing agents in biocomposite materials [3] and for the isolation of microfibrils [4]. Lignin, a phenolic polymer, is also important source for industrial applications, such as adhesive resin [5] and lignin gels [6]. Both lignin and cellulose are also being developed for synthesis of bioplastic materials [7]. Regardless of the specific use, as a crucial step of lignocellulosic materials processing, pretreatments are carried out to break the structure of lignocellulose and make components accessible for further conversions. Today, several delignificant methods have been developed at industrial level (i.e., steam explosion, alkali washing, dilute acid hydrolysis, ammonia fiber explosion, organosolv extraction, wet oxidation) [8-11], and for a correct evaluation of treatments yield and efficiency, lignin quantification is always required [12]. However, classic wet chemical assays, which employ steps of sulfuric acid hydrolysis or alkali digestion, are labour-intensive, time-consuming and require the use of hazardous reagents [13]. In addition, they are
very expensive, which make them often inappropriate for industrial application on large numbers of samples [14]. In contrast the potential of Fourier Transform Near Infrared Spectroscopy (FT-NIRS) has been widely stated and increased [15]. FT-NIRS is an alternative technique that allows reliable, direct and rapid determination of different properties at the same time, with minimal, or without, sample pretreatments. The ability of FT-NIRS to analyse component of biomass relies on the selective absorption of light (in the range 800-2500 nm) by the overtones and combinations vibrations of polar bonds, i.e., CO, OH, CH and NH, which have their fundamental vibrations in the mid-infrared region [16]. The application of NIRS to wood components has been reported by several researchers [17-19] who especially have noted the usefulness of quantitative analysis to predict lignin [20], cellulose [21], hemicellulose [22], extractives [23], cellulose crystallinity [24],
*Corresponding author: Elena Tamburini, Department of Life Science
and Biotechnology, University of Ferrara, Italy, Tel: +390532455103; Fax: +390532240709; E-mail: [email protected]
Received March 02, 2016; Accepted March 18, 2016; Published March 25, 2016 Citation: Tamburini E, Uria CFL, Dedenaro G, Costa S, Marchetti G, et al. (2016)
Potential of Near Infrared Spectroscopy for Classification of Different Delignificant Pre-Treatments on Banana Rachis. J Anal Bioanal Tech 7: 311. doi:10.4172/2155-9872.1000311
Copyright: © 2016 Tamburini E, et al. This is an open-access article distributed
under the terms of the Creative Commons Attribution License, which permits unrestricted use, distribution, and reproduction in any medium, provided the original author and source are credited.
Abstract
Delignificant pretreatments are fundamental in lignocellulosic materials preprocessing to remove lignin from biomass. Current wet chemical methods are time-consuming, labor-intensive and use hazardous reagents. Near Infrared Spectroscopy (NIRS) provides rapid and non-destructive analysis, and has shown promising results.
Spectra collection (8000-4000 cm-1), combined with chemometric analysis based on Cluster Analysis and Principal
Component Analysis, has allowed to perform qualitative study of banana rachis, a lignocellulosic residue of agricultural production.
Potential of Near Infrared Spectroscopy for Classification of Different
Delignificant Pre-Treatments on Banana Rachis
Elena Tamburini1*, Christian Fabricio Larenas Uria2, Giovanni Dedenaro1, Stefania Costa1, Maria Gabriella Marchetti1 and Paola Pedrini1
1Department of Life Science and Biotechnology, University of Ferrara, Italy 2Universidad Politécnica Salesiana, Quito, Ecuador
p-hydroxyphenil (H)-, guaiacyl (G)- and syringyl (S)- based lignin quality [25] of different wood materials. However, in chemometric data analysis, classification and pattern recognition methods are also powerful tools in the context of quality assessment and composition analysis [26]. Classification of wood species by means of combining NIRS and Mahalanobis generalized distance has been reported by Mark and Tunnel [27]. Krongtaew et al. [28] have recently characterized pretreated wheat straw and oat straw by means of qualitative NIRS model.
In this study, the qualitative assessment of different delignificant pretreatments of banana rachis by means of FT-NIRS has been discussed. The rachis is the stalk of the inflorescence from the first fruit to the male bud. After fruit harvesting, rachis, together with foliage and stems represent a great amount of valuable lignocellulosic materials [29], thus constituting an additional economical profit to farmers in producing countries. Organosolv (ethil-acetate, ethanol and acetone) pretreatment, oxidative delignification with sodium hypochlorite, electro-chemically activated solution of active chlorine has been carried out, and compared with non-treated banana rachis samples, using cluster analysis based on FT-NIR spectra.
Materials and Methods
Banana rachis samples and chemical pretreatments
Rachis samples were obtained by banana plants (Musa paradisiaca var. sapientum) cultivated in Ecuador. 300 g of dried samples were grinded up to obtain a homogeneous powder. Initial lignin content of raw material, analysed using Klason method [30] was 15.60%. Aliquots of 1 g were then treated with the following delignificant agents: Electro-Chemically Activated (ECA) solution, for 5-10-15-30 minutes, sodium hypochlorite (5% w/w), organosolv solution (ethanol, acetone and ethyl acetate), combined treatments with ECA solution/organosolv, and ECA solution/water at two different temperature (50°C and 90°C) (Table 1). According to Tamburini et al. [31], ECA solution was prepared by electrolysis treating a solution containing 5 ppm of NaCl in a
flow-through electrochemical cell, maintaining pH=6 to allow hypochlorite → hypochlorous acid conversion. As a result, ECA solution with an oxidizing substances content (determined by iodometric titration and expressed as “active chlorine”) of about 1500 ppm were obtained. Such solution can be stores in glass containers, preferably in the dark, maintaining their properties for some days. According to Huijgen et al. [32] 90% wt solvent acid solution with 0.2% of HCl as catalyst was used. The reaction was carried out at 130°C for 30 min with solid:liquid ratio of 1:10.
FT-NIR spectra acquisition
FT-NIR diffuse reflectance spectra of treated and non-treated rachis samples were collected with a NIRFLex N-500 (Büchi, Switzerland), equipped with the Solids Cell Module (Büchi, Switzerland) designed for standard Petri dishes (Schott, Germany) and set up with a polarization
interferometer with TeO2 wedges. Fresh samples were flattened on the
glass surface of a 9.0 cm diameter standard cup by using a stainless steel load disk. Due to the eccentrically rotating cup housing, two scans for each sample were taken. The instrument was designed to be operational for working temperature conditions from 5 up to 35°C, without any drift of the spectra signal. The reflectance spectra were recorded using NIRWare 1.4 (Büchi, Switzerland) and scanning the full range, from
10,000 to 4000 cm−1, at 8 cm−1 intervals; measurements were carried out
at 2–4 scans/s with a wavenumber accuracy of ± 0.2 cm–1 (measured
with HF gas cell at an ambient temperature of 25 ± 5°C). To obtain a good signal-to-noise ratio, 128 scans for each spectrum were averaged during each spectral acquisition, resulting in a total measurement time of 30 s. Every spectrum acquisition was preceded by the acquisition of an internal reference to optimize the spectrum baseline. For this study, a total of 98 spectra were collected.
NIR data pre-treatments
Raw optical data were processed with combination of Standard Normal Variate (SNV) and first derivative (Savitzky-Golay 5 points), as mathematical pretreatments. SNV is a mathematical transformation method of the spectra used to remove slope variation and to correct for scatter effects [33]. SNV removes the multiplicative interferences of scatter, particle size, and the change of light distance. It corrects both multiplicative and additive scatter effects. To remove slope variations on individual spectrum basis, each element is transformed independently using the following equation:
∑
i i,k i,SNV 2 m i i,k k=1(x - x )
x
=
(x - x )
(m - 1)
where xi,SNV is the transformed element, xi,k is the original element,
xi is the mean of spectrum i, k=1, 2, … , m, m is the number of variables
in the spectra, and i=1, 2, … , n, and n is the number of validation set. It is clear that the baseline shift is eliminated [34].
First derivative eliminate baseline drifts and small spectral differences are enhanced. Derivatives in general are mainly used to resolve peak overlap (or enhance resolution) and eliminate constant and linear baseline drift between samples. Spectral first derivative has been here calculated by Savitzky-Golay polynomial fitting, where the data within a moving window are fitted by a polynomial of a given degree to generate a differential of a chosen degree. In this procedure, it is very important to select the proper differentiation width of the
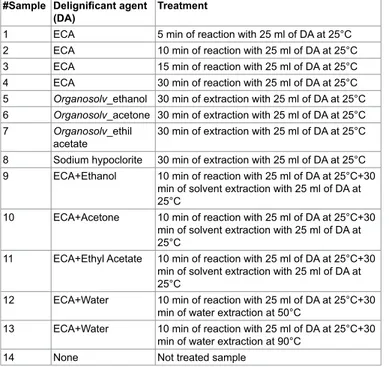
#Sample Delignificant agent
(DA) Treatment
1 ECA 5 min of reaction with 25 ml of DA at 25°C
2 ECA 10 min of reaction with 25 ml of DA at 25°C
3 ECA 15 min of reaction with 25 ml of DA at 25°C
4 ECA 30 min of reaction with 25 ml of DA at 25°C
5 Organosolv_ethanol 30 min of extraction with 25 ml of DA at 25°C
6 Organosolv_acetone 30 min of extraction with 25 ml of DA at 25°C
7 Organosolv_ethil
acetate 30 min of extraction with 25 ml of DA at 25°C
8 Sodium hypoclorite 30 min of extraction with 25 ml of DA at 25°C
9 ECA+Ethanol 10 min of reaction with 25 ml of DA at 25°C+30
min of solvent extraction with 25 ml of DA at 25°C
10 ECA+Acetone 10 min of reaction with 25 ml of DA at 25°C+30
min of solvent extraction with 25 ml of DA at 25°C
11 ECA+Ethyl Acetate 10 min of reaction with 25 ml of DA at 25°C+30
min of solvent extraction with 25 ml of DA at 25°C
12 ECA+Water 10 min of reaction with 25 ml of DA at 25°C+30
min of water extraction at 50°C
13 ECA+Water 10 min of reaction with 25 ml of DA at 25°C+30
min of water extraction at 90°C
14 None Not treated sample
moving window in the function. The width should not exceed one point five times as the half width of absorbance peak in the spectra [35].
NIR qualitative calibration
All the chemometric analyses including math pretreatments, calibration and validation were performed using NIRCal 5.4 (Büchi, Switzerland). NIRCal 5.4 provided the wavelengths for each set of processing data based on correlation coefficients calculated for each wavelength. A blockwise cross-validation (the default software procedure) was performed choosing out 32 samples as validation set (V-set) while the rest 66 were used as C-set. Calibrations were developed using all data points of the C-set in the near infrared region from 8,000
to 4000 cm−1. Qualitative discriminant analysis was carried out by using
cluster analysis based on principal component analysis (PCA). The goal was to identify the different delignificant pretreatments using the PCA and, as a result, to get a well separated clusters area in the scores plot for each treatment. Clusters were created according to secondary principal components (PCs) selection. Secondary PCs are that PCs among the primary PCs, which shows a clear separation of the substances and the scores are good repeatable. They are also responsible and used for the calculation of tolerance circles of radius r for every calibration in the score plot [36]. Radius r was calculated as the smaller of the two possible values derived by the following formulas:
1
2
=
R
×
r
f
(
1
2
)
4
+
=
R
R
×
r
f
where R1 is the smallest distance between a spectrum to the closest spectrum of a different property, R2 is the smallest distance between a spectrum to the side of its cluster and f is the so called Radii Blow Up factor, which assumes values in the range 0<f<1. Depending on the extension of the cluster (R2) and the distance between the two closest clusters (R1), the circles are closer or further away from each other. With a Radii Blow Up = 1, two circles can just touch each other but do not overlap. For chemically different substances, the Radii Blow Up may be between 0 and 1, being as closest to 0 as highest sensitivity of the calibration. Values higher than 1 implies overlapping between rings [37]. Radii Blow Up values were automatically calculated by the software and included in clusters assessment on scores plots.
Results and Discussion
NIR spectra analysis
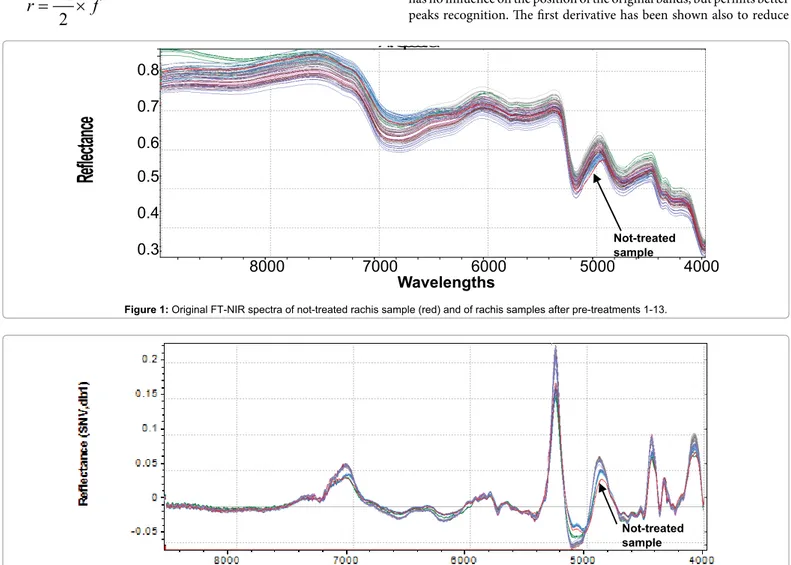
Original 98 NIR reflectance spectra are reported in Figure 1. To accentuate and notice characteristics of FT-NIR spectra and facilitate qualitative interpretation, all spectra were also shown in pre-treated
(SNV+ 1st derivative) mode (Figure 2). This kind of data pre-processing
has no influence on the position of the original bands, but permits better peaks recognition. The first derivative has been shown also to reduce
Figure 1: Original FT-NIR spectra of not-treated rachis sample (red) and of rachis samples after pre-treatments 1-13.
All Spectra Wavelengths
Ref
lec
tan
ce
4000 5000 6000 7000 8000 0.3 0.4 0.5 0.6 0.7 0.8 Calibration Spectra Validation Spectra Not-treated sample0.8
0.7
0.6
0.5
0.4
0.3
8000
7000
6000
5000
4000
Wavelengths
Figure 2: SNV and 1st derivative pre-treated FT-NIR spectra not-treated rachis sample (red) and of rachis samples after pretreatments 1-13. Not-treated sample
the severity of the covariance of adjacent wavelengths in native spectra and it is hypothesized that such a pretreatment could also improve precision during modelling [38]. Several bands in the FT-NIR spectra are recognized as typical for lignin structures [18]. The most prominent lignin band is the first overtone of the C-H stretching vibration at 5980
cm-1 corresponding to aromatics and at 5800 cm-1 of acetyl groups
covalently bound to xylan [39]. Another characteristic of lignin band
is located at 6916-6913 cm-1, assigned to phenolic OH. Although this
bands overlaps with the first overtone of OH stretching of amorphous
polysaccharides near 7000 cm-1, an unresolved shoulder is rather visible
[40]. Xylan, arabinoxylans and galactomannans are recognized as the main rachis hemicellulose constituents, along with small amounts of rhamnose [41]. Characteristics bands of polysaccharides are found among the first overtone of the OH stretching between 7050-6250
cm-1 and among the CH combination bands as well as the second
overtone of the CH2 bending vibration around 4350 and 4250 cm-1.
Characteristic xylan bands are due to the fist overtone of CH stretching vibration of acetyl groups strongly absorbing in the region near
5800-5600 cm-1. The band absorption in the range 7200-6950, at 6720,
6480 and 6290 cm-1 corresponds to amorphous, semi-crystalline and
crystalline cellulose respectively [42]. Below 5600 cm-1, spectra are
dominated by water signals, with intense combination band at 5200
cm-1 and weak absorption at 5500 cm-1, allocated to the OH stretching
and OH bending of water. Although samples had been dried for several days before spectra collection, it was found that water content in rachis samples could be enhanced after pretreatments, probably because delignification induces cleavage of acetyl groups and cellulose swelling effects that could increase hydrophilicity [28]. Moreover, other compounds with OH bonds, such as mono- and polysaccharides can also contribute to these regions.
Qualitative chemometric analysis
The identification of NIR spectral data after pretreatments was
performed for spectral region 8000-4000 cm-1, because beyond 8000
cm-1 signals are saturated by noise. As describe above, this spectral
region contains qualitative information on key components of rachis, such as lignin, hemicellulose (xylans and other polysaccharides) and cellulose. By means of PCA, multivariate spectral data space (98 samples for 1400 variables, i.e., data points of FT-NIR spectra in the spectral range used), in which variables are often correlated each other, was reduced to a maximum of 15 orthogonal latent factors-the PCs-, in practice rarely more than 6-8. The contribution of each of the original variables (wavelengths) to each PC is usually plotted in the loadings spectra (here not shown), and the contribution of each PC to each spectrum is plotted in scores plots (Figures 1-6). It is worthwhile pointing out that spectral signal are dependent on all the chemical components present in samples, so whereas first and second PCs contained more information on lignin, hemicellulose and cellulose, from the third onwards useful analytical information about the overall structure and composition could significantly improve qualitative discrimination and clustering.
Samples deriving from treatments reported in Table 1 were grouped using four different criteria, in order to highlight the influence of specific parameter on NIR ability to cluster data points (Table 2).
Classification of sample submitted to different delignificant
agents
Figure 3 shows the bi-dimensional projection of PC1 and PC2 obtained from cluster analysis on the effect of different agents on rachis delignification. Not treated samples (red) and samples treated with
sodium hypochlorite (green) belong to different clusters, and both clearly separated by other classes. The blue-circled group includes all samples treated with organosolv. They all belong to the same cluster, but NIR in these conditions is not able to differentiate treatment with different types of solvents. This could probably due to the fact that, independent by solvent used (solvent was completely removed after treatment) delignificant effects are similar. The remaining group (yellow-circled) includes all samples treated with ECA solution, alone or together with other solvent/water extraction. Solvents extraction seems to have an overall minor effect on delignification of rachis than ECA solution treatment, which clearly prevails for delignificant treatment classification. These considerations are supported by examining in
particular two regions shown of Figure 2 (7200-6800 cm-1 and
5400-4800 cm-1). Delignificant pretreatments on rachis seem to increase
peaks amplitude at 7100 cm-1, corresponding to alcoholic/phenolic
OH bonds and at 5200 cm-1, corresponding to polysaccharides OH.
This could be mainly due to chemical modifications in lignin structure after treatments, which led to an increase of OH units, supposedly caused by either degradation of ether linkage between lignin units or hydrolysis of methoxyl groups [43]. Based on peaks amplitude, it could be then postulated that ECA solution are the most efficient in lignin degradation, whereas sodium hypochlorite and organosolv, in our experimental conditions, induce lower degradation on lignin structure. In particular, organic solvents seem to have more effect on lignin
degradation (peaks amplitude at 7100 cm-1), while sodium hypochlorite
on polysaccharides degradation (peaks amplitude at 5200 cm-1).
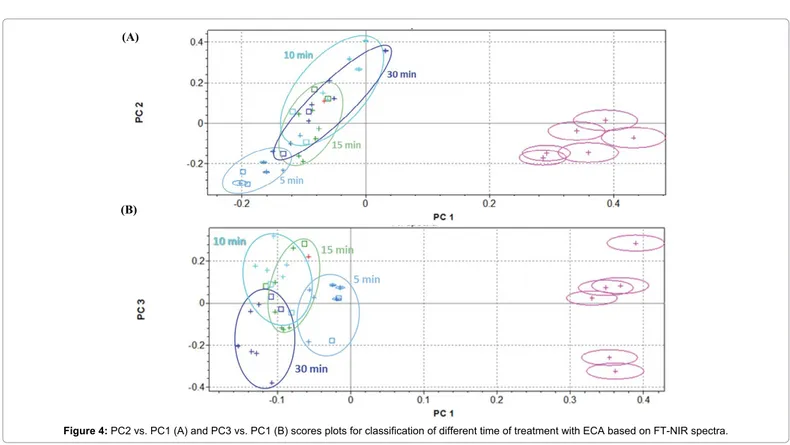
Classification of sample submitted to different time of
treatments with ECA solution
ECA solution efficiency was examined more deeply, evaluating influence of time of treatment on rachis samples at 5-10-15-30 minutes, in comparison with not-treated sample. Cluster analysis is shown in Figure 4. Confirming previous results, PC2 vs. PC1 scores plot evidenced a good separation along PC1 between not-treated and treated samples, but analytical information given by PC2 and PC1 are not sufficient to clearly discriminate among time of treatment with ECA solution (Figure 4A). PC3 captured more variability in the NIR spectra and is partially able to resolve clusters overlapping, at least improving separation between 5 to 30 minutes of treatments (Figure 4B).
Classification of samples submitted to three organosolv
treatments
Useful analytical information to differentiate types of solvents used was included only in PC4 vs. PC1 scores plot in Figure 5. In fact, as reported by Erdocia et al. [44], after treatments with different solvents, residual lignin has almost the same content on carbonyl, carboxyl and hydroxyl groups. This can suggests that if different solvents did not entail significant changes in the main structure of lignin, they induce only weak variations on NIR spectra signals. However, Endorcia et al. have recognized some slight differences in spectra in the MIR region. These signals, probably attributable to minor lignocellulosic matrix components, i.e., protein or nitrogen-based molecules [45], could have been captured by PC4 and enhanced cluster classification.
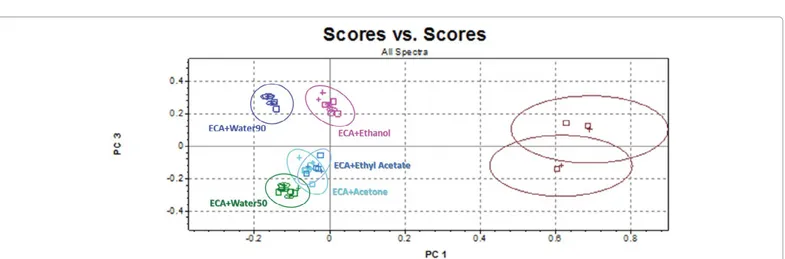
Classification of samples submitted to double treatment
Finally, capacity of FT-NIR to cluster samples submitted to double treatments has been investigated in detail. PC3 vs. PC1 scores plot (Figure 6) shows that, as previously, PC1 permits good separation between treated and non-treated samples. Moreover, combination of PC3 and PC1 information contains sufficient information to improveFigure 3: PC2 vs. PC1 scores plot for classification of different delignificant pretreatments based on FT-NIR spectra: not-treated (red); treated with sodium hypochlorite
(green), treated with ECA (blue-circled) and treated with organosolv (yellow-circled).
Figure 4: PC2 vs. PC1 (A) and PC3 vs. PC1 (B) scores plots for classification of different time of treatment with ECA based on FT-NIR spectra.
(A)
(B)
Criteria of samples classification #Samples
Effect of delignificant agents 4, 5, 6, 7, 8, 9, 10, 11, 12, 14
Effect of time on ECA treatments 1, 2, 3, 4, 14
Effect of organosolv treatments 5, 6, 7, 14
Effect of double treatment 9, 10, 11, 12, 13, 14
Table 2: Key effect considered in grouping samples.
Figure 6: PC3 vs. PC1 scores plot for classification of different treatments with ECA+ organosolv or water based on FT-NIR spectra.
significantly the cluster capacity of the model. Stating the prevailing effect of ECA solution on lignin, the clear separation among ECA+water50, ECA+water90, ECA+ethanol and the others could be correlated to the presence of OH groups deriving from ethanol and water.
Conclusion
The main purpose of this study was to assess the performance of FT-NIR for classification of delignificant pretreatments on banana rachis based on qualitative chemometric models. FT-NIR spectra combined with multivariate cluster analysis has shown to have great potential as an analytical tool for qualitatively characterizing lignocellulosic samples after different delignificant pretreatments, avoiding time-consuming and labour-intensive wet chemical methods. Differences can be attributable not only to the characteristic NIR bands of lignin, hemicellulose and cellulose in samples, but can also be discriminated and explained by means of PCA.
FT-NIR spectroscopy has demonstrated to be a promising technique to evaluate a large number of samples for their chemical modifications after delignificant pretreatments, simultaneously, rapidly and without any samples preparation.
Acknowledgements
The authors would like to thank Professor Alessandro Medici, of University of Ferrara, for his commitment in creating and maintaining relationships and cooperation between Italy and Ecuador, and for his kind support during all the phases of the work.
References
1. Binder JB, Raines RT (2009) Simple chemical transformation of lignocellulosic biomass into furans for fuels and chemicals. J Am Chem Soc 131: 1979-1985. 2. Singh P, Sulaiman O, Hashim R, Peng LC, Singh RP (2013) Using biomass
residues from oil palm industry as a raw material for pulp and paper industry: potential benefits and threat to the environment. Environment, development and sustainability 15: 367-383.
3. Perez-Ameneiro M, Bustos G, Vecino X, Barbosa-Pereira L, Cruz JM, et al. (2015) Heterogenous lignocellulosic composites as bio-based adsorbents for wastewater dye removal: a kinetic comparison. Water, Air, & Soil Pollution 226: 133.
4. Reddy N, Yang Y (2005) Biofibers from agricultural byproducts for industrial applications. Trends Biotechnol 23: 22-27.
5. El Mansouri N, Pizzi A, Salvadó J (2007) Lignin-based wood panel adhesives without formaldehyde. European Journal of Wood & Wood Products 65: 65-70. 6. Parajuli D, Adhikari CR, Kuriyama M, Kawakita H, Ohto K, et al. (2006)
Selective recovery of gold by novel lignin-based adsorption gels. Industrial & Engineering Chemical Research 45: 8-14.
7. Siracusa V, Rocculi P, Romani S, Rosa MD (2008) Biodegradable polymers for food packaging: a review. Trends in Food Science and Technology 19: 634-643. 8. Alvira P, Tomás-Pejó E, Ballesteros M, Negro MJ (2010) Pretreatment
technologies for an efficient bioethanol production process based on enzymatic hydrolysis: A review. Bioresour Technol 101: 4851-4861.
9. Hendriks AT, Zeeman G (2009) Pretreatments to enhance the digestibility of lignocellulosic biomass. Bioresour Technol 100: 10-18.
10. Carvalheiro F, Duarte LC (2008) Hemicellulose biorefineries: A review on biomass pretreatments. Journal of Scientific and Industrial Research 67: 849-864.
11. Chaturvedi V, Verma P (2013) An overview of key pretreatment processes employed for bioconversion of lignocellulosic biomass into biofuels and value added products. Biotechnology 3: 415-431.
12. Amarasekara A (2014) Handbook of cellulosic ethanol. Scrivener Publishing LLC, Wiley.
13. Sluiter JB, Ruiz RO, Scarlata CJ, Sluiter AD, Templeton DW (2010) Compositional analysis of lignocellulosic feedstocks. 1. Review and description of methods. J Agric Food Chem 58: 9043-9053.
14. Xu F, Yu J, Tesso T, Dowell F, Wang D (2013) Qualitative and quantitative analysis of lignocellulosic biomass using infrared techniques: a mini review. Applied Energy 104: 801-809.
15. Kelley SS, Rials TG, Snell R, Groom LH, Sluiter A (2004) Use of near infrared spectroscopy to measure the chemical and mechanical properties of solid wood. Wood Science and Technology 38: 257-276.
16. Pasquini C (2003) Near Infrared Spectroscopy: fundamentals, practical aspects and analytical applications. J Braz Chem Soc 14: 198-219.
17. Tsuchikawa S, Inoue K, Noma J, Hayashi K (2003) Application of Near infrared spectroscopy to wood discrimination. Journal of Wood Science 49: 29-35. 18. Yeh TF, Chang HM, Kadla JF (2004) Rapid prediction of solid wood lignin
content using transmittance near-infrared spectroscopy. J Agric Food Chem 52: 1435-1439.
19. Hayes DJM (2012) Development of near infrared spectroscopy models for the quantitative prediction of the lignocellulosic components of wet Miscanthus samples. Bioresour Technol 119: 393-405.
20. Ono K, Hiraide M, Amari M (2003) Determination of lignin, holocellulose, and organic solvent extractives in fresh leaf, litterfall, and organic material on forest floor using near-infrared reflectance spectroscopy. Journal of forest research 8. 191-198.
21. McLellan TM, Aber JD, Martin ME, Melillo JM, Nadelhoffer KJ (1991) Determination of nitrogen, lignin, and cellulose content of decomposing leaf material by near infrared reflectance spectroscopy. Canadian Journal of Forestry Research 21: 1684-1688.
22. Yao S, Wu GF, Jiang YF, Fu XD, Lü HK, et al. (2010) Extending hemicelluloses content calibration of Acacia spp using NIR to new sites. Guang Pu Xue Yu Guang Pu Fen Xi 30: 1206-1209.
23. Gierlinger N, Schwanninger M, Hinterstoisser B, Wimmer R (2002) Rapid determination of heartwood extractives in larix sp. By means of fourier transform near infrared spectroscopy. J Near Infrared Spectrosc 10: 203-214.
24. Jiang ZH, Yang Z, So CL, Hse CY (2007) Rapid prediction of wood crystallinity in Pinus elliotii plantation wood by near-infrared spectroscopy. Journal of Wood Science 53: 449-453.
25. Robinson AR, Mansfield SD (2009) Rapid analysis of poplar lignin monomer composition by a streamlined thioacidolysis procedure and near-infrared reflectance-based prediction modeling. Plant J 58: 706-714.
26. Tsuchikawa S, Yamato K, Inoue K (2003) Discriminant analysis of wood-based materials using near-infrared spectroscopy. Journal of Wood Science 49: 275-280. 27. Mark HL, Tunnell D (1985) Qualitative near-infrared reflectance analysis using
Mahalanobis distances. Analytical Chemistry 57: 1449-1456.
28. Krongtaew C, Messner K, Ters T, Fackler K (2010) Characterization of key parameters for biotechnological lignocellulose conversion assessed by FT-NIR spectroscopy. Part I: qualitative analysis of pretreated straw. Bioresources 5: 2063-2080.
29. Oliveira L, Evtuguin D, Cordeiro N, Silvestre AJD (2009) Structural characterization of stalk lignin from banana plant. Ind Crops Prod 29: 86-95. 30. Dence CW (1992) The determination of lignin. In: Methods in Lignin Chemistry.
Springer Series in Wood Science, Springer pp. 33-61.
31. Tamburini E, Bernardi T, Castaldelli G, Tumiatti G, Ferro S (2011) Green electrochemical approach for delignification of wheat straw in second generation bioethanol production. Energy Environ Sci 4: 551-557.
32. Huijgen WJJ, Telysheva G, Arshanitsa A, Gosselink RJA, de Wilda PG (2014) Characteristics of wheat straw lignins from ethanol-based organosolv treatment. Ind Crops Prod 59: 85-95.
33. Barnes R, Dhanoa M, Lister J (1989) Standard normal variable transformation and detrending of near infrared diffuse reflectance spectra. Appl Spectrosc 43: 772-777.
34. Cen H, He Y (2007) Theory and application of near infrared reflectance spectroscopy in determination of food quality. Trends in Food Science and Technology 18: 72-83.
35. Savitzky A, Golay MJ (1964) Smoothing and differentiation of data by simplified least squares procedures. Analytical chemistry 36: 1627-1639.
36. Brereton RG (2009) Chemometrics for pattern recognition. John Wiley & Sons Ltd, Bristol, UK.
37. Bossart R, Keller H, Kellerhals H, Oelichmann J (2003) Principal components analysis as a tool for identity control using near-infrared spectroscopy. Journal of molecular structure 661: 319-323.
38. Via BK, Zhou C, Acquah G, Jiang W, Eckhardt L (2014) Near infrared spectroscopy calibration for wood chemistry: which chemometric technique is best for prediction and interpretation? Sensors (Basel) 14: 13532-13547. 39. Shenk JS, Workman JJ, Westerhaus MO (2001) Application of NIR spectroscopy
to agricultural products. Practical Spectroscopy Series 27: 419-474.
40. Scarff M, Arnold SA, Harvey LM, McNeil B (2006) Near infrared spectroscopy for bioprocess monitoring and control: current status and future trends. Crit Rev Biotechnol 26: 17-39.
41. Oliveira L, Cordeiro N, Evtuguin DV, Torresa IC, Silvestre AJD (2007) Chemical composition of different morphological partsfrom ‘Dwarf Cavendish’ banana plant and their potential as a non-wood renewable source of natural products. Ind Crops Prod 6: 163-172.
42. Tsuchikawa S, Siesler HW (2003) Near infrared spectroscopic monitoring of the diffusion process of deuterium-labeled molecules in wood. Part I: softwood. Appl Spectrosc 57: 667-674.
43. Nada AAMA, El-Sakhawy M, Kamel SM (1998) Infra-red spectroscopic study of lignins. Polymers Degradation and Stability 60: 247-251.
44. Erdocia X, Prado R, Corcuera MA, Labidi J (2014) Effect of different organosolv treatments on the structure and properties of olive tree pruning lignin. Journal of Industrial and Engineering Chemistry 20: 1103-1108.
45. Bensah EC, Mensah M (2013) Chemical Pretreatment Methods for the Production of Cellulosic Ethanol: Technologies and Innovations. International Journal of Chemical Engineering 2013: 1-21.
OMICS International: Publication Benefits & Features Unique features: • Increased global visibility of articles through worldwide distribution and indexing • Showcasing recent research output in a timely and updated manner • Special issues on the current trends of scientific research Special features: • 700 Open Access Journals • 50,000 editorial team • Rapid review process • Quality and quick editorial, review and publication processing • Indexing at PubMed (partial), Scopus, EBSCO, Index Copernicus, Google Scholar etc. • Sharing Option: Social Networking Enabled • Authors, Reviewers and Editors rewarded with online Scientific Credits • Better discount for your subsequent articles Submit your manuscript at: http://www.omicsonline.org/submission
Citation: Tamburini E, Uria CFL, Dedenaro G, Costa S, Marchetti G, et al.
(2016) Potential of Near Infrared Spectroscopy for Classification of Different Delignificant Pre-Treatments on Banana Rachis. J Anal Bioanal Tech 7: 311. doi:10.4172/2155-9872.1000311