R E S E A R C H A R T I C L E
Ectopic expression of PLC-β2 in non-invasive breast tumor
cells plays a protective role against malignant progression and
is correlated with the deregulation of miR-146a
Valeria Bertagnolo
1|
Silvia Grassilli
1|
Stefano Volinia
1,2,3|
Yasamin Al-Qassab
1,4|
Federica Brugnoli
1|
Federica Vezzali
1|
Elisabetta Lambertini
5|
Maria Palomba
1|
Quirino Piubello
6|
Enrico Orvieto
7|
Cristina Natali
8|
Maria Roberta Piva
5|
Carlo Maria Croce
2|
Silvano Capitani
1,31Section of Anatomy and Histology, Department of Morphology, Surgery and Experimental Medicine, University of Ferrara, Ferrara, Italy 2Comprehensive Cancer Center, Wexner Medical Center, Ohio State University, Columbus, Ohio
3LTTA, University of Ferrara, Ferrara, Italy
4College of Medicine, Department of Anatomy, University of Baghdad, Baghdad, Iraq 5Department of Biomedical and Specialty Surgical Sciences, University of Ferrara, Ferrara, Italy
6Division of Anatomic Pathology, Department of Diagnostic and Pathology, Azienda Ospedaliera Universitaria Integrata di Verona, Verona, Italy 7Department of Medicine DIMED, Surgical Pathology and Cytopathology Unit, University of Padua, Padua, Italy
8Pathology Division, Santa Maria della Misericordia Hospital, Rovigo, Italy
Correspondence
Valeria Bertagnolo, PhD, Section of Anatomy and Histology, Department of Morphology, Surgery and Experimental Medicine, University of Ferrara, 44121, Ferrara, Italy.
Email: [email protected]
Funding information
Italian MIUR, Grant number: FIRB
RBAP10Z7FS_002; Associazione Italiana per la Ricerca sul Cancro, Grant number: IG 170631
Cells in non-invasive breast lesions are widely believed to possess molecular
alterations that render them either susceptible or refractory to the acquisition of
invasive capability. One such alteration could be the ectopic expression of the β2
isoform of phosphoinositide-dependent phospholipase C (PLC-β2), known to
counteract the effects of hypoxia in low-invasive breast tumor-derived cells. Here,
we studied the correlation between PLC-β2 levels and the propensity of non-invasive
breast tumor cells to acquire malignant features. Using archival FFPE samples and
DCIS-derived cells, we demonstrate that PLC-β2 is up-regulated in DCIS and that its
forced down-modulation induces an epithelial-to-mesenchymal shift, expression of
the cancer stem cell marker CD133, and the acquisition of invasive properties. The
ectopic expression of PLC-β2 in non-transformed and DCIS-derived cells is, to some
extent, dependent on the de-regulation of miR-146a, a tumor suppressor miRNA in
invasive breast cancer. Interestingly, an inverse relationship between the two
molecules, indicative of a role of miR-146a in targeting PLC-β2, was not detected in
This is an open access article under the terms of the Creative Commons Attribution-NonCommercial-NoDerivs License, which permits use and distribution in any medium, provided the original work is properly cited, the use is non-commercial and no modifications or adaptations are made.
© 2018 The Authors. Molecular Carcinogenesis Published by Wiley Periodicals, Inc.
Abbreviations: DABCO, 1,4-diazabicyclo [2.2.2] octane; DAPI, 4ʹ,6-diamidino-2-phenylindole; DCIS, Ductal carcinoma in situ; DMEM F-12, Dulbecco's modified Eagle's and Ham's F-12 media; EMT, Epithelial-to-mesenchymal transition; FFPE, Formalin fixed paraffin-embedded; IDC, Invasive ductal carcinoma; NF-kB, Nuclear factor kappa-light-chain-enhancer of activated B cells; PBS, Phosphate buffered-saline; PLC-β2, Phosphoinositide-dependent phospholipase C-β2; siRNAs, Small interfering RNAs; TNBC, Triple-negative breast cancer.
Valeria Bertagnolo and Silvia Grassilli contributed equally to this work.
primary DCIS from patients who developed a second invasive breast neoplasia. This
suggests that alterations of the PLC-β2/miR-146a relationship in DCIS may
constitute a molecular risk factor for the appearance of new breast lesions. Since
neither traditional classification systems nor molecular characterizations are able to
predict the malignant potential of DCIS, as is possible for invasive ductal carcinoma
(IDC), we propose that the assessment of the PLC-β2/miR-146a levels at diagnosis
could be beneficial for identifying whether DCIS patients may have either a low or
high propensity for invasive recurrence.
K E Y W O R D S
breast tumor recurrence, ductal carcinoma in situ (DCIS), epithelial-to-mesenchymal transition (EMT), miR-146a, phosphoinositide-dependent phospholipase C beta 2 (PLC-β2)
1
|INT RODUCTION
Since the introduction of mammography screening, ductal carcinoma in situ (DCIS) constitutes about 20-25% of newly diagnosed cases of breast cancer in industrialized countries1,2and, although DCIS is a
non-obligate precursor, it may constitute a crucial step in the progression toward invasive ductal carcinoma (IDC).3,4The
progres-sion of DCIS to IDC is a very complex biological phenomenon and recent studies indicate that cells in DCIS lesions likely harbor molecular alterations that render them prone to the acquisition of invasive capability.5
Among the signaling molecules deregulated in breast cancers is the beta2 isoform of phosphoinositide-dependent phospholi-pase C (PLC-β2). Physiologically expressed in hematopoietic cells only, PLC-β2 is up-modulated in the large majority of primary invasive mammary tumors independent of their histological subtypes, in which positively correlates with malignancy and poor prognosis.6 In highly invasive breast tumor-derived cells, PLC-β2 sustains invasive capability7and is inversely correlated
with the cancer stem cell marker CD133,8 involved in cell invasion and lymph node metastases.8,9 In low-invasive breast
tumor-derived cells, PLC-β2 is down-modulated by hypoxia, a crucial condition for the malignant progression of solid tumors, including breast cancer.10The forced up-regulation of PLC-β2 in pre-EMT breast tumor-derived cells prevents E-cadherin levels from decreasing and blocks the up-regulation of the stem cell marker CD133 induced by low oxygen,10suggesting that this PLC
isozyme has a role in preventing the malignant progression of early breast neoplasia.
The primary aim of this work was to assess the relationship between PLC-β2 expression in non-invasive breast tumors and their propensity to progress into invasive lesions. In addition, since the regulation of gene expression during malignant breast cancer evolution is mainly attributed to miRNAs,11,12the miRNA responsible for modulating PLC-β2 levels in breast tumors was investigated. Using both archival formalin-fixed breast tumor samples and breast
tumor-derived cells, we demonstrate that primary DCIS express PLC-β2 at varying levels and that PLC-PLC-β2 amounts are inversely correlated to those of miR-146a, which is known to reduce the metastatic potential of invasive breast cancer cells. The involvement of miR-146a in modulating PLC-β2 in DCIS-derived cells is addressed, as is the potential prognostic relevance of the PLC-β2/miR-146a ratio in primary DCIS.
2
|MATERIALS AND METHODS
All reagents were from Sigma (St Louis, MO) unless otherwise indicated.
2.1
|Breast tumor tissues
Cohort 1 included 70 formalin fixed paraffin-embedded (FFPE) samples of primary pure DCIS selected from a collection of tumors archived by the Pathological Anatomy Division of the Verona and Rovigo Hospitals and from the Surgical Pathology and Cytopathology Unit of the Padua University. The age of patients at diagnosis ranged between 32 and 84 yr (median: 51). A total of 9% of DCIS were comedo, 64% non comedo, and 27% mixed histotype. Concerning histological grade, 20% were low, 33% intermediate, and 47% high grade tumors.
Cohort 2 included 20 FFPE samples of consecutive primary IDC collected at the Surgical Pathology and Cytopathology Unit of Padua University. Nine showed Luminal A, 4 Luminal B, 2 HER2, and 5 TNBC molecular phenotype. Three were low, 7 intermediate, and 10 high grade tumors.
Cohort 3 included 24 archived FFPE samples of primary unilateral pure DCIS from patients with at least 5 years available follow-up (Verona site). The Cohort included 12 patients who later developed a contralateral IDC and 12 control patients who did not recur, selected on the basis of patients’ homogeneity in terms of age (median: 53, range: 51-55), adjuvant therapy, and radiotherapy administration. A total of 12% displayed comedo, 53% non
comedo, and 35% mixed histotype. A total of 29% were low grade, 12% intermediate grade, and 59% high grade tumors. The median follow-up for Cohort 2 was of 94 months (range: 61–120 months). Patients were required to give written informed consent for their tissue samples to be archived and used for research purposes.
2.2
|Immunohistochemical analysis of PLC-β2
Five micrometer thick tissue sections were subjected to immunohis-tochemical analysis with an anti-PLCβ2 antibody (Santa Cruz Biotechnology, Santa Cruz, CA) following a previously described procedure.13Each stained tissue sample was analyzed by an optical microscope (Carl Zeiss Axiophot 100, Zeiss, Göttingen, D) equipped with a Nikon Digital Sight DS Vi1 camera (Nikon, Lijnden, NL) and the stain intensity was estimated by analysis of acquired images with ImageScope software (Aperio, Vista, CA). Each tumor was categorized according to arbitrarily defined criteria into “weak,” “moderate,” and “strong” staining, as previously described.6
2.3
|Cell culture and transfection
The non-transformed MCF10A cells were purchased from the American Type Culture Collection (Rockville, MD) and were cultured in Dulbecco's modified Eagle's medium and Ham's F-12 medium (1:1, v/v) (DMEM F-12, Gibco Laboratories, Grand Island, NY) containing 10 µg/mL bovine insulin, 100 ng/mL cholera toxin, 0.5 µg/mL hydrocortisone, 20 ng/mL recombinant human epidermal growth factor, and 10% horse serum. The breast cancer-derived cell line MCF10DCIS, kindly provided by Dr. Macpherson (Beatson Institute for Cancer Research, Glasgow, UK), was grown in DMEM F-12 supplemented with 5% horse serum and 1% Penicillin-streptomycin solution (Gibco Laboratories). Cells were grown at 37°C in a humidified atmosphere of 5% CO2in air, monthly tested for mycoplasm and other
contaminations and quarterly subjected to cell identification by single-nucleotide polymorphism.
The down-modulation of PLC-β2 was performed with specific siRNAs (Santa Cruz Biotechnology) and PLC-β2 over-expression was achieved by transient transfection with a plasmid expressing a full-length human PLC-β2, following previously described procedures.10As
control of PLC-β2 down-modulation, cell were transfected with a further siRNAs mixture (PLC-β2 siRNAs#, QIAGEN S.p.A., Milan, I), as previously reported.7The transfected cells were incubated at 37°C in a 5% CO2atmosphere for 48 h prior to RNA extraction and cellular assays.
For specific modulation of miR-146a, transient transfections were carried out with synthetic inhibitor or mimic (miRVana miRNA, Life Technologies, Monza, I), and Lipofectamine 2000 in Opti-MEM I medium (Gibco Laboratories) without serum, according to standard procedures. Random sequences were used as negative controls.
2.4
|Isolation of nuclei and immunochemical analysis
Nuclei from MCF10DCIS cells were isolated essentially as previously described.13Total lysates from cells and nuclei (25 µg protein) and PLC-β2 immunoprecipitates, obtained following a previously reported proce-dure,7were separated on 8.5% polyacrylamide /SDS gels and blotted
to nitrocellulose membranes (GE Healthcare Life Science, Little Chalfont, UK). The membranes were incubated with antibodies directed against Vimentin and β-Tubulin (Sigma), E-cadherin, IkBα, p65 and Lamin B (Santa Cruz Biotechnology), as previously reported,10
and revealed with ECL (PerkinElmer, Boston, MA). The chemilumines-cent bands were detected with ImageQuant™ LAS 4000 imager and densitometry was performed with Image Quant TL (GE Healthcare).
2.5
|Cytofluorimetrical evaluation of cancer stem
cell markers
CD133 surface expression was evaluated in both MCF10A and MCF10DCIS cells by means of flow cytometry after direct staining with phycoerythrin (PE)-conjugated CD133/2 monoclonal anti-body (293C3, Miltenyi Biotec, Bologna, I), as previously reported.8
The expression of CD44 and CD24 surface antigens were evaluated following a previously described procedure.14 Briefly, in a one-tube assay, cells were stained with allophycocyanin (APC)-conjugated CD44 and fluorescein isothiocyanate (FITC)-conjugated anti-CD24 monoclonal antibodies (Becton Dickinson, San José, CA).
All samples were analyzed by a FACSCalibur flow cytometer (Becton-Dickinson) with CellQuest Pro 6.0 software (Becton-Dick-inson). Data collected from 10 000 cells are shown as percentage of positive cells or as mean fluorescence intensity (MFI) values.
2.6
|Real-time cell invasion assays
Cell invasion of MCF10A and MCF10DCIS cells was evaluated with the xCELLigence Real-Time Cell Analyzer System (Acea Bioscences Inc., San Diego, CA) that monitors cell events by measuring electrical impedance, as previously reported.8,10In particular, 40 000 cells/well were seeded onto the top chambers of CIM-16 plates (Acea Bioscences) covered with a layer of Matrigel (BD Biosciences, Milan, I) diluted 1:20. The bottom chambers were filled with medium containing 10% serum and the signal was detected every 15 min for a total of 24 h. Impedance values were expressed as a dimensionless parameter (cell index, CI). Data were also subjected to slope analysis that describes the steepness, incline, gradient, and changing rate of the CI curves over time.
2.7
|miRNA-Seq analysis of formalin fixed DCIS
tissues
Four consecutive 10 µm thick sections of 30 DCIS samples selected from Cohort 1, where the tumor constituted over 70% of the tissue area and infiltrating blood cells were virtually absent, were subjected to manual macro-dissection. Dissected areas were processed for RNA extraction using AllPrep DNA/RNA FFPE Kit (QIAGEN), following the manufacturer's instructions. The short RNA was profiled using an RNAseq approach on SOLiD (Thermo Fisher Scientific, Paisley, UK),
following a previously described procedure.15 Each sample was
barcoded and the RNAseq data were quality checked, pre-processed, mapped, and annotated on miRBase v21 using NovoAlign (Novocraft Technologies, Selangor, Malaysia).
2.8
|Laser-capture micro-dissection and miR-146a
analysis
Five micrometer tissue sections on frame slides (Leica Microsystems, Wetzler, D), were deparaffinized with xylene, rehydrated in RNase-free 100% ethanol, rinsed in RNase-RNase-free water, lightly stained with RNase-free hematoxylin (Bio-Optica, Milan, I) and dehydrated. For each sample, 5-10 000 cells were micro-dissected using the Leica LMD6500 laser capture microscope (Leica Microsystems). Micro-dissected tissues were subjected to RNA extraction with miRNeasy FFPE Kit (QIAGEN), following the manufacturer's protocol. RNA was subjected to real-time PCR for quantitative measurement of miR-146a using the TaqMan MicroRNA assay (Life Technologies) and a Bio-Rad CFX96™ system, as previously reported.16 Fold-changes were
calculated using the 2−ΔΔCTmethod and normalized to the expression of U6 snRNA. Cycle threshold >35 were excluded. Control PCR samples were run without cDNA.
2.9
|Quantitative analysis of PLC-β2 mRNA and
miR-146a in cell lines
High-quality total RNA from MCF10A and MCF10DCIS cells was extracted with mirVana™ miRNA Isolation Kit (Life Technologies) according to the manufacturer's instruction. RNA quantity and quality was determined by using NanoDrop 2000 spectrophotometer (Thermo Fisher Scientific). The first-strand cDNA was synthesized from total RNA using the High-Capacity cDNA Reverse Transcription Kit (Life Technologies), following the manufacturer's instruction. The cDNAs were employed as template for real-time RT-PCR for PLC-β2 quantitative measurement using the TaqMan® Gene Expression Assay (Life Technologies), as previously reported.10 Fold-changes were calculated using the 2−ΔΔCTmethod and normalized to the expression
RPL13A (Ribosomal Protein L13a) mRNA levels.
MicroRNAs from MCF10A and MCF10DCIS cells were extracted with miRNeasy Micro kit (QIAGEN), following the manufacturer's instructions. For miR-146a analysis, RNA was subjected to single stranded cDNA synthesis using a TaqMan MicroRNA Reverse Transcrip-tion Kit (Life Technologies), according to the manufacturer's instrucTranscrip-tions. The cDNAs obtained were employed as templates for quantitative Real-Time PCR, following a previously described procedure.16
2.10
|Chromatin immunoprecipitation (ChIP) assay
ChIP experiments were performed using a ChIP assay kit (Upstate Biotechnology, Lake Placid, NY) as previously reported.16The samples were subjected to immunoprecipitation at 4°C overnight with anti-bodies directed against p65 or with a non-specific IgG, used as a negative control (Santa Cruz Biotechnology). DNA was recoveredusing a PCR purification kit (Promega, Madison, WI) in 50 μL elution buffer. PCR was performed to assess for the presence of DNA precipitated by the antibodies using specific primers (Forward: 5ʹ-GCCTCCACTGGGAGTTTAT- 3ʹ, Reverse: 5ʹ-GCATACCCCCAA-CAACGGTA-3ʹ) to amplify a 137 bp region encompassing the putative NF-kB binding site located at −1645/−1633 bp from the transcrip-tional start in the human PLC-β2 promoter. Input corresponding to 1% of the total sonicated DNA was used as a positive control. PCR products were separated on tris-acetate 2% agarose gels, stained with ethidium bromide and visualized by UV light apparatus.
2.11
|Luciferase reporter assay
HeLa and MCF10DCIS cells were co-transfected with 50 or 250 ng pMIR-report luciferase reporter vector containing the wild-type 3ʹ-UTR sequence of human PLC-β2 (Promega) and with 10 or 30 nM miR-146a mimic, using Lipofectamine 2000 (Life Technologies) diluted in Opti-MEM I medium (Gibco Laboratories), according to the manufacturer's instructions. After 5 h of incubation at 37°C in a 5% CO2atmosphere, transfected cells were cultured in growing medium
for 24 h and then subjected to luciferase reporter assay using the Luciferase Assay System (Promega) in a GloMax 20/20n single tube Luminometer (Promega) according to the manufacturers’ protocol. Non-targeting CONmiR mimic (Riboxx Life Sciences, Radebeul, D) was used as negative control.
2.12
|Statistical analysis
The relationships between PLC-β2 expression and clinic-pathological parameters were assessed by χ2test. The correlations of PLC-β2 with miRNAs were determined by using Spearman Rho. Statistical analysis of data from densitometry of WB bands was performed using the two-sided Mann-Whitney U-test for unpaired data (SPSS Inc., Chicago, IL). The relationship between PLC-β2 levels and patients outcome was assessed by Fisher exact test. P values <0.05 were considered statistically significant.
3
|RESUL TS
3.1
|PLC-β2 is present in DCIS tissues and affects
EMT markers, CD133 level, and invasion capability in
DCIS-derived cells
Immunohistochemical analysis performed on FFPE tissue sections from 70 pure DCIS (Cohort 1) with different histopathological features demonstrated that PLC-β2 is expressed, to a variable extent (Figure 1A), in all breast tumor samples. The analysis of PLC-β2 staining, arbitrarily quantified as weak, moderate or strong following a previously established criterion,6 showed that protein levels
are significantly lower in DCIS with respect to unrelated IDC (Cohort 2), even though this PLC isozyme was expressed at moderate or high levels in 26% and 20% of DCIS samples, respectively (Figure 1B).
The amount of PLC-β2 found in DCIS did not significantly correlate with any of the main clinic-pathological factors and biological markers for breast tumors (Table 1). Conversely, a significant correlation was observed between PLC-β2 staining and the age at diagnosis, since the majority of patients ≤50 developed primary DCIS with low levels of the protein and none of the tumors from patients over 65 showed strong PLC-β2 staining (Table 1).
The effects of different levels of PLC-β2 on malignant features of breast cells were investigated in vitro in the non-transformed MCF10A cells and in the non-invasive MCF10DCIS cell line, a well-established model of high grade, comedo-like DCIS tumor.17
Stemming from our previous data indicating that PLC-β2 may regulate the levels of EMT markers in low invasive breast
tumor-derived cells,10E-cadherin, and Vimentin were measured in
cells in which the PLC isozyme was forcedly modulated. As reported in Figures 2A and 2B, in MCF10DCIS but not in MCF10A the epithelial marker E-cadherin increased and the mesenchymal marker Vimentin decreased when PLC-β2 was over-expressed. Only in DCIS derived cells a substantial increase of Vimentin was observed as a consequence of specific silencing of PLC-β2 (Figures 2A and 2B).
The analysis of invasion capability performed with the xCELLi-gence real-time system indicated that down-modulation of PLC-β2 is sufficient to increase the ability of MCF10DCIS to pass through Matrigel, while it was completely ineffective on motility of untrans-formed MCF10A (Figures 2C and 2D).
FIGURE 1 PLC-β2 is expressed in primary DCIS. In (A) immunohistochemical analysis of PLC-β2 expression of FFPE sections from healthy breast tissue (a) and DCISs with different histological features (b-d) derived from Cohort 1. b: low-grade ductal non comedo; c: intermediate-grade ductal non comedo; d: high intermediate-grade ductal comedo. Bar = 100 μm. In (B) graphical representation of levels of PLC-β2 staining in primary DCIS (Cohort 1) and unrelated IDC (Cohort 2). [Color figure can be viewed at wileyonlinelibrary.com]
Since we have previously demonstrated that, in low and highly invasive breast tumor-derived cells, PLC-β2 regulates the expression of CD133,8,10this surface antigen was measured in MCF10A and
MCF10DCIS subjected to forced modulation of the protein. As revealed by flow cytometry (Figure 2E), only in MCF10DCIS the number of cells expressing CD133 at surface level significantly increased as a consequence of the silencing of PLC-β2. The analysis of the surface expression of CD44 and/or CD24 in the same experimental conditions failed to reveal, in both MCF10A and MCF10DCIS cells, effects of the forced modulation of PLC-β2 (Supplementary Figure S1).
The effects of the down-modulation of PLC-β2 on EMT markers, on invasion capability and on CD133 expression in MCF10DCIS cells were confirmed by transfection with a different siRNA mixture (Supplementary Figure S2).
3.2
|miR-146a influences PLC-β2 expression in
non-transformed and DCIS-derived cells
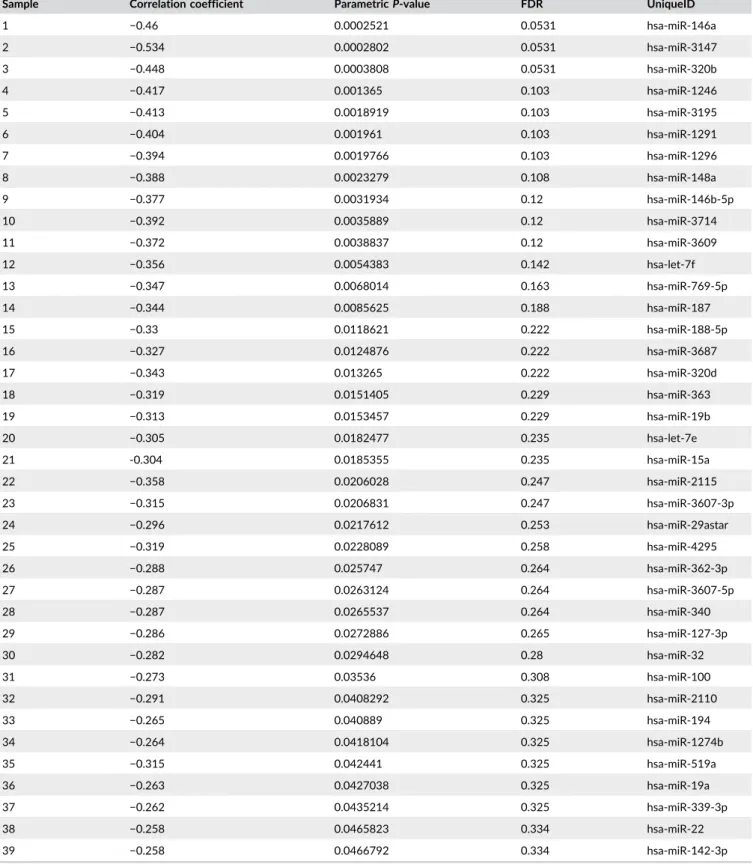
To establish whether the ectopic expression of PLC-β2 in DCIS correlates with miRNA/s de-regulated in breast tumors, 30 DCIS selected from Cohort 1 were macro-dissected and profiled by short RNA NGS. For each DCIS sample, the level of each miRNA was compared with the amount of PLC-β2 determined by immunohisto-chemical analysis. Of the 1222 different mature miRNAs expressed across all samples, none of those predicted to target the PLC-β2 gene (TargetScan, http://www.targetscan.org) were found to significantly correlate with the protein amount (data not shown). However, when the inverse relationship was considered, miR-146a emerged as the miRNA that displayed the most significant (P < 0.001) negative correlation with PLC-β2 staining (Table 2). The inverse relationship TABLE 1 Correlation of PLC-β2 staining with clinico-pathological factors and biological markers in DCIS
Features Weak staining n (%) Moderate staining n (%) Strong staining n (%) P
Age at diagnosis (n = 70) 0.0489a ≤50 22 (64.7) 7 (20.6) 5 (14.7) 50-65 10 (40) 6 (24) 9 (36) ≥65 6 (54.5) 5 (45.5) 0 (0) Histotypes (n = 70) 0.348 Comedo 3 (50) 3 (50) 0 (0) Non comedo 26 (57.78) 11 (24.44) 8 (17.78) Mixed 9 (47.37) 4 (21.05) 6 (31.58) Size (n = 56) 0.616 ≤2 cm 23 (53.49) 11 (25.59) 9 (20.92) >2 cm 5 (38.46) 4 (30.77) 4 (30.77) Histological grade (n = 70) 0.830 Low 8 (57.14) 3 (21.43) 3 (21.43) Intermediate 11 (47.83) 8 (34.78) 4 (17.39) High 19 (57.58) 7 (21.21) 7 (21.21) ER (n = 69) 0.648 ≤10 3 (50) 1 (16.67) 2 (33.33) >10 34 (53.97) 17 (26.98) 12 (19.05) PR (n = 69) 0.340 ≤10 9 (40.91) 7 (31.82) 6 (27.27) >10 28 (59.57) 11 (23.4) 8 (17.03) HER-2 (n = 15) 0.254 0 2 (50) 1 (25) 1 (25) 1 0 (0) 4 (66.67) 2 (33.33) 2 0 (0) 3 (100) 0 (0) 3 1 (50) 1 (50) 0 (0) Ki-67 (n = 59) 0.838 ≤13 18 (48.65) 10 (27.03) 9 (24.32) >13 11 (50) 7 (31.82) 4 (18.18) P, Pearson's χ2test. aStatistically significant.
between PLC-β2 staining and the miR-146a expression resulting by the NGS analysis (Figure 3A) was confirmed by RT-PCR of micro-dissected areas from some selected samples showing high and low PLC-β2 staining (Figure 3B).
The role of miR-146a in modulating PLC-β2 levels was investi-gated in the MCF10A and MCF10DCIS cell lines, which express the two molecules at different levels. In particular, PLC-β2 was almost undetectable in MCF10A cells, coherently with their non-transformed status, while a higher expression was found in MCF10DCIS, in terms of both mRNA (Figure 4A) and protein (Figures 2A and 4C). Concerning miR-146a, a significantly lower expression was observed in the DCIS derived cells in comparison with the non-transformed MCF10A (Figure 4A). The use of synthetic mimic and inhibitors showed that silencing of miR-146a induces the expression of PLC-β2 in both cell lines and that its up-regulation partially down-modulates PLC-β2 expression only in MCF10DCIS (Figures 4B and 4C).
The possible role of PLC-β2 in regulating the levels of miR-146a was also investigated, failing to show significant modifications of
the miRNA expression as a consequence of the forced modulation of the protein in both MCF10A and MCF10DCIS cell line (Figure 4D).
3.3
|miR-146a inactivates NF-kB and targets PLC-β2
The NF-kB pathway is the main intracellular signaling known to be linked to miR-146a18,19 and p65 subunit was demonstrated toregulate PLC-β2 expression in platelets.20 Once established that miR-146a may modulate the expression of PLC-β2 in both MCF10A and MCF10DCIS cells, the possible involvement of NF-kB was investigated in cells in which the miRNA was forcedly modulated. A strong increase of the IkBα kinase, indicative of its reduced degradation, was observed only in MCF10DCIS cultured in the presence of the miR-146a mimic (Figures 5A and 5B). In the same experimental condition, a significant decrease of p65 inside the nuclear compartment was revealed (Figure 5C), indicative of a reduced activity of NF-kB at the nuclear level. Accordingly, the use FIGURE 2 PLC-β2 modulates EMT markers, invasion capability, and CD133 expression in MCF10DCIS cells. In (A) representative Western blot analysis with the indicated antibodies of MCF10A and MCF10DCIS cells transfected with siRNAs specific for PLC-β2 (PLC-β2 siRNAs) or with a construct expressing the full-length human PLC-β2 (Over PLC-β2). Scramble siRNAs (Ctrl siRNAs) and an empty vector were used as controls. In (B) relative amounts of the indicated proteins as deduced from the densitometry of Western blot bands normalized with β-Tubulin, used as internal control for equivalence of loaded proteins. The mean expression level of three separate experiments ± SD is shown. The asterisks indicate statistically significant differences compared to transfection with respective controls (Ctrl) taken as 1. In (C) dynamic monitoring of invasion through Matrigel using the xCELLigence system RTCA system. Cell Index (CI) is reported and error bars indicate ±SD. Slope analysis that describes the steepness, incline, gradient, and changing rate of the CI curves over time, is shown in (D). In (E) cytofluorimetrical evaluation of CD133 surface expression in MCF10A and MCF10DCIS cells under the above reported experimental conditions, after labelling with a
phycoerythrin (PE)-conjugated anti-CD133 antibody. The number of cells expressing high levels of CD133 is reported as percentage. All the data are the mean of 3 separate experiments ± SD. (*P < 0.05; **P < 0.01). [Color figure can be viewed at wileyonlinelibrary.com]
of the miR-146a inhibitor induced a significant increase of nuclear p65 (Figure 5C).
ChIP experiments were then performed to explore the association of the p65 subunit of NF-kB with the PLC-β2 promoter in vivo. Primers able to amplify a 137 bp region encompassing
the putative NF-kB binding site located in the human PLC-β2 promoter (Supplementary Figure S3) were used, failing to detect significant amount of p65 associated DNA in control conditions as well as in cells in which miR-146a was forcedly modulated (Figure 5D).
TABLE 2 Inverse relationship between PLC-β2 and microRNAs levels (n = 30)
Sample Correlation coefficient Parametric P-value FDR UniqueID
1 −0.46 0.0002521 0.0531 hsa-miR-146a 2 −0.534 0.0002802 0.0531 hsa-miR-3147 3 −0.448 0.0003808 0.0531 hsa-miR-320b 4 −0.417 0.001365 0.103 hsa-miR-1246 5 −0.413 0.0018919 0.103 hsa-miR-3195 6 −0.404 0.001961 0.103 hsa-miR-1291 7 −0.394 0.0019766 0.103 hsa-miR-1296 8 −0.388 0.0023279 0.108 hsa-miR-148a 9 −0.377 0.0031934 0.12 hsa-miR-146b-5p 10 −0.392 0.0035889 0.12 hsa-miR-3714 11 −0.372 0.0038837 0.12 hsa-miR-3609 12 −0.356 0.0054383 0.142 hsa-let-7f 13 −0.347 0.0068014 0.163 hsa-miR-769-5p 14 −0.344 0.0085625 0.188 hsa-miR-187 15 −0.33 0.0118621 0.222 hsa-miR-188-5p 16 −0.327 0.0124876 0.222 hsa-miR-3687 17 −0.343 0.013265 0.222 hsa-miR-320d 18 −0.319 0.0151405 0.229 hsa-miR-363 19 −0.313 0.0153457 0.229 hsa-miR-19b 20 −0.305 0.0182477 0.235 hsa-let-7e 21 -0.304 0.0185355 0.235 hsa-miR-15a 22 −0.358 0.0206028 0.247 hsa-miR-2115 23 −0.315 0.0206831 0.247 hsa-miR-3607-3p 24 −0.296 0.0217612 0.253 hsa-miR-29astar 25 −0.319 0.0228089 0.258 hsa-miR-4295 26 −0.288 0.025747 0.264 hsa-miR-362-3p 27 −0.287 0.0263124 0.264 hsa-miR-3607-5p 28 −0.287 0.0265537 0.264 hsa-miR-340 29 −0.286 0.0272886 0.265 hsa-miR-127-3p 30 −0.282 0.0294648 0.28 hsa-miR-32 31 −0.273 0.03536 0.308 hsa-miR-100 32 −0.291 0.0408292 0.325 hsa-miR-2110 33 −0.265 0.040889 0.325 hsa-miR-194 34 −0.264 0.0418104 0.325 hsa-miR-1274b 35 −0.315 0.042441 0.325 hsa-miR-519a 36 −0.263 0.0427038 0.325 hsa-miR-19a 37 −0.262 0.0435214 0.325 hsa-miR-339-3p 38 −0.258 0.0465823 0.334 hsa-miR-22 39 −0.258 0.0466792 0.334 hsa-miR-142-3p
Even if the use of the TargetScan system did not predict PLC-β2 as a target of miR-146a, the use of EMBOSS Needle algorithm allowed to identify putative binding regions for miR-146a inside the 3ʹUTR of PLC-β2 (Supplementary Figure S4A), suggesting a direct regulatory role of this miRNA. The entire 3ʹ-UTR of PLC-β2 was then cloned into a pMIR vector which was transfected into cells with miR-146a mimic or miR-control. The luciferase activity, first evaluated in HeLa cells, significantly decreased as a consequence of transfection with miR-146a mimic (Supplementary Figure S4B). The inhibitory effect of miR-146a on the luciferase activity in the presence of the PLC-β2 3ʹUTR was also revealed in MCF10DCIS cells (Figure 5E), suggestive of a direct role of the miRNA in modulating PLC-β2 expression.
3.4
|The relationship between PLC-β2 and miR-146a
in primary DCIS has a clinical significance
To assess the potential prognostic relevance of the PLC-β2 levels in primary pure DCIS, their correlation with the risk of the appearance of an IDC in the other breast was investigated. PLC-β2 levels were then estimated in primary unilateral DCISs from patients without recur-rence and from patients who developed a subsequent contralateral IDC after at least 5 years from surgery (Cohort 3). As reported in Figure 6A, PLC-β2 staining of tissue sections did not show significant relationship with recurrence, even though primary DCIS from patients who developed a contralateral recurrence expressed levels of PLC-β2 lower than primary DCIS from patients who did not recur.
By comparing the levels of PLC-β2 and miR-146a in the same primary DCIS, we found that the strong inverse PLC-β2/miR-146a relationship that characterized samples from patients who did not recur (Figure 6B) was not shown by DCIS from patients who developed a contralateral IDC (Figure 6C). In particular, the majority of DCIS from patients who developed a second invasive breast neoplasia displayed low levels of miR-146a not accompanied by increase of PLC-β2 expression (Figure 6C).
When the expression of miR-146a was allocated in two levels on the basis of an arbitrarily selected cut-off, allowing to identify “high” or “low” samples (Figures 6B and 6C), we found that all patients bearing primary DCIS with weak PLC-β2 and high miR-146a or strong PLC-β2 and low miR-146a did not recur. On the other hand, all patients whose DCIS expressed low PLC-β2 and low miR-146a developed a contralateral IDC. Finally, the patients with DCIS showing an intermediate PLC-β2 staining had more than 50% probability to develop a second breast neoplasia provided that miR-146a in their primary tumor was expressed at low levels (Figure 6D).
4
|DISCUSSION
DCIS is extremely heterogeneous and different degrees of aggres-siveness may characterize lesions showing the same phenotype,5,21 suggesting that each DCIS intrinsically possesses features that can prevent or promote the acquisition of invasive properties. We previously demonstrated that PLC-β2 is ectopically expressed in invasive breast tumors in which it is positively correlated with malignancy in highly invasive tumors6while it plays a protective role
against hypoxia in low-invasive cells.10Here, we investigated whether PLC-β2 is de-regulated and involved in determining the malignant potential of non-invasive breast tumors. We found that PLC-β2 is expressed in DCIS showing different phenotypes and histological features. Even if the majority of DCIS displayed levels of PLC-β2 lower than those in IDC, high levels of the protein were expressed in some lesions, opening up the issue of its functional significance in non-invasive breast tumor cells.
Using the non-transformed MCF10A and the MCF10DCIS cells, a well-established model of DCIS-derived cells that spontaneously progress into IDC in immune-deficient mice,17we demonstrate that the forced modulation of PLC-β2 is unable to modify the phenotype of FIGURE 3 Relationship between the levels of PLC-β2 and
146a in primary DCIS. In (A) the expression levels of miR-146a (reads per million, rpm) in DCISs from Cohort 1 were log2 transformed and correlated with the PLC-β2 immunohistochemical staining of the same tissue samples. The regression line with the Spearman correlation coefficient and the P-value was reported. The arrows indicate samples subjected to the RT-PCR analysis of miR-146a levels, whose relationship with PLC-β2 is shown in B. Relative transcript levels were determined using the 2−ΔCT
method. ***P < 0.001. [Color figure can be viewed at wileyonlinelibrary.com]
MCF10A. On the other hand, up-modulation of PLC-β2 promotes an epithelial-like phenotype in non-invasive DCIS, as we previously demonstrated in pre-EMT BT-474 cells.10Accordingly, its silencing in
MCF10DCIS cells is sufficient to up-regulate the mesenchymal marker Vimentin. Since EMT may be involved in the progression from in situ to invasive phenotype, at least in basal-like breast cancer,22,23our data suggest that different levels of PLC-β2 may influence the malignant potential of non-invasive breast tumor cells. The increased ability of PLC-β2-silenced MCF10DCIS cells to pass through matrigel definitively confirms that low levels of the protein predispose DCIS-derived cells to acquire invasive properties.
Similarly to what we have previously demonstrated in invasive breast tumor-derived cells,8,10in the MCF10DCIS cell line silencing
PLC-β2 induces a significant increase in the number of cells expressing CD133, a breast cancer stem cell marker24 which
positively correlates with the occurrence of lymph node metastases in breast tumors with a triple-negative phenotype (TNBC).9,25Since
the number of cells with a CD44+/CD24- phenotype, associated with enhanced invasive potential,26was not affected by the forced
modulation of PLC-β2, we propose that in non-invasive breast lesions high levels of this protein, rather than limiting the number of cells with a stem-like phenotype, play a protective role by limiting the expression of CD133, directly involved in invasion of MDA-MB-231 cells.8
Having established that different expression levels of PLC-β2 may influence the malignant potential of non-invasive breast tumor cells, we investigated the possible mechanism underlying its de-regulation. Stemming from the notion that the levels of signaling molecules involved in tumor formation, progression, and metastasis may arise from the down-modulation of tumor suppressor miRNAs and/or the overexpression of oncogenic miRNAs,11 we searched in DCIS tissues for miRNAs, with a known role in breast cancer, involved in the de-regulation of PLC-β2. Considering that no miRNA able to target PLC-β2 directly has been identified to date, the miRNoma of a selected number of DCIS was analyzed by applying an NGS strategy, that has allowed our understanding of breast cancer genomics to be significantly advanced in recent years.27 We found that miR-146a,
known to have a tumor suppressor role in solid tumors including breast FIGURE 4 MiR-146a modulates PLC-β2 expression in non-transformed and DCIS-derived cells. In (A) total RNA isolated from MCF10A and MCF10DCIS cells was subjected to quantitative RT-PCR analysis of PLC-β2 mRNA and of miR-146a. Transcripts levels were calculated by the 2−ΔCTmethod. In B, total RNA isolated from MCF10A and MCF10DCIS cells transfected with miR-146a inhibitor or mimic was subjected
to quantitative RT-PCR analysis of PLC-β2 mRNA. Relative transcript levels were determined using the 2−ΔΔCTmethod. Values obtained from
cells transfected with a scramble sequence were taken as 1. In (C) representative Western blot analysis of PLC-β2 immunoprecipitated from MCF10A and MCF10DCIS cells transfected with miR-146a inhibitor or mimic and revealed with the anti PLC-β2 antibody. Histograms report data from densitometrical analysis of Western blot bands. In D, RNA isolated from MCF10A and MCF10DCIS cells in which PLC-β2 was silenced (PLC-β2 siRNAs) or over-expressed (Over PLC-β2) was subjected to quantitative RT-PCR analysis of miR-146a. Relative transcript levels were determined using the 2−ΔΔCTmethod. Values obtained from cells transfected with the scramble sequences were taken as 1. The
tumors,28–30had the highest significant inverse correlation with
PLC-β2 in DCIS, suggestive of its role in the regulation of PLC-PLC-β2 in breast tissue. This was addressed in MCF10-derived cells that, despite their high content of miR-146a, typical of triple-negative breast tumors,31
are suitable for studying the PLC-β2/miR-146a relationship since a lower miR-146a level and higher PLC-β2 level characterizes MCF10DCIS when compared with non-transformed MCF10A. In this breast cancer progression model32 we demonstrate that
inhibition of miR-146a significantly increases the PLC-β2 level in both non-transformed and DCIS-derived cells, suggesting that the down-modulation of this miRNA may underlie the ectopic appearance of PLC-β2 in mammary tumor cells. To address the mechanism involved, we first considered NF-kB signaling since this transcription factor has
been described to be strongly interconnected to miR-146a in a number of tumor cells, including breast cancer cells,18,19and to directly target
PLC-β2 in platelets.20 Only in MCF10DCIS we observed that restoration or inhibition of miR-146a inactivates or activates NF-kB, respectively, but we did not find evidence of any interaction between NF-kB and the PLC-β2 promoter. Although PLC-β2 mRNA is not a predicted target of miR-146a, we explored the possibility of a direct role of this miRNA in modulating PLC-β2 expression. Even if the exact binding sequence remains to be identified, our experiments revealed an interaction between miR-146a and the 3ʹ-UTR of PLC-β2, and thus point toward the direct involvement of this miRNA in the regulation of the PLC. On the other hand, since miR-146a induces incomplete response, it is very likely that other miRNAs are involved in the FIGURE 5 miR-146a targets PLC-β2 in MCF10DCIS cells. In (A) representative Western blot analysis with the indicated antibodies of MCF10A and MCF10DCIS cells transfected with miR-146a inhibitor or mimic. In (B) amounts of IkBα as deduced from the densitometry of Western blot bands normalized with β-Tubulin, used as internal control for equivalence of loaded proteins. The mean expression level of three separate experiments ± SD is shown. **P < 0.01 compared to transfection with scramble oligonucleotides. In (C) representative Western blot analysis with the anti-p65 antibody of total cells and nuclear lysates from MCF10DCIS cells transfected with miR-146a inhibitor or mimic. In (D) amounts of p65 as deduced from the densitometry of Western blot bands normalized with Lamin B, used as internal control for equivalence of loaded proteins. The mean expression level of three separate experiments ± SD is shown. *P < 0.05; **P < 0.01 compared to transfection with scramble oligonucleotides. In (E) representative analysis of in vivo recruitment of the p65 subunit of NF-kB to human
PLC-β2 promoter by chromatin immunoprecipitation in MCF10DCIS cells transfected with miR-146a inhibitor or mimic. The bands correspond
to PCR products obtained amplifying a 137 bp DNA fragment encompassing a consensus-binding site for NF-kB. Input: genomic DNA not subjected to immunoprecipitation (positive control); IgG: samples immunoprecipitated with a non-specific antibody (negative control). All experiments were performed in triplicate. In (F) percentage of luciferase activity in MCF10DCIS cells co-transfected for 24 h with 250 ng of PLC-β2 3ʹ-UTR luciferase reporter vector and with different concentrations of miR-146a mimic. Values obtained from cells transfected with scramble miRNA sequences (NC: negative control) were taken as 100. The data are the mean of three separate experiments ± SD.
regulation of PLC-β2 in this cell model, leaving open the question of the significance of its ectopic expression in breast cancer.
This bulk of our data allow us to conclude that the expression of PLC-β2 in DCIS-derived cells due, at least in part, to the down-regulation of miR-146a, promotes an epithelial-like phenotype, and may have a protective role against the acquisition of invasive properties. We also found that high levels of miR-146a in DCIS-derived cells promote the
accumulation of the p65 subunit of NF-kB at the cytoplasmic level, an event reported to have a positive prognostic significance in TNBC.33
This suggests that different PLC-β2 to miR-146a ratios might characterize DCIS with extremely different malignant potentials. Establishing the PLC-β2 to miR-146a ratio could also, therefore, have significant prognostic importance in early breast lesions, the actual risk of which is extremely difficult to predict for individual patients.34,35
FIGURE 6 Correlation of PLC-β2 and miR-146a in DCIS with invasive recurrence. In (A) relationship between PLC-β2 staining intensity and the outcome of DCIS patients (No recurrence or appearance of a further contralateral IDC). PLC-β2 staining intensity was correlated to miR-146a levels in DCIS from patients who did not recur (B) or who developed a further contralateral IDC (C). The dotted horizontal line defines the arbitrary cut-off between high and low levels of miR-146a expression. In (D) the percentages of patients with primary DCIS showing the different combinations of PLC-β2 (weak, moderate, strong) and miR-146a (H: high, L: low) expression levels are reported. [Color figure can be viewed at wileyonlinelibrary.com]
To assess the potential prognostic relevance of PLC-β2 and/or miR-146a in primary DCIS, we selected a specific cohort of DCIS patients, including those who developed a second IDC in the other breast at least 5 years after surgery. Considering the low frequency of relapse in patients with DCIS,2we investigated a relatively high number
of samples selected on the basis of comparable age at diagnosis and therapeutic approach. In contrast with invasive breast tumors, in which high PLC-β2 levels correlate with poor prognosis,6we found low levels of protein staining in DCIS from patients who developed a contralateral IDC. Interestingly, in this cohort the majority of samples showed low levels of both miR-146a and PLC-β2, suggesting that the as yet unknown transcription mechanism regulating the expression of PLC-β2 in this cell model is relatively inefficient. Although we cannot correlate the second neoplasia with the primary DCIS, we can conclude that the down-modulation of miR-146a in breast lesions not accompanied by an increase of PLC-β2 may constitute a risk for malignant progression as well as for the appearance of new lesions.
Since neither traditional classification systems nor molecular characterizations can reliably predict the malignant potential of DCIS, at variance with those for IDC, we propose that assessment of the PLC-β2 to miR-146a ratio in primary DCIS at diagnosis could help identify patients with either a low or high propensity for the development of invasive recurrence; this could, in turn, assist physicians select the most appropriate intervention strategy.
ACKNOWLEDGMENTS
The authors thank Dr. Macpherson (Beatson Institute for Cancer Research, Glasgow, UK) for providing the breast cancer-derived cell line MCF10DCIS and Dr. Sarah Warner (Wexner Medical Center, Ohio State University) for her technical skill in miRNA-Seq analysis. We thank Dr. Stephanie Parsley for the linguistic revision of the paper before submission.
CONFLICTS OF INTEREST
No potential conflicts of interest were disclosed.
ORCID
Valeria Bertagnolo http://orcid.org/0000-0002-4742-2302
REFERENCES
1. Pang JM, Gorringe KL, Fox SB. Ductal carcinoma in situ—update on risk assessment and management. Histopathology. 2016;68:96–109. 2. Van Luijt PA, Heijnsdijk EA, Fracheboud J, et al. The distribution of
ductal carcinoma in situ (DCIS) grade in 4232 women and its impact on overdiagnosis in breast cancer screening. Breast Cancer Res. 2016; 18:47.
3. Cowell CF, Weigelt B, Sakr RA, et al. Progression from ductal carcinoma in situ to invasive breast cancer: revisited. Mol Oncol. 2013;7:859–869.
4. Carraro DM, Elias EV, Andrade VP. Ductal carcinoma in situ of the breast: morphological and molecular features implicated in progression. Biosci Rep. 2014;34:19–28.
5. Mardekian SK, Bombonati A, Palazzo JP. Ductal carcinoma in situ of the breast: the importance of morphologic and molecular interactions.
Hum Pathol. 2016;49:114–123.
6. Bertagnolo V, Benedusi M, Querzoli P, et al. PLC-beta2 is highly expressed in breast cancer and is associated with a poor outcome: a study on tissue microarrays. Int J Oncol. 2006;28:863–872. 7. Bertagnolo V, Benedusi M, Brugnoli F, et al. Phospholipase C-beta 2
promotes mitosis and migration of human breast cancer-derived cells.
Carcinogenesis. 2007;28:1638–1645.
8. Brugnoli F, Grassilli S, Piazzi M, et al. In triple negative breast tumor cells, PLC-beta2 promotes the conversion of CD133high to CD133low phenotype and reduces the CD133-related invasiveness.
Mol Cancer. 2013;12:165.
9. Zhao P, Lu Y, Jiang X, Li X. Clinicopathological significance and prognostic value of CD133 expression in triple-negative breast carcinoma. Cancer Sci. 2011;102:1107–1111.
10. Brugnoli F, Grassilli S, Al-Qassab Y, Capitani S, Bertagnolo V. PLC-beta2 is modulated by low oxygen availability in breast tumor cells and plays a phenotype dependent role in their hypoxia-related malignant potential. Mol Carcinog. 2016;55:2210–2221.
11. Tahiri A, Leivonen SK, Luders T, et al. Deregulation of cancer-related miRNAs is a common event in both benign and malignant human breast tumors. Carcinogenesis. 2014;35:76–85.
12. Hannafon BN, Sebastiani P, de las Morenas A, Lu J, Rosenberg CL. Expression of microRNA and their gene targets are dysregulated in preinvasive breast cancer. Breast Cancer Res. 2011;13:R24. 13. Grassilli S, Brugnoli F, Lattanzio R, et al. High nuclear level of Vav1 is a
positive prognostic factor in early invasive breast tumors: a role in modulating genes related to the efficiency of metastatic process.
Oncotarget. 2014;5:4320–4336.
14. Brugnoli F, Grassilli S, Lanuti P, et al. Up-modulation of PLC-β2 reduces the number and malignancy of triple-negative breast tumor cells with a CD133+/EpCAM+ phenotype: a promising target for
preventing progression of TNBC. BMC Cancer. 2017;17:617. 15. Volinia S, Galasso M, Sana ME, et al. Breast cancer signatures for
invasiveness and prognosis defined by deep sequencing of microRNA.
Proc Natl Acad Sci U S A. 2012;109:3024–3029.
16. Grassilli S, Nika E, Lambertini E, et al. A network including PU.1, Vav1 and miR-142-3p sustains ATRA-induced differentiation of acute promyelocytic leukemia cells—a short report. Cell Oncol (Dordr). 2016;39:483–489.
17. Miller FR, Santner SJ, Tait L, Dawson PJ. MCF10DCIS.com xenograft model of human comedo ductal carcinoma in situ. J Natl Cancer Inst. 2000;92:1185–1186.
18. Bhaumik D, Scott GK, Schokrpur S, Patil CK, Campisi J, Benz CC. Expression of microRNA-146 suppresses NF-kappaB activity with reduction of metastatic potential in breast cancer cells. Oncogene. 2008;27:5643–5647.
19. Liu R, Liu C, Chen D, et al. FOXP3 controls an miR-146/NF-kappaB negative feedback loop that inhibits apoptosis in Breast cancer cells.
Cancer Res. 2015;75:1703–1713.
20. Mao G, Jin J, Kunapuli SP, Rao AK. Nuclear factor-kappaB regulates expression of platelet phospholipase C-beta2 (PLCB2). Thromb
Haemost. 2016;116:931–940.
21. Pape-Zambito D, Jiang Z, Wu H, et al. Identifying a highly-aggressive DCIS subgroup by studying intra-individual DCIS heterogeneity among invasive breast cancer patients. PLoS ONE. 2014;9:e100488.
22. Knudsen ES, Ertel A, Davicioni E, Kline J, Schwartz GF, Witkiewicz AK. Progression of ductal carcinoma in situ to invasive breast cancer is associated with gene expression programs of EMT and myoepithelia.
23. Choi Y, Lee HJ, Jang MH, et al. Epithelial-mesenchymal transition increases during the progression of in situ to invasive basal-like breast cancer. Hum Pathol. 2013;44:2581–2589.
24. Li Z. CD133: a stem cell biomarker and beyond. Exp Hematol Oncol. 2013;2:17.
25. Aomatsu N, Yashiro M, Kashiwagi S, et al. CD133 is a useful surrogate marker for predicting chemosensitivity to neoadjuvant chemotherapy in breast cancer. PLoS ONE. 2012;7:e45865.
26. Bhat-Nakshatri P, Appaiah H, Ballas C, et al. SLUG/SNAI2 and tumor necrosis factor generate breast cells with CD44+/CD24- phenotype.
BMC Cancer. 2010;10:411.
27. Verigos J, Magklara A. Revealing the complexity of breast cancer by next generation sequencing. Cancers (Basel). 2015;7:2183–2200. 28. Labbaye C, Testa U. The emerging role of MIR-146A in the control of
hematopoiesis, immune function and cancer. J Hematol Oncol. 2012;5:13. 29. Tao SF, He HF, Chen Q. Quercetin inhibits proliferation and invasion acts by up-regulating miR-146a in human breast cancer cells. Mol Cell
Biochem. 2015;402:93–100.
30. Liu Q, Wang W, Yang X, Zhao D, Li F, Wang H. MicroRNA-146a inhibits cell migration and invasion by targeting RhoA in breast cancer.
Oncol Rep. 2016;36:189–196.
31. Fkih M'hamed I, Privat M, Ponelle F, Penault-Llorca F, Kenani A, Bignon YJ. Identification of miR-10b, miR-26a, miR-146a and miR-153 as potential triple-negative breast cancer biomarkers. Cell Oncol
(Dordr). 2015;38:433–442.
32. So JY, Lee HJ, Kramata P, Minden A, Suh N. Differential expression of key signaling proteins in MCF10 cell lines, a human breast cancer progression model. Mol Cell Pharmacol. 2012;4:31–40.
33. Baba M, Takahashi M, Yamashiro K, et al. Strong cytoplasmic expression of NF-κB/p65 correlates with a good prognosis in patients with triple-negative breast cancer. Surg Today. 2016;46: 843–851.
34. Ponti A, Lynge E, James T, et al. ICSN DCIS Working group. International variation in management of screen-detected ductal carcinoma in situ of the breast. Eur J Cancer. 2014;50:2695–2704. 35. Benson JR, Wishart GC. Predictors of recurrence for ductal carcinoma
in situ after breast-conserving surgery. Lancet Oncol. 2013;14: e348–e357.
SUPPORTING INFORMATION
Additional supporting information may be found online in the Supporting Information section at the end of the article.
How to cite this article: Bertagnolo V, Grassilli S, Volinia S, et al. Ectopic expression of PLC-β2 in non-invasive breast tumor cells plays a protective role against malignant progression and is correlated with the deregulation of miR-146a. Molecular Carcinogenesis. 2018;1–14.