1 Department of Economic Studies, “G. d’ Annunzio” University, Pescara, Italy. Tel. + 39-085-4537937 * E-mail: [email protected]
** E-mail: [email protected]
CDS SPREADS AND BALANCE-SHEET RATIOS IN THE
BANKING SECTOR: AN EMPIRICAL ANALYSIS ON THE
MEDITERRANEAN EUROPE
Eliana Angelini1* and Alessandra Ortolano1**Abstract: The paper investigates empirically what kind of relationship between banking sector’s
CDS spreads and balance sheet ratios has been established, in the Mediterranean Europe for the period 2009-2014.The study shows the attention of the market for the quality and profitability of banks’ assets, in order to evaluate credit risk. We also find a significant attention for short-term liquidity, that could be explained by the Eurozone crisis that has affected the region in the period analyzed. Provided that also balance-sheet variables can be affected by balance-sheets’ policies, we finally suppose, that some results have been distorted by the deep speculation that took place in the CDS market of the Mediterranean Europe, during these years and has invalidated the efficiency of the CDS spread, as a good credit risk indicator.
Keywords: CDS spreads, Mediterranean Europe, Banking sector, Balance sheet Ratios. JEL classification: G1; G120; G21; G240.
1. INTRODUCTION
As CDS spreads represent the cost to ensure from credit risk, their level is an interesting variable, in order to evaluate the riskiness of a firm.
The relationship between CDS spreads and balance sheet ratios, in terms of evaluation of credit risk demonstrated by extended literature for industrial sector, has not been observed for the banks, at least until the onset of the financial crisis. Before the explosion of the latter, banking sector was considered safe by the market, probably because of the regulation that deals with this kind of firms. In particular,
Leverage ratio, generally considered an important factor of riskiness, wasn’t
evaluated at the same way in the case of banking sector, although their high levels. Anyway the uprising of the aforementioned crises, seems to have changed the way the market looks to the banking sector and, at the same time, has induced a
speculative process on the sector itself. As banks are the institutions that exchange CDSs, their weakness has established a situation of widespread counterparty risk, that has evolved itself into a form of systemic risk, because of the interconnections of the financial system.
If on one hand, some recent studies, have demonstrated more attention for banks’ balance-sheets, in order to evaluate the credit risk of the institutions, on the other hand contemporary literature, is showing the influence of market factors.
This paper, investigates empirically what kind of relationship between banks’ CDS spreads and balance-sheet variables has been established, in the Mediterranean Europe for the period 2009-2014. The aim of this work is to provide an analysis that has been inspired by an extended strand of study, but intends to be focused on the banking sector. To this purpose, we conduct an OLS analysis on a sample of 50 banks. We divide balance-sheets’ ratios into four classes: Asset, Capital, Liquidity and Operations and for each one, we make a multiple regression, using yearly average CDS spread as dependent variable.
2. LITERATURE REVIEW
Since the seminal work of Merton (1974), the financial literature has produced several works on the analysis of credit risk using balance-sheets, through the so-called approach of the structural models, having anyway regard to macroeconomic factors, like interest rate and liquidity. Essentially, according with Merton, the value of a debt issue of a firm, depends on three variables: a risk-free rate, the terms of the indenture and the probability of default. Simplifying, in his work, Merton shows how the probability of default of a firm and consequently its credit risk, grows with the riskiness of debt, measured by its volatility, which has, obviously, a stochastic nature. Furthermore, the value of the promised payments on debt, acts like a threshold: if, at the bonds’ due date, the value of the assets is under that limit, the default will occur. So, as the bondholders will take over the shares of the firm at the time of default, it’s like if they can exercise a call option.
Ericsson, Jacobs, Oviedo (2004), for instance, confirm the sign of the relationship between CDS premia and the three theoretical variables, i.e. leverage, volatility and interest rates, showing a positive relationship between CDS spreads and the first two variables and a negative sign, between interest rates and the same CDS premia.
Hewavitharana and Rahmqvist (2011), focus their study on the period between January 2008 and December 2010, examining the determinants of CDS spreads through leverage, stock return, volatility and interest rate. The main unexpected results of this study, both in a volatile context, are the positive relationship between
interest rate and CDS spreads and the negative one, between the latter and the leverage. The first relationship, could be explained by the fact that in a context of economic distress, as the sample period’s one, a firm is unable to meet its short term debts’ payments; the second, instead, is unclear.
Bank of Italy’s Di Cesare and Guazzarotti (2010), instead, analyze CDS spread changes, for a sample of US non-financial companies, splitting the period of the analysis in the pre-crisis, from January 2002 to June 2007 and the crisis’ one, from July 2007 to March 2009. They confirm the explanatory power of firm-specific variables all over the sample period, but they outline its decrease in favour of a systemic factor; at the same time, they show the increase of importance of the leverage ratio, as the market perceives it as a factor of riskiness, especially in time of distress; conversely, equity volatility lessens its impact, since the large swings in implied volatility during the crisis, invalidate its ability to explain long-term asset volatility.
Looking at the banking sector, we find a different situation and, in particular, it’s necessary discriminating between the pre-crisis and the crisis period.
Raunig and Scheicher (2009), compare CDS spreads of 41 banks with 162 non-banks’ ones, for a period from January 2003 to December 2007. They show that, if before the outbreak of the financial turmoil, banks’ CDS spreads are on average lower than the other firms’ ones, as they are perceived less risky because of their heavy regulation and public sector support, after the onset of the crisis, the difference between the two sectors shrunk considerably, as both kinds of CDS spreads raise sharply, because of the perception of the riskiness, also for banks.
Annaert et al. (2010) examine CDS spread changes for euro area financial institutions, over the period 2004-2008, identifying three kinds of spread determinants: credit risk factors, trading liquidity and market wide factors. These macro-variables are significant both in the pre-crisis and during the crisis period, but their effect becomes stronger during times of distress, especially as concerns liquidity and, with regard to credit risk factors, leverage; the effect of business cycle, instead, is less clear, as it could incorporate both credit risk and liquidity factors.
An interesting study based on the balance-sheet indicators, made by Chiaramonte and Casu (2013), focus on a panel data of 89 international banks from 1 January 2005 to 30 June 2011, dividing the period into three segments: the pre-crisis, the crisis and the aftermath. The main results are that, even if banks record very high levels of leverage, CDS spreads aren’t high as well, until the outbreak of the crisis: this means that before this event, market hasn’t evaluated leverage as a significant factor of riskiness for banks, unlike the other sectors.1
The last issue, is consistent with an other work focused on large complex financial institutions, made by Calice, Ioannidis and Williams (2011), that states, in a section of the paper, the relevance of the volatility of the assets, respect to the risk of default. It furthermore shows the interconnection between CDS market and banking sector, in a systemic risk perspective.
De Vincentiis (2014), compares the riskiness of global systemically important banks (G-SIB) with the no-SIBs, looking at their respective CDS spreads, trying to find out their determinants. What emerges from the paper, focusing on the crisis period, is the significance of the bank-specific variables related to dimensions, profitability and capital stability and the country risk, measured by sovereign CDS spreads, for both kinds of banks.
3. METHODOLOGY OF RESEARCH
We make an OLS analysis, to evaluate the the influence of balance sheet ratios on CDS spreads.
In particular, we divide the ratios into their four main categories (Asset, Capital, Liquidity and Profitability) and we make a multiple regression for each kind of ratio.
Below, we indicate the ratios chosen and their supposed relationship with the CDS spread, highlighting that the latter is as higher as much it’s credit risk perception.
Our assumptions (Table 1a), therefore, are made taking into account that for a banking firm, credit risk is lower if there is good creditworthiness of the assets, a strong capital structure, good levels of liquidity and profitability.
Asset Ratios chosen are the following ones:
1. Loan Loss Provision to Net Interest Revenue (LLP/NIR): the ratio should be as better as lower, so we suppose a positive relationship with CDS spread; 2. Loan Loss Reserve to Non Performing Loans (LLR/NPL): the ratio should be
as better as higher, so we suppose a negative relationship with CDS spread; 3. Net Charge-Off (NCO) to Average Gross Loans (NCO/AGL): the ratio should
be as better as lower, so we suppose a positive relationship with CDS spread;
4. Impaired Loans to Equity (IL/E):the ratio should be as better as lower, so
we suppose a positive relationship with CDS spread. Capital Ratios used are the following ones:
1. Equity to Net Loans (E/NL): the ratio should be as better as higher, so we
Table 1
Summary of Hypotheses
Table 1 shows a summary of the assumed signs for the relationships between CDS spread and the ratios.
As concerns Asset Ratios: LLP/NIR is Loan Loss Provision to Net Interest Revenue; LLR/NPL is Loan Loss Reserve to Non Performing Loans, NCO/AGL is Net Charge-Off to Average Gross Loans, IL/E is Impaired Loans to Equity.
As concerns Capital Ratios: E/NL is Equity to Net Loan; LEV is Equity to Liabilities (Leverage Ratio); CF/NL is Cap Funds to Net Loans; CF/L is Cap Funds to Liabilities.
As concerns Liquid Ratios: NL/TA is Net Loans to Total Assets; NL/TDB is Net Loans to Total Deposits and Borrowing; LA/CSTF is Liquid Assets to Customer and ST Funding; LA/TDB is Liquid Assets to Total Deposits and Borrowing.
As concerns Operations Ratios: NIM is Net Interest Margin; ROAA is Return On Average Assets; ROAE is Return On Average Equity; C/I is Cost to Income Ratio.
Asset Explanatory Variable Expected Sign
LLP/NIR +
LLR/NPL –
NCO/AGL +
IL/E +
Capital Explanatory Variable Expected Sign
E/NL –
LEV –
CF/NL –
CF/L –
Liquidity Explanatory Variable Expected Sign
NL/TA +
NL/TDB +
LA/CSTF –
LA/TDB –
Operations Explanatory Variable Expected Sign
NIM –
ROAA –
ROAE –
C/I +
2. Equity to Liabilities (Leverage Ratio) ( LEV): the ratio should be as better as
higher, so we suppose a negative relationship with CDS spread;
3. Cap Funds to Net Loans (CF/NL): the ratio should be as better as higher, so
we suppose a negative relationship with CDS spread;
4. Cap Funds to Liabilities (CF/L): the ratio should be as better as higher, so
Liquidity Ratios chosen are the following ones:
1. Net Loans to Total Assets (NL/TA): this ratio should be as better as lower,
so we suppose a positive relationship with CDS spread;
2. Net Loans to Total Deposits and Borrowing (NL/TDB): this ratio should be
as better as lower, so we suppose a positive relationship with CDS spread; 3. Liquid Assets to Customer and ST Funding (LA/DSTF): this ratio should be
as better as higher, so we suppose a negative relationship with CDS spread; 4. Liquid Assets to Total Deposits and Borrowing (LA/TDB): the ratio should
be as better as higher, so we suppose a negative relationship with CDS spread.
Operations Ratios chosen are the following ones:
1. Net Interest Margin (NIM): this ratio should be as better as higher, so we
suppose a negative relationship with CDS spread;
2. Return On Average Assets (ROAA): this ratio should be as better as higher,
so we suppose a negative relationship with CDS spread;
3. Return On Average Equity (ROAE): this ratio should be as better as higher,
so we suppose a negative relationship with CDS spread;
4. Cost to Income Ratio (C/I): this ratio should be as better as lower, so we
suppose a positive relationship with CDS spread. These are the four models of regression equations:
CDSi,t = �0+ �1(LLP/NIR)i,t + �2(LLR/NPL)i,t + �3(NCO/AGL)i,t + �4(IL/E)i,t + �i
(Model 1) CDSi,t = �0+ �1(E/NL)i,t +�2 (LEV)i,t +�3 (CF/NL)i,t + �4 (CF/L)i,t + �i
(Model 2) CDSi,t = �0 +�1 (NL/TA)i,t +��2 (NL/TDB)i,t +�3(LA/DSTF)i,t +��4(LA/TDB)i,t + �i
(Model 3) CDSi,t = �0 +��1(NIM)i,t + �2(ROAA)i,t +��3(ROAE)i,t +��4(C/I)i,t + �i
(Model 4)
3.1 Sample
The yearly spreads are calculated making the average of monthly values, obtained by the mean between the highest and the lowest spread recorded each month. In particular we focus the analysis on a sample composed by a panel data of 50 banks placed on the Mediterranean Europe (Portugal, Italy, Greece, Spain, Cyprus and Malta) observed during the period of 2009-2014.2
These are the measure of positions of the CDS spreads, for the sample.
Mediterranean europe banks’ cds spreads
Min. 1st Qu. Median Mean 3rd Qu. Max.
108.0 213.0 277.0 306.9 377.2 824.0
4. THE RESULTS OF HYPOTHESES TESTING
The results obtained by Models 1, 2, 3, 4 (Table 2a), are presented as follows. As concerns the Asset Ratios, we confirm the supposed signs of the coefficients. In particular, the very significant results deal with Net Charge-Off to Gross Loans and Impaired Loans to Equity Ratio: this means that the market is concerned about
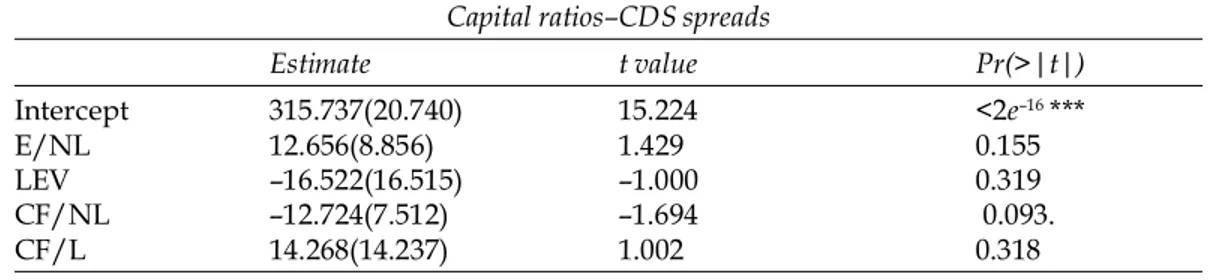
Table 2 Models results
Table 2 shows the results of the Models 1, 2, 3 and 4. The Estimate, represents the value of the intercept and of coefficients of the regression equations, the standard errors are given in parenthesis. The table also shows t– statistics, the Adjusted R–squared and the Fisher test. The levels of significance are expressed by the p–value: *,** and *** denote significance at 10%,5% and 1%.
Models results Assets ratios–CDS spreads
Estimate t value Pr( >|t|) Intercept 255.853(21.807) 11.733 < 2e–16 *** LLP/NIR 0.055(0.087) 0.635 0.526 LLR/NPL –0.065(0.206) –0.318 0.751 NCO/AGL 10.080(2.562) 3.934 0.000119 *** IL/E 0.358(0.075) 4.767 3.81e–06 *** Observations: 300 Adjusted R–squared: 0.1732
F–statistic: 10.74 on 4 and 182 DF, p–value: 7.705e–08
Capital ratios–CDS spreads
Estimate t value Pr(>|t|) Intercept 315.737(20.740) 15.224 <2e–16 *** E/NL 12.656(8.856) 1.429 0.155 LEV –16.522(16.515) –1.000 0.319 CF/NL –12.724(7.512) –1.694 0.093. CF/L 14.268(14.237) 1.002 0.318 Observations: 300 Adjusted R–squared: 0.053
F–statistic: 3.069 on 4 and 143 DF, p–value: 0.018
Liquidity ratios–CDS spreads Estimate t value Pr(>|t|) Intercept 205.014(43.438) 4.720 4.18e–06*** NL/TA 0.846(1.388) 0.610 0.543 NL/TDB 0.565(1.045) 0.541 0.589 LA/CSTF –1.425(0.605) –2.354 0.019* LA/TDB 2.103(0.906) 2.322 0.021* Observations: 300 Adjusted R–squared: 0.060
F–statistic: 4.613 on 4 and 222 DF, p–value: 0.001347
Operations ratios–CDS spreads
Estimate t value Pr(>|t|) Intercept 184.667(24.568) 7.517 1.22e–12*** NIM 27.086(5.640) 4.803 2.81e–06*** ROAA –8.680(3.302) –2.628 0.009** ROAE 0.247(0.208) 1.188 0.236 C/I 0.864(0.321) 2.690 0.008** Observations: 300 Adjusted R–squared: 0.130
F–statistic: 9.753 on 4 and 232 DF, p–value: 2.618e–07
Models results
the quality of assets in order to evaluate credit risk; this is true especially with regards to loans that can be recovered and to their relation with Equity.
Talking about the Capital Ratios, the supposed relationships are confirmed only for Leverage Ratio and Cap Funds to Net Loans : this is interesting, because of the importance of banks equity, in terms of credit risk assurance. Specifically, there’s a change of direction made by the market, with regards to Leverage Ratio in banking sector, as a good indicator of credit risk; this is consistent with recent literature (i.e. Chiaramonte, Casu 2013), that shows a more attention to this ratio in banks’ balance sheets, after the financial crisis, that is the period of our analysis. Anyway, with the exception of Cap Funds to Net Loans, all the results of the regressions for capital ratios, aren’t significant. We can suppose, that the deep speculation that has affected CDS market, especially for the Mediterranean Europe, has invalidated CDS spread in order to indicate credit risk.
As concerns Liquidity Ratios all expected signs are confirmed, except for Liquid
Assets to Total Deposits and Borrowing. Anyway this last result is significant: this
could mean that the market has considered low the banks’ riskiness in terms of liquidity, in the medium term. Instead, the other significant result, is the negative relationship between CDS spreads and Liquid Assets to Customer and ST Funding:
this is interesting, because could mean that the market has perceived a short-term liquidity during the period of the sovereign crisis, that has affected the banks of the region analyzed.
Finally looking to the Operations Ratios, the confirmed results, both significant, deal with ROAA and Cost to Income Ratios: so the market looks to assets’ banks’ profitability and to their efficiency, as good indicators in terms of creditworthiness. The positive relationship between CDS spreads and ROAE, isn’t significant; whereas the positive sign, for the Net Interest Margin, is the most significant result. The last two relationships, could be explained by the speculation in the CDS market. All these findings are confirmed by quite low Adjusted R2 for each class of
ratios; anyway there are better results for the ANOVA test, that shows quite low
p-value at the Fisher test. In particular, the better significance of Asset Ratios and
Operations Ratios, is confirmed by very low p-values (respectively 7.705e–08 and
2.618e–07 ).
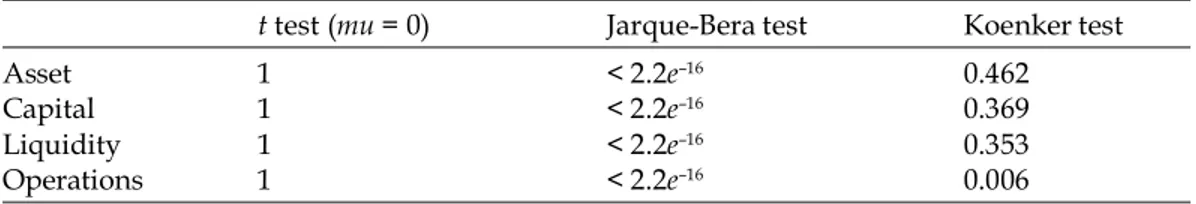
As concerns the study of the classical hypotheses of the linear model (Table 3), the analysis of the medium of the residuals is not significant, so we confirm that it’s significantly different from zero. With reference to the test of the normality of the errors, the Jarque-Bera test is significant, so the distribution of the errors isn’t normal, anyway we could conduct our studies, because of the asymptotic properties. With regard to the analysis of homoscedasticity, we make Koenker test, instead of Breusch-Pagan’s one, because the first is a robust version of the second. Specifically, the test is insignificant, so the errors are homoscedastic, as shown by quite high p-values.
5. CONCLUSIONS
The study has shown the attention of the CDS market to the quality and profitability of assets for the banking sector. It has also shown the concern for the riskiness of banks in terms of short-term liquidity, during the period of the Eurozone crisis, that has affected the Mediterranean Europe.
Table 3 Residuals analysis
Table 3 shows the p-values’ results, for the analysis of the residuals, related to Models 1, 2, 3 and 4.
t test (mu = 0) Jarque-Bera test Koenker test
Asset 1 < 2.2e–16 0.462
Capital 1 < 2.2e–16 0.369
Liquidity 1 < 2.2e–16 0.353
Table 4 The sample
Table 4 shows the sample made by the 50 banks of the Mediterranean Europe, classified by country and specialization.
Anyway, we suppose that some of our results, not significant or in contrast with the expected signs, could be invalidated by the deep speculation that has affected the CDS market of this region, during the period analyzed.
Nevertheless, we must highlight that the hypotheses made a priori on the possible relationship between CDS spread level and balance sheet indicators, cannot be considered in an absolute way. We can’t neglect the systemic nature of a banking firm and the consequent necessity to analyze its fundamentals, from a global point of view: for instance a high level of ROAE, although if at a first glance could be perceived in terms of good creditworthiness, it could, instead, derive from a very leveraged firm. At same time balance -sheet policies influence the goodness of the information, given by the items.
This research could be developed in future studies, especially in terms of an in-depth analysis of the quality of bank’s assets and short-term liquidity during the sovereign crisis. There could be also be a detailed study of the speculation in the banks’ CDS market in Mediterranean Europe, adding market variables, whose relevance has been demonstrated by the recent literature.
Notes
1. Other interesting results that emerge from Chiaramonte and Casu’s work, are the confirmed negative relationship between ROE and CDS spread over all the sample period and the surprising relationship between the latter and the Tier 1 ratio: instead of a negative relationship as could be expected, there is a positive one, that increases during the crisis: according with the authors, this fact shows that the market considers improper Tier 1 ratio, in order to size up banks’ riskiness. Furthermore, in this study, emerges the significance of the indicator of the quality of the assets portfolio, as predictor of a default. Similar findings, related to the low explanatory power of leverage ratio for the banking sector, are shown by Kalemli-Ozcan et al. (2011).
2. Both CDS spreads and ratios data, are provided from database Bankscope. We refer the
study to banks indicated by the database as U1 or U2, namely firms that aren’t holdings. The software used for calculi is R studio (i.e. IDE for R)
References
AA.VV. (2009). Credit Default Swaps and counterparty risk, European Central Bank, August. Adrian T., Shin H. S. (2010). Liquidity and leverage, in Journal of Financial Intermediation 19, pp.
418-437.
Angelini E. (2012),. Credit Default Swaps (CDS) and their Role in the Credit Risk Market, in International Journal of Academic Research in Business and Social Sciences, Vol. 2, No. 1, January. Annaert J., De Ceuster M., Van Roy P., Vespro C. (2010). What determines euro area bank CDS
spreads?, National Bank of Belgium, Working Paper Research, No 190, May.
Bonfim D. (2009). Credit risk drivers: Evaluating the contribution of firm level information and of macroeconomic dynamics, in Journal of Banking and Finance 33, pp.281–299
Chiaramonte L., Casu B. (2013). The determinants of bank CDS spreads: evidence from the financial crisis, in The European Journal of Finance, Vol. 19, No 9, pp. 861-887.
Coro F., Dufour A., Varotto S., (2013). Credit and liquidity components of corporate CDS spreads, in Journal of Banking and Finance, 12/2013.
De Vincentiis P. (2014). Lo status di banca sistemica gioca un ruolo significativo? Una verifica empirica sui Cds delle maggiori banche europee, in Bancaria Special Issue, N° 12/2014
Di Cesare A., Guazzarotti G. (2010). An analysis of the determinants of credit default swap spread changes before and during the subprime financial turmoil, Banca D’’Italia, Working papers, March Fender I., McGuire P. (2010). Bank structure, funding risk and the transmission of shocks countries:
concepts and measurement, in BIS Quarterly Review, September.
Fulli-Lamaire N. (2013). A tale of two Eurozones: banks’ funding, sovereign risk and unconventional monetary policies, Amundi Asset Management, University of Paris, August.
Giuliani F. (2012). CDS: Liquidity Shortage or Structural Insolvency?, Working Paper Series, University of Bologna, March 10.
Graf F. (2011). Leverage, Profitability and Risk of Banks-An empirical Analysis, Working Paper, University of Konstanz, 4, August.
Hewavitharana D., Rahmqvist J. (2011). Determinants of Credit Default Swap Spreads:a regime-shifting approach, Departement of Business Administration, Lund University.
Hull J., Predescu M., White A. (2004). The relationship between Credit Default Swap spreads, bond yields, and credit rating announcements, Joseph L. Rotman School of Management, University of Toronto, January.
Kalemli-Ozcan S., Soresen B., Yesiltas S. (2011). Leverage across firms, banks and countries, Working Paper 17354, National Bureau of Economic Research, August.
Imbierowicz B., Rauch C. (2014). The relationship between liquidity risk and credit risk in banks, in Journal of Banking and Finance 40, pp. 242-256.
Merton R.C. (1974). On the Pricing of Corporate Debt: The Risk Structure of Interest Rates, in Journal of Finance Vol. 29, No 2, pp. 449-470.
Panetta F. et al. (2011). The impact of sovereign credit risk on bank funding conditions, CGFS Papers, Bank for International Settlements, April.
Raunig B., Scheicher M. (2009). Are Banks Different? Evidence from the CDS market, in Workshop on Challenges in banking research, May.
Subrahmanyam M. G., Tang D. Y., Wang S. Q. (2012), Does the tail wag the dog? The effect of credit default swaps on credit risk, HKIMR Working Paper, No.29/2012.
van Rixtel A., Gasperini G. (2013), Financial crises and bank funding: recent experience in the euro area, BIS Working Papers, March.