Altered multisensory temporal
integration in obesity
Federica Scarpina
1,2, Daniele Migliorati
3, Paolo Marzullo
2,4, Alessandro Mauro
1,2,
Massimo Scacchi
2,5& Marcello Costantini
3,6Eating is a multisensory behavior. The act of placing food in the mouth provides us with a variety of sensory information, including gustatory, olfactory, somatosensory, visual, and auditory. Evidence suggests altered eating behavior in obesity. Nonetheless, multisensory integration in obesity has been scantily investigated so far. Starting from this gap in the literature, we seek to provide the first comprehensive investigation of multisensory integration in obesity. Twenty male obese participants and twenty male healthy-weight participants took part in the study aimed at describing the multisensory temporal binding window (TBW). The TBW is defined as the range of stimulus onset asynchrony in which multiple sensory inputs have a high probability of being integrated. To investigate possible multisensory temporal processing deficits in obesity, we investigated performance in two multisensory audiovisual temporal tasks, namely simultaneity judgment and temporal order judgment. Results showed a wider TBW in obese participants as compared to healthy-weight controls. This holds true for both the simultaneity judgment and the temporal order judgment tasks. An explanatory hypothesis would regard the effect of metabolic alterations and low-grade inflammatory state, clinically observed in obesity, on the temporal organization of brain ongoing activity, which one of the neural mechanisms enabling multisensory integration.
When we eat, we are bombarded by multisensory information, including visual, auditory, tactile, gustatory and olfactory1 which need to be effectively integrated by our brain. Such multisensory integration deeply impacts on
our appreciation of food2,3. Multisensory integration refers to the brain mechanism by which when two or more
sensory stimuli occur at the same time and place4,5, they are typically bounded into a single percept, and detected
more accurately than either stimuli alone6. Recently, there has been increasing interest in studying multisensory
integration, and under what circumstances this process takes place. This is mostly due to the large impact multi-sensory integration has on how we perceive stimuli in the environment, including food2. For instance, Zampini
and Spence7 investigated whether the perception of the crispness and staleness of potato chips was affected by
the sound produced during the biting action. Results showed that varying the loudness or the frequency compo-sition of the auditory feedback elicited during the biting action, altered the perception of both the crispness and staleness8. Similarly, Slocombe and colleagues9 investigated whether the perception of taste components within
flavour could be altered by multisensory manipulations in texture. They asked participants to rate the sourness, sweetness and bitterness of a solid food substance, which was manipulated in texture. Results showed that a rough-textured foodstuff was rated as sourer than an otherwise identical smooth-textured foodstuff. What is more, eating does not only involve the integration of exteroceptive information, but also information from within the body, i.e. interoception. Interoception, defined as the sense of the physiological condition of the body, is a ubiquitous information channel used to represent the internal state of our body. For instance, fullness sensation in the stomach prompts the act of stop eating.
Obese patients have often disturbed eating behaviours10–12, considered as non-adjustable primary factor to
being overweight13. Differences in food intake are influenced by individual characteristics that could magnify or
minimize the genetic, physiological, environmental, psychosocial, cultural and cognitive risks10,14–16 for obesity.
Given the role of multisensory integration in eating behavior, and given the alterations of eating behavior in obesity10–12, we seek to provide the first comprehensive investigation of multisensory integration in obesity. 1“Rita Levi Montalcini” Department of Neuroscience, University of Turin, Turin, Italy. 2I.R.C.C.S. Istituto Auxologico
Italiano Ospedale San Giuseppe, Piancavallo, Italy. 3Department of Neuroscience, Imaging and Clinical Science,
University G. d’Annunzio, Chieti, Italy. 4Department of Translational Medicine, Università del Piemonte Orientale
‘A. Avogadro’, Novara, Italy. 5Department of Clinical Sciences and Community Health, University of Milan, Milan,
Italy. 6Centre for Brain Science, Department of Psychology, University of Essex, UK. Correspondence and requests
for materials should be addressed to F.S. (email: [email protected]) or M.C. (email: [email protected]) Received: 27 January 2016
Accepted: 03 June 2016 Published: 21 June 2016
OPEN
Indeed only recently preliminary results were reported by Wan and colleagues17. They showed that obese people
tend to respond more slowly to multisensory stimulation in an audiotactile discrimination task than underweight people.
Several factors impact multisensory integration. One such factor is the temporal relationships of the paired stimuli4,18. Accordingly, the more temporally coincident the stimuli, the larger the multisensory integration
gen-erated by their pairing18. While temporal synchrony generally results in a high degree of multisensory integration,
paired stimuli do not need to be precisely synchronous in order to generate significant neural and perceptual changes. Indeed, multisensory integration occurs over a temporal interval called multisensory temporal binding window19 (TBW), or temporal window of integration20. TBW is defined as the range of stimulus-onset
asynchro-nies (SOAs) in which multiple sensory inputs have a high probability of being integrated and altering responses21.
TBW represents a measure of the effectiveness of multisensory integration mechanisms21,22. Previous studies have
indeed shown that alterations of the TBW are strongly related to high-level cognitive impairments, including language and communications19,22.
Several experimental paradigms have been developed to assess the TBW. Two such experimental paradigms are the simultaneity judgment task (SJ) and the temporal order judgment task (TOJ)21,23. In the SJ, pairs of
mul-tisensory stimuli (e.g. auditory and visual) are presented at different SOAs and participants are required to judge whether the stimuli were presented simultaneously or successively21,23. In the TOJ, participants are presented
with a pair of stimuli at varying SOAs and required to judge which stimulus was presented first or second24,25. In
this study we evaluated the TBW in obese participants and healthy weight control subjects using both the SJ and TOJ task. We used both tasks as they imply different perceptual and/or cognitive operations. Indeed, while SJ task requires a low-level analysis of stimuli in terms of temporal relationships, TOJ task implies additional processing steps following the lower-level analyses of temporal relationships. Despite such dissimilarity, the two tasks share a common underlying process responsible for the ascription of temporal identity at a stimuli26. Such common
characteristic allows us to genuinely measure temporal features of multisensory integration in obesity.
Methods
Participants.
Twenty male obese participants and twenty male healthy-weight participants took part in the study. All participants were right-handed. All obese participants were recruited during the first week of a diag-nostic recovery in the IRCCS Istituto Auxologico Italiano–Ospedale San Giuseppe. The healthy-weight group was recruited outside the clinical institute.The study was approved by the ethical committee of the IRCCS Istituto Auxologico Italiano and it was per-formed in compliance with Declaration of Helsinki’s ethical principles (World Medical Association, 1991). All participants were volunteers who gave informed written consent, were free to withdraw at will and were naïve to the rationale of the experiment.
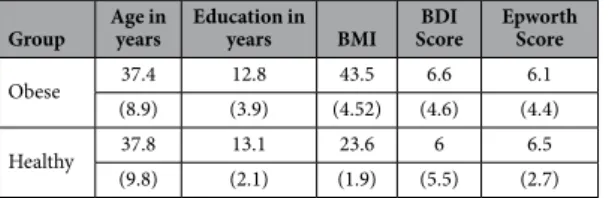
Demographic and clinical data are reported in Table 1. The two groups were comparable in terms of Age (t(38) = − 0.141; p = 0.889; 95% CI [− 5.34; 6.14]) and Education (t(38) = 0.346; p = 0.731; 95% CI [− 1.69; 2.39]). As expected, obese people showed a significant higher body mass index (BMI) than healthy participants (t(38) = 12.37; p < 0.001; 95% CI [− 22.09; − 17.64]).
The Italian version27 of the Epworth sleepiness scale was administered to the participants in order to assess
subjective average sleep propensity during real-life situations28. The two groups reported similar scores at this
questionnaire (t(38) = 0.339; p = 0.736; 95% CI [− 1.98; 2.78]). Moreover, all participants were assessed by the Italian version29 of Beck Depression Inventory30 about the presence of depressive symptoms in every-day life.
Also in this case, the two groups reported similar scores at this questionnaire t(38) = − 0.402; p = 0.69; 95% CI [− 3.92; − 2.62].
Stimuli.
All stimuli were presented using OpenSesame 2.9.631. Visual stimuli consisted of a white ringcircum-scribing a visual fixation cross on a black background and were 1.8 cm in diameter or 1.7° of visual angle. They were presented at a distance of approximately 60 cm from the participants and lasted 30 ms. Auditory stimuli con-sisted of a 3.500 Hz pure tone. They were presented binaurally via noise-cancelling headphones and lasted 30 ms.
Tasks.
Participants performed the Simultaneity Judgment Task (SJ) and the Temporal Order Judgment Task (TOJ) in separate sessions. In both tasks (see Fig. 1), visual and auditory stimuli were delivered sequentially with one of the following Stimulus Onset Asynchronies (SOAs): ± 50, ± 100, ± 150, ± 200, ± 250, ± 300, ± 350, ± 400. Negative SOAs indicate that the auditory stimulus is presented first (auditory leading trials), whereas positive SOAs indicate that the visual stimulus is presented first (visual leading trials). In the SJ task, participants reported whether the auditory and visual stimuli were presented at the same or different times. In the TOJ task, participantsGroup Age in years Education in years BMI ScoreBDI Epworth Score
Obese 37.4 12.8 43.5 6.6 6.1
(8.9) (3.9) (4.52) (4.6) (4.4)
Healthy 37.8 13.1 23.6 6 6.5
(9.8) (2.1) (1.9) (5.5) (2.7)
Table 1. Demographic and clinical data for the obese participants and the healthy-weight participants. Means and standard deviations (in brackets) are reported. Age and Education are reported in years; BMI = body mass index express in units of kg/m2; BDI = Beck Depression Inventory.
reported which stimulus came first. The intertrial interval (ITI) ranged between 2000 and 3000 ms. The presenta-tion of the stimuli was pseudo-randomized.
Participants performed two blocks for each task. In each block, each SOA was presented 16 times for a total of 256 trials per block. Overall participants completed 512 trials for the SJ task and 512 trials for TOJ task. Task order was counterbalanced across participants.
Procedure.
Participants were seated in a dimly lit room with their corporeal midline aligned with a fixation point located 60 cm from the plane of their eyes. Participants rested their right and left index fingers on two response buttons located on a Table. Each hand was in its homonymous hemispace. Participants were instructed to fixate toward a fixation cross at all times. Participants provided their answers by pressing a response button with the right or the left index finger, with the button representation (synchronous/asynchronous or auditory-first/ visual-first) being balanced across blocks.Data Analysis.
To calculate the individual’s TBWs in the SJ task, we first computed the percentage of simul-taneous responses across all SOAs for each participant. The observed distribution of responses was fitted to a Gaussian function32,33 using the fit function implemented in MATLAB (fit type: gauss1). The peak of this curve isreferred to as the point of subjective simultaneity (PSS). It is assumed that, at this particular SOA, the information from the different modalities is perceived as being maximally simultaneous. Another measure that can be derived from this curve is its standard deviation. The standard deviation is reflected in the width of the curve and is taken as the window of temporal integration (i.e. Temporal Binding Window, TBW), because it represents the range of SOAs at which the brain treats the two sensory information as occurring simultaneously32.
For the TOJ task, data analysis was as follows: first we calculated a rate of visual-first responses with each SOA. Then, a single psychometric function was fitted to the response rates across all SOAs, using the glmfit function in MATLAB, so as to determine the just noticeable difference (JND) for each group. The JND was defined as half of the difference between the two x values for which the psychometric function had a y value of 25% and 75%32.
Results
Simultaneity judgment task.
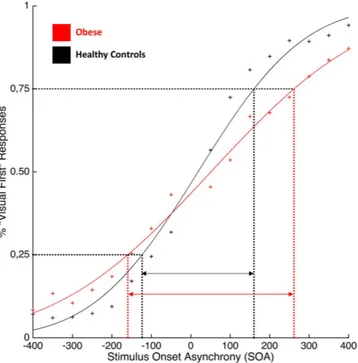
Data from one obese participant were excluded from the analysis because of a bad fitting of the Gaussian function, thus making impossible to define his TBW. Data from both groups were normally distributed (Shapiro-Wilk test, p = 0.33), hence parametric statistics were computed. Data were ana-lyzed using an independent sample t-test. The results showed a wider TBW in obese participants (Mean = 663 ms, STD = 128 ms) as compared to healthy-weight controls (Mean = 496 ms, STD = 149; t(37) = − 3.73; p < 0.001; 95% CI [− 257; − 76]) (See Fig. 2).Temporal order judgment task.
JND values violated normality (Shapiro-Wilk test, p = 0.006), hence data were log-transformed to obtain a normal distribution. The JND values were analyzed using an independent sam-ple t-test. The results showed a higher JND in obese participants (Mean = 196 ms; STD = 90 ms) as compared to healthy-weight controls (Mean = 129 ms; STD = 75 ms; t(1, 38) = − 3,18; p < 0.003; 95% CI [− 0327; − 0.07]) (See Fig. 3).Discussion
Eating behavior is contributed by almost all our senses. Given the alteration of eating behavior in obesity, we predicted alterations in multisensory integration in obesity. To test our hypothesis we investigated the temporal characteristics of audiovisual integration in obese participants. We found that the Temporal Binding Window (TBW), conceived as a measure of multisensory integration effectiveness21, is markedly wider in obese
partici-pants as compared to healthy-weight control participartici-pants. Figure 1. Graphical representation of stimuli presentation.
Human ability to integrate sensory stimuli from different sources is essential in order to generate a multitude of brain functions34 and complex adaptive behaviors21, and it affects how we perceive the world35. Multisensory
integration determines the span-life nature of human cognition36 as it promotes heightened attention,
percep-tual processing and memory in adults as well as in infants37. Hence, alteration in this process may cascade into
high-level cognitive deficits, well described in obese people38–45.
Most intriguingly, multisensory integration plays a pivotal role in shaping the way in which we represent and experience our body, namely our body representation46,47. Several lines of evidence support this idea. For
instance, Ionta and colleagues48 showed that impaired information from on sensory channel deteriorates
mul-tisensory body representation. Preliminary results suggest altered body representation in obesity45,49–55. It is
entirely possible that these alterations are not only due to top-down influence of psychological components56,57,
but also to bottom-up sensory integration deficits. Preliminary results about disturbances in body representation were reported in other eating disorders such as in anorexia nervosa58,59, in which an overestimation of body
Figure 2. Group mean Temporal Binding Windows defined using the Simultaneity Judgment Task (SJ). Red curve represents obese participants, black curve represents healthy-weight controls. Symbols represent the raw, unfitted data.
Figure 3. Group mean JND values defined using the Temporal Order Judgment (TOJ) task. Red curve represents obese participants, black curve represents healthy-weight controls. Symbols represent the raw, unfitted data.
size was observed. Future studies should investigate the possible relationship between eating disorders and body representation.
Possibly one might argue that multisensory deficits in obesity could be traced to altered unisensory percep-tion. Research indeed suggests altered perception of painful60–62, vibratory and thermal stimuli63, along with
altered perception of information from the inner body, including gastric sensorimotor functions64 in obese
peo-ple. However, these findings are controversial. For instance, Deore and colleagues65 reported intact auditory
per-ception in a simple detection task in obese participants, while Wan and colleagues17 reported equal ability to
detect audio or tactile stimuli in obese and healthy-weigh participants. Hence, research on unisensory processing in obesity has generated conflicting results. Hence we are inclined to believe that multisensory deficits in obesity cannot be entirely attributed to unisensory deficits.
How can we account for altered multisensory integration in obese people, as revealed by a wider TBW? The hypothesis we put forward pertains the effect of inflammation on the brain oscillatory activity, which is the neu-ral mechanism enabling multisensory integration. Although our hypothesis is highly speculative, it seems to be supported by two lines of evidence. First, oscillatory activity of the brain, far from being mere noise, represents an instrument that can be used in sensory processing66,67 and multisensory integration. Second, obesity is
charac-terized by altered neural oscillatory activity68. For Instance, Dubbelink and colleagues68 recorded neural
oscilla-tory activity in obese participants and normal weight controls during eyes-closed resting-state condition. Results showed altered neural oscillatory activity in delta (0.5–4 Hz) and beta (13–30 Hz) frequency bands in obese as compare to normal weight controls.
Interestingly, high levels of pro-inflammatory cytokines, as often observed in obese people, impact on brain oscillatory activity. Such an effect is likely to reflect alterations of the excitation/inhibition balance, which is con-tributed by GABAergic interneurons69. Empirical studies have indeed shown that pro-inflammatory cytokines
increase the protein expression of GABA transporter type 1 and 3, which are the two important subtypes of GATs responsible for the regulation of extracellular GABA levels in the brain. In particular, GAT1 transporter removes GABA from the synaptic cleft70, while GAT3 mediates uptake of GABA from the synaptic cleft by surrounding
glial cells71. Overall, the removal of GABA from the synaptic cleft is likely to decrease the inhibitory effect of
GABA, altering neural oscillatory activity72.
If our argument is at stake, one may formulate interesting hypotheses on the effect of inflammation on mul-tisensory processing. For instance it could be hypothesized that participants with ongoing inflammation show altered temporal window of integration, as measured with a simultaneity judgment task, and altered perception of multisensory illusions73.
We are aware of the speculative nature of our hypothesis, and that a number of factors play a role in the pro-cesses here described. For instance, it must be noticed that the role of oscillatory activity in multisensory integra-tion is still a matter of debate. It might be argued that altered stimulus-driven neural response, rather than altered oscillatory activity in obese participants might account for our results. Such an explanation is not at odds with our proposal. Stimulus-driven neural response and oscillatory activity are tightly linked to each other, so that the former depends on the latter at the time the stimulus impinges on brain oscillatory activity74.
In conclusion, this study suggests that temporal integration of auditory and visual stimuli is altered in obe-sity. Many basic questions regarding the relationship between obesity and multisensory integration as possible consequence effect on cognition remain unanswered. Obesity is one of the most significant contemporary health concern characterized by an unhealthy body, such as chronic inflammation, and an unhealthy mind, such as cognitive dysfunctions75. Furthermore recognizing possible differences in multisensory abilities in obesity would
have several important applications not only in terms of more specific remediation strategies for cognitive diffi-culties, but also for the future design and implementation of healthy assistance programs and devices based on multisensory perception76.
References
1. Rolls, E. T. Taste, olfactory, and food reward value processing in the brain. Prog Neurobiol 127–128, 64–90, doi: 10.1016/j. pneurobio.2015.03.002 (2015).
2. Spence, C. Multisensory flavor perception. Cell 161, 24–35, doi: 10.1016/j.cell.2015.03.007 (2015).
3. Wallace, M. T. Multisensory Perception: The Building of Flavor Representations. Curr Biol 25, R986–988, doi: 10.1016/j. cub.2015.09.009 (2015).
4. Meredith, M. A. & Stein, B. E. Visual, auditory, and somatosensory convergence on cells in superior colliculus results in multisensory integration. J Neurophysiol 56, 640–662 (1986).
5. Meredith, M. A. & Stein, B. E. Spatial factors determine the activity of multisensory neurons in cat superior colliculus. Brain Res 365, 350–354 (1986).
6. Stein, B. E. & Stanford, T. R. Multisensory integration: current issues from the perspective of the single neuron. Nat Rev Neurosci 9, 255–266, doi: 10.1038/nrn2331 (2008).
7. Zampini, M. & Spence, C. The role of auditory cues in modulating the perceived crispness and staleness of potato chips. Journal of
Sensory Studies 19, 347–363, doi: 10.1111/j.1745-459x.2004.080403.x (2004).
8. Auvray, M. & Spence, C. The multisensory perception of flavor. Conscious Cogn 17, 1016–1031, doi: S1053-8100(07)00065-7 (2008). 9. Slocombe, B. G., Carmichael, D. A. & Simner, J. Cross-modal tactile-taste interactions in food evaluations. Neuropsychologia, doi:
S0028-3932(15)30096-8 (2015).
10. Sarwer, D. B., Dilks, R. J. & West-Smith, L. Dietary intake and eating behavior after bariatric surgery: threats to weight loss maintenance and strategies for success. Surg Obes Relat Dis 7, 644–651, doi: 10.1016/j.soard.2011.06.016 (2011).
11. van Hout, G. C., Verschure, S. K. & van Heck, G. L. Psychosocial predictors of success following bariatric surgery. Obes Surg 15, 552–560, doi: 10.1381/0960892053723484 (2005).
12. Wardle, J. Eating behaviour and obesity. Obes Rev 8 Suppl 1, 73–75, doi: 10.1111/j.1467-789X.2007.00322.x (2007).
13. da Silva, S. S. & da Costa Maia, A. Obesity and treatment meanings in bariatric surgery candidates: a qualitative study. Obes Surg 22, 1714–1722, doi: 10.1007/s11695-012-0716-y (2012).
14. Blundell, J. E. et al. Resistance and susceptibility to weight gain: individual variability in response to a high-fat diet. Physiol Behav 86, 614–622, doi: 10.1016/j.physbeh.2005.08.052 (2005).
15. French, S. A., Epstein, L. H., Jeffery, R. W., Blundell, J. E. & Wardle, J. Eating behavior dimensions. Associations with energy intake and body weight. A review. Appetite 59, 541–549, doi: 10.1016/j.appet.2012.07.001 (2012).
16. Heitmann, B. L. et al. Obesity: lessons from evolution and the environment. Obes Rev 13, 910–922, doi: 10.1111/j.1467-789X.2012.01007.x (2012).
17. Wan, X., Spence, C., Mu, B., Zhou, X. & Ho, C. Assessing the benefits of multisensory audiotactile stimulation for overweight individuals. Exp Brain Res 232, 1085–1093, doi: 10.1007/s00221-013-3792-x (2014).
18. Meredith, M. A., Nemitz, J. W. & Stein, B. E. Determinants of multisensory integration in superior colliculus neurons. I. Temporal factors. J Neurosci 7, 3215–3229 (1987).
19. Wallace, M. T. & Stevenson, R. A. The construct of the multisensory temporal binding window and its dysregulation in developmental disabilities. Neuropsychologia 64C, 105–123, doi: 10.1016/j.neuropsychologia.2014.08.005 (2014).
20. Colonius, H. & Diederich, A. Multisensory interaction in saccadic reaction time: a time-window-of-integration model. J Cogn
Neurosci 16, 1000–1009, doi: 10.1162/0898929041502733 (2004).
21. Stevenson, R. A. & Wallace, M. T. Multisensory temporal integration: task and stimulus dependencies. Exp Brain Res 227, 249–261, doi: 10.1007/s00221-013-3507-3 (2013).
22. Stevenson, R. A. et al. Multisensory temporal integration in autism spectrum disorders. J Neurosci 34, 691–697, doi: 10.1523/ JNEUROSCI.3615-13.2014 (2014).
23. Zampini, M., Guest, S., Shore, D. I. & Spence, C. Audio-visual simultaneity judgments. Percept Psychophys 67, 531–544 (2005). 24. Shore, D. I., Spence, C. & Klein, R. M. Visual prior entry. Psychol Sci 12, 205–212 (2001).
25. Zampini, M., Shore, D. I. & Spence, C. Audiovisual temporal order judgments. Exp Brain Res 152, 198–210, doi: 10.1007/s00221-003-1536-z (2003).
26. Vatakis, A., Navarra, J., Soto-Faraco, S. & Spence, C. Audiovisual temporal adaptation of speech: temporal order versus simultaneity judgments. Exp Brain Res 185, 521–529, doi: 10.1007/s00221-007-1168-9 (2008).
27. Vignatelli, L. et al. Italian version of the Epworth sleepiness scale: external validity. Neurol Sci 23, 295–300, doi: 10.1007/ s100720300004 (2003).
28. Johns, M. W. A new method for measuring daytime sleepiness: the Epworth sleepiness scale. Sleep 14, 540–545 (1991). 29. Sica, C. & Ghisi, M. In Leading-edge psychological tests and testing (ed M. A. Lange) 27–50 (Nova Science Publishers, 2007). 30. Beck, A. T., Ward, C. H., Mendelson, M., Mock, J. & Erbaugh, J. An inventory for measuring depression. Arch Gen Psychiatry 4,
561–571 (1961).
31. Mathot, S., Schreij, D. & Theeuwes, J. OpenSesame: an open-source, graphical experiment builder for the social sciences. Behav Res
Methods 44, 314–324, doi: 10.3758/s13428-011-0168-7 (2012).
32. Vroomen, J. & Keetels, M. Perception of intersensory synchrony: a tutorial review. Atten Percept Psychophys 72, 871–884, doi: 10.3758/APP.72.4.871 (2010).
33. Meredith, M. A. & Stein, B. E. Interactions among converging sensory inputs in the superior colliculus. Science 221, 389–391 (1983). 34. Hari, R., Levanen, S. & Raij, T. Timing of human cortical functions during cognition: role of MEG. Trends Cogn Sci 4, 455–462
(2000).
35. Koelewijn, T., Bronkhorst, A. & Theeuwes, J. Attention and the multiple stages of multisensory integration: A review of audiovisual studies. Acta Psychol (Amst) 134, 372–384, doi: 10.1016/j.actpsy.2010.03.010 (2010).
36. Bremner, A. J. & Spence, C. Unimodal experience constrains while multisensory experiences enrich cognitive construction.
Behavioral and Brain Sciences 31, 335–336, doi: 10.1017/S0140525X0800410X (2008).
37. Dionne-Dostie, E., Paquette, N., Lassonde, M. & Gallagher, A. Multisensory integration and child neurodevelopment. Brain Sci 5, 32–57, doi: 10.3390/brainsci5010032 (2015).
38. Kanaya, A. M. et al. Total and regional adiposity and cognitive change in older adults: The Health, Aging and Body Composition (ABC) study. Arch Neurol 66, 329–335, doi: 10.1001/archneurol.2008.570 (2009).
39. Sabia, S., Kivimaki, M., Shipley, M. J., Marmot, M. G. & Singh-Manoux, A. Body mass index over the adult life course and cognition in late midlife: the Whitehall II Cohort Study. Am J Clin Nutr 89, 601–607, doi: 10.3945/ajcn.2008.26482 (2009).
40. Singh-Manoux, A. et al. Obesity phenotypes in midlife and cognition in early old age: the Whitehall II cohort study. Neurology 79, 755–762, doi: 10.1212/WNL.0b013e3182661f63 (2012).
41. van den Berg, E., Kloppenborg, R. P., Kessels, R. P., Kappelle, L. J. & Biessels, G. J. Type 2 diabetes mellitus, hypertension, dyslipidemia and obesity: A systematic comparison of their impact on cognition. Biochim Biophys Acta 1792, 470–481, doi: 10.1016/j.bbadis.2008.09.004 (2009).
42. Gunstad, J. et al. Elevated body mass index is associated with executive dysfunction in otherwise healthy adults. Compr Psychiatry 48, 57–61, doi: 10.1016/j.comppsych.2006.05.001 (2007).
43. Luchsinger, J. A. & Gustafson, D. R. Adiposity and Alzheimer’s disease. Curr Opin Clin Nutr Metab Care 12, 15–21, doi: 10.1097/ MCO.0b013e32831c8c71 (2009).
44. Prickett, C., Brennan, L. & Stolwyk, R. Examining the relationship between obesity and cognitive function: a systematic literature review. Obes Res Clin Pract 9, 93–113, doi: 10.1016/j.orcp.2014.05.001 (2015).
45. Scarpina, F., Castelnuovo, G. & Molinari, E. Tactile mental body parts representation in obesity. Psychiatry Res 220, 960–969, doi: 10.1016/j.psychres.2014.08.020 (2014).
46. Blanke, O. Multisensory brain mechanisms of bodily self-consciousness. Nat Rev Neurosci 13, 556–571, doi: 10.1038/nrn3292 (2012).
47. Ehrsson, H. H. The concept of body ownership and its relation to multisensory integration. 775–792 (MIT Press, 2012).
48. Ionta, S. et al. Spinal cord injury affects the interplay between visual and sensorimotor representations of the body. Sci Rep 6, 20144, doi: 10.1038/srep20144 (2016).
49. Bell, C., Kirkpatrick, S. W. & Rinn, R. C. Body image of anorexic, obese, and normal females. J Clin Psychol 42, 431–439 (1986). 50. Collins, J. K. et al. Variability in body shape perception in anorexic, bulimic, obese, and control subjects. International Journal of
Eating Disorders 6, 633–638, doi: 10.1002/1098-108x(198709)6:5< 633::aid-eat2260060506> 3.0.co;2-u (1987).
51. Docteur, A., Urdapilleta, I., Defrance, C. & Raison, J. Body perception and satisfaction in obese, severely obese, and normal weight female patients. Obesity (Silver Spring) 18, 1464–1465, doi: 10.1038/oby.2009.418 (2010).
52. Garner, D. M., Garfinkel, P. E., Stancer, H. C. & Moldofsky, H. Body image disturbances in anorexia nervosa and obesity. Psychosom
Med 38, 327–336 (1976).
53. Glucksman, M. L. & Hirsch, J. The response of obese patients to weight reduction. 3. The perception of body size. Psychosom Med 31, 1–7 (1969).
54. Schwartz, M. B. & Brownell, K. D. Obesity and body image. Body Image 1, 43–56, doi: 10.1016/S1740-1445(03)00007-X (2004). 55. Valtolina, G. G. Body-size estimation by obese subjects. Percept Mot Skills 86, 1363–1374, doi: 10.2466/pms.1998.86.3c.1363 (1998). 56. Lo Coco, G., Salerno, L., Bruno, V., Caltabiano, M. L. & Ricciardelli, L. A. Binge eating partially mediates the relationship between
body image dissatisfaction and psychological distress in obese treatment seeking individuals. Eat Behav 15, 45–48, doi: 10.1016/j. eatbeh.2013.10.006 (2014).
57. McElroy, S. L. et al. Are mood disorders and obesity related? A review for the mental health professional. J Clin Psychiatry 65, 634–651, quiz 730 (2004).
58. Keizer, A. et al. Tactile body image disturbance in anorexia nervosa. Psychiatry Res 190, 115–120, doi: 10.1016/j.psychres.2011.04.031 (2011).
59. Gaudio, S., Brooks, S. J. & Riva, G. Nonvisual multisensory impairment of body perception in anorexia nervosa: a systematic review of neuropsychological studies. PLoS One 9, e110087, doi: 10.1371/journal.pone.0110087 (2014).
60. Hitt, H. C., McMillen, R. C., Thornton-Neaves, T., Koch, K. & Cosby, A. G. Comorbidity of obesity and pain in a general population: results from the Southern Pain Prevalence Study. J Pain 8, 430–436, doi: 10.1016/j.jpain.2006.12.003 (2007).
61. Peltonen, M., Lindroos, A. K. & Torgerson, J. S. Musculoskeletal pain in the obese: a comparison with a general population and long-term changes after conventional and surgical obesity treatment. Pain 104, 549–557 (2003).
62. Ray, L., Lipton, R. B., Zimmerman, M. E., Katz, M. J. & Derby, C. A. Mechanisms of association between obesity and chronic pain in the elderly. Pain 152, 53–59, doi: 10.1016/j.pain.2010.08.043 (2011).
63. Miscio, G. et al. Obesity and peripheral neuropathy risk: a dangerous liaison. J Peripher Nerv Syst 10, 354–358, doi: 10.1111/j.1085-9489.2005.00047.x (2005).
64. Park, M. I. & Camilleri, M. Gastric motor and sensory functions in obesity. Obes Res 13, 491–500, doi: 10.1038/oby.2005.51 (2005). 65. Deore, D. N., Surwase, S. P., Masroor, S., Khan, S. T. & Kathore, V. A Cross Sectional Study on the Relationship Between the Body
Mass Index (BMI) and the Audiovisual Reaction Time (ART). J Clin Diagn Res 6, 1466–1468, doi: 10.7860/JCDR/2012/4440.2534 (2012).
66. Buzsaki, G. & Draguhn, A. Neuronal oscillations in cortical networks. Science 304, 1926–1929, doi: 10.1126/science.1099745 (2004). 67. Stefanics, G. et al. Phase entrainment of human delta oscillations can mediate the effects of expectation on reaction speed. J Neurosci
30, 13578–13585, doi: 10.1523/JNEUROSCI.0703-10.2010 (2010).
68. Olde Dubbelink, K. T. et al. Increased resting-state functional connectivity in obese adolescents; a magnetoencephalographic pilot study. PLoS One 3, e2827, doi: 10.1371/journal.pone.0002827 (2008).
69. Lozano-Soldevilla, D., ter Huurne, N., Cools, R. & Jensen, O. GABAergic modulation of visual gamma and alpha oscillations and its consequences for working memory performance. Curr Biol 24, 2878–2887, doi: 10.1016/j.cub.2014.10.017 (2014).
70. Hirunsatit, R. et al. Twenty-one-base-pair insertion polymorphism creates an enhancer element and potentiates SLC6A1 GABA transporter promoter activity. Pharmacogenet Genomics 19, 53–65, doi: 10.1097/FPC.0b013e328318b21a (2009).
71. Zhou, Y. & Danbolt, N. C. GABA and Glutamate Transporters in Brain. Front Endocrinol (Lausanne) 4, 165, doi: 10.3389/ fendo.2013.00165 (2013).
72. Gonzalez-Burgos, G. & Lewis, D. A. GABA neurons and the mechanisms of network oscillations: implications for understanding cortical dysfunction in schizophrenia. Schizophr Bull 34, 944–961, doi: 10.1093/schbul/sbn070 (2008).
73. Finotti, G. & Costantini, M. Multisensory body representation in autoimmune diseases. Sci Rep 6, 21074, doi: 10.1038/srep21074 (2016).
74. Scheeringa, R., Mazaheri, A., Bojak, I., Norris, D. G. & Kleinschmidt, A. Modulation of visually evoked cortical FMRI responses by phase of ongoing occipital alpha oscillations. J Neurosci 31, 3813–3820, doi: 10.1523/JNEUROSCI.4697-10.2011 (2011).
75. Holle, H., McLatchie, N., Maurer, S. & Ward, J. Proprioceptive drift without illusions of ownership for rotated hands in the “rubber hand illusion” paradigm. Cognitive neuroscience 2, 171–178, doi: 10.1080/17588928.2011.603828 (2011).
76. Spence, C. & Ho, C. Multisensory interface design for drivers: past, present and future. Ergonomics 51, 65–70, doi: 10.1080/ 00140130701802759 (2008).
Acknowledgements
M.C. was supported by the University of Essex Research Promotion Funds (RPF 2015).
Author Contributions
F.S. and M.C. conceived the study; F.S. and D.M. collected and analysed the data; P.M., A.M. and M.S. selected the patients; F.S., D.M. and M.C. wrote the paper. All the authors approved the submitted version.
Additional Information
Competing financial interests: The authors declare no competing financial interests.
How to cite this article: Scarpina, F., et al. Altered multisensory temporal integration in obesity. Sci. Rep. 6, 28382; doi: 10.1038/srep28382 (2016).
This work is licensed under a Creative Commons Attribution 4.0 International License. The images or other third party material in this article are included in the article’s Creative Commons license, unless indicated otherwise in the credit line; if the material is not included under the Creative Commons license, users will need to obtain permission from the license holder to reproduce the material. To view a copy of this license, visit http://creativecommons.org/licenses/by/4.0/