University ‘Mediterranea’ of Reggio Calabria
Department of AGRARIA
Ph.D. in Agricultural, Food and Forestry Sciences - Cycle XXXII
INTERCROPPING WITH GRAIN LEGUMES TO EXPLOIT
PHOSPHORUS FOR ECOLOGICAL INTENSIFICATION OF
MEDITERRANEAN CEREAL CROPPING SYSTEMS
DSS: AGR/02
Ph.D candidate
Supervisor
Emilio Lo Presti Prof.
Michele Monti
Ph.D. Coordinator
Prof. Marco Poiana
1
Intercropped Grain Legumes to exploit phosphorus for an ecological intensification of Mediterranean Cereal Cropping Systems.
Abstract
Sustainable intensification (SI) is a new strategy proposed to satisfy the increasing global food request, to be profitable for the farmer and sustainable for agroecosystem, at the same time conserving resources for the next generations. Nowadays several researches suggest agroecological approach to promote SI in cropping systems. In this context the introduction of legumes in the cropping system is proposed to improve soil phosphorus (P) availability. The belowground interaction is considered the main cause of that ability.
In this thesis, the ability of three legume crops to facilitate phosphorus uptake of intercropped durum wheat was investigated. To achieve this goal three specific objectives were followed:
i) verify in agricultural soil the ability of three grain legumes to mobilize phosphorus through their specific root exudation (phosphatase activities and carboxylates composition) and confirm whether these facilitations are more expressed in phosphorus-limiting soil conditions;
ii) assess whether an increase in legume mass roots may influence phosphorus mobilization in the intercropping system;
iii) describe changes in soil bacterial community exerted in intercropping by the legume root activity mentioned above.
To realize these specific objectives lupin (Lupinus albus L.), pea (Pisum sativum L.) and faba (Vicia
faba L.), were grown in pots on controlled climatic conditions as sole crop (SC) and intercropped (IC)
with durum wheat (Triticum turgidum subsp. durum (Desf.) Husn.) in three separate experiments combined with the following treatments corresponding to each specific objective:
i) two levels of P supply (no P and adding 50 mg P/kg-1 soil);
ii) two legume density (1:1 and 2:1 legume:wheat plants ratio);
iii) four different P availability levels corresponding to different P forms added to soil.
In the first and second experiments, the benefit for the main crop durum wheat was evaluated from its P uptake, as well as the variation of soil P pools (organic P, Olsen P) was compared to phosphomonoesterase (PME) activity and quantity, and quality of carboxylates exuded in soil. In the third experiment, the bacterial community structure of the rhizosphere was investigated.
The results from the first experiment showed that PME activity was greater in P1 than in P0 and in IC than in SC and PME activity and carboxylates exudation was greater in legumes than in wheat. Available P was more conserved in IC than in SC. The effect of intercropping on wheat P uptake was greater with pea and lupin at P0, and with pea at P1. The mixture wheat/pea was the most efficient in P uptaking. In IC, wheat growth was higher compared to SC, while biomass P concentration decreased. In the second experiment, wheat P uptake increased in intercrop with two plants of faba and lupin and was associated to higher PME activity, while it decreased with pea. From the analysis of the third experiment, bacterial communities were affected primarily by the crop treatment followed by P availability. When P availability was low there was an enrichment of genera included in phosphate solubilizing bacteria (PSB) and plant growth-promoting rhizobacteria (PGPR) such as Variovorax,
Bradyrhizobium and Pseudomonas in legume rhizosphere and intermingled rhizosphere of intercrop.
Although intercropping was favorable for all the wheat-legume combination tested, a marked effect on wheat P uptake was confirmed only in pea intercrop and this advantage was more expressed in phosphorus-limiting soil conditions. The data from root exudates supported partially this result but
2 other aspects were involved, such as competition and complementary, varying legume density. The ability of legumes to enrich the bacterial community of the rhizosphere with the most favourable taxa in P limited condition was conserved in intermingled rhizosphere of both the intercrop partners contributing to the P facilitation.
Riassunto
L'intensificazione sostenibile (IS) è una nuova strategia proposta per soddisfare la crescente domanda di cibo nel mondo ma che sia allo stesso tempo redditizia per l'agricoltore e sostenibile per l'agroecosistema, conservando risorse per le generazioni future In questo contesto, l’introduzione delle leguminose da granella all’interno dei sistemi colturali può rappresentare un valido strumento per aumentare la disponibilità di fosforo nel suolo (P). Si ritiene che questa abilità sia riconducibile ad interazioni che si generano a livello radicale.
In questa tesi, è stata studiata la capacità di tre leguminose da granella di facilitare l’assorbimento del fosforo in frumento duro ad esse consociato. Con questa finalità sono stati perseguiti tre obiettivi specifici:
i) verificare in suolo la capacità di tre leguminose da granella di mobilitare il fosforo attraverso l’essudazione radicale (acidi organici e fosfatasi) e confermare se tali facilitazioni siano più espresse a bassa disponibilità dell’elemento;
ii) valutare se il raddoppio del numero di leguminose consociate abbia un effetto sulla disponibilità di fosforo;
iii) descrivere i cambiamenti nella comunità batterica del suolo dovuti alla sopra menzionata attività radicale delle leguminose consociate.
Per ottenere questi obiettivi specifici, lupino (Lupinus albus L.), pisello (Pisum sativum L.) e fava (Vicia faba L.), sono stati coltivati in vaso in condizioni climatiche controllate, sia in coltura pura (SC) che consociate (IC) a grano duro (Triticum turgidum subsp. durum (Desf.) Husn.) in tre esperimenti separati, ognuno corrispondente ai seguenti trattamenti così da soddisfare ciascuno degli obiettivi specifici prima enunciati:
i) due livelli di disponibilità di P (senza P e con l’aggiunta di 50 mg P / kg-1 di terreno);
ii) grano duro consociato a una o due piante di leguminosa;
iii) quattro diversi livelli di fosforo disponibile corrispondenti a diverse forme di P aggiunte al suolo.
Nel primo e secondo esperimento, l’effetto favorevole per il grano duro è stato valutato attraverso il P assorbito, mentre la variazione dei pool di P del suolo (P organico, Olsen P) è stata confrontata con l'attività della fosfomonoesterasi (PME) e gli acidi organici (AO) nel suolo. Nel terzo esperimento, è stata studiata la struttura della comunità batterica della rizosfera.
Dai risultati del primo esperimento si evince una maggiore attività della PME in P1 rispetto a P0 e in IC rispetto a SC e valori di attività della PME e presenza di AO maggiori con le leguminose che col grano. Il P disponibile è risultato maggiore in IC che in SC. L’aumento di assorbimento di P in grano dovuto alla consociazione è stato maggiore con pisello e lupino a P0 e con pisello a P1. La combinazione grano-pisello è stata la più efficiente nell'assorbimento di P. In IC, il grano si è accresciuto più che in SC, mentre la concentrazione di P nella biomassa si è ridotta. Nel secondo esperimento, utilizzando due piante piuttosto che una, mentre con pisello l'assorbimento di P nel grano è diminuito, con fava e con lupino è aumentato e a ciò si è associata a una maggiore attività della PME. Nel terzo esperimento, le comunità batteriche sono state influenzate in primo luogo dalla specie e poi dalla disponibilità di P. A bassa disponibilità di P, la rizosfera delle leguminose e del grano, quando consociato ad esse, si è arricchita di generi noti come batteri fosfato solubilizzatori (PSB) e rizobatteri promotori della crescita delle piante (PGPR) come Variovorax, Bradyrhizobium e
grano-3 leguminosa studiate, l’effetto sull'assorbimento di P del grano è stato confermato solo con pisello e questo vantaggio è stato maggiore in condizioni di limitata disponibilità di fosforo. I dati provenienti dagli essudati radicali hanno giustificato solo parzialmente questo risultato, si suppone che altri aspetti come competizione e complementarietà mediati dal rapporto di semina tra le due specie siano coinvolti. La capacità dei legumi di arricchire la propria rizosfera di taxa batterici più favorevoli al proprio sviluppo in condizioni di P limitanti è stata mantenuta nella rizosfera intimamente connessa dei due partner della consociazione con effetti facilitativi sull’assorbimento del P.
4
Contents
Introduction……… 9
1 Intercropping………... 1.1 Biodiversity in cropping systems………. 16
1.2 Legume intercropping and agrobiodiversity……….. 16
1.3 Phosphorus exploitation by legumes ……….……….. 17
1.4 Facilitations in intercropping mediated by microorganisms ……….. 18
2 Aim Of Research And Thesis Outline……… 20
3 Grain legumes root exudates can help intercropped wheat to exploit phosphorus in P-limiting conditions………. 22
3.1 Material and Methods……….……… 22
3.2 Results ……… 25
3.3 Discussion……….. 33
3.4 Conclusions ……….. 37
3.5 Appendix………. 38
4 Can the increase of the root mass of grain legume improve the facilitating effect on wheat uptake in intercropping system …...………... 39
4.1 Material and Methods………. 39
4.2 Results ……… 40
4.3 Discussion……….. 44
4.4 Conclusions ……….. 46
4.5 Appendix………. 47
5 Intercropping affects structure of soil bacterial communities ……….. 50
5.1 Material and Methods………. 50
5.2Results………. 52
5.3 Discussion……….. 55
5.4 Conclusions ……….. 56
6 General Conclusion………. 58
5
List of Table
page Table 3.1. Growth conditions in climate chamber
………22 Table 3.2. Physical and chemical characteristics of soil used in the experiments
…………...……….………..…..23 Table 3.3. Soil organic phosphorus (mg kg-1 dry soil) in sole crop (W= wheat, F= faba; L=lupin;
P =pea), intercropping (WF; WL; WP) and bare soil (BS) at two phosphorus supply (P0 and P1). F, L, and P in subscript are sampling time corresponding to the different flowering time of legumes. Values are mean ± SE (n=4; n=8). Significance of P for phosphorus (P), cropping treatments (CTR) and its interactions (P x CTR).by Anova are reported in italic
………...…………...…………..…..………… ……….…26 Table 3.4. Total soil available phosphorus (PTAV) in sole crop (W= wheat, F= faba; L=lupin; P =pea), intercropping (WF; WL; WP) and residual amount (%) after crop uptake at two phosphorus supply (P0 and P1). -F, -L, and -P indicate the sampling time corresponding to the different flowering of legumes. Values are mean ± SE (n=4; n=8). Significance of P for phosphorus (P), cropping treatments (CTR) and its interactions (P x CTR) by Anova are reported in italic
…...………..……… ………..……28 Table S 3.1. Phosphorus concentration (mg g-1 dry matter) in shoot and root of wheat and
legumes in sole crop (W= wheat, F= faba; L=lupin; P =pea) and intercropping (WF; WL; WP) at two phosphorus supply (P0 and P1). -F, -L, and -P indicate the sampling time corresponding to the different flowering of legumes. Values are mean ± SE (n=4; n=8). Significance of P for phosphorus (P), cropping treatments (CTR) and its interactions (P x CTR) by Anova are reported in italic
………..………..………...……….38 Table S4.1. Dry matter (g plant-1) in shoot and root of wheat and legume grown in sole crop
(W= wheat, F= faba; L=lupin; P =pea) and respective intercropping (WF; WL; WP) at two legume plant density (LD1 and LD2). -F, -L, and -P indicate the sampling time of wheat sole crop at the different flowering of legumes. Values are means ± SE (n=4; n=8). Significance of P for sowing ratios (LD), cropping treatments (CTR) and its interactions (LD x CTR) by Anova reported in italic
……….………..…….……....47 Table S 4.2. Phosphorus concentration (mg P kg-1 dm) in shoot and root of legume and wheat
grown in sole crop (W= wheat, F= faba; L=lupin; P =pea) and respective intercropping (WF; WL; WP) at two legume plant density (LD1 and LD2). -F, -L, and -P indicate the sampling time of wheat sole crop at the different flowering of legumes. Values are means ± SE (n=4; n=8). Significance of P by Anova reported in italic for sowing ratios (LD), cropping treatments (CTR) and its interactions (LD x CTR)
………..………..……....48 Table.S 4.3. Phosphorus uptake (mg) in shoot and root of wheat and legume grown in sole crop (W= wheat, F= faba; L=lupin; P =pea) and respective intercropping (WF; WL; WP) at two legume plant density (LD1 and LD2). -F, -L, and -P indicate the sampling time of wheat sole crop at the different flowering of legumes
6
List of figures
page Figure 1.1. P dynamics in the soil/rhizosphere-plant continuum. C-P, Carbon- P; NO, nitric oxide; OA, organic acids
………..15 3.1 Phosphomonoesterase (PME) activity (μmol pNPP g-1 soil h-1) in sole crop (W= wheat, F=
faba; L=lupin; P =pea), intercropping (WF; WL; WP) and in bare soils (BS). -F, -L, and -P indicate the sampling time of wheat corresponding to the different flowering of legumes. Values are means ±SE (n=8). PME activity at two-phosphorus level (P0 and P1) is also drawn. Values are means ±SE (n=48). For each part of the graph, the bars with a different letter above represent significantly different values (P≤ 0.05; Tukey’s HSD test)
……….……….25 3.2. Most representative carboxylates measured in rizospheric soil of legume grown in sole crop
(F= faba; L=lupin; P =pea) and intercropping (WF; WL; WP)
……….……….27
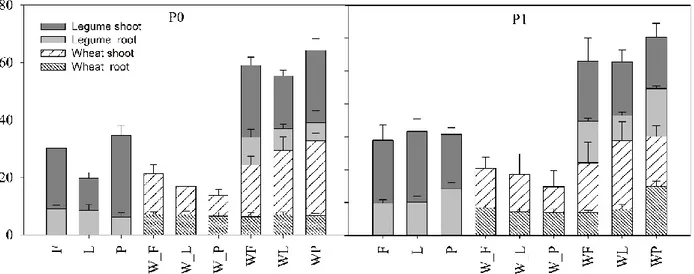
3.3. Dry matter accumulation and partitioning in legume and wheat grown in sole crop
(W= wheat, F= faba; L=lupin; P =pea) and intercropping (WF; WL; WP) at two
phosphorus supply (P0 and P1). _F, _L, and _P indicate the sampling time of wheat
corresponding to the different flowering of legumes. Values are means ± SE (n=4)
……….……….….…29
3.4. Relative dry matter accumulation of wheat and legumes grown in mixture,
calculated as intercrop/sole crop ratio (IC/SC), without (open symbols) and with (closed
symbols) phosphorus supply. Values are the mean ±SE (n = 4)
………..……….…………30
3.5Phosphorus uptake (mg plant
-1) by legumes and wheat grown in sole crop (W=
wheat, F= faba; L=lupin; P =pea) and intercropping (WF; WL; WP) at two phosphorus
supply (P0 and P1). _F, _L, and _P indicate the sampling time of wheat corresponding
to the different flowering of legumes. Mean (n=4) ± SE
…..……….…....31
3.6. Phosphorus relative uptake of wheat and legumes grown in mixture, calculated asintercrop/sole crop ratio (IC/SC), without (open symbols) and with (closed symbols) phosphorus supply. Values are the mean (n = 4) ±SE. The vertical and horizontal lines represent all the points where dry matter accumulation in IC is equal to SC
………..…………...….…32 3.7. Phosphomonoesterase (PME) activity plotted versus organic phosphorus (PORG) in bare soil
(BS), in legumes and wheat grown in sole crop (W= wheat, F= faba; L=lupin; P =pea) and intercropping (WF; WL; WP) without (closed) and with (open symbols) phosphorus supply. At P fertilized condition, PORG showed a linear and significant decrease as the PME activity
increased (R2=0.890; P=0.0001)
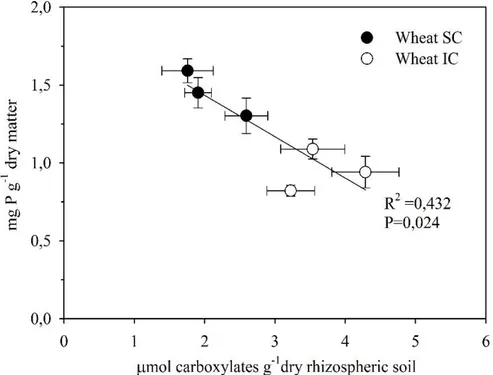
………..………..………..34 3.8. Total carboxylates production, at limited phosphorus condition, in wheat rhizospheric soil
plotted versus phosphorus concentration in intercropping (WIC) an sole crop (WSC) respectively indicated by (open) and with (closed symbols). Without phosphorus supply P
7 concentration in wheat dry matter showed a linear and significant decrease as the carboxylates increased. Vales are means ± SE (n=12)
……….………..……...35 4.1 Phosphomonoesterase (PME) activity (μmol pNPP g-1 soil h-1) in sole crop (W= wheat, F=
faba; L=lupin; P =pea), intercropping (WF; WL; WP) and in bare soil (BS). -F, -L, and -P indicate the sampling time of wheat corresponding to the different flowering of legumes. Means (n=8; n=48) ± SE. PME activity at two phosphorus level (P0 and P1) is also drawn. Within the lower and upper cases, the different letters above each bar indicate significantly different values at P≤ 0.05; Tukey test)
………..40 4.2. Organic and available (Olsen-P) phosphorus (mg P kg-1 dry soil) in wheat and legume
grown in sole crop (W= wheat, F= faba; L=lupin; P =pea) and intercropping (WF; WL; WP). -F, -L, and -P indicate the sampling time of wheat at the different flowering of legumes. Values are means ± SE (n=8; n=24). The different letters above each bar indicate significantly different values at P≤ 0.05; Tukey test)
……….………...……41 4.3 Phosphorus concentration (mg P kg-1 dm) in shoot of wheat and legume grown in sole crop
(W= wheat, F= faba; L=lupin; P =pea) and intercropping (WF; WL; WP) at two legume plant density (LD1 and LD2). -F, -L, and -P indicate the sampling time of wheat at the different flowering of legumes. Values are means ± SE (n=4; n=24)
………..…42 4.5. Shoot and root relative dry matter (IC/SC) of wheat (W) and legumes (F= faba; L=lupin; P
=pea) grown in mixture (WF; WL; WP), calculated as intercrop/sole crop ratio (IC/SC), both at one-plant (open symbols) and at two-plant (closed symbols) legume densities. Values are means ±SE (n=4). The vertical and horizontal lines represent all the points where dry matter accumulation in IC is equal to SC
………..……….………...……43 4.6. Figure Phosphorus plant uptake (mg) by wheat and legume grown in sole crop (W= wheat,
F= faba; L=lupin; P =pea) and intercropping (WF; WL; WP) both at LD1 and LD2. F, L, and -P indicate the sampling time of wheat at the different flowering of legumes. Values are means ± SE (n=4).
…..………..………..43 4.7. Phosphorus relative uptake of wheat and legumes grown in mixtures, calculated as
intercrop/sole crop ratio (IC/SC), both at one-plant (open symbols) and at two-plant (closed symbols) legume densities. Values are means ±SE (n = 4). The vertical and horizontal lines represent all the points where dry matter accumulation in IC is equal to SC
………...44 4.8. Phosphomonoesterase (PME) activity (μmol pNPP g-1 soil h-1) plotted versus phosphorus
uptake (g plant-1) of wheat intercropped with faba (WF), lupin (WL) and pea (WP) at 1:1 (open
symbol) and 1:2 (closed symbol) sowing ratios. Values are means ±SE (n=4)
………...…...45 5.1. PCoA plots based on Bray-Curtis distance matrix of bacterial communities from bulk soil
and rhizosphere of different crops grown in soil with different P treatments. The percentage shown on each axis corresponds to the proportion of variation explained. Inverted triangles represent bulk soil samples; solid squares represent lupin rhizosphere; crosses represent lupin-wheat rhizosphere; solid triangles represent pea rhizosphere; stars represent pea-lupin-wheat
8 rhizosphere and solid circles represent wheat rhizosphere. Dark green color represents samples obtained from soil where P was added in available form; light green color represents samples obtained from soil added with NPK; red color represents samples obtained from soil where no P was added; and orange color represents samples from soil where P is unavailable. A - Samples were coloured by type (bulk soil, lupin rhizosphere, lupin-wheat rhizosphere, wheat rhizosphere, pea rhizosphere and pea-wheat rhizosphere) and treatment (available P, no P, NPK and unavailable P). B, C, D, E and F – Bacterial communities from the rhizosphere of different crops (lupin, lupin-wheat, wheat, pea and pea-wheat, respectively)
………...………...………55 5.2. Random forest analysis on each plant type to check for differentially abundant taxa at genus
level, comparing different P treatments, only showing the top 15 taxa for lupin, lupin-wheat, wheat, pea and pea-wheat rhizosphere (A, B, C, D and E, respectively). X-axis shows the mean decrease accuracy (variable importance) and Y-axis shows the taxa which were found to be differentially abundant
9
Introduction
Within the current economic paradigm and given that the world’s population is increasing, dietary demands per capita are increasing, while at the same time the natural resource base (arable land of good quality, fresh water, nutrients, energy) (Valenzuela, 2016) as well as the human resources (experienced, resourceful, and innovative farmers and agronomists) (Struik et al., 2014) are eroding, it is likely that planetary boundaries will even be further exceeded. It is a moral imperative to ensure that enough food of adequate quality is produced for humankind, that all humans have access to the food of their preference in a fair manner, that production is taking place without eroding the natural resource base.
Fraser et al. (2016) identified four perspectives in the debate on global food security, and from these perspectives, they proposed four types of key strategies: (i) technological strategies to increase production, (ii) socio-economic strategies to achieve equitable food distribution, (iii) strategies to promote local food movements, and (iv) economic, political, and regulatory changes to correct current market and food system imperfections and failures.
Food demand and climate change The most recent projections reveal that world population can be
expected to increase from the current 7.2 billion people to 9.6 billion in 2050 and 10.9 billion in 2100 and, the world population is unlikely to stop growing in this century (Gerland et al., 2014). Considering the expected per capita demand for food, measured as caloric or protein needs, it has been possible to predict an increase by 100–110% in the global food demand from 2005 to 2050 (Tilman et al., 2011). The environmental impacts of doubling global crop production will depend on how the increased production is achieved (Tilman et al., 2002; Foley et al. 2011). With this regard, strategies of global agricultural development that are directed to greater technology improvement and transfer would meet 2050 crop demand with much lower environmental impacts than the strategies applied in the past (Tilman et al., 2001).
Many studies have estimated the impacts of climate changes on crop yields. Based on these studies, there is medium confidence that climate trends have negatively affected wheat and maize production for many regions (-2% and -1% per decade, respectively for wheat and maize) (Porter et al., 2014). Warming has promoted crop production only in some high-latitude regions, such as northeast China or the UK (Jaggard et al., 2007; Chen et al., 2010; Supit et al., 2010; Gregory and Marshall, 2012) while drought stress persists as the main driver of losses for the crops. As a result, in low-yielding years due to environmental stress, the elevated CO2 does not give any yield benefit. Therefore, use of
autumn-sown crops, as wheat, escaping to the drought season enhances resilience of cropping systems to climate change in Europe and their negative effect are partially compensated by CO2 fertilization
(Webber et al., 2018). In the perspective of adaptation to climate change, cropping system diversification represents an innovation pathway to improve production, especially of wheat in marginal areas, adopting organic and low external input systems.
10
Agroecosystem disservices from agriculture. The green revolution permitted to double the world
population and to triple the cereal production with only a 30% increase of the cultivated land area (Wik et al., 2008). Between 1960 and 2000, yields for all countries rose by 208% for wheat, 109% for rice, 157% for maize, 78% for potatoes, and 36% for cassava (FAO, 2004). It resulted from the adoption of higher-yielding crop varieties, increased use of pesticides and fertilizers and improved access to irrigation and mechanization. The consequences in water use, soil degradation, and chemical runoff have had serious environmental impacts (Burney et al., 2010). Chemical fertilizers have played a significant role in the green revolution but excessive use of them has led to a reduction in soil fertility and to environmental degradation. Moreover, the use of chemical fertilizers is reaching the theoretical maximum use beyond which there will be no further increase in yields (Ahmed, 1995). The slowdown in yield growth that has been observed since the mid-1980s can be partly attributed to the degradation of the agricultural resources (Pingali, 2012).
Agriculture accounts for 70 percent of water worldwide consumption and plays a major role in water pollution. Farms discharge large quantities of agrochemicals, organic matter, sediments and saline drainage into water bodies. The resultant water pollution poses risks to aquatic ecosystems, human health and productive activities (UNEP, 2016). Water pollution from agriculture has direct negative impacts on aquatic ecosystems due to eutrophication caused by the accumulation of nutrients in lakes and coastal waters that impacts on biodiversity and fisheries. Regarding this issue, more attention has been paid to agricultural nitrogen (N) in comparison to phosphorus (P) due to differences in the agronomic efficiency, and complexities of transportation processes, as well as, to the inadequate analytical methods (Gao et al., 2017). P due to his key role in all living systems has been largely considered one of the main global cause of eutrophication of water bodies (Faridmarandi and Naja, 2014; Foy et al., 1995; Oenema et al., 2005). After N, P is the major plant growth-limiting nutrient despite being abundant in soils in both inorganic and organic forms. While N could be obtained from the air, phosphorus and potassium must be mined. The world has enough potassium to last several centuries (Vaccari, 2009). The low distribution of the P mines in the world and the announced depletion of them make the question of P a problem for the next fifty years. Moreover, many soils throughout the world are P-deficient because the free phosphorus concentration (the form available to plants) even in fertile soils is generally not higher than 10 μM even at pH 6.5 where it is most soluble. At the same time, theoretical estimates have suggested that the accumulated P in agricultural soils is sufficient to sustain maximum crop yields worldwide for about 100 years (Goldstein et al., 1993). During recent decades, fertilizer application increased by 35–40% worldwide, leading to an estimated 25.7% of global P losses (Smith et al., 1999; Vitousek et al., 2009). In many studies, the majority of agricultural P losses are driven by storm events and overland transport flow as non-point source (NPS) of pollution as a result of soil particles erosion (Chen et al., 2017, 2014). Phosphorus is characterized by a low availability to plants. Therefore, chemical fertilization is largely applied and often part of the
11 added amount of P fertilizer provided may reach the water table thus, causing water pollution and eutrophication, as well as, a significant economic loss.
The green revolution resulted in global food security and played an important role in transforming developing countries, such as India, from being food-deficient to having a food surplus. An important consequence of the green revolution was the huge use of natural resources. The increase of yield was possible thanks to the support of resources such as fuel, agrochemical in general and in particular fertilizer. In the green revolution, the research focused on the high use of external input employed in the environments where returns would be high in order to maximize the yield. The marginal environments and the optimal use of the resources were not considered as a target environment or reference topic by the green revolution.
An alternative way for modern agriculture: the sustainable intensification. The challenge of modern
agriculture is to satisfy the increasing global food request, be profitable for farmers and, at the same time, ensure sustainability to the agroecosystem by the conservation of the natural resources for the next generations. An innovative approach in response to this challenge is the “sustainable intensification” (SI), aimed at producing more from the same area while conserving resources, reduce negative impacts on the environment and enhance natural capital and the flow of ecosystem services (Rai et al., 2011). In the SI the improvement of ecosystem services may lead to the reduction or removal of energetic and chemical inputs that are the basis of conventional agriculture.
The Millennium Ecosystem Assessment defined ecosystem services as the benefits humans obtain from ecosystems, and grouped them into four categories (Millennium Ecosystem Assessment, 2005):
Supporting services, such as nutrient cycling and soil formation.
Regulating services, such as pest control, crop pollination, climate regulation, and water purification.
Provisioning services, such as food, fibre, fuel, and water.
Cultural services, such as education, recreation, and aesthetic value.
During the past decades, the loss of habitat and simplification of agriculture landscape (Hoekstra et al., 2004; Tscharntke et al., 2005) in combination with other environmental changes such as climate change, pollution and species invasions determined a reduction of biodiversity that resulted in a reduction of ecosystem services (Hooper et al., 2005).
The management of ecosystem services delivered by biodiversity into crop production systems represents an interesting tool available to sustainable intensification to match or augment yield levels while minimizing negative impacts on the environment (Cassman, 1999; Dorè et al., 2011). The supporting and regulating ecosystem services provided by the organisms can be incorporated into cropping systems, such that production is maximized while environmental impacts are minimized through the decrease, but not necessarily exclusion, of anthropogenic inputs, such as inorganic fertilizers, pesticides, energy, and irrigation (Cassman, 1999; Dorè et al., 2011). It must be underlined that even intensively cultivated, crop production systems depend heavily on supporting and regulating
12 services that determine the primary production that can be harvested (Bommarco et al., 2013). For the farmer there are two possible ways to close the gap between real productivity and potential productivity, increasing conventional intensification with known negative externalities and a possible long-term decline in productivity or, alternatively, integrating and extending several natural supporting and regulating services (Bommarco et al., 2013). In most of the developed countries, the productivity closed the gap thanks to the high external input. Then the aim in these areas is the re-establishment of ecosystem services and the replacement of external input to preserve the resources maintaining the productivity. However, in large parts of the world, productivity is lower, with a wide gap between farm (actual) yield and potential yield (Neumann et al., 2010; Lobell et al., 2009); here, the challenge will be to ecologically enhance productivity by optimizing ecosystem services in low-input (but not necessarily no-input) farming systems. Ecological replacement by ecosystem services and productivity enhancement in fact are not mutually exclusive and both processes can be combined to close the yield gap (Bommarco et al., 2013).
Ecosystem services are strictly connected to the level of intactness, complexity, and/or species richness of ecosystems (Díaz et al., 2006). In fact, agrobiodiversity has the potential to improve soil physical stability and resilience of microbial processes mediating nutrient cycling as part of supporting services (Gregory et al., 2009; Garcia-Pausas et al., 2011; Peres et al., 2013). Some studies show that species communities, formed by the multiple pressures and drivers acting in human-dominated landscapes, generally function better with increasing diversity levels (Cardinale et al., 2012) and demonstrate, for example, that crop yield increases with increasing pollinator diversity (Hoehn et al., 2008) or with diversified crop rotations (Bennett et al., 2012).
However, even if the presence of rare species improves biodiversity their contribution as service providers maybe low. The contribution of individual species to regulating or supporting ecosystem services in agriculture varies markedly and is a function of the abundance of each species and the efficiency with which it provides the service (Balvanera et al., 2006).
The benefits derived from ecosystem services can increase the interest in biodiversity conservation. However, it is important to distinguish between promoting biodiversity for the services it delivers (functional biodiversity) or for the inherent conservation value (Kleijn et al., 2011).
13
Phosphorus dynamics in soil
Phosphorus exists in soils in many different forms: inorganic P (Pi) precipitated as phosphate minerals, slowly exchangeable adsorbed Pi, Pi in soil solution, rapidly exchangeable adsorbed Pi, organic P (Po) and microbial P (Bellon and Penvern, 2014). In arable soils, a major proportion of soil P (up to 80 %) is made up of inorganic P (Pi) (Pellerin et al., 2003). A part of Pi includes primary P minerals such as apatites, strengite, and variscite, which are very stable with a low release of available P from these minerals by weathering, generally too slow to meet the crop demand. Another part of soil Pi is adsorbed via surface complexation processes on positively-charged minerals and may be rapidly exchanged with the soil solution (Devau et al. 2011). The rest is bounded due to the pH of the soil with iron and aluminium (Hinsinger 2001; Kizewski et al. 2011), or with calcium, (Freeman and Rowell 1981; Lindsay et al., 1989) forming phosphate minerals that slowly release phosphate ions into the soil solution (Frossard et al., 2000; Hinsinger 2001; Kizewski et al., 2011). More in detail, in acidic soils, P can be dominantly adsorbed by Al/Fe oxides and hydroxides, such as gibbsite, hematite, and goethite (Parfitt, 1989) and clay minerals. Clay minerals and Fe/Al oxides have large specific surface areas, which provide large number of adsorption sites. The adsorption of soil P can be enhanced with increasing ionic strength. With further reactions, P may be occluded in nanopores that frequently occur in Fe/Al oxides, and thereby become unavailable to plants (Arai and Sparks, 2007).
In neutral to calcareous soils, P retention is dominated by precipitation reactions (Lindsay et al., 1989), although P can also be adsorbed on the surface of Ca carbonate (Larsen, 1967) and clay minerals (Devau et al., 2010). Phosphate can precipitate with Ca, generating dicalcium phosphate (DCP) that is available to plants. Ultimately, DCP can be transformed into more stable forms such as octocalcium phosphate and hydroxyapatite (HAP), which are less available to plants at alkaline pH (Arai and Sparks, 2007). HAP dissolution increases with decrease of soil pH (Wang and Nancollas, 2008), suggesting that rhizosphere acidification may be an efficient strategy to mobilize soil P from calcareous soil. Therefore, soil pH plays a major role in the availability of inorganic P (Devau et al., 2011; Hinsinger, 2001). With increasing soil pH, solubility of Fe and Al phosphates increases but solubility of Ca phosphate decreases, except for pH values above 8 (Hinsinger, 2001).
Po generally accounts for 30% to 65% of the total P in soils (Harrison, 1987). Soil Po mainly exists in stabilized forms as inositol phosphates and phosphonates, and active forms as orthophosphate diesters, labile orthophosphate monoesters, and organic polyphosphates (Turner et al., 2002; Condron et al., 2005). Organic P is not directly available to plants since it requires hydrolysis by phosphatase-like enzymes excreted by plants or microorganisms (Spohn and Kuzyakov, 2013). Another pool of soil P is the microbial biomass P, which amounts to only 0.4–2.5% of total P in arable soils (Bünemann et al., 2011).
Even in the more fertile soils, the Pi concentration of the soil solution is seldom higher than 10 𝜇M (Bieleski, 1973). This low concentration of available Pi in soil is too far from the concentration in plant tissue (from 5 to 20 mM Pi, Raghothama, 1999). As a result, chemical P fertilizers are needed to
14 improve crop growth and yield. The major forms of phosphate used as fertilizers include monocalcium phosphate (MCP) and monopotassium phosphate. Contrary to monopotassium phosphate, which lightly influences soil physical and chemical properties (Lindsay et al., 1962), MCP can significantly alter soil physicochemical properties. In fact, MCP generates in soil large amounts of protons, phosphate, and dicalcium phosphate (DCP), and eventually forms a P-saturated patch (Benbi and Gilkes, 1987). This Pi-saturated patch forms three different reaction zones including direct reaction, precipitation reaction, and adsorption reaction zones (Shen et al., 2011).
The strong acidity of the direct reaction zone (pH = 1.0–1.6), results in an elevated mobilization of soil metal ions. These metal ions can also react with high concentrations of Pi in the zone thus causing further precipitation of Pi. The amorphous Fe-P and Al-P that thereby form can be partly available to plants. In calcareous soil, new complexes of MCP and DCP can be formed and with time DCP is gradually transformed into more stable forms of Ca phosphates (octocalcium phosphate or apatite) (Shen et al., 2011).
An important source for P fertilization is also manure. In fact, nearly 70% of total P in manure is labile. In manure, Pi accounts for 50% to 90% (Dou et al., 2000). Manure also contains large amounts of Po, such as phospholipids and nucleic acids (Turner and Leytem, 2004) which can be mineralized increasing the available fraction. Manure can also have effect on Ca phosphate in soil due to organic acids generated by mineralization of humic substances. Organic acids such as citrate can efficiently weaken the nanoparticle stability of hydroxyapatite, by controlling the free Ca availability and thereby the nucleation rate (Martins et al., 2008). P adsorption to soil particles can be greatly reduced through applying organic substances. The large numbers of negative charges of humic acids, carboxyl and hydroxyl groups, can strongly compete for the adsorption sites with Pi. Changes of soil P availability can also be generated by pH alteration caused by manure.
Although phosphate is strongly held by soil surfaces, it is not immobile (Heckrath et al., 1995), particularly if the material to which the phosphate is bound becomes detached from the soil matrix. A loss of P is possible by surface runoff and by rapid water movements through preferential pathways generated by large pores in soil (subsurface drainage). In arable land, elevated concentrations caused by P fertilizer increase the potential for P loss. The loss of P in dissolved and particulate forms is a function of, but not exclusively of, topography, soil type, soil test phosphorus (STP) concentration, and soil hydrology (McDowell et al., 2001). This aliquot of P, reaching the water table, is one of the main causes of water pollution and eutrophication, as well as, a significant economic loss.
15 Figure 1.1. P dynamics in the soil/rhizosphere-plant continuum. C-P, Carbon-
16
1 INTERCROPPING
1.1 Biodiversity in cropping systems: the agrobiodiversity
Cropping system, more specifically conventional cropping system, was characterised by an interest in the reduction of diversity, and by an increase in use efficiency of external additional resources provided to agroecosystem. In these agroecological contexts, communities are not mainly formed by processes of natural competition and dispersal because agricultural management heavily interferes with the nature and intensity of these processes. The first interest in biodiversity in managed agroecosystems was in the selection of the more productive species, varieties and races, and in the reduction of the unproductive species. Therefore the approach to biodiversity conservation in agroecosystems should be different from the natural ecosystems (Moonen and Barberi, 2008). In an agroecosystem context are considered ‘functional groups’ the species traits (part of functional agrobiodiversity) which are the basis for the ‘ecosystem services’ provided by the communities. Farmers can try to influence the agroecosystem services provided through the manipulation of these ‘agroecosystem functional groups’.
1.2 Legume intercropping and agrobiodiversity
An agronomic strategy to enhance agrobiodiversity in cropping systems is growing two or more crops together on the same land and, at the same time in intercropping (Willey, 1990), or in sequent season in crop rotation (Bennett et al., 2012). When more than one species is grown in the same land, the interspecific interactions occurred could be negative, as competition, or positive, as complementarity and facilitation. Complementarity and facilitations represent the cause of the yield increase observed in intercropping (Duchene et al., 2017). The concept of “interspecific complementarity”, suggests that crops differ in the way they find and use resources, thereby limiting interspecific competition and, thus, optimizing the use of resources (Bedoussac et al., 2015). It is possible to distinguish complementarity in temporal, spatial or chemical partitioning (Justes et al., 2014). The time lag between the needs of two or more intercropped species generates a temporal complementary. Such as, when clover is sown in the spring under a winter wheat cash crop (Amossé et al., 2013), the greatest need of resources (water, nutrients, etc.) occurs in different moments for the two partners. Spatial complementarity means that processes, such as nutrient uptake, occurs in different locations. Root architecture and root depth are the most important traits in determining spatial complementary, related to water or to nutrient extraction depth (Hauggaard-Nielsen and Jensen, 2005). Chemical complementarity refers to the ability of species to mobilize different chemical forms of nutrients. This classification of complementarity is formal while most of the results observed in the field are the consequence of combined effect of temporal, spatial and chemical complementarity.
The improvement of plant growth or production quality observed in many field experiments (Jensen et al., 2006) cannot be explained only by complementarity. Cereal/legume systems can promote beneficial interactions (facilitation) in which plants benefit from additional services that partially
17 overcome competition (Duchene et al., 2017). Complementarity is mainly responsible for limiting competitive interactions by improving resources partitioning, while facilitation provides additional services by improving environmental growth conditions and resources availability (Duchene et al., 2017). Legumes, when used both in intercrop and in crop rotation, are able to increase biodiversity inside the cropping system and moreover, as these plants are able to establish symbiosis with certain types of bacteria (Rhizobium spp. and Bradyrhizobium spp.), are able to biologically fix nitrogen into the soil, which increases soil fertility (Nulik et al., 2013). However, these plants cannot improve on-farm diversity by their self but can be considered as crucial component of multiple cropping systems. Indeed, in multiple cropping systems, services as nutrient recycling and soil fertility are improved through the ability of legumes to fix nitrogen, release free phosphorous and their capacity to increase soil biodiversity and, at the same time, legume also help to curb and control pests and diseases. Additionally, since legumes often promote higher rates of accumulation of soil carbon than cereals or grasses, they can contribute to improve the soil carbon sequestration of agro-ecosystems (Jensen et al., 2012).
1.3 Phosphorus exploitation by legumes
Phosphorus (P) is a major nutrient for all living organisms and it is a key production factor in agriculture. Its scarcity in soils is a limiting factor for crop production in many soils (Cordell et al., 2009). There is evidence that grain legumes may improve P availability not only for themselves but also for crops grown in mixture and in rotation with them (Cu et al., 2005; Hinsinger et al., 2011). Many studies suggested that enhanced P availability is partly responsible for the positive effect of legumes observed in intercropping systems (Betencourt et al., 2011; Li et al., 2007) and in succeeding crops in rotation (Kamh et al., 1999; Nuruzzman et al., 2005a).
Many plants use exudation of low molecular weight organic molecules into the rhizosphere to enhance the mobilisation of soil P (Gerke et al., 1994; Li et al., 1997). Carboxylates released in the rhizosphere compete with phosphate groups for binding sites in the soil (Nuruzzmann et al., 2005b), forming strong complexes with aluminium and iron oxides, and P is liberated into soil solution (Jones and Darrah, 1994; Ryan et al., 2001; Uren and Reisenauer, 1988). Substantial exudation of carboxylates is well documented amongst a number of grain legume crops, e.g., white lupin (Lupinus albus L., Gardner and Boundy, 1983; Hocking and Randall, 2001; Cu et al., 2005), pigeon pea (Cajanus cajan (L.) Millsp., Ae et al., 1990; Ae et al., 1991), faba bean (Vicia faba L., Li et al., 2007) and chickpea (Cicer arietinum L., Neumann and Römheld, 1999; Veneklaas et al., 2003) with differences in quality and quantity of this exudates among the species. Nuruzzmann et al. (2005a) found in field pea and in white lupin rhizospheres more carboxylates than in faba bean. It has also been reported that the rates and compositions of carboxylates vary considerably with soil conditions (Ae et al., 1990; Dinkelaker et al., 1989; Veneklaas et al., 2003). There is also evidence of higher phosphatase activity in soil under legumes than under other plants (Houlton et al., 2008; Yadav and Tarafdar, 2001; Veterink, 2011). All this partly explains P availability increasing showed under intercropping (Hinsinger et al., 2011; Latati
18 et al., 2014) and crop rotation (Kamh et al., 1999; Hocking and Randall, 2001), even if the phenomenon is more complex and involves other factors, such as niche complementarity (Hinsinger et al., 2011) and microbial activity of belowground communities attracted by root activity of intercropped species (Berg and Smalla, 2009; Marschner et al., 1986, 2001, 2004). It has been shown that some legumes crops, such as Vicia faba L. and Cicer arietinum L., facilitate P uptake and biomass production of co-occurring non-legumes crops (Zea mays and Triticum aestivum), apparently by exuding organic acids, protons or acid phosphatase (Li et al., 2004, 2007). Similar results were found in pot experiments with wheat intercropped with chickpea (Li et al., 2003), lupin (Kamh et al., 1999; Cu et al., 2005) and faba bean (Song et al., 2007). For Morel and Hinsinger (1999), the turnover of the organic root exudates and organic P fractions, and the equilibrium between readily and sparingly plant-available inorganic P fractions, are time-dependent. In crop rotation, during the vegetation-free period between cropping seasons, plant-available/mobilised P may be immobilised thus limiting the beneficial effect of P mobilisation by one crop to the next crop in the rotation. Therefore, a transfer of mobilised P from a P-efficient crop to an inefficient crop is more likely to occur in a mixed cropping system (Gardner and Boundy, 1983; Horst and Waschkies, 1987; Kamh et al., 1999). Then, it appears more likely that a positive rotational effect of P-mobilising crops is mainly due to transfer of readily available P via the crop residues (Kamh et al., 1999). Thus, to make mobilised P available to the main crop, the most promising agronomic approach appears to be the integration into the cropping system of P-mobilising plant species as intercrops or in rotation (Horst et al., 2001). In fact, Nuruzzmann et al. (2005b) observed that, after removal of the legume roots of white lupin, field pea and faba bean, the concentration of carboxylates in the soil declined gradually until no detectable amounts of carboxylates were found after four weeks.
1.4 Facilitations in intercropping mediated by microorganisms
Rhizosphere represents a volume of soil rich of a large amount of nutrients provided to microbial communities due to rhizodeposition and exudation by crop roots (Hinsinger et al., 2009; Wichern et al., 2007). In fact, plants exudates make possible the instauration of a rich microorganism community near the roots (Bais et al., 2006; Bertin et al., 2003; Morgan et al., 2005). The quality and quantity of root exudates significantly affect soil microbial community structure (Berg and Smalla, 2009; Hamilton and Frank, 2001; Qiang et al., 2004; Wieland et al., 2001). The alteration of microbial community structure can correspond to the selection of specific functional traits of soil microbial communities (Bartelt-Ryser et al., 2005; Fridley, 2001; Zak et al., 2003; Zhou et al., 2015). In many cases, the selection of specific microorganisms is not generated by a simple passive diffusion mechanism and the establishment of a microbe-favourable environment but involves a complex series of signals that mediate the interaction through complex molecular exchanges between plant and microorganisms (Zhou et al., 2015; Faure et al., 2009; Hirsch et al., 2003; Johansson et al., 2004). Interactions with microorganisms generate many positive effects for the plants, such as the providing of nutrients (Gianinazzi et al., 2010; Jeffries et al., 2003; van Kessel et al., 1985) and phytohormones
19 (Bashan and de-Bashan, 2010), pest control and stimulation of plant resistance to pathogens (Audenaert et al., 2002; Lemanceau, 1992) and the attenuation of biotic and of abiotic plant stress factors (Vacheron et al., 2015).
It is possible that the community structure of the legume/cereal intercropping, which is shaped by one of the partners or by the combined activity of both the two species, generates advantages for the entire intercropping. In that case, the positive influences generated by plant-microbe interaction can be considered as part of the facilitations generated by the mixture of species. The main advantages of intercropping between legume and non-legume species appear to be due to the stimulation of rhizosphere activities based on legume N-fixing action, the associated exudates and the resulting changes in pH (Duchene et al., 2017).
Generally, the use of legumes in crop rotation (Alvey et al., 2003) or intercropping (Latati et al., 2014; Li et al., 2009; Qiang et al., 2004; Song et al., 2007; Tang et al., 2014; Wang et al., 2007) resulted in an improvement of microbial diversity. The intricate processes that regulate soil communities need to be more explored and involve the production and exudation of specific molecules by legumes capable to influence Plant Growth-Promoting Rhizobacteria (PGPR) mobility, improving root colonization and the phytobeneficial activity of these PGPR (Schelud’ko et al., 2009; Jain and Gupta, 2003). Confirmation that the composition of rhizosphere communities is species-specific (Marschner et al., 2001) also strongly supports the hypothesis that intercropping creates favourable conditions for belowground interactions. Indeed, legumes modify the chemical properties of the entire rhizosphere and, with their own group of specific bacteria, stimulate the rhizosphere for the potential benefit of both the legume and the cereal since their respective root systems are not separate but intermingled (Duchene et al., 2017). Many articles (Bernard et al., 2007, 2009; Blagodatskaya and Kuzyakov, 2008; Fontaine et al., 2003) reported also the increase of decomposition rates of organic matter (SOM) in intercrop due to the addition of fresh organic matter from legumes which stimulates the activities of soil bacteria communities involved in the mineralization of stable forms of SOM.
In the rhizosphere is concentrated the highest proportion of phosphate solubilizing microorganisms (PSM) that are more metabolically active than those isolated from sources other than the rhizosphere (Vazquez et al., 2000). Conversely, the salt-, pH- and temperature-tolerant phosphate-solubilizing bacteria have been reported to be maximum in the rhizoplane followed by the rhizosphere and root-free soil in alkaline soils (Johri et al., 1999). These organisms can convert the insoluble phosphate compounds into soluble forms in the soil, by their phosphate-solubilizing ability (Kang et al., 2002; Pradhan and Sukla, 2005), making more phosphorus available to the crops. The main solubilizing mechanism is the release of organic acids can either directly dissolve the mineral phosphate, as a result of anion exchange of PO42- by acid anion, or can chelate both iron and aluminium ions associated with
phosphate (Omar, 1998). Important genera of mineral phosphate solubilizing microorganisms include
Bacillus and Pseudomonas (Illmer and Schinner, 1992), while Aspergillus and Penicillium are the
20
2 AIM OF RESEARCH AND THESIS OUTLINE
The purpose of this PhD thesis is to assess in agricultural soil the ability of the three grain legumes (faba, lupin and pea) to facilitate phosphorus uptake by durum wheat in intercropping. To achieve this goal these three main objectives were pursued:
- verify in agricultural soil, the ability of the three grain legumes, different in root exudation, habitus and growth, to mobilize phosphorus through their specific root exudation (phosphatase activities and carboxylates composition) and confirm whether these facilitations is more expressed under phosphorus-limiting soil conditions;
- assess whether an increase in legume mass roots may influence phosphorus mobilization in the intercropping system;
and
- describe any changes in soil bacterial community exerted in intercropping by the legume root activity mentioned above.
To achieve these specific objectives, during a three-years period, three separate experiments were carried out in pots under controlled environment (two in climatic chamber and one in heated greenhouse). Wheat and the legumes were intercropped and the crops were sampled when each legume reached flowering. In this phase the highest release of root exudates in grain legume occurs (García et al., 2001). Therefore in order to compare intercropped wheat with respective sole crop at the same date (flowering of intercropped legume), three wheat sole crop were included in the experimental design, each corresponding to the three different legume flowering times.
The performance of legumes and wheat in intercropping were compared with the respective sole crops and to this end, in addition to the measured absolute values, were used the “relative values” (eg. relative dry matter accumulation) calculated as intercropping / sole crop ratio.
The experiments dedicated to the first two topics were carried out at the Department AGRARIA at the Mediterranean University of Reggio Calabria during 2017 and 2018, the third topic was investigated, during the October 2018- July 2019 period, at the Rothamested Resarch Center (Harpenden, UK) where a specific experiment was carried out.
In this thesis the three experiments are described, and the results are presented and discussed in three separate chapters that have been drafted in the form of a scientific article manuscript.
The first experiment was described in the third chapter, where are reported the results on the effects of root exudates (carboxylates and phosphatases) in legume/cereal intercropping at high and low soil P availability. The exudation was compared to the plant dry matter yield and P uptake of both the intercropping partners and was related to the efficiency of intercropping system compared to sole crop, and to the modification of the P pools in soil.
21 The fourth chapter contains a second experiment, where was studied the effect of legume density increase in wheat:legume sowing ratio (1:1 vs 1:2) on root exudation, on plant dry matter yield, on P uptake and on variation of soil P pools. This experiment was particularly aimed at deepening the study of the combined effects of interspecific competition and facilitation in intercropping on yield and P uptake of wheat.
A third experiment is placed in the fifth chapter and explores the role of soil bacteria in the facilitative interaction generated by legumes in intercrop. The variation of rhizospheric bacterial community structure was investigated varying P forms soil source in pea and lupin intercropped with durum wheat.
22
3 Grain legumes root exudates can help intercropped wheat to exploit phosphorus in P-limiting conditions.
The aim of this study is the evaluation of the beneficial interactions mediated by root exudates that occurred in a grain legume/wheat intercrop varying phosphorus availability in soil. The benefit for the main crop (wheat) was evaluated by measuring dry matter yield and by calculating P uptake. The relation among root exudates (phosphatases and carboxylates), phosphorus plant uptake and its pool in soil was also investigated.
The hypothesis is to verify, in agricultural soil under P-limited conditions, the facilitative support exerted by different grain legumes on the wheat uptake in intercropping through root exudation and related modifications in soil P pools.
3.1 Material and methods
Plant growth and experimental design
Wheat (Triticum turgidum subsp. durum (Desf.) Husn. cv. Svevo) (W), lupin (Lupinus albus L. cv. Multitalia) (L), faba bean (Vicia faba var. minor Beck cv. Sikelia) (F) and pea (Pisum sativum L. cv. Hardy) (P) were grown in pots as sole crop (SC) and in intercropping (IC). In order to sample at the flowering of each legume three wheat sole crops were also considered (W-F, W-L and W-P for faba, lupin and pea respectively).
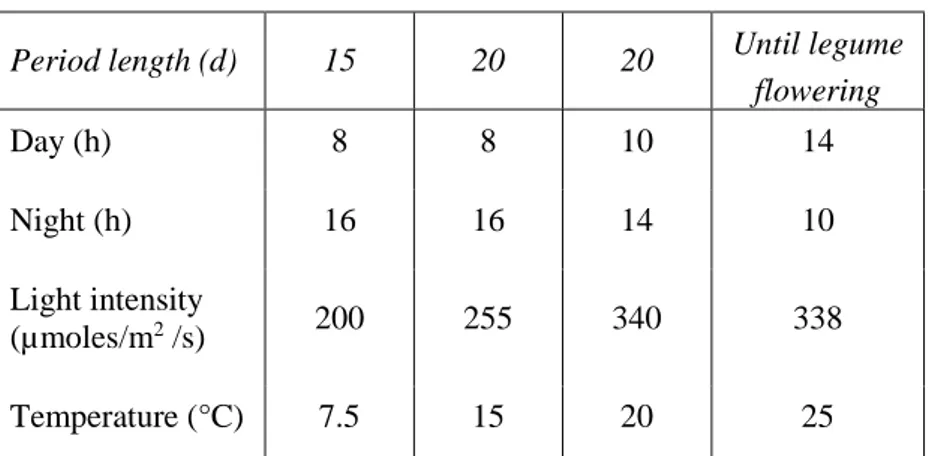
Table 3.1. Growth conditions in climate chamber
Period length (d) 15 20 20 Until legume
flowering Day (h) 8 8 10 14 Night (h) 16 16 14 10 Light intensity (µmoles/m2 /s) 200 255 340 338 Temperature (°C) 7.5 15 20 25
Nine cropping treatments (CTR) resulted from the combination of the three legumes and wheat respectively grown in intercropping and sole crop. In addition, three bare soil treatments were added at the flowering time of faba (BS-F), lupin (BS-L) and pea (BS-P) as a control in soil variables analysis. Crop treatments and BS controls were combined with two levels of phosphorus (P) in the soil, P0 (with no P supply) and P1 (with 50 mg P kg-1 soil as KH
2PO4,) in a factorial randomized block design
with 4 replications. Cropping treatments were obtained growing in a pot one plant of each crop species (SC); one plants of legume plus one plant of wheat in the same pot (IC). The pot were PVC tube Ø 14 cm and 30 cm tall filled with the soil mixed with perlite (80/20, v/v).
The pots were placed in a climate chamber and grown until legumes flowering. Radiation, and temperature regimes are reported in table 3.1.
23
Soil and plant sampling and analysis
Soil was collected from the experimental farm (37°E 51N°) of the Department AGRARIA, at Mediterranea University of Reggio Calabria, Italy. The soil was selected for the low content of available P (11.33 mg of bicarbonate-extractable P kg-1 soil). Soil properties are listed in Table 3.2.
Table 3.2. Physical and chemical characteristics of soil used in the experiments
Bulk density (g cm-3) 1.23
Sand % 36
Silt % 32
Clay % 32
pH CaCl2 6.6±0.1
Total organic carbon (g kg-1) 12.55±.4.5
Total nitrogen (g N kg-1) 1.38±0.1 C/N 9.07±0.1 EC1:2 (dS m-1) 0.271±0.021 CEC (cmol(+) kg-1) 20.9±1.3 CaCO3 (g kg-1) 8.4±0.5 P-Olsen (mg kg-1) 11.33±0.2 NH4+ - N (mg kg-1) 12.49±0.2 NO3- - N (mg kg-1 ) 26.16±0.2
At flowering time of each legume, the pots were destroyed and the plants and the soil were collected for the analysis. After plants separation into shoot and root, about 10 g of root were immediately collected for carboxylates analysis. After the carboxylate extraction, the root subsample was combined with the rest of root and accurately washed to remove any trace of remaining soil. Roots and shoots were placed in oven and dried at 70°C and dry weights were recorded. P concentration of root and shoot was obtained digesting 100 mg of milled plant material with the mixture nitric and perchloric acids (6:1) (Johnson e Ulrich 1959) and the digested was measured via molybdate method (Westerman, 1990) modified for Lambda Fias UV/VIS Spectrophotometer Perkin Elmer.
Carboxylates analysis. Each 10 g root sample was transferred into a 100-ml vial and 50 ml of 0.2 mM
CaCl2 were applied. Roots were then gently dunked for 30 s to remove as much rhizosphere soil as
possible (Pearse et al., 2003). A subsample of the extract was filtered through a 0.2-µm syringe filter into a 1-ml HPLC vial and transferred to a −20°C freezer until HPLC analysis. The analysis was performed according to method suggested by Cawthray, (2003) using HPLC with PDA detector Altus A-10 (PerkinElmer) and column Kinetex 2.6 μm F5 100 Å.
Chemical analysis. After roots were gently removed from the pots, the soil was carefully mixed
and sampled for the analysis in the laboratory. The samples were prepared and stored in three different ways according to the specific analysis. An aliquot was frozen immediately after sampling, another was air dried and sieved at 2 mm while the last aliquot was crushed to pass through a 500 μm sieve. The frozen soil was used for the measure of the phosphatase activity and for the determination of ammonium and nitrate. The <2 mm fraction was used to determine soil pH and electrical conductivity (EC). While the <500 μm fraction was used for total organic C (TOC) and N (TN). Ammonium and nitrate were extracted by KCl 2 M solution from 5 g of fresh soil (Beemner and Keeney, 1966) and measured by Lambda Fias UV/VIS Spectrophotometer Perkin Elmer. Soil pH was measured in a 1:2.5 (w/v) soil: 0.01 M calcium chloride solution and soil EC was measured in a 1:2 (wv-1) soil: water
24 Acid phosphatase activity was determined by the method proposed by Tabatabai and Bremner (1969) and modified by Hedley et al. (1982) according to which phosphatase in soil is expressed as production of para-nitrophenol (μmol h-1). One g of soil was incubated with
para-nitrophenylphosphate (pNPP) in 4 ml of 0.04 M sodium maleate buffer (pH 6.5) at 37 °C for 1 h. After the reaction was stopped with 1 M NaOH and the amount of para-nitrophenol (pNP) released by phosphatase activity was measured via spectrophotometer as absorbance at 400 nm and expressed as phosphomonoesterase activity (μmol pNP g-1 soil h-1) (PME).
As an index of available form, was used phosphorus extracted by Olsen method (Olsen et al. 1954), and measured via spectrophotometer using Lambda Fias UV/VIS Spectrophotometer Perkin Elmer. Organic P was obtained as difference of ignited at 550 °C and no ignited soil sample H2SO4 extracts
according to Bowman (1989) and Kuo (1996).
Data were processed by ANalysis Of VAriance using a PROC GLM in SAS v. 9.2 (SAS,Institute Inc., Cary, NC, US, 2009) for the RCB design model to test for significance of treatments. For means comparison Tukey’s HSD test was performed.
25
3.2 Results
Phosphatase activity and organic phosphorus in soil
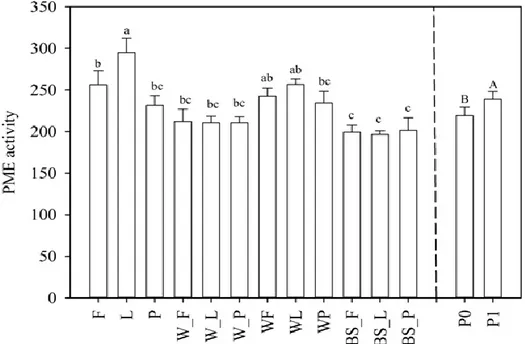
The statistical analysis showed significantly differences of phosphomonoesterase activity (PME) between the two levels of P (P= 0.0017) and among cropping treatments (CTR), BS-F, BS-L and BS-P
included, (P<0.0001), but no interaction CTR x P was observed. Among treatment, PME varied from 192 (BS-L) to 295 μmol pNPP g-1 h-1 (LSC). Legume based systems was 252 μmol pNPP g-1 h-1, more
than wheat sole crop (SC) (211) and bare soils. In soil with phosphorus supply, the average PME activity was 238.42 μmol pNPP g-1 h-1, i.e. 8% significantly higher than in soil with natural content
(220.82 μmol pNPP g-1 h-1) (Fig. 3.1).
Organic fraction of phosphorus in the soil (PORG) between the P levels and cropping treatment
significantly differed and ANOVA also showed a significant interaction. Average PORG at P0 was
87.64 mg/kg in soil, 14% more than in P1 (Tab 3.3). Among the cropping treatments, the highest PORG
average value was observed in W-L sole crop that was significantly higher than WL and L. At P0 higher PORG in soil were observed under intercropping and sole crops, excluding faba in both cropping
systems and wheat sole crops. In bare soil the PORG increased when P was supplied.
Figure 3.1. Phosphomonoesterase (PME) activity (μmol pNPP g-1 soil h-1) in sole crop
(W= wheat, F= faba; L=lupin; P =pea), intercropping (WF; WL; WP) and in bare soils (BS). -F, -L, and -P indicate the sampling time of wheat corresponding to the different flowering of legumes. Values are means ±SE (n=8). PME activity at two-phosphorus level (P0 and P1) is also drawn. Values are means ±SE (n=48). For each part of the graph, the bars with a different letter above represent significantly different values (P≤ 0.05; Tukey’s HSD test).
26 Table 3.3. Soil organic phosphorus (mg kg-1 dry soil) in sole crop (W= wheat, F= faba; L=lupin; P
=pea), intercropping (WF; WL; WP) and bare soil (BS) at two phosphorus supply (P0 and P1). F, L, and P in subscript are sampling time corresponding to the different flowering time of legumes. Values are mean ± SE (n=4; n=8). Significance of P for phosphorus (P), cropping treatments (CTR) and its interactions (P x CTR).by Anova are reported in italic.
P0 P1 Mean BS-F 86.070 ±9.62 88.537 ±4.48 87.304 ±4.94 BS-L 87.833 ±4.78 86.865 ±9.46 87.349 ±4.91 BS-P 80.560 ±6.11 88.225 ±13.15 84.393 ±6.87 F 78.956 ±3.49 75.546 ±13.64 77.251 ±6.55 L 77.726 ±6.20 45.475 ±5.95 61.601 ±7.28 P 106.526 ±8.99 56.808 ±10.65 81.667 ±11.40 W-F 92.242 ±4.43 91.287 ±10.26 91.765 ±5.18 W-L 117.407 ±14.95 92.504 ±11.56 104.955 ±9.94 W-P 77.514 ±9.52 96.348 ±5.89 86.931 ±6.29 WF 75.852 ±8.78 76.790 ±11.77 76.321 ±6.80 WL 84.042 ±2.98 60.725 ±4.08 72.384 ±4.99 WP 86.966 ±12.39 61.186 ±11.28 74.076 ±9.16 Mean 87.641 ±2.77 76.691 ±3.42 82.166 ±2.07 P P=0.0047 CTR P=0.0036 P x CTR P=0.0164
Carboxylates exudation in rhizosphere
Total carboxylates production in rhizospheric soil was influenced by P supply and crop treatment. Total carboxylates were ten-fold greater in legume rhizosphere (43.1 μmol/g dry rhizospheric soil) than in wheat rhizosphere (4.3 μmol/g DW rhizospheric soil). The greatest carboxylates accumulation was observed in faba followed by pea, lupin and wheat. In legume rhizosphere carboxylates were always greater in P1 (+85%) compared to P0. In wheat they were greater at P1 only in the rhizosphere of wheat intercropped with faba and of the respective SC (respectively four- and five-fold higher) but no significant difference was shown between P0 and P1 in the other crop treatments. In wheat rhizosphere, the accumulation of carboxylates was greater in IC compared to SC both in P0 (+82%) and P1 (+75%). Carboxylates of legume rhizosphere were generally lower (-20%) in IC than in SC; on the contrary, between the two pea-systems no differences were shown at P0 but at P1 an 20% increase was found in intercropping.
Both in wheat and in legumes more than 99 % of the total carboxylates released in the rhizosphere consisted in oxalate, acetate, succinate, malate, malonate, tartrate and, in some cases, in citrate. High differences among the treatments and P levels were found.