Agronomy Research 16(3), 821 837, 2018 https://doi.org/10.15159/AR.18.092
Optimizing the sample size to estimate growth in I-214 poplar
plantations at definitive tree density for bioenergetic production
P.A. Marziliano*, D. Russo, V. Altieri, G. Lombardi
Mediterranean University of Reggio Calabria, Department of AGRARIA, Loc. Feo di Vito, IT89165 Reggio Calabria, Italy
*Correspondence: [email protected]
Abstract. In Europe, over the last decades, the arboriculture for woody biomass production has significantly expanded, often using poplar plantations. In order to maximize production, the flexibility of the cultivation algorithms becomes necessary. For this reason, it is necessary to apply monitoring tools for the evaluation and estimate of the wood productions, without significantly affect the production costs. In particular, for the estimate of the productions, the choice of the sample size is of particular importance. The aim of this study was to verify a simplified sampling approaches in poplar plantations characterized by constant tree density. The research was conducted in a poplar plantation on the Tuscan hills (Italy). The surveys were carried out each year for 13 years, from 4 to 16 years old. Through different statistical techniques, the change in the social position of each tree over time was evaluated. The results showed that the social position of each tree has been characterized by the first years after the plantation. Consequently, the estimate of the productions can be carried out by analysing the diameter increment of 10% of the trees, included in the diameter classes around the medium-sized tree at the time of the survey. This study provided a valid method for forest managers characterized by a simplified approach useful to estimate the growth and yield of hybrid poplars. This method will permit reliable biomass estimates, but also a reduction of the costs in the sampling activities in the field.
Key words: poplar, woody biomass, basal area, medium rotation forestry, cluster analysis.
INTRODUCTION
In the last decades, forestry activities are supported by structural funds of EU, in order to enhance the afforestation of abandoned agriculture land (Coletta et al., 2016).
Moreover, over the last few years, in Europe the arboriculture for wood production has significantly expanded. The main objectives of these cultivations are linked to the production of woody assortments for the industry, but also for the biomass collection for energetic purposes (Marziliano et al., 2017). Furthermore, the increasing use of renewable energies is a key EU strategy for reducing the greenhouse gases (GHG) emissions, contributing then to strategic policy objectives. The supply of sustainable energy is one of the main challenges that we will face over the coming decades, particularly because of the need to fight the climate change.
in the production of heat and electricity, and could provide significant environmental benefits, by substituting imported fossil fuels with domestic biomass, giving also opportunities for the economic and social development in rural communities (AA.VV., 2001; Grogan & Matthews, 2002; Bergante & Facciotto, 2006; Facciotto et al., 2008; Marziliano et al., 2015).
Tree plantation for energetic production purposes, especially the thermal ones, developed firstly in northern
These plantations are characterized by medium-rotation times (typically 10 12 years) and by cultivation algorithms characteristic of the intensive agriculture. In Europe, the most promising tree species usually planted are Populus spp. and Salix spp. (Armstrong et al., 1999), strongly considered as an optimal source of bio-energy (Hinchee et al., 2009, Fischer et al., 2011). Clones of poplars are characterized by fast growing rates, which are partly induced by a set of physiological intrinsic characteristics (e.g. Ceulemans et al., 1990; Casella & Ceulemans, 2002; Dillen et al., 2010). Considering their fast growth and high yield, poplars are then the most widely used tree species in medium rotation forestry (MRF) and short rotation forestry (SRF). Additionally, intensive breeding programs have selected a wide range of clones with optimal production rates for a wide range of climates. When compared to other tree species, poplars have many characteristics that make them suitable for plantation cultures which enable the production of large quantities of wood in short periods of time. In general, abandoned rural land and marginal and degraded areas are used for plantations, where the rotation turn over ranges from 10 to 20 years, in relation to different management patterns, but also depending to the tree density and the species used. Moreover, the different cultivation systems nowadays available give different opportunities for the use of the biomass produced: from the cellulose for paper industries to the wood burned for energetic purposes (Rosenqvist et al., 2000; Scholz & Ellerbrock, 2002).
In order to maximize the productivity in tree plantations, a flexible approach in the use of the cultivation algorithms is necessary (Macaya Sanz et al., 2017); they should be modified at any time, also in relation to the geographical and climatic conditions. However, for this purpose, it is necessary to apply appropriate management tools useful to evaluate and estimate the woody productions, without significantly affect the economic costs.
On the other hand, the availability of simplified technical tools for the evaluation and estimation of tree growth and yield is particularly important when the total economic
value o -Cruzado et al., 2014). Moreover,
at European level, there is a clear demand to find methods useful to optimize the estimates for the plantation productivity, in particular regarding the short-rotation forestry (Arevalo et al., 2007). Moreover, reliable estimates of growth and yield are usually a prerequisite for the establishment of a woody biomass-based industry (Stampfl et al., 2007).
Therefore, these management tools can encourage the cultivation of fast-growing woody tree species within short-rotation forestry. These plantations can provide a significant source of alternative and renewable energy (Isebrands & Karnosky 2001; Hill et al., 2006). Moreover, renewable energy sources play a key role in meeting the CO2 emission reduction objectives, since they are characterized by a lower net CO2 emissions when substituted for fossil fuels (Kheshgi et al., 2000). The replacement of fossil fuel with biomass in the generation of energy and heat has recently been an important strategy
promoted by the European Union (EU) to mitigate the effects of climate change and to enhance the security of the supply and the diversification of energy sources (IEA, 2003). In the context of the woody biomass production, the basal area and volume of the plantations (past, present and future) are the most important parameters to be considered and carefully evaluated within a production process (Wang et al., 2013; Perez-Cruzado et al., 2014; Niemczyk et al., 2016).
In order to assess these parameters, various sampling approaches can be suitably exploited. When designing monitoring schemes, scientists should consider their specific objectives in order to define the degree of precision and accuracy required (Lombardi et al., 2015), also through a cost-benefit analysis.
More in detail, for the estimate of the productions (in terms of basal area or volume), the choice of the sample extent is of particular importance: it is essential to reduce as much as possible the sample size, however maintaining the need for statistically reliable estimates.
Starting from these assumptions, the aim of this study was to verify simplified sampling approaches in poplar plantations characterized by constant tree density, in order to optimize the field work in estimating the basal area development. Even if this study refers to a specific context, from a methodological approach, it can however provides a useful contribution to the knowledges on this topic.
In particular, the study assessed the relationships between the number of trees sampled and the accuracy in the estimate of the basal area (BA). The basal area, rather than the volume, was selected as studied parameter since it is directly correlated to the stand volume (Eastuagh, 2014), but also not interested by estimation errors (Hellrigl, 1970).
The questions we tried to answer were the followings: (1) in order to estimate the basal area development of a plantation, what is the minimum size of a reliable sample, in terms of the trees number? (2) Which characteristics should have the trees sampled? (3) Is it possible to sample just one tree, e.g. the average-size tree, then extending the estimate to the whole stand?
However, in order to obtain reliable results, two conditions are necessary: (i) the density of the plantation should be constant; (ii) the trees must always maintain the same social position during the whole plantation cycle. In this paper, the first condition is ensured by the cultivation algorithm adopted, while we tried to verify the second condition as a secondary objective of the current study.
MATERIALS AND METHODS Study area
The study was carried out on four permanent experimental plots set up within hybrid poplar (Populus x euroamericana) plantation located in central Italy, south-west of Greve
constituted by the I-214 clone, the most widespread in Italy and considered typical and representative of the Italian poplar cultivations (Bergante et al., 2015; Coaloa et al., 2016). The investigated plantation is located on a plateu, at an altitude of about 560 m a.s.l., characterized by fertile loamy soils.
temperature is 12.5
warmest has an average temperature of 21.6
classification (Pavari, 1959), the plantation is located in the warm sub-zones of Castanetum. Geologically, the site is characterized by green and purple Paleozoic schist. According to the FAO soils classification (FAO, 1998), soils are Cambisols. Conventional site preparation was carried out and the planting density was 400 trees per hectar, spaced on a 5 x 5 m grid. No thinning operation was realized, while all the trees were moderately pruned twice, according to conventional schedule (Nervo et al., 2011).
Survey and data analysis
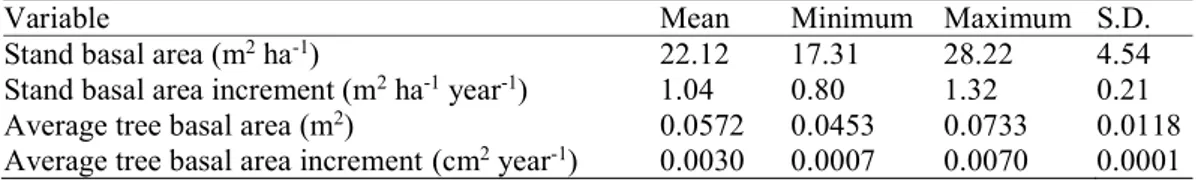
The four experimental plots extend each on 0.18 ha, representing different site-index conditions (Corona et al., 2002). An abundant shrubs layer occurs in two plots (slightly sloping) (Rubus spp. and Dactylis glomerata), while it is almost absent in the other two plots (flat). Measurements started when the plantation was 4 years old and were repeated every year until the plantation reached 16 years old. Statistics of the main dendrometric variables recorded in each plot are reported in Table 1.
Table 1. Statistics of the main dendrometric variables recorded in the experimental plots. Values refer to the last sampling year (age 16 year old)
Variable Mean Minimum Maximum S.D.
Stand basal area (m2 ha-1) 22.12 17.31 28.22 4.54
Stand basal area increment (m2 ha-1 year-1) 1.04 0.80 1.32 0.21
Average tree basal area (m2) 0.0572 0.0453 0.0733 0.0118
Average tree basal area increment(cm2 year-1) 0.0030 0.0007 0.0070 0.0001
The diameter at breast height (DBH) was measured on each tree. In the first survey, the measured trees were marked with indelible paint, so that the trees were measured at the same height in the overall study period. Moreover, in the first survey, the position of each tree occurring in the surveyed plots was also recorded, identifying each tree with an ID c
The following methodological approach was used: 1. Attribution of a social position index to each tree;
2. Evaluation of the variation in the social position index over the years;
3. Splitting of trees into homogeneous groups with respect to their social position index;
4. Test of different sampling methods for the estimation of the basal area, characterized by different number of trees;
5. Statistical comparison between the basal area values obtained through the different sampling methods applied;
6. Statistical comparison between the real basal area per hectare obtained from the surveys carried out annually and the estimated basal area with the chosen sampling extraction method.
In order to assign a social position index to each tree, the diameters measured in the last year of observation (age: 16 years) were ordered according to a decreasing serialization. Consequently, each tree has been assigned to a rank number, according to its position in the rank scale. In detail, the rank number 1 was assigned to the tree with the largest diameter, while the higher rank number referred to the tree with the smaller
diameter. This procedure was repeated for all the surveys realized across the years (from the age of 4 to the age of 16 years). Consequently, we obtained for each year a matrix referring to the rank value assigned. Moreover, since the same tree can have a different rank number over the years, also the confidence interval (C.I.) of the rank number was calculated.
Furthermore, the social position of each tree over the years has been evaluated through the variation of the rank number attributed to each tree. We firstly evaluated the correlation between the rank number attributed to each tree at the last survey (age: 16 years) and the number of rank of the previous years. For this purpose, the Spearman's rank correlation coefficient was used. Subsequently, for each tree, we evaluated the size of the confidence interval (C.I.) of the rank numbers. This analysis was carried out (1) evaluating the confidence interval of the rank numbers compared to the rank number assigned in the last survey; (2) through an interval plot showing, for each tree, the lower and upper limits of the interval of confidence of the rank numbers.
In order to identify homogeneous groups of trees with respect to their social position index, a multivariate Cluster Analysis was applied. This analysis allows to identify, starting from each single tree, homogeneous groups of trees characterized by a specific rank number, in each year. As already applied in the clustering methods, we used the average linkage useful to calculate the distance between two sub-groups, considering the mean (Euclidean) distance between any two members referring to opposite groups. When compared to other c
differences among groups (Rand, 1971; Oshumi, 1980; Gordon, 1999). In order to identify the number of clusters, the dendrogram was cut at the step preceding the step determined by the rapid increment in the dispersion within-groups (Fowler & Cohen, 1995). This procedure allows to evaluate the validity of the clusters identified; it is an effective tool for choosing the level of distance at which the dendrogram could be cut (Fowler & Cohen, 1995).
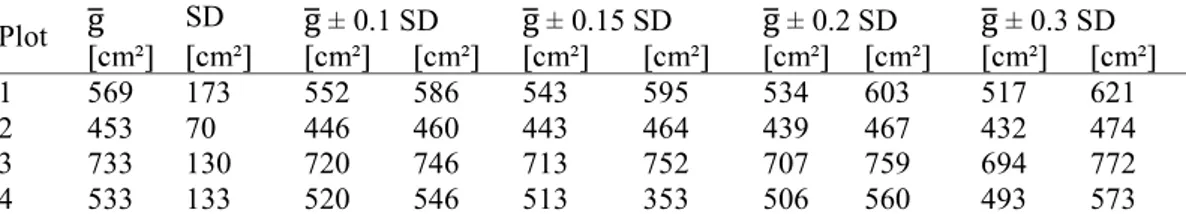
Moreover, in order to quantify the minimum number of trees necessary for a reliable estimate of the basal area, the starting tree used to design the sampling extraction methods was the sample characterized by the average size tree. This choice was made for the following reasons: (i) the average diameter of the mean basal area is easily determinable and commonly adopted in dendrometry; (ii) the basal area estimate per hectare is obtained multiplying the average basal area with the number of trees per hectare. Therefore, starting from the average size tree, we tested five methods for estimating the growth of the woody production in terms of basal area, considering the basal area range as criterion for applying the five different methods, through the selection of the trees with basal area (g), as follow:
Method 1, tree with basal area equal to (average basal area);
Method 2, trees with basal area included in the interval 0.10 * Standard Deviation; Method 3, trees with basal area included in the interval 0.15 * Standard Deviation; Method 4, trees with basal area included in the interval 0.20 * Standard Deviation; Method 5, trees with basal area included in the interval 0.30 * Standard Deviation.
For each plot, Table 2 reports the average basal area values, the standard deviation, and also the minimum and maximum basal area values for each estimation method, regarding the year of the last survey.
Table 2. Average basal area values, standard deviation (SD) and minimum and maximum values for each method of estimate applied
Plot SD 0.1 SD 0.15 SD 0.2 SD 0.3 SD
1 569 173 552 586 543 595 534 603 517 621
2 453 70 446 460 443 464 439 467 432 474
3 733 130 720 746 713 752 707 759 694 772
4 533 133 520 546 513 353 506 560 493 573
For each plot, the basal area estimated with the 5 methods was compared with the measured basal area by developing the percentage error (E%):
(1)
where BAesti is the basal area estimated with the 5 methods; BAobsi is the measured basal area in each plot.
The analysis of the variance (ANOVA) was carried out to test the differences in percentage error (E%) between the different methods of estimate developed. The Finally, both the independent-sample T test and the indipendent-sample Z-Test (Mann-Whitney test) were used to compare the real basal area with the sampling extraction method resulted more efficient. The T test is a parametric test known to be more statistically powerful; on the other hand, the Z-Test is a non-parametric test and requires no assumptions (Zar, 1996; Montgomery, 2001; Soliani 2008).
RESULTS AND DISCUSSION
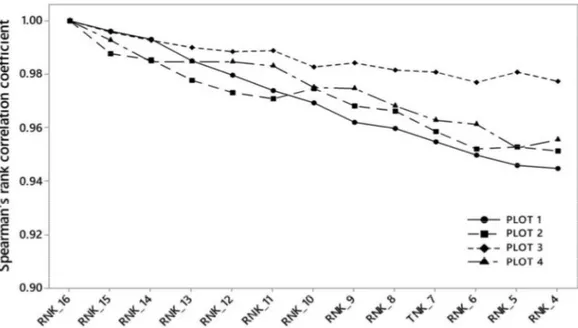
Fig. 1 shows the trend of the Spearman's rank correlation coefficient between the rank number attributed to each tree at the last survey (age: 16 years) and the rank number of the previous years (age from 4 to 16). The correlation coefficient tends to decrease when trees are younger, mostly in plots 1, 2 and 4. However, for all the years studied, the correlation is always very strong and significant, ranging from 0.945 to 0.996. These results indicate how the rank number of each tree observed in previous years does not change significantly when compared to the rank number assigned in the last survey.
Fig. 2 reports the interval of confidence in the rank number for each tree. Dots represent the single trees, while the values refer to the interval of confidence. In all the experimental plots, and for each tree, the size of the interval of confidence referring to the rank number is never high. In detail, the plot 3 shows the lowest values (from 0.10 to 2.21), even if also in the other plots it is rather low (from 0.14 to 3.11).
Figure 1. Trend of Spearman's rank correlation coefficient between the rank number attributed to each tree at the last survey and the number of rank of previous years.
Figure 2. Variation of the rank number across the years, for all the experimental plots. For each tree and in all the experimental plots, the x-axis indicates the rank number of trees at the last survey (age: 16 years), while the y-axis shows the confidence interval (CI) of the rank number in each year of survey (age from 4 to 16 years) for all the sampled trees.
The results obtained confirm what the Spearman's correlation coefficients already showed: even if a small variation in the social position (rank number) for each tree occurred over the years, this variation is not significant.
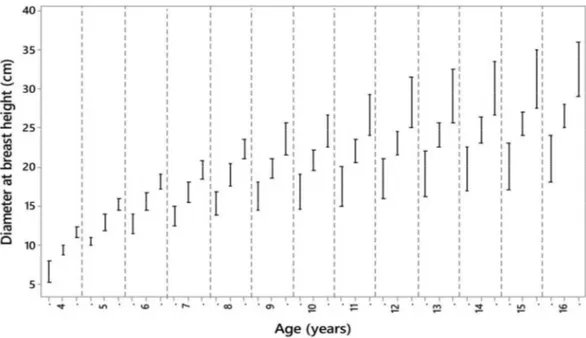
For each plot, Fig. 3 shows the lower and upper limits of the interval of confidence for each tree. Trees with low rank numbers (larger trees) and those with high rank numbers (smaller trees) are characterized by small and very small confidence intervals. On the contrary, trees referring to intermediate rank numbers, are characterized by slightly larger interval of confidence, especially in plots 1 and 2.
Figure 3. Interval-plot of the rank number over the years in each experimental plot.
The observed low interval of confidence can suggest how, over the years, the almost the same social position during the whole production cycle. This result implies that if a tree is already characterized by a small (but also medium or large) diameter in the first years after the planting, then it will continue for the whole production cycle to maintain the same social position.
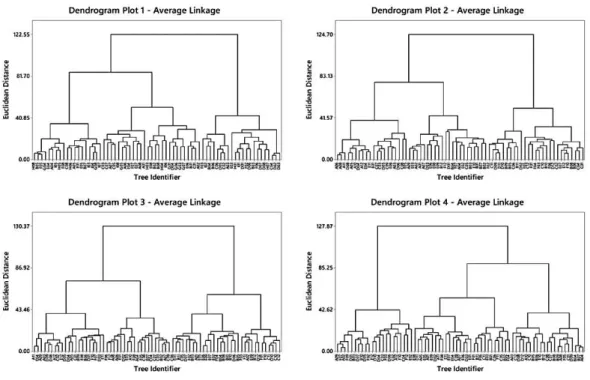
Fig. 4 shows the dendrograms obtained through the cluster analysis. Following the procedure described by Fowler & Cohen (1995) to identify the number of clusters, we observed how the dispersion remains low up to about the 50th step of the agglomeration algorithm, for all the studied plots; after, it rapidly increases. At a distance of 51.01 (Plot 1), 50.58 (Plot 2), 53.88 (Plot 3) and 54.01 (Plot 4), the dendrograms indicate the formation of three well-defined clusters. For each plot, the first group is characterized by trees with large diameters, with a number of trees ranging from 19 to 23. Immediately
after, the second group is characterized by trees with small diameters, with a number ranging from 21 to 22 trees. Finally, the third group is characterized by trees with intermediate diameters (27 28 trees). These trees thus identified, are always the same during the entire production cycle.
Figure 4. Cluster analysis. For each experimental plot, the x-axis indicates the single sampled trees, while the y-axis refers to the Euclidian distance. Considering the rank number for each plot, at the Euclidian distance of about 50, homogeneous groups of trees are aggregated.
Fig. 5 shows the diameter development observed in Plot 1. For each year, the three groups of trees are always well defined and never intersect each other. The trees, already reported in Fig. 4 (Plot 1), referring to the range H08 I07 (22 trees) form the larger (diametric) group of trees; those occurring between C03 and A02 (27 trees) refer to a medium-sized group; finally, trees occurring between F03 and D03 (19 trees) form the smaller group of trees. It is interesting to observe that, in each group, trees are always the same: during the whole production cycle, no transition from a group to another are observable. Moreover, when a tree changes its social position, it always happens within the same group. Fig. 5 also reveals, for the groups I and III, that tree diameter increases when the age rises; on the contrary, trees characterized by an average size maintain approximately the same diameter across the years.
The obtained results suggest that, in a plantation with a definitive tree density, the social position of each tree is already defined in the first years of tree growth and did not change in the following years. Therefore, in the first years after the planting, a dimensional hierarchy is established and it is preserved during the following stand growth.
Furthermore, we can underline that the necessary condition to define the sample size useful for the basal area estimate is satisfied: trees always maintain the same social position during the whole plantation cycle.
Figure 5. Diameter development observed un experimental plot 1, for each groups of trees.
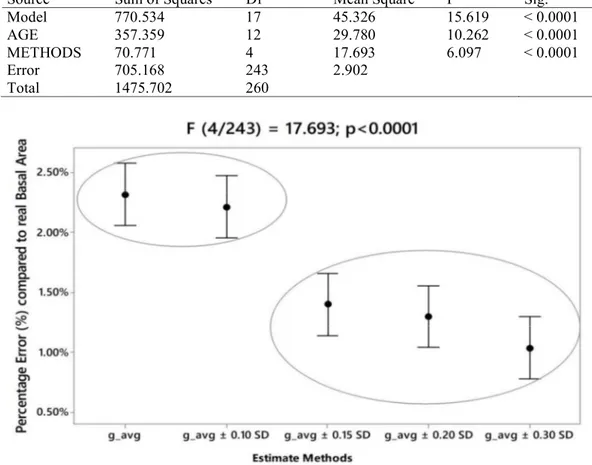
In Table 3 are reported the values of the annual basal area estimated with the 5 estimation methods tested (for semplication, the values are shown every two years). Table 4 shows the ANOVA results.
They allow to reject the null hypothesis at a level of statistical significance of 95%. The different methods of estimate revealed significant differences in the percentage errors (see Eq. 1), when compared to the real basal area (measured basal area). For each method of estimate applied, Fig. 6 shows the average of the percentage errors and the interval corresponding to the minimum significant difference, according to the Tukey method. The average percentage errors ranges from 2.31% for method 1 (tree with g = ) to 1.04% for method 5 (trees with g = 0.3 * SD). Certainly, the errors observed are higher for the methods of estimate applied on a low number of sample trees. As showed in Fig. 6, two groups of methods can be identified. The first group is characterized by the methods 1 and 2 (respectively tree with g = and trees with g = 0.1 * SD), while the second group refers to the methods 3-4-5. Within each group, the methods revealed no significant differences; on the contrary, the differences are significant when comparing the two groups of methods. The methods 1 and 2 (group 1) showed significantly higher percentage errors if compared to the methods of the second group (method 3-4-5).
The results obtained revealed that Method 3 should be the best estimate method, i.e. the method characterized by a number of trees with a basal area (g) = 0.15 * SD. This simplified method allows to obtain, measuring a low number of trees, a statistically reliable estimate of the stand growth and productivity. Then, applying this estimate procedure, emerges the advantage to reduce the sampling costs, without affecting the reliability of the estimate. In fact, no statistically significant errors were observed when comparing method 3 with methods in which a higher number of trees should be sampled. More in detail, the number of statistical units of the identified method of estimate varied from a minimum of 7 trees to a maximum of 9 trees, depending on the number of the experimental plots sampled.
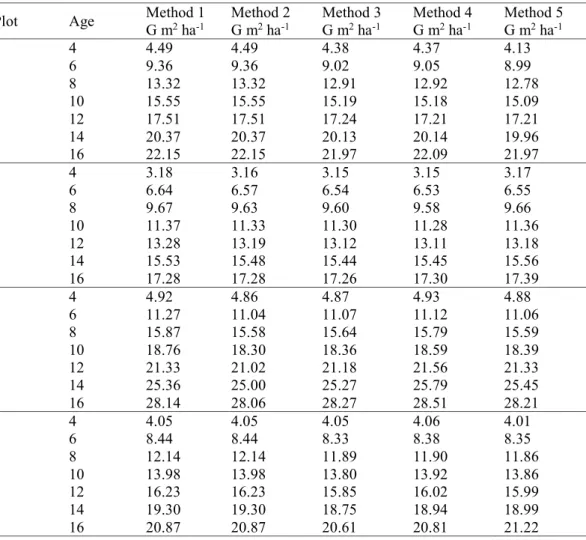
Table 3. Estimates of the basal area obtained through the application of the 5 methods of sampling extraction
Plot Age Method 1 G m2 ha-1 Method 2 G m2 ha-1 G mMethod 3 2 ha-1 Method 4 G m2 ha-1 Method 5 G m2 ha-1
1 4 4.49 4.49 4.38 4.37 4.13 1 6 9.36 9.36 9.02 9.05 8.99 1 8 13.32 13.32 12.91 12.92 12.78 1 10 15.55 15.55 15.19 15.18 15.09 1 12 17.51 17.51 17.24 17.21 17.21 1 14 20.37 20.37 20.13 20.14 19.96 1 16 22.15 22.15 21.97 22.09 21.97 2 4 3.18 3.16 3.15 3.15 3.17 2 6 6.64 6.57 6.54 6.53 6.55 2 8 9.67 9.63 9.60 9.58 9.66 2 10 11.37 11.33 11.30 11.28 11.36 2 12 13.28 13.19 13.12 13.11 13.18 2 14 15.53 15.48 15.44 15.45 15.56 2 16 17.28 17.28 17.26 17.30 17.39 3 4 4.92 4.86 4.87 4.93 4.88 3 6 11.27 11.04 11.07 11.12 11.06 3 8 15.87 15.58 15.64 15.79 15.59 3 10 18.76 18.30 18.36 18.59 18.39 3 12 21.33 21.02 21.18 21.56 21.33 3 14 25.36 25.00 25.27 25.79 25.45 3 16 28.14 28.06 28.27 28.51 28.21 4 4 4.05 4.05 4.05 4.06 4.01 4 6 8.44 8.44 8.33 8.38 8.35 4 8 12.14 12.14 11.89 11.90 11.86 4 10 13.98 13.98 13.80 13.92 13.86 4 12 16.23 16.23 15.85 16.02 15.99 4 14 19.30 19.30 18.75 18.94 18.99 4 16 20.87 20.87 20.61 20.81 21.22
Table 4. Values deriving from the ANOVA procedure. The error (%) of each estimate method is
Source Sum of Squares Df Mean Square F Sig.
Model 770.534 17 45.326 15.619 < 0.0001
AGE 357.359 12 29.780 10.262 < 0.0001
METHODS 70.771 4 17.693 6.097 < 0.0001
Error 705.168 243 2.902
Total 1475.702 260
Figure 6. Percentage error (%) (average and interval of confidence) corresponding to the minimum significant difference for each method of estimate compared to the obtained values.
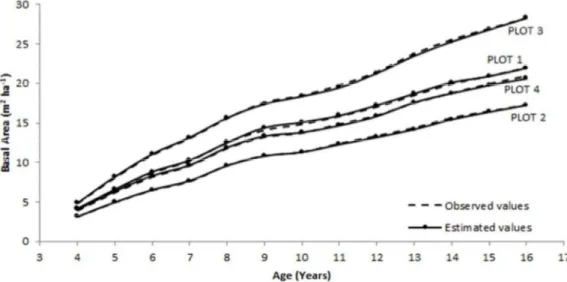
Fig. 7 shows the trends obtained for the real basal area and for the estimated basal area within the proposed methodology. The two lines are almost perfectly overlapped although, for a few years, a very slight underestimation or overestimation was observed; however, these errors can be considered not significant. The differences between the real basal area and basal area estimated with
the simplified method and related statistical significance is reported in Table 5. The differences in basal area estimates using the indipendent-sample t test (T-test) and the Mann Withney test (Z-test) were not significant for all the plots.
We believe that the method applied could be also adopted in other geographical contexts, even if the sample size can be
Table 5. Statistical significance between the real basal area and basal area estimated with the simplified method, assessed by the t test (T) and the Mann-Whitney test (Z)
Plot T Prob Z Prob.
Plot 1 0.127 0.979 -0.333 0.739
Plot 2 0.053 0.982 -0.333 0.739
Plot 3 0.067 0.992 -0.282 0.778
different. Once the sample has been identified, it is sufficient, on these trees, to reconstruct the diameters at breast height of the previous years (for example by taking from each sampled tree a core using the Pressler borer) and thus obtain the planting increment by multiplying the increments of the sampled trees at different ages for the number of trees to which the trees refer.
There are a variety of methods that can help assess a woodland (Dickmann, 2006; Aylott et al., 2008; Perez-Cruzado et al., 2011; Headlee et al., 2012; Marziliano et al., 2012; Tallis et al., 2012), however, in this paper, we have implemented a simplified methodology for estimating basal area development (parameter strongly correlated to the volume and growth of the forest), less expensive and easier to use than others methodologies. Therefore, this methodology can be, also for the accurate estimates it provides, a valid management guideline for choosing the best cultivation options (West, 2015), especially when the energy production deriving from woody biomass is the main objective of the plantation.
This methodology can be useful for medium rotation forestry (MRF) at definitive tree density, where the amount of trees is limited. On the contrary, in short rotation coppice and short rotation forestry (SRC and SRF), where the tree densities are higher, this methodological approach needs more experimentation.
However, the most important limitation of the proposed methodology is its field of application: it is not valid for all those stands that are subject to progressive natural or artificial thinning. In fact, in these stands, from the trees that form the sample size for estimate basal area, it could not be deduced the basal area increment at different ages because it is impossible to reconstruct the number of trees at the previous ages.
However, in all these contexts, the proposed methodology could be applied only for small periods of time (last 3 5 years) provided that in these years neither the vegetative conditions of the individuals trees nor the trees number were modified.
Figure 7. Trends obtained for the measured basal area (dotted lines) and for the basal area estimated (solid lines) with the proposed methodology.
CONCLUSIONS
This study provided a simplified methodological approach for forest managers and policy makers to estimate the basal area of poplar plantations at definitive tree density.
The analysis showed that, in a tree plantation with constant planting density (i.e. not subjected to intercalary thinnings), the estimate of some parameters of productions (in any year of the production cycle), such as basal area, volume and weight, can be carried out by analysing the increment of a few trees with DBH around the tree with average diameter and the multiplication the average basal area of these trees by trees number per hectare will yield an reliable estimate of the basal area per hectare. Our results underline the advantage to sample only few trees, without affecting the reliability of the estimate.
We can therefore finally answer to the questions proposed: (1) and (3) the trees number of reliable sample for basal area estimate is bigger than 1 and varies from a minimum of 7 to a maximum of 9 trees, depending on the variability of the experimental plots, (2) and these trees must have a diameter around the tree of average size.
In conclusion, this method here developed will permit reliable biomass estimates, but also a reduction of the costs in the sampling activities in the field. The availability of simplified technical tools for the evaluation and estimation of tree growth and yield is particularly important when the total economic value of a given tree plantation should be assessed. Finally, we believe that the knowdledge and use of these tools makes a landowner more informed, and better able to make decisions regarding your property.
ACKNOWLEDGEMENTS. We thank the Department of Agraria of Mediterannean University for supporting our research. In addition, we thank the anonymous reviewers for their careful reading of our manuscript and their many insightful comments and suggestions. Following the suggestions, we included several improvements in the manuscript.
REFERENCES
AA.VV. 2011. Cultivation models for wood production in the flatland. Quaderni della ricerca. Regione Lombardia, 127 (in Italian).
Arevalo, C., Volk, T.A., Bevilacqua, E. & Abrahamson, L. 2007. Development and validation of aboveground biomass estimations for four Salix clones in central New York. Biomass and Bioenergy 31, 1 12.
Armstrong, A., Johns, C. & Tubby, I. 1999. Effects of spacing and cutting cycle on the yield of poplar grown as an energy crop. Biomass and Bioenergy 17, 305 314.
Aylott, M.J., Casella, E., Tubby, I., Street, N., Smith, P. & Taylor, G. 2008. Yield and spatial supply of bioenergy poplar and willow short-rotation coppice in the UK. New Phytologist, 178, 358 370.
Bergante, S. & Facciotto, G. 2006. Annual, biennal, five-year planting. Productivity and costs in some companies in Northern Italy. Sherwood 128, 25 30.
Bergante, S., Zenone, T. & Facciotto, G. 2015. Short Rotation Forestry for Energy Production in Italy: Environmental Aspects and New Perspectives of Use in Biofuel Industry. In: Sustainable Biofuels. An Ecological Assessment of the Future Energy. ISBN: 978-311027 Casella, E. & Ceulemans, R. 2002. Spatial distribution of leaf morphological and physiological characteristics in relation to local radiation regime within the canopies of 3-year-old Populus clones in coppice culture. Tree Physiology 22, 1277 1288.
Ceulemans, R., Stettler, R.F., Hinckley, T.M., Isebrands, J.G. & Heilman, P.E. 1990. Crown architecture of Populus clones as determined by branch orientation and branch characteristics. Tree Physiology 7, 157 167.
Coaloa, D., Facciotto, G., Chiarabaglio, P.M., Giorcelli, A. & Nervo, G. 2016. Poplar clones to Larger Environmental Sustainability. SHERWOOD, 31 34 (in Italian).
Coletta, V., Menguzzato, G., Pellicone, G., Veltri, A. & Marziliano, P.A. 2016. Effect of thinning on above-ground biomass accumulation in a Douglas-fir plantation in southern Italy. Journal of Forestry Research 27(6), 1313 1320. doi: 10.1007/s11676-016-0247-9. Corona, P., Marziliano, P.A. & Scotti, R. 2002. Top-down growth modelling: a prototype for
poplar plantations in Italy. Forest Ecology and Management 161, 65 73. doi: 10.1016/S0378-1127(01)00481-9.
Dickmann, D.I. 2006. Silviculture and biology of short-rotation woody crops in temperate regions: then and now. Biomass and Bioenergy 30, 696 705.
Dillen, S.Y., Rood, S.B. & Ceulemans, R. 2010. Growth and physiology. In: Genetics and Genomics of Populus Plant Genetics and Genomics: Crops and Models (eds Jansson, S, Bhalerao, R, Groover, A), pp. 39 63. Springer, New York, NY.
Eastaugh, C.S. 2014. Relationships between the mean trees by basal area and by volume: reconciling form factors in the classic Bavarian yield and volume tables for Norway spruce. European Journal of Forest Research 133(5), 871 877. https://doi.org/10.1007/s10342-014-0804-8.
Facciotto, G., Di Candilo, M., Bergante, S., Lioia, C. & Diozzi, M. 2008. Poplar clones for biomass production in Italian SRC. In: Proceedings of 16th European Conference & Exhibition, Biomass for Energy, Industry and Climate Protection, Valencia, Spain, 2-6 June 2008, pp. 170 173.
FAO. 1998. World reference base for soil resources. The latest WRB classification manual. Food and Agriculture Organization of the United Nations, Rome, Italy, pp. 128.
Fischer, M., Trnka, J., Fajman, M. & Z. 2011. Biomass productivity and
water use relation in short rotation poplar coppice (Populus nigra x P. maximowiczii) in the conditions of Czech Moravian Highlands. Acta univ. agric. et silvic. Mendel. Brun. LIX 6, 141 152.
Fowler, J. & Cohen, L. 1995. Statistics for Ornithologist. 2nd edition. British Trust for Ornithology, Guide No 22, Distributed by NHBS, UK.
Gordon, A.D. 1999. Classification, 2nd ed. Chapman & Hall, London, 272 pp.
Grogan, P. & Matthews, R. 2002. A modelling analysis of the potential for soil carbon sequestration under short rotation coppice willow bioenergy plantations. Soil Use and Management 18(3), 175 183.
Headlee, W.L., Zalesny, R.S., Donner, D.M. & Hall, R.B. 2012. Using a process-based model (3-pg) to predict and map hybrid poplar biomass productivity in Minnesota and Wisconsin, USA. BioEnergy Research 6, 196 210.
Hellrigl, B. 1970. The sample size in the dendrometric survey. XXV(6), 312 319 (in Italian).
Hill, J., Nelson, E., Tilman, D., Polasky, S. & Tiffany, D. 2006. Environmental, economic, and energetic costs and benefits of biodiesel and ethanol biofuels. Proceedings of the National Academy of Sciences USA 103, 11206 11210.
Hinchee, M., Rottmann, W., Mullinax, L., Zhang, C., Chang, S., Cunningham, M., Pearson, L. & Nehra, N. 2009. Short-rotation woody crops for bioenergy and biofuels applications. Vitro Cell.Dev.Biol. Plant 45, 619 629. DOI 10.1007/s11627-009-9235-5.
IEA (INTERNATIONAL ENERGY AGENCY) 2003. IEA statistics-renewable in- formation, IEA/OECD, Paris.
Isebrands, J.G. & Karnosky, D.F. 2001. Environmental benefits of poplar culture. In Poplar culture in North America. NRC-CNRC Press, Ottawa, Ontario, Canada, pp. 309 324. Kheshgi, H.S., Prince, R.C. & Marland, G. 2000. The potential of biomass fuels in the context of
global climate change: focus on transportation fuels. Annual Review of Energy and the Environment 25,199 244.
Lombardi, F., Marchetti, M., Corona, P., Merlini, P., Chirici, G., Tognetti, R., Burrascano, S., Alivernini, A. & Puletti N. 2015. Quantifying the effect of sampling plot size on the estimation of structural indicators in old-growth forest stands. Forest Ecology and Management 346, 89 97.
Macaya-Sanz, D., Chen, J.G, Kalluri, U.C., Muchero, W., Tschaplinski, T.J., Gunter, L.E., Simon, S.J., Biswal, A.K., Bryan, A.C., Payyavula, R., Xie, M., Yang, Y., Zhang, J., Mohnen, D., Tuskan, G.A. & Di Fazio, S.P. 2017. Agronomic performance of Populus deltoides trees engineered for biofuel production. Biotechnol Biofuels 10, 253. DOI 10.1186/s13068-017-0934-6.
Marziliano, P.A., Menguzzato, G., Scuderi, A. & Corona, P. 2012. Simplified methods to inventory the current annual increment of forest standing volume. iForest 5, 276 282. Marziliano, P.A., Coletta, V., Menguzzato, G., Nicolaci, A., Pellicone, G. & Veltri, A. 2015.
Effects of planting density on the distribution of biomass in a douglas-fir plantation in southern Italy. iForest 8, 368-376. [online 2014-09-09] doi: 10.3832/ifor1078-007. Marziliano, P.A., Menguzzato, G., Scuderi, A., Scalise, C. & Coletta, V. 2017. Biomass
conversion and expansion factors in Douglas-fir stands of different planting density: variation according to individual growth and prediction equations. Forest Systems 26, e003. https://doi.org/10.5424/fs/2017261-10239.
Montgomery, D. 2001. Introduction to statistical quality control (4th edn). John Wiley & Sons, New York, USA, 795 pp.
Nervo, G., Coaloa, D., Vietto, L., Giorcelli, A. & Allegro, G. 2011. Current situation and prospects for European poplar culture: the role of Italian research. Actas del Tercer
-19 March 2011, pp 117 125. Niemczyk, M., Wojda, T. & Kaliszewski, A. 2016. Biomass productivity of selected poplar
(Populus spp.) cultivars in short rotations in northern Poland. New Zealand Journal of Forestry Science 46, 22. DOI 10.1186/s40490-016-0077-8.
Oshumi, N. 1980. Evaluation procedure of agglomerative hierarchical clustering methods by fuzzy relations. In: Diday, E. (Ed.), Data Analysis and Informatics II. Elsevier Science, Amsterdam, pp. 509 522.
Pavari, A. 1959. Phytoclimatic classifications and station characteristics. Scritti di ecologia selvicoltura e botanica forestale, pp. 45 116 (in Italian).
-Cruzado, C., Merino, -Soalleiro, R. 2011. A management tool for
estimating bioenergy production and carbon sequestration in Eucalyptus globulus and Eucalyptus nitens grown as short rotation woody crops in north-west Spain. Biomass and Bioenergy 35, 2839 2851.
Perez-Cruzado, C., Ron, D., Rodriguez-Soalleiro, R., Hernandez, M.J., Sanchez-Martin, M.M., Canellas, I. & Sixto, H. 2014. Biomass production assessment from Populus spp. short-rotation irrigated crops in Spain. GCB Bioenergy 6, 312 326, doi: 10.1111/gcbb.12061 Perttu, K.L. 1998. Environmental justification for short rotation forestry in Sweden. Biomass and
Bioenergy 15(1), 1 6.
Rand, W.M. 1971. Objective criteria for the evaluation of clustering methods. Journal of the American Statistical Association 66, 846 850.
Rosenqvist, H., Roos, A., Ling, E. & Hector, B. 2000. Willow growers in Sweden. Biomass and Bioenergy 18(2), 137 145.
Scholz, V. & Ellerbrock, R. 2002. The growth productivity and environmental impact of the cultivation of energy crops on sandy soil in Germany. Biomass and Bioenergy 23(2), 81 92. Soliani, L. 2008. Applied statistics. UNI.NOVA, Parma, Italy, pp. 694 (In Italian).
Stampfl, P.F., Clifton-Brown, J.C. & Jones, M.B. 2007. European-wide GIS-based modelling system for quantifying the feedstock from Miscanthus and the potential contribution to renewable energy targets. Global Change Biology 13, 2283 2295.
Tallis, M.J., Casella, E., Henshall, P.A., Aylott, M.J., Randle, T.J., Morison, J.I.L. & Taylor, G. 2012. Development and evaluation of ForestGrowth-SRC a process-based model for short rotation coppice yield and spatial supply reveals poplar uses water more efficiently than willow. Global Change Biology Bioenergy 5, 53 66.
Wang, D., Lebauer, D. & Dietze, M. 2013. Predicting yields of short-rotation hybrid poplar (Populus spp.) for the United States through model data synthesis. Ecological Applications 23(4), 944 958 (USA).
West, P.W. 2015. Tree and Forest Measurement. Third Edition. Springer International Publishing, 214. DOI:10.1007/978-3-319-14708-6
Zar, J.H. 1996. Biostatistical analysis (3rd edn). Prentice Hall Inc., Englewood Cliffs, NJ, USA, 718 pp.