Experimental analysis
of the efficiency of carbon fiber anchors
applied over CFRP to firebrick bonded joints
C
AGGEGIC
ARMELO
PHD SCHOOL ON “INGEGNERIASTRUTTURALE EGEOTENICA” -XXV CICLO UNIVERSITY OF CATANIA (ITALY)
PHD SCHOOL ON “SCIENCE,INGENIERIEETENVIRONNEMENT”
UNIVERSITY PARIS-EST (FRANCE)
Università degli
Studi di Catania
Ministero dell’Istruzione dell’Università e della Ricerca
1
Experimental analysis
of the efficiency of carbon fiber anchors
applied over CFRP to firebrick bonded joints
C
AGGEGIC
ARMELOItalian Supervisor - University of Catania
Professor Massimo Cuomo
French Supervisor - University of Paris-Est Marne-La-Vallée
Professor Luc Chevalier
Others members of thesis group
Prof. Vincent Pensée (UPE MLV), Prof. Loredana Contrafatto (UNI CT)
PHD SCHOOL ON “INGEGNERIASTRUTTURALE EGEOTENICA” - XXV CICLO
UNIVERSITY OF CATANIA (ITALY)
PHD SCHOOL ON “SCIENCE,INGENIERIEETENVIRONNEMENT”
2
Contents
Introduction ... 4
1. FRP reinforced systems: from debonding fracture to mechanical anchors ... 6
1.1 Materials ... 6
1.1.1 Mechanical property of FRP ... 6
1.1.2 Mechanical property of masonry ... 9
1.2 Strengthening design criteria, application and failure modes ... 10
1.3 Debonding crisis ... 12
1.3.1 Definitions ... 12
1.3.2 Analytical considerations ... 16
1.3.3 Experimental and numerical study ... 20
1.3.2 Debonding strength and masonry: a study case ... 27
1.4 Mechanicals anchors ... 28
2 Experimental Program ... 37
2.1 Motivation, goals and methodology ... 38
2.2 Experimental Setup ... 39
2.2.1 Boundary conditions ... 39
2.2.2 Specimens ... 40
2.2.2.1 Materials ... 40
2.2.2.1.1 Fire brick ... 40
2.2.2.1.2 Epoxy resin primer ... 43
2.2.2.1.3 Epoxy resin adhesive ... 43
2.2.2.1.4 Carbon fabric ... 44
2.2.2.2 Design of specimen’s geometry ... 44
2.2.2.3 Anchor details ... 49
2.2.2.4 Specimen construction details ... 51
2.2.3 Universal machine ... 54
2.2.4 Mechanical systems to contrast the brick and to grip the fibers ... 54
2.2.4.1 Steel lock ... 55
2.2.4.1.1 Design; hypothesis and FEM studies ... 55
2.2.4.1.2 - Realization process ... 63
3
2.2.4.2 The steel tongs ... 68
2.2.4.3 Test machine; a global view ... 70
2.2.5 The specimen placement ... 72
2.2.6 Test procedure; instrumentation and load history ... 76
3 The strain field analysis by Digital Image Correlation ... 81
3.1 A optical measurement technique to study the 2D displacement and strain field ... 81
3.2 The CCD camera and the digital photos ... 85
3.3 The digital image correlation method ... 86
3.4 The correlation algorithm CORRELIGD to study the two dimensional-signals ... 89
3.5 The speckle onto the observed surface ... 90
3.6 A preliminary case study: rubber in traction ... 91
3.7 The CFRP to fire brick bonded NES shear test and the Digital Image Correlation ... 97
4 Experimental Results ... 100
4.1 Results overview ... 100
4.1.1 The displacement-load graphs, the peaks and the dissipated energy ... 100
4.1.2 Failure modes and fracture definitions ... 104
4.1.3 Strain field analyze ... 104
4.2 Result sheets ... 106 4.2.1 Series T0 ... 106 4.2.2 Series T1_25_V... 110 4.2.3 Series T1_40_O ... 115 4.2.4 Series T1_40_V... 118 4.2.5 Series T2_40_V... 125 4.2.6 - Series T3_25_V ... 132
4.3 Discussion about the global results ... 135
5 Conclusions ... 139
4
Introduction
In these recent years, the strengthening of masonry building has known a massive use of CFRP sheets. Those composite materials glued on the elements to reinforce are exposed to prematurely debonding crisis due to a tension load which is much smaller than the tensile strength of the CFRP. A way to upgrade failure load of CFRP-to-support bonded joint is to reinforce the cohesion between the fibers and the support by the use of mechanicals anchors built with the same fibers of the composite and fastened in the support like “nails”. Research on the use of anchors for masonry supports has been limited and there are no experimental analyses related to the design and the placement of fiber anchors.
The aim of this thesis is to provide experimental data to quantify the efficiency of the carbon fiber anchors applied on a reinforced fire brick. This is a ground work to study CFRP to masonry bonded joint fastened by fiber “nails”. Specifically, the analysis of the displacement and the strain fields of the reinforced surface have been realized by means of Digital Image Correlation (DIC), an optical appealing method never used to study a FRP to support bonded joint fastened by FRP anchor.
This work is divided in five chapters. The first is devoted to a literature review about FRP properties, design parameters and reinforcement improvement technics (nails, U WRAPS). Experimental and numerical aspects are discussed.
In the second chapter, the experimental procedure is described and details about the project of the testing machine are addressed. Motivations and designs of the specimen’s configuration are presented.
The third chapter deals with general aspects about the digital image correlation technic. Results and main considerations are presented in the fourth chapter.
Finally, the increase in resistance adducted by the FRP anchors is quantified defining the average peak of load registered in the reinforced configurations and the energy dissipated during the fracture processes. The several perspectives of this research work are presented at the end of the thesis.
5
Chapter 1
FRP reinforced systems: from debonding fracture to mechanical anchors
1 . FRP reinforced systems: from debonding fracture to mechanical anchors ... 6
1.1 Materials ... 6
1.1.1 Mechanical property of FRP ... 6
1.1.2 Mechanical property of masonry ... 9
1.2 Strengthening design criteria, application and failure modes ... 10
1.3 Debonding crisis... 12
1.3.1 Definitions ... 12
1.3.2 Analytical considerations ... 16
1.3.3 Experimental and numerical study ... 20
1.3.2 Debonding strength and masonry: a study case ... 27
6
1
. FRP reinforced systems: from debonding fracture to mechanical
anchors
An analysis of the literature about the reinforcement of masonry structures by means of FRP (Fiber Reinforced Poymers) is proposed in this chapter. A description of the properties of the reinforcement (FRP) and of the support (masonry) is presented in the first part of this section. Subsequently the parameters and the design criterions of the straightened FRP systems are defined. After that, the attention is focused on the premature debonding failure of the systems FRP-to-support bonded joints. The final part of the chapter deals with the mechanicals anchors (FRP anchors and U Wraps) and with their capacity to improve the peak resistance of the straightened systems.
1.1 Materials
1.1.1 Mechanical property of FRP
The Fiber reinforced polymers, named briefly FRP, are composite materials constituted by reinforcing fibers embedded in a polymeric matrix. The fibers are responsible for carrying the load acting on the composite; the matrix has three functions to protect the fibers from the environment, to distribute the load and to link the composite to the support [1]. The FRP have heterogeneous and anisotropic properties and a prevalent linear elastic behavior up to failure in contrast to steel (yield behavior). In the field of civil engineering the fiber reinforced polymers could be made in factory (pre-impregnated fabric) or realized directly in the job site applying special resins over the dry fabric (non-impregnated fabric).
Three main types of fibers are used: glass (GFRP), aramid (AFRP) and carbon fibers (CFRP) (fig.
1.a). These latter are assembled in a filiform geometry, they are continuous and their diameter is in
the range of 4 to 10 micrometers [2]. The mechanical properties of fibers have been shown in the
figure 1.b. Among the three typologies already mentioned, the CFRP have the greatest values of
maximal stress and the greatest value of stiffness. In the structural strengthening field the fibers are assembled in unidirectional, bidirectional or multiaxial fabrics. The unidirectional tissue is characterized by fibers all oriented in the direction of the length, the bidirectional fabric is made of an orthogonal weft-warp weaving and the multiaxial tissue is characterized by fibers oriented in different directions.
The matrix of FRP composites is commonly realized with thermoset resins. These latter are characterized by a low viscosity, good adhesive properties, a good resistance to chemical agents and
7 an absence of melting temperature. In the field of civil engineering the epoxy resin is commonly used; it has a good resistance to moisture, to chemical agents and excellent adhesive properties. The epoxy resin changes her mechanical properties at a temperature greatest of 60°C, this is an essential characteristic in the design project field.
1.a Fabric fibers(aramidic, glass, carbon) 1.b Stress-strain diagram for different fibers [1]
1.I Comparison between the properties of FRP components and steel [1] In the table 1.I one can see a comparison between the property of fibers, matrix and steel.
The mechanical properties of FRP materials are due to the composite geometry (shape, thickness), fibers orientation (unidirectional, bidirectional or multiaxial fabric) and concentration. The composite does not have the same mechanical properties of the fibers, in fact the presence of the matrix lowers the level of the stress resistance (see fig. 1.c and table 1.II). For FRP materials characterized by unidirectional fibers the mechanical property of the composite may be estimate using the rule of mixtures written below.
8 Obviously the increase of fiber volumetric fraction improve the mechanical quality of the composite (fig. 1.d).
1.c Stress-strain diagram for fibers and matrix [1] 1.d Fibers and mechanical properties [1]
1.II CFRP and carbon fibers [1]
Analyses of graphic stress-strain of FRP rods (fig. 1.e) permit to compare properties of steel (traditional material used in civil engineering for his high tensile resistance) and those of FRP composites. Stiffness of FRP is smaller than that of steel. The behavior of steel is ductile, unlike the failure of FRP composite is fragile after an elastic stroke. The stress tensile limit of CFRP is more than five times higher than that of steel. Among the composites materials represented in the figure
1.e FRP made by carbon fibers has the highest value of stiffness.
9
1.1.2 Mechanical property of masonry
Traditional masonries are composed of prismatic blocks and mortar. The formers give the system mechanical resistance, the latter is applied among the blocks to distribute the load and to prepare the surface to apply others layers of prismatic elements. Normally the blocks could be naturals (stone) or artificial (fire brick, cinder block.). Each geographical territory is characterized by typical typologies of masonry since in each zone there are typical materials and typical construction techniques. The principal typologies of stone used in the civil engineering are: igneous rocks (granite, basalt, pumice, tuff…), metamorphic stone (marble…) and sedimentary stone (limestone, sandstones…). Instead, the main typologies of masonry are: the rubble masonry, the ashlar masonry, the slipform stone masonry, the dry set masonry, the solid brick work, etc (fig. 1.f and
1.g). Masonry characterized by rubble elements presents a big quantity of mortar and poorer
mechanical quality than the ashlar masonry.
1.f Stone rubble masonry (territory of Catania) [3] 1.g Stone ashlar masonry (territory of Catania) [3]
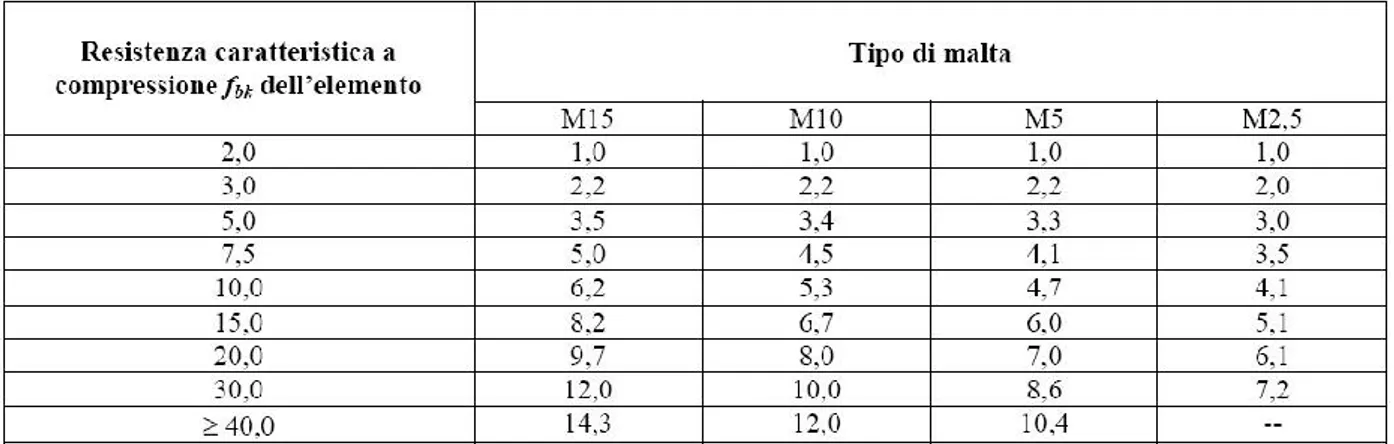
The large field of wall typologies and materials make impossible a global and synthetic analysis of the masonries. The technical Italian law D.M. 14 January 2008 [4] provide a classification of mortar types (table 1.III); the number of these classes (M2,5, M5…) corresponds to the compression strength in N/mm2. In the same ministerial regulation, there is a table of the masonry compression strength values in relation to mortar quality and stone typologies (table 1.IV).
10 1.IV Masonry compressive strength fk [N/mm2] in relation to mortar class and stone resistance [4]
The compressive characteristic strength fbk of the elements (first column of the table 1.IV) is defined
above:
(1.1)
Where:
fbm is the average value of the compressive strength of the stone element.
Table 1.IV shows that the masonry compressive characteristic strength fk is included between 1
MPa and 14,3 MPa.
Indeed the tensile resistance of masonry wall is approximately equal to 1/10 of fk, for the safety this
low value is frequently considered null by engineers.
Unlike FRP materials masonries have good permeability property and good fire resistance.
1.2 Strengthening design criteria, application and failure modes
The strengthening of civil structures by FRP consists to apply the composite over the support to reinforce (concrete, masonry…). In the framework of masonry building the use of the fiber reinforced polymer (laminates, sheets, grids and bars) is oriented to increase the capacity of each structural member as well as the global capacity of the structure [1]. Particularly the main reason that justify the use of FRP are:
- To carry the tensile stress within the structural members or between adjoining members - To connect more structural members (orthogonal walls, walls and vault…)
- To stiffen the horizontal elements (vault, floor…) - To limit the crack width
11 - To confine the columns to enhance their resistance
The application of FRP on the member to reinforce is carried out by adhesion or by means of mechanical anchorages devices. Often in the civil engineering field, the non-impregnated fabric (carbon , glass or aramid) is bonded directly over the support surface using epoxy resins. The results is the realization of the FRP composite directly “in situ”.
The adhesion between support and FRP is fundamental for the efficiency strength. Unlike concrete elements, masonries have commonly the external surfaces roughened, this is due to the presence of blocks and mortar. This surface configuration make necessary to apply a leveling mortar on the roughened layer. In synthesis the phases of application of a FRP strength system are:
- Clean the surface of application
- Apply, if necessary, a leveling mortar [1] - Spread a layer of epoxy bi-component resin - Spread the dry-fabric on the resin
- Spread another layer of epoxy resin on the fabric by a roller brush.
The roller brush is used to eliminate the empty air within the fabric and the resin. In figures 1.h the photos of FRP application procedure carried out during reinforcement of the vaults of the church “Spirito Santo” in Nicolosi (CT-Italy).
fig. 1.h - Steps of FRP application (strengthening of the vaults of the church “Spirito Santo” in Nicolosi - CT): application on a leveling mortar of a layer of epoxy resin (photo 1), placing of the dry monodirectional glass fabric (photo 2), application by roller brush of a epoxy resin layer (photo 3)
The failure of the masonry reinforced by FRP could occur in one or in a mixture of the follows modality [1]:
- Excessive cracking in the wall (tensile stress) - Crushing of masonry structural element
12 - Shear slip of masonry
- FRP rupture - FRP debonding
Among these failure typologies, the debonding is one of the most critical because occurs at tension much smaller of tensile capacity of the composite. The study of this brittle modality of failure is the starting point of this thesis research.
1.3 The debonding crisis
1.3.1 Definitions
Debonding failure consists in the detachment of FRP from the support. It occurs with a brittle expansion of a crack between the reinforce and the substrate.
The fracture could be [1]: adhesive, cohesive, mixed (see fig.1.i). The adhesive fracture take place in the interface between adhesive and support material, it is characterized by a smooth surface. Frequently, it occurs when the application of the reinforce is inaccurate. The cohesive fracture take place inside the support, it is characterized by a rubble surface. In both sides of the crack opening is present the same material (concrete, mortar…). This kind of fracture is often noted when the debonding occurs. The mixed fracture is registered when both cohesive and adhesive failure happen. In this case, the crack surface is characterized by the coexistence of support and FRP composite materials.
fig 1.i - The main typologies of fracture (adhesive, cohesive, mixed) [1]
The debonding may occur in two main failure modes [1]: plate and debonding and intermediate crack debonding. The first failure type occurs when the detachment between FRP and support take place in the extremity of the reinforcement (fig. 1.j). Instead, the intermediate crack debonding take place in the proximity of the existing crack on the support (fig. 1.k). In this case, the presence of a stress concentration occurs to the development of the debonding. When on the reinforce are applied not only stresses in the direction of the fibers but also significant tensile stresses perpendicular to
13 the composite surface (peeling), the forces that can be transferred by the adhesive layer are reduced and the debonding occurs prematurely [1].
fig 1.j - Failure mode “plate and debonding” fig. 1.k - Failure mode “intermediate crack debonding”
The study of the debonding makes necessary to define some parameters: the fracture energy ( ), the effective bond length (le) and the design bond strength (fdd). In the simple case represented in the
figure 1.l are defined the geometric property of a simple reinforce.
fig 1.l -Support reinforced by a FRP sheet [1]
The fracture energy J is the quantity of energy dissipated during the debonding failure; it’s equal to the area underlying the curve displacement [mm] – Load [kN] that describe a shear test.
In the design of a reinforcement is topic to calculate the ultimate value of the force that could be transferred from the FRP reinforcement to the support prior to FRP debonding, this force is named fmdd.
Experimental and numerical studies show that an increase of the bond length l up to the length le
cause an augment of the fmdd; further increase of the bonded area doesn’t increase the value of the
force transferred. The length le is called optimal bond length [1] or effective bond length [5].
Therefore in the case of the simple block reinforced of fig. 1.l the strain stresses is transferred between the FRP and the support in a short area nearest to the applied load; the length of this bond area is le. When the load increase, in this zone occurs the apparition of cracks, at the same time, the
stress transfer area is displaced to the unloaded side of reinforcement. This phenomenon justify that if l > le the system have a residual ductility after the formation of the first crack (before the
14 debonding, the stress transfer zone has to move toward the extremity of the unloaded side). If l = le
the appearance of the first crack is simultaneous with the total debonding fracture. Yuan et al. [5] defined le as the value corresponding to 97% of the load carrying capacity if l is infinite.
To define the debonding parameters a lot of fracture mechanics based models starting from experimental results have been realized . Niedermaier R. in 1996 [5] studying the bond strength between a steel plate and a concrete support by means of a nonlinear fracture mechanics defined the relations of fdd, le and f . Denoted Ep the Young modulus of composite, the ultimate bond load is
given by:
(1.1)
Where the effective bond length le is written as:
(1.3)
And Gf is the fracture energy:
(1.4)
With cf a constant determinate in a linear regression analysis using the results of double shear or similar tests, and Kp a geometrical factor defined by:
(1.5)
15 In these expressions the value of ultimate load is proportional to: the width of the bonded composite, the energy fracture, the stiffness of the composite and the thickness of the FRP. Instead the effective bond length is proportional to the stiffness and the thickness of the composite and inversely proportional to the strength tensile capacity of the concrete support. It’s interesting to note that the value of Gf is connected to the ratio between bp and bc.
Neubauer U. and Rostàsy (1997) [5] studied the debonding problem by means of a serie of double shear tests on CFRP applied over a concrete support. They affirmed that, for both cohesive failure and adhesive failure, the shear-slip relationship may be represented by a bilinear model (fig. 1.m).
fig. 1.m - Shear-slip relationship model [5]
They defined an average value of cf, corresponding to 0,204 [mm] and proposed the following new
expressions of the parameters:
(1.6)
(1.7)
(1.10)
In the equation (1.6) of Pu the value of Gf, present in (1.2), is replaced by fctmk2p. It’s possible to
underline that the value of the bond length of equation (1.10) is bigger than that of equation (1.5). To design a reinforcement Neauber and Rostasy [5] proposed to use 75% of the ultimate bond strength.
16 The CNR DT 200/2004 [1] provides the following equations of design bond strength (ffdd) and
fracture energy ( fk):
(1.9)
(1.10)
Where is a partial factor depending on the FRP application, M is a partial factor of the
masonry, c1 is an experimental determined coefficient, fmk is the masonry average compressive
strength and fmtm is the masonry average tensile strength.
1.3.2 Analytical considerations
The equation of the optimal anchor length (le) provided by the CNR [1] is the same than that of
Neauber and Rostasy [5], eq. (1.8).
In the framework of industrial mechanic the adhesion problem has been much studied. In 2008 Jongsma J. [7] proposed a model to analyze the shear stress distribution in the adhesive layer of a “easy peel” system (fig. 1.n). This last is a type of closure for metal cans of aliment products, it consists in a foil material (easy peel sealing) bonded over a ring (easy peal ring) seamed on the top of the tin (fig. 1.o). When the closed can is sterilized, the product is heated and, consequently, it expands (fig.1.p).
During this process in the adhesive layer is developed a shear stress. To study this last Jongsma J. [7] realized an analytic elastic model. The boundary conditions of the debonding problem studied are presented in figure 1.q. The aluminum support is blocked in a extremity, upon this last are placed, in order, a stratum of adhesive and the aluminum easy peel.
fig. 1.p - Expansion of a metal can during the sterilization [7] 1.o Cross section of easy-peel
ring [7] fig. 1.n - Metal cans with easy
17 fig. 1.q - Schematic representation of simplified sealed zone (easy-peal) [7]
The value of the shear deformation x is directly obtained from the motion induced by the lower and upper metallic layers. Resolving the differential equations describing the equilibrium on the interfaces support-adhesive and adhesive-easy peel sealing, the shear deformation (x) is obtained as:
(1.11)
With:
(1.12)
Where u1 is the displacement in x-direction of the lower joint interface, u2 is the displacement in
x-direction of the upper joint interface, E1 is the Young modulus of the lower aluminum part, E2 is the
Young modulus of the upper aluminum part, L is the seal width , Gp is the shear modulus of
polymer joint, h1 is the thickness of the lower aluminum part, h2 is the thickness of the upper
aluminum part, hp is the thickness of polymer joint and F is the tensile force applied on upper
aluminum part.
The results of Jongsma [7] confirm that the shear distribution is not homogeneous in the adhesive layer; there is a short area nearest to the applied load characterized by a stress concentration (the effective bond length). When the adhesive thickness (hp) decrease the stress concentration is more
remarkable (fig. 1.r). Jongsma affirm that this is a proof that the phenomenon of the heterogeneous shear stress distribution is a thin layer effect.
18 fig. 1.r - Shear stress distribution in the adhesive zone according to Jongsma analytic model for four different adhesive thickness [7]
Cottone and Giambanco (2010) [8] studied the stress transfer between a FRP to support bonded joint during a single shear pulling test. They modelised the composite reinforcement as an indefinitely elastic beam connected to a Winkler non-linear deformable foundation (figures 1.s a,b).
fig. 1.s - a) Physical schematization of the contact stratus ; b) Mechanical scheme adopted for the simulation of single shear pulling test by Cottone and Giambanco [8]
The interface layer is composed by two stratus: the thin film of adhesive and a layer of consolidated material of the substrate. They chosen this typologies of schematization because the cohesive fracture occurs a few millimeters under the interface “adhesive-support”. In [8] the behavior of the FRP to the support interface is described by constitutive laws derived from elasto-plasticity theory with softening (fig. 1.t). The study permits to focalize the pure elastic response of the FRP-substrate system, the evolution of the elasto-plastic zone and the fracture propagation.
19 During a single shear test, when the applied force F exceed the elastic limit FE, the damage process
takes place in the extremity loaded. In this experimental step, the interface can be divided in two parts; the portion of length where an elasto-plastic damage occurs, and the remaining portion whose behavior is elastic (figure 1.u).
fig. 1.u - Schematic representation of the interface when Fe < F < FF (elastic whole zone and elasto-plastic decohesion zone) [8]
When the force F reach the value of FU (ultimate fracture load) a crack appear in the extremity
loaded of the FRP to support bonded joint. In this experimental step, in the interface there are a elastic whole zone, a elasto-plastic damaged zone and a cracked zone (fig. 1.v).
fig. 1.v - Schematic representation of the interface when u(L) > uF [8]
Cottone and Giambanco [8] define an equation to calculate the maximum extension of the elasto-plastic zone at the interface; the length i.
(1.13)
Where si is the interface softening modulus and KB is the axial stiffness of the composite. The
20 apparition of the first crack occurs simultaneously with the total debonding fracture. If L is bigger than i, after the first crack the elasto-plastic damage zone is displaced to the opposite direction of
the applied load, this phenomenon happens without any increase of F. The advancement of the crack corresponding to a continuum displacement of the elasto-plastic zone to the unloaded end; when the value of = i and there is no more whole zone, the crack can’t advance more and a total
debonding occurs. In synthesis if L < i a brittle failure take place. If L > i , more L is bigger than i more the ductility of the FRP to support bonded joint is increased.
1.3.3 Experimental and numerical study
In the literature studies many different experimental set-ups have been used to determine the FRP-to-concrete bond strength. A classification of the bond tests, with a clearly representation of the corresponding boundary condition is given by Yao et al. [6]. They defined the following five tests type: a) far end supported double-shear tests (FES); b) near end supported (NES) double-shear tests; c) far end supported (FES) single shear tests; d) near end supported (NES) single-shear tests; e) beam test; f) modified beam test (figure 1.w).
fig. 1.w - Classification of bond tests [6]
Numerical and experimental studies have shown that the different boundary condition can lead to significantly different test results. The double shear test and the single shear pull tests have been widely used for their simplicity. Yao et al. [6] realized an experimental study using a NES single-shear pull test. They affirm that this boundary condition permits to describe the stress state in the critical region of a beam when an intermediate crack-induced the debonding failure. Therefore, the
21 near end single-shear pull test is proposed to be a standard set-up for determining the FRP-to-concrete bond strength [6]. The experimental session conducted by Yao et al [6] consist in 72 shear tests on concrete prisms bonded with FRP strip. Different series of specimens was studied to analyze the follow factors: the bond length, the width ratio between the FRP strip and the concrete support (bfrp/bc) and the offset ( ) in the load position (fig. 1.x).
fig. 1.x - Specimen and boundary condition of Yao et al. experimental session [6]
The experiments confirm that the failure of the FRP reinforced systems occurs mainly with a cohesive fracture. Indeed, fifty-six out of the 72 specimens failed due to a debonding in concrete, eight specimens failed with an adhesive fracture and the remaining eight specimens failed in the concrete by detachment of a big angular prism (concrete prism failure, see figures 1.y).
fig. 1.y - Failure modes in the Yao et al. experimental session [6]
The adhesive fracture occurs only in the tests series prepared by an assistant with limited experience. The concrete prism failure takes place when the rate bfrp/bc ≥ 0,8. In the specimens
characterized by a small bond length when the first crack take place in the loaded-end quickly occurs a brittle debonding failure. The figure 1.z shows the strain distribution in FRP during the test I-1 (specimen with Lfrp = 75mm). Analyzing the image it is possible to note that the strain
increase with the applied load and the stress transfer zone moves from the loaded side to the unloaded side. In the test I-16, executed over a specimen dissimilar from the specimen I-1 only for a larger bond length (Lfrp = 190 mm), the first crack occurres at a similar load of the test I-1 but the
22 transfer zone during the test is clear in the figures 1.aa. The figure proposed by Yao et al. [6] are realized using a normalized distance from loaded end (x/Le), where Le is the effective bond length
defined by Chen [5].
The Yao et al. [6] tests underline that an increase of the bond length not increase the load of the first crack but the ductility of the system. In this case the displacement of the effective bond length (stress transfer zone) through the whole FRP to concrete interface permits to delay the total debonding fracture.
Finally Yao et al. [6] found in their experiment that the existence of a loading offsets reduced the ultimate bond strength significantly only when the bond length is small.
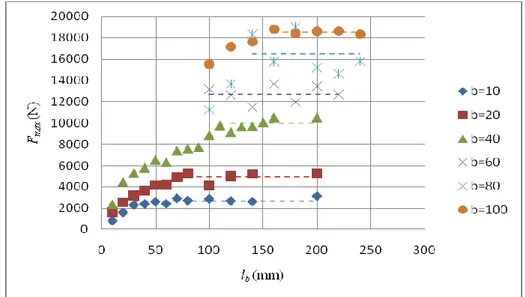
Research on masonry-FRP systems is much more limited. Experimental studies by means of shear tests have been managed on brick (homogeneus support), pillar and masonry walls (heterogeneous support). Briccoli Bati S. and Fagone M. [10] made an experimental analysis using near end supported shear tests to value the collapse load of CFRP reinforce applied to a single brick specimens. The tests executed had a FRP width (b) varying from 10 to 100 mm and a length (lb)
varying from 10 to 240 mm. The image 1.bb shows that the increase of the bond length leads to an fig. 1.aa - Strain distribution along the FRP, test I-16 (L=190)
fig. 1.z - Strain distribution along the FRP, test I-1 of Yao and al. (L=75 mm) [6]
23 increase of the collapse load until the achievement of an effective bond length. The value of le is
the abscissa of the point where the slope of the curves lb-Fmax become almost horizontal (figure
1.bb).
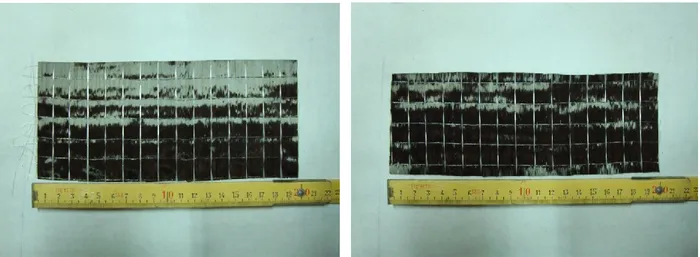
fig. 1.bb - Bond length and specific maximum load varying the FRP width (a M. Fagone Cortesy) More the FRP width (b) is bigger, more the value of the collapse load increases. The main failure mode unregistered during the tests [10][11] is the cohesive fracture (figures 1.cc).
fig. 1.cc - Failure mode, NES double shear tests (a M. Fagone courtesy)
Another experimental analysis by NES double shear test on FRP to historic brick bonded joint has been executed by Capozzucca [12]. The reinforcements tested were been made by GFRP, CFRP and SRP (Steel reinforced polymer) with a width of 50 mm and a bond length of 250 mm. The historic brick have approximately dimension of 300x150x80 mm. The stress transfer advancement described in this work is coherent with the Yao et al. analysis [6] (fig. 1.dd).
24 Experimental and numerical studies show that most of failure modes in flexion of masonry walls reinforced by FRP systems are due to the extremity or to the intermediate debonding [13], [14].
fig. 1.dd - Experimental strain values for the CFRP-to-historic brick bonded joint [12]
Fedele and Milani [9] studied the debonding failure of a masonry pillar reinforced with FRP by means of a damage continuum model. The masonry element is constituted by three standard bricks interposed by two mortar joints. Since the fracture occurs nearly in a cohesive manner Fedele and Milani [9] realized a numerical study with the assumption of perfect adhesion between the reinforcement and the underlying support. This hypothesis permits to take into account only the mechanical properties of the FRP and masonry constituents; the properties of the adhesive interface could be neglected. The constitutive law used to simulate the debonding is characterized by different isotropic damage variables in tension and compression. The mortar joints and the bricks are modeled independently; each material with his internal variables and his activation criteria.
25 fig. 1.ee - Finite element discratization; configuration I (FES double shear test), configuration II (NES double shear test)
The numerical study simulate two different experimental boundary conditions; a FES double shear test (configuration I) and a NES double shear test (configuration II) [5] (fig. 1.ee). The fracture in the configuration (I) occurs close to the unloaded-end and the crack advancement starts in the left mortar joint (figures 1.ff and 1.gg).
fig. 1.ff - Distribution of the damage in tension Dt for the numerical FES double shear test (configuration I)
fig. 1.gg - Displacement-Load curve of the numerical FES double shear test; points A-H indicate the instants selected for the damage evolution of fig. 1.gg
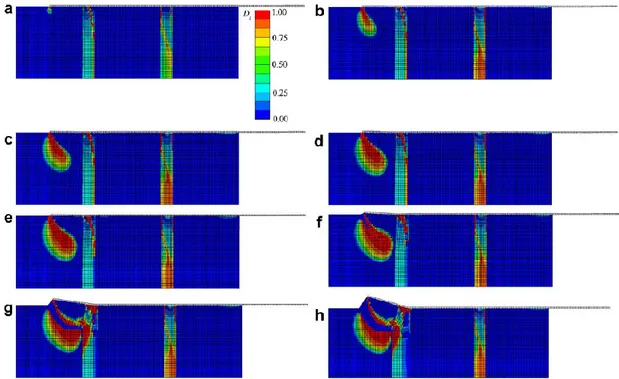
In the configuration (II), the fracture advancement takes place in proximity of the loaded end and the crack advancement passes through all the bricks and mortar joints (figures 1.hh and 1.ii).
26 Comparing the images 1.gg and 1.ii is evident that the peak load for the NES double shear test is five times bigger than that for the FES double shear test; this is due to the different tensile stress distribution in the support. The presence of weak joints in the substrate, like mortar in masonry, could change the crack advancement mode in the debonding fracture.
fig. 1.hh - Distribution of the damage in tension Dt for the numerical NES double shear test (configuration I)
fig. 1.ii - Displacement-Load curve of the numerical NES double shear test; points A-H indicate the instants selected for the damage evolution of fig.1.hh
27
1.3.4 Debonding strength and masonry: a study case
The above literature review shows that the debonding between the composite and the support occurs earlier of the FRP fracture. To have an approximate estimation of the debonding strength of a FRP to masonry bonded joint, a simple study case is proposed below. Given a geometry configuration of simple shear test (values of bfrp, Lfrp), the composite property (tf, Ef, f) and the support
characteristics ( fk, fbk, fmk, fmdm), it has been calculated the value of le and fmdd (whenL>le).The
calculus has been done using the normative design equation proposed by the Italian National Council of Research [1]. The value of le and fmdd have been calculated for eight different typologies
of masonry support, see table 1.IV [4] considering a class of mortar M15. The partial factors ( f,d
and M) have been chosen imaging a certified application of the FRP. The value of c1 has been
selected equal to 0,015 [1]. The results of the simple calculus are summarized in table 1.V. The optimal bond length (le) is inversely proportional to the specific fracture energy of the support ( fk)
(fig. 1.jj). Therefore a masonry with good cohesive properties, needs a optimal bond length shorter than a support of poor quality. In other words, when fk is high the stress transfer zone is reduced.
Instead the design bond strength (fmdd) is proportional to the specific fracture energy fk (fig. 1.V).
As attended, a support characterized by good cohesive quality permit to increase the debonding strength of the reinforced FRP system.
Type Masonry (M15) FRP FRP to masonry bonded joint
fbk [N/mm2] fmk [N/mm2] fmtm [N/mm2] gM GFk Ef [N/mm2] tf [mm] slim [N/mm2] lb [mm] c1 gfd le (mm) fmdd [N/mm2] I 2 1,2 0,12 2 0,01 270000 0,167 2700 450 0,015 1,2 433,45 79,94 II 3 2,2 0,22 2 0,01 270000 0,167 2700 450 0,015 1,2 320,12 108,24 III 5 3,5 0,35 2 0,02 270000 0,167 2700 450 0,015 1,2 253,80 136,53 IV 7,5 5 0,5 2 0,02 270000 0,167 2700 450 0,015 1,2 212,34 163,18 V 10 6,2 0,62 2 0,03 270000 0,167 2700 450 0,015 1,2 190,69 181,71 VI 15 8,2 0,82 2 0,04 270000 0,167 2700 450 0,015 1,2 165,81 208,98 VII 20 9,7 0,97 2 0,05 270000 0,167 2700 450 0,015 1,2 152,45 227,29 VIII 30 12 1,2 2 0,06 270000 0,167 2700 450 0,015 1,2 137,07 252,80
28
1.jj Optimal bond length (CNR) and masonries 1.kk Design bond Strength (CNR) and masonries The design bond strength (fmdd) of the reinforced system with the better support quality (type VIII in
table 1.V) is equal to 252, 8 MPa. This value is much smaller than the tensile resistance of the composite ( f=2700 MPa); only a little part of the high quality of the FRP is used. This thesis has
been developed to increase the efficiency of the FRP reinforced systems.
1.4 Mechanicals anchors
A solution to increase the tension strength and the ductility of FRP reinforced systems as well is the use of “mechanical anchors” to joint support to composite sheet. In the framework of the reinforced concrete structure, some studies have been performed in the last years to define the typologies of anchors and the better configuration of application.
Ha lee and al. [15] executed a experimental study on the strengthening FRP systems fastened with steel nails. They utilized Near End Supported shear tests on concrete blocks, and flexural tests on reinforced concrete beams (fig. 1.ll). The composite applied over the concrete surface was a pultruded FRP strip characterized by hybrid carbon and glass fiber in a vinylester matrix (product named Safstrip). In the NES shear test session the FRP laminate (355 x 25 mm2) has been applied directly on the concrete block (260 x 130 x 130 mm3) without resin, and the adhesion between the support and the composite has been ensured only from one (conf. 1) or two (conf. 2) steel nails. Those lasts have a diameter of 3,5 mm (the same of the hole) and a length of 32 [mm].
0 50 100 150 200 250 300 350 400 450 500 0,00 0,01 0,02 0,03 0,04 0,05 0,06 le [ mm] Fk [N/mm]
le [mm] and masonry supports
0 50 100 150 200 250 300 0,00 0,01 0,02 0,03 0,04 0,05 0,06 fmd d [N /mm 2] Fk [N/mm]
29 1.ll Boundary condition and failure of flexural tests and NES single shear test of Ha Lee et al. [15]
The average pull-off load for the configuration with two nails has been 11,7 kN, approximately twice that for one nail (6,10 kN). During the NES shear tests a bearing damage closeness the anchor occurs (fig. 1.mm). In the flexure beam test, the FRP laminate was fastened with more nails, always without the application of resin. The reinforced beam have an 35% increase of the ultimate moment when compared to the beams not strengthened. During the tests the nails rotated with a limited bearing failure of the FRP (fig. 1.mm b,c). The presence of the anchor acted as a crack initiator (fig.
1.lland 1.nn). When the FRP strip slipped to the concrete, it remained linked to the support; the
fasteners lead to a ductile flexural failure mode.
Other studies on the efficiency of the steel nails applied on FRP laminate exist in literature [16]. When the composite is realized directly in the job site applying special resin over a dry fabric and bonding the FRP on the support, other typologies of mechanical anchors are used. Among those the “U WRAPS” and the “fiber anchors” are the joint systems built by means of the same fibers
1.nn Crack and nails in a flexural test [15] 1.mm Nail and FRP interaction: a) extensive
bearing failure (NES single shear test), b) nail rotation after flexure test, c) limited bearing failure after flexure test [15]
30 typologies of composite sheet (see fig. 1.ll and fig. 1.pp). The first system uses FRP strips applied over the reinforcement in different directions than the principal FRP [17], the second solution is similar to “nails” inserted in the strengthening system to connect mechanically the FRP sheet to the support.
fig. 1.oo- U WRAPS joint system [17] fig. 1.pp - Fiber Anchors joint system [Niemitz]
Orton et al. [18] made 40 experiments to test a reinforced concrete beam in bending with a preexisting crack at midspan. The beams was strengthened with CFRP without and with the addition of anchors joints (U WRAPS or fiber anchors). Orton et al. [18] is defined an indicator to define the efficiency of the CFRP material usage:
(1.14)
Where VLS is the volume of the longitudinal CFRP sheet, VT is the total volume of CFRP, Tcap the
tensile capacity of CFRP sheet, Tmax the maximum measured tension in CFRP sheet and the rate
of the tensile capacity exploited.
In the Orton’s specimens the value of Tcap was environ 130 kN. The beam strengthened by a FRP
bonded joints, without mechanical anchorages, permits to exploit only 37 % of the tensile capacity of the sheet (efficiency = 37%) (fig. 1.qq). When two single layer U-Wraps were applied the increase to 70% (efficiency = 21%). The application of two double layers U-Wraps permit to use 93% of the tensile capacity of the sheet, however the value of efficiency became 16 % due to the large use of CFRP material.
31 Fig. 1.qq - Percentage of the used CFRP sheet tensile capacity (in blue) and efficiency (in violet) of different configuration of reinforce [18]
fig. 1.rr - Intrados of the cracked beam tested by Orton; they are visible the four anchors rows (two in each mid-span) [18]
When the FRP anchors are applied, they take place across the concrete blocks in aligned rows at 13 cm and 54 cm from the centerline of cracked beam. When two anchors of 1,6 cm diameter are applied in each mid-span row the 67 % of Tcap is exploit. The placing of four anchors (1,3 cm
diameter), two in each mid-span row, increase the value of the tensile capacity used to 79% (efficiency = 44%). The better result has obtained applying six anchors of 1 cm diameter, three in each mid-span row, and reaching the CFRP sheet’s full tensile capacity ( . In this case the value of the efficiency was 57%; the highest value registered, more high than the value obtained for the simple FRP to concrete bonded joints without mechanical anchors. It’s simple to note that the
32 fiber anchors are more efficient than the U Wraps and permit to reduce the amount of CFRP material required to obtain a given strength.
fig 1.ss - Dry fiber anchor [20] 1.tt Fiber Anchor applied in a support (360° splay) [18]
The fibers anchors are built rolling a sheet of fiber’s tissue (fig. 1.ss). The inferior part of this one is inserted through the composite strip, in an impregnated hole in the support (fig. 1.uu). The fibers at the top of anchor are spread over the FRP sheet like a fan shape. A layer of epoxy resin must be apply under and over the fan [18][19][20][21]. The studies of Kobayashi [18] about the stress transfer mechanism between the FRP sheet and the fan anchor define a fan opening angles limited to less than 90° to limit stress concentration [18][19][21]. However in the literature, a complete opening fan of 360° is considered [20]. The limit between the hole and the support must be rounded to reduce the stress concentration [22]; the fibers bending in this area has an important influence on the tensile capacity of the anchor.
Fig. 1.uu - Some phases of the fiber anchors application process, I) Covering the support surface with primer after the realization of the anchors holes, II) Insertion of the anchor through the composite strip, III) fanning of the anchor splay [20]
Niemitz [20] studied the efficiency of carbon fiber anchors by means of 12 NES single shear tests on reinforced concrete blocks (dimensions of 101.6 x 86 x 32.2 cm3) strengthened with CFRP sheet (fig. 1.vv). The Niemitz’s anchors were applied dry in the support’s holes filled approximately half
33 way with epoxy resin (fig. 1.ss and 1.uu). Without anchors and for a sheet of 12.7 cm wide and 76.2 cm long, the failure of strengthened system appeared for a tension equal to 46 % of the stress limit of the composite. When there are two anchors (each-one with a diameter of 1.3 cm and 360° fan diameter of 5.1 cm) placed longitudinally, the failure appeared at a tension equal to 68 % of the limit tension of the composite. The failure occurs with the local fracture of the fibers in the proximity of the first nail (load side), and with the debonding of the FRP sheet in the lateral sides of the reinforce (fig. 1.ww). When the two anchors are placed across the width of the sheet the ratio between the failure load of the reinforcement and the failure load of the composite in tension is equal to 71 % (fig. 1.xx). In this case the failure occurs in the same modality of the previous case but with more limited lateral debonding zones.
For all tests the anchor length of 5.1 cm is enough to prevent the anchor pullout. Niemitz found that the overall effectiveness of FRP anchors is related to: the ratio between the anchor diameter and the fan diameter, the anchor spacing and the anchor depth. A larger fan diameter increases the force applied to the anchor; if the amount of fibers is not sufficient a shear failure of anchor is possible, indeed, this typology of failure has occurred in a test with an anchor diameter of 0,64 [cm] (fig. 1.yy). The most efficient disposition of anchors is across the width of the composite sheet. Spacing anchors longitudinally is convenient also to increase ductility of the system. It has been impossible, in the Niemitz’s study [20], to record the peak stress values using a discrete number of strain gauges.
fig. 1.ww - Failure of the specimen with two anchors placed longitudinally [20] fig 1.vv - Specimen test setup of Niemitz [20]
34
Zhang et al. [21] have studied the FRP anchors by means of 27 single shear tests on reinforced concrete blocks (40x20x20 cm3) reinforced by FRP sheet (joint surface of width 5 cm and length 25 cm). They tested two typologies of anchors: dry and impregnated (fig. 1.zz). The second, more efficient, is made with an inferior extremity (dowel) of 2.5 cm pre-impregnated in the phase of rolling fiber tissue. For all the tested specimens the anchor length was equal to 4 cm and the anchor diameter to 1.2 cm.
fig. 1.zz - Dry and impregnated anchors of Zhang et al. [21]
The anchor fan was oriented towards the direction of load (fan open of 60°) with a radius of 5 cm. Zhang et al. [21] schematized in five steps the generic load-slip response of FRP-to-concrete joints anchored tests (fig. 1.aaa). The first step is the linear stroke due to initial debonding of the sheet from the loaded bonded end propagated to the position of the anchor. The second step is another linear stroke (smaller slope than previous step) due to the contribution of the anchor. In the third step, the complete debonding of the plate brings a quick decreasing of the load. The fourth step is characterized by an improvement of the load due to the sliding of the roughened surfaces of the debonded plate and the concrete substrate. It is also due to the contribution of the tensile resistance
fig. 1.yy - Shear failure of the reinforced system with a small anchor diameter [20]
fig. 1.xx - Failure of the specimen with two anchors placed across the width of the sheet [20]
35 of anchor. In the fifth step the load reduced rapidly for anchor rupture failure and gradually for anchor pull-out. The average load peak (at the end of second step) of unanchored FRP-to-concrete control joints is 18 kN. The application of a dry anchor 200 (built rolling a fiber sheet of 200 mm) improves the load peak of 54%. The application of an impregnated fiber anchor 200 improves the load peak of 73%. Different design arrangements of impregnated fiber anchors are been studied in bending tests on FRP-strengthened reinforced concrete slabs [23].
36
Chapter 2
Experimental program
2 Experimental Program ... 37
2.1 Motivation, goals and methodology ... 38 2.2 Experimental Setup... 39 2.2.1 Boundary conditions ... 39 2.2.2 Specimens ... 40 2.2.2.1 Materials ... 40 2.2.2.1.1 The fire brick ... 40 2.2.2.1.2 The epoxy resin primer ... 43 2.2.2.1.3 The epoxy resin adhesive ... 43 2.2.2.1.4 The carbon fabric ... 44 2.2.2.2 The design of the specimen geometry ... 44 2.2.2.3 The anchor details ... 49 2.2.2.4 Specimen construction details ... 51 2.2.3 The universal machine ... 54 2.2.4 The mechanical systems to contrast the brick and to grip the fibers ... 54 2.2.4.1 The steel contrasts ... 55 2.2.4.1.1 The design; hypothesis and FEM studies ... 55 2.2.4.1.2 - The realization process ... 63 2.2.4.1.3 - The stiffness test ... 64 2.2.4.2 The steel “tongs" ... 68 2.2.4.2.2 The realization process ... Errore. Il segnalibro non è definito. 2.2.4.3 The test machine; a global view ... 70 2.2.5 The specimen placement ... 72 2.2.6 The test procedure; instrumentation and load history ... 76
37
2
Experimental Program
Why realize a experimental study on the CFRP to fire brick bonded joints? What are the goals to achieve using the tests? Which are the problems connected with the test realization? How realize the experiments? In this chapter it has been answered to these questions. Herein, after a presentation of the motivations, goals and methodology of the experimental program (par. 2.1), a detailed description of the test setup is presented (par. 2.2).
The logical steps executed to project each particular of the experimental system have been: 1) focus the goals, 2) conception of the experimental device more efficiently, 3) design. This methodological process has been used to project the boundary condition, the specimen geometries, the anchor devices and the steel apparatus.
In the follows pages, defined the boundary condition more appropriate (par. 2.2.1), the geometry of the specimens is presented (par. 2.2.2). All materials used to prepare the sample are characterized and described. In particular the results of the compression tests on the fire bricks executed in Florence are shown. Moreover the properties of the CFRP components are presented in line with the technical sheet BASF. A particular attention is posed on the description of the carbon fiber anchors. All the phases of specimen realization are presented and commented.
Afterwards a description of the mechanical apparatus of the boundary conditions is presented. The Universal machine Deltalab of the ESIPE (Univ. Paris Est Marne La Vallée) laboratory is analyzed in paragraph 2.2.3. The mechanical systems created to lock the brick and to grip the fibers are presented in paragraph 2.2.4. The numerical studies executed to determine the better configuration of contrast are shown in the first part of this section. After that all the devices designed and realized are presented and commented. Moreover an experimental study of the stiffness of the new steel system is reported; in the same paragraph the results obtained have been compared with those of the numerical study. Afterwards the project and the devices of the steel grab system are described and commented. The paragraph 2.2.4 finish with a global geometrical representation of the boundary condition apparatus.
The paragraph 2.2.5 describes all the procedures necessary to prepare the test; the insertion of the reinforced fire brick inside the steel contrast, the gripping process of the fiber fabric, the alignment and the global assembling of the experimental system. The instrumentation applied on the apparatus is presented in paragraph 2.2.6 underlining the experimental data searched. Finally the test procedure is described.
38
2.1 Motivation, goals and methodology
In the field of the concrete structures a lot of studies exist on the use of FRP anchors systems. It has been demonstrate that this mechanical anchor typology increase the strength peak and the ductility of the reinforced elements. Moreover it is more efficient than the U-WRAPS method. Therefore, in the field of masonry, almost no study have been conducted on the FRP anchors. This lack of researches leads to an absence of scientific basis to define the correct design modality and anchor application methodologies; in this context the engineers employ the new joint technologies using only the proper experience or the FRP producer advices.
The experimental study proposed in this work has been designed to analyze the performance of mechanical anchors applied over CFRP straightened fire brick. This typologies of support has been chosen for the following motivations. Among the numerous different masonries, the “solid brick work” (see chapter 1) is the typology present in all the world with almost uniform characteristic, this happens for two reason: the fire brick of different territory have similar mechanical and geometrical characteristic (it is not the case of local stone) and the constructive technique used to build the walls is the same in all the regions (joints of mortar staggered). Moreover the fire brick structures are simple to realize. The use of this “classical” typology of masonry for the realization of the experimental tests could be “indicative” to evaluate the performance of FRP anchors on heterogeneous supports. The research program proposed is composed by three progressive steps:
- Near End Support single shear tests over CFRP straightened fire brick fastened with FRP anchors (brick + CFP sheet + anchor (s)
- Near End Support single shear tests over CFRP straightened pillars fastened with FRP anchors (pillars + CFP sheet + anchor (s)
- Flexural tests over CFRP straightened walls fastened with FRP anchors (wall + CFRP sheet + anchor (s)
The experimental study reported in this work is relative to the first research step. Specifically the goals of the test sessions have been:
a) Quantify the strength enhancement that CFRP anchors can provide to the strength capacity of the reinforcement
b) Study the efficiency of different design configuration varying the anchor fan angle, the anchor fan radius, the number and the placement of anchors
c) Observe the crack advancement and the failure modes of the FRP-to-firebrick system without and with the different anchor’s configuration
39 d) Analyze and quantify the dissipation of energy during the crack advancement in each
different design configuration
e) Obtain the strain field on the reinforced surface in each step of the load history using the Digital Image Correlation
To achieve these goals 72 Near End Supported shear tests divided in 6 typologies of specimens were managed. The design of the tests, the reinforced systems and the FRP anchors has been done after a detailed literature research. The experimental program has been realized in collaboration with the University of Firenze, Department of Construction. The “Fagone, Ranocchiai, Briccoli Bati” research group has believed interesting the proposition to study the FRP anchors and has made available his confirmed experience in the fields of masonry and FRP. The scope of the collaboration is join the French experience in the field of the Digital Image Correlation (DIC) with the Italian knowledge on the behavior of masonry structures reinforced by FRP and submitted to earthquakes. The tests have been made in parallel, in France and in Italy, to compare the results obtained with two different methodologies of strain analysis; the DIC in Paris and the use of traditional strain gauges in Firenze. The specimen preparation have been made in Firenze, after that the fifty percent of the samples was been sent in France. The tests in Paris have been done using the laboratory equipment of the University Paris-Est Marne-La-Vallée.
2.2 Experimental Setup
2.2.1 Boundary conditions
The experimental analyses have been done with series of Near End Supported single shear tests (fig. 2.a). This typology of boundary conditions reproduce a “intermediate crack debonding” [6]. As seen in the first chapter, the NES single shear tests are sample to reproduce and were been used in a lot of numerical and experimental literature studies [1][5][6][7][8][9][10][11][12][15][20][21]. The employ of a configuration test so affirmed has permitted to compare the experimental results obtained in this work with those of literature. Moreover the equation of the debonding parameters defined in literature are been obtained starting from shear hypothesis; the choice of similar boundary conditions make possible a cross-comparison between the normative and the experimental values of le, and fmdd.
The single shear tests (SST) have been preferred to the double shear test (DSS) because the slender thickness of the brick doesn’t permit the application of the anchors in two symmetric surface of the block. Indeed, in the SST, the anchor system is applied only in one side of the fire brick and the support have a behavior more similar to that of the reality.
40 2.a Boundary conditions; NES single shear test, in black the steel lock. Measures are in [cm].
In the figure 2.a the boundary condition chosen for the experimental tests are shown. The shear load is applied in the same side of the contrast; this last is placed at 0,5 [cm] from the brick corner. A steel cylinder is positioned close to the “far loaded end” to prevent a rotation of the brick. The load is applied the not bonded extremity of the composite.
2.2.2 Specimens
In this paragraph the features of the specimens are defined. In the first section properties of the materials used to make the samples are presented (fire bricks, the epoxy primer, the epoxy adhesive and the carbon fabric). Afterward the design motivations, the nomenclature and the geometry property of the specimens are described. Finally the realization procedure is reported.
2.2.2.1 Materials
2.2.2.1.1 Fire brick
The support of the reinforced system is realized with fire brick (12 x 25 x 6,5 cm3) produced by
laterizi S. Marco (terreal Italia group) and belonged to the commercial line “classico” (fig.2.b).
The value of compressive strength of this material was obtained by means of 24 compression tests over cubes of 5x5x5 cm3 executed in Firenze. These cubes have been cut out from 6 different fire bricks (fig. 2.c and 2.d). Since the production procedure give to the blocks different mechanical properties in each orthogonal orientation, the cubes obtained from the bricks have been tested in directions x, y, z.
41
The tests have been made using a compression testing machine characterized by a load cell of
150kN. Each cube to test has been posed on a steel support and loaded by means of a quadrangular compression plate; a steel sphere is interposed between this last and the load piston. Four displacement comparator was applied on the superior surface of the compression plate (fig. 2.e).
Figure 2.f shows the curve displacement-load for the three tests on the fire brick “1” in the
directions x, y, z. The displacement in is the average of the values read by the four comparators. It’s clear that the compression strength of the block are better in the direction of the clay input during the industrial missing in shape procedure.
The results are represented in table 2.IV; the average value of registered compressive strength is included between 18,22 [MPa] (direction z) and 22,18 [MPa] (direction x).
0,0 0,5 1,0 1,5 0,0 2,0x10⁴ 4,0x10⁴ 6,0x10⁴ 8,0x10⁴ Lo ad ( N ) Displacement (mm) C11X C13Z C12Y
fig 2.f Graphes displacement-load for the compression tests over the firebrick 1(Fagone’s datas)
fig. 2.e Compressive test over a cube
fig. 2.d - The 24 cubes tested in compression
fig. 2.c - The subdivision of the firebrick to generate the cubic samples (compressive tests) and the parallelepiped specimen (Young modulus tests). It’s shows also the reference axis.
42 To obtain the Young Modulus six compression tests have been made over 6 parallelepiped specimens (5x5x15 cm3) cut out from the same 6 fire bricks cited previously (fig. 2.c). Four comparators were applied in the center of each lateral surface (5 x 15 cm2) of the specimens (fig.
2.g). Reading the variation of the distance between the “foots” of the , originally equal to 5 cm, it
has been possible to calculate the strain value. The use of comparators permit to obtain the strain field far than the boundary support. Known the strain field and the applied tension for each load step, the Young modulus is simple to obtain. In the stiffness tests the load is applied using the same procedure presented above for the compression test on cubes. In figure 2.h are shown the graphics displacement-load for the Young modulus compression tests. The mean value of the stiffness modulus E obtained is equal to 8814,66 [MPa] (table 2.IV).
fig 2.IV - Compressive strength and Young modulus on a sample of six fire brick “S.Marco”
0 100 200 0 20000 40000 60000 L o a d ( N ) Displacement ( m) (MPa) (MPa) (%) x 22,18 2,00 9,02 y 19,89 1,02 5,13 z 18,22 1,35 7,40 Young modulus y 8814,66 610,06 6,92 Compressive strength
mean value st. dev. coefficient of variation load
direction
fig 2.h - Graphs displacement-load for the Young modulus compression tests
fig. 2.g - Young modulus compression
43
2.2.2.1.2 Epoxy resin primer
The epoxy resin primer used to improve adhesion between CFRP and support is named “MBRACE Primer” and is distributed by BASF [24]. This Primer is a two-part epoxy product and it is applied on the support before the adhesive. “MBRACE Primer” is a ready to use product with high adhesive and bond strength. Moreover it bonds to damp surface. Table 2.V shows the performance data of the product defined by the construction company. In 2.V is possible to read the properties, 7 days after the primer application in an environment with a T=20°C, of the bonding to concrete BTC (UNI EN
1542), the direct tensile strength + (ASTM D638), the tensile modulus of elasticity E+ (ASTM
D638), the flexural tensile strength f (ASTM D790), the compressive strength - (ASTM D695)
and the compressive modulus of elasticity E- (ASTM D695).
BTM [MPa] + [MPa] E+ [MPa] f [MPa] - [MPa] E- [MPa]
MBRACE Primer > 3,5 > 20 1200 > 35 > 40 1900
table 2.V - Performance data of “MBRACE primer”
The MBRACE Primer is supplied in packaging of ten liters (7,5 l of component A and 2,5 l of component B). The mixing ratio is 3 parts of A with 2 parts of B. The construction company recommended the application of only one layer of primer (environ 150 micron).
2.2.2.1.3 Epoxy resin adhesive
The epoxy resin adhesive used in the specimen construction is named “MBrace Adesivo” and it is distributed by BASF [25]. This saturant is applied over the still tacky Primer to bond the fiber fabric. The “MBrace Adhesive” must be applied below and upper the fiber tissue layer to guaranty the distribution of load and the protection of the composite from the environment. The resin adhesive is a two-part epoxy product with 100% solids content. It is a product “ready to use” with high adhesive and bond strength. Moreover, the low viscosity of “MBrace Adhesive” enables the use of a variety of fiber densities (glass, carbon, aramid). Table 2.VI shows the performance data of this epoxy adhesive defined by the construction company. The parameters presented in table 2.VI are the same of that described in the paragraph 2.2.2.1.2 (properties 7 days after the saturant application in an environment with T=20°C).
![fig. 1.u - Schematic representation of the interface when Fe < F < FF (elastic whole zone and elasto-plastic decohesion zone) [8]](https://thumb-eu.123doks.com/thumbv2/123dokorg/4484034.32430/20.892.154.726.269.463/schematic-representation-interface-elastic-elasto-plastic-decohesion-zone.webp)
![fig. 1.y - Failure modes in the Yao et al. experimental session [6]](https://thumb-eu.123doks.com/thumbv2/123dokorg/4484034.32430/22.892.102.802.655.812/fig-failure-modes-yao-et-al-experimental-session.webp)
![fig. 1.z - Strain distribution along the FRP, test I-1 of Yao and al. (L=75 mm) [6]](https://thumb-eu.123doks.com/thumbv2/123dokorg/4484034.32430/23.892.435.808.203.657/fig-strain-distribution-frp-test-i-yao-al.webp)
![fig. 1.dd - Experimental strain values for the CFRP-to-historic brick bonded joint [12]](https://thumb-eu.123doks.com/thumbv2/123dokorg/4484034.32430/25.892.188.669.198.475/experimental-strain-values-cfrp-historic-brick-bonded-joint.webp)
![fig. 1.ww - Failure of the specimen with two anchors placed longitudinally [20] fig 1.vv - Specimen test setup of Niemitz [20]](https://thumb-eu.123doks.com/thumbv2/123dokorg/4484034.32430/34.892.102.776.455.662/failure-specimen-anchors-placed-longitudinally-specimen-setup-niemitz.webp)
![fig. 1.xx - Failure of the specimen with two anchors placed across the width of the sheet [20]](https://thumb-eu.123doks.com/thumbv2/123dokorg/4484034.32430/35.892.113.706.620.843/fig-xx-failure-specimen-anchors-placed-width-sheet.webp)