CATANIA UNIVERSITY OF STUDY
FACULTY OF AGRICULTURE
FACULTY OF MATHEMATICS, PHYSICS AND NATURAL SCIENCES ADORNO ANTONIO
Diversity and flight activity of Staphylinidae
in a citrus orchard of the Catania Plain (Sicily)
Alexander Calder. Vertical Foliage, 1941
INTERNATIONAL PhD IN
”ENTOMOLOGICAL SCIENCE AND PROTECTION OF AGRO-ECOSYSTEMS” XXIV CYCLE
Coordinator: Prof. Carmelo Rapisarda Tutor: Prof. Giorgio Sabella
Cotutor: Prof. Gaetano Siscaro
SUMMARY
A
BSTRACT... 2
1
I
NTRODUCTION... 3
2
S
TUDY AREA... 102.1 Climate framework ... 12
3
M
ATERIAL AND METHODS... 143.1 Window traps ... 14 3.2 Pit-fall traps... 18 3.3 Car-net... 20 3.4 Species identification ... 25 3.5 Data standardization... 25 3.6 Data analysis ... 25
4
R
ESULTS:
F
AUNISTICANALYSIS
... 284.1 General analysis of sampling for species of Staphylinidae (excluding Pselaphinae) ... 28
4.2 Commentary on the most interesting species... 32
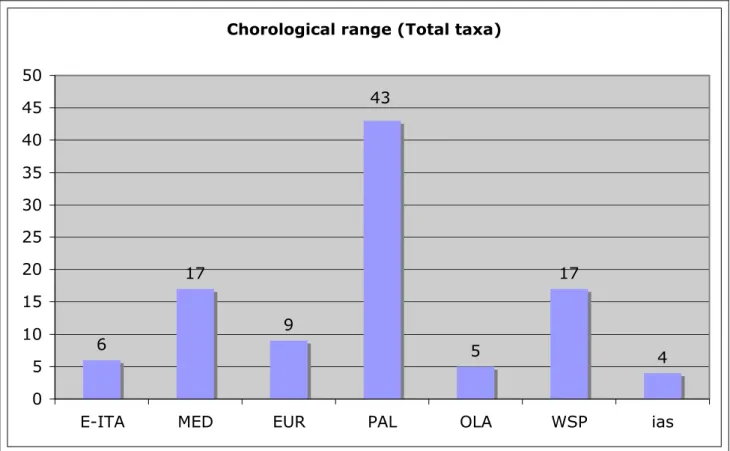
4.3 Biogeographic considerations... 46
4.4 Comparison of sampling with the different capture techniques ... 49
4.5 Comparison of sampling with the car-net in citrus orchard and arable land ... 54
5
R
ESULTS:
W
INDOW TRAPS... 565.1 Sampling analysis ... 58
5.2 Staphylinidae flying activity in different environments ... 63
5.3 Flight monthly activity of Staphylinidae ... 69
6
R
ESULTS:
P
IT-
FALL TRAPS... 716.1 Community analysis... 73
6.2 Comparison between window traps and pit-fall traps... 76
7
R
ESULTS: H
OURLY CAR-
NET... 817.1 Preliminary analysis of temperature and wind speed... 81
7.2 Analysis of flying activity... 92
8
C
ONCLUSIONS... 1419
B
IBLIOGRAPHY... 145A
BSTRACTThe present study aims to investigate the diversity and flight activity of Staphylinidae in a citrus orchard of the Catania Plain (Sicily) using different sampling methods (car-net, window traps and pit-fall traps). The study looks at the complex of flying rove beetles with the aim of defining preliminarily the faunistic and zoogeographical structure of this family in the study area. A second aim of the study is to investigate, using window-traps and pit-fall traps, the spatial distribution of flying staphylinids inside the orchard and in adjacent habitats. The use of window traps and car-net allowed to analyse the monthly and daily flight activity of staphylinids and to analyse the flight circadian rhythm and its seasonal variation. Monitoring of wind and temperature also allowed to evaluate the effects these environmental factors on the flight activity.
170 taxa (species, subspecies and 20 morphospecies) of Coleoptera Staphylinidae were collected. Most of the species are eurytopic species or related to substeppic or steppic environments, usually saprophyles with broad ecological valence. 5 species (Pella leonhardi, Pronomaea sicula, Quedius caelebs, Tasgius globulifer evitendus and Tasgius pedator siculus) are endemics to Sicily, 1 species (Oxypoda flavissima) is new for Italian fauna, 11 species (Acrotona muscorum, Amischa decipiens, Amischa forcipata, Atheta testaceipes, Carpelimus fuliginosus, Dacrila pruinosa, Lithocharis nigriceps, Micropeplus porcatus, Neobisnius lathrobioides, Outachyusa raptoria, Pycnota paradoxa e Trichiusa immigrata) are new for Sicilian fauna. The chorological spectrum is coherent with the environment where the research took place: a large orchard plain characterized by prolonged summer aridity.
The results of the window trap sampling show significant differences in the abundance of the flying species between open areas inside the orchard characterized by herbaceous vegetation (Track) and the inside of the parcels of citrus grove (Citrus). On the other hand the Spearman rank correlation analysis demonstrates that the faunistic structures of this stations are similar.
Comparison between sampling with pit-fall traps and with windows traps one shows that these two sampling methods basically differ by the taxa captures frequencies, in addition to the complete absence of Ocypus o. olens in the window traps.
The occurrence of the maximum frequency of catches in the window traps in the spring (often in contrast with car-net data) suggests that in this period blooming and fruits marcescence processes are an attractive stimulus which causes an increase of flight activity.
Hourly sampling with car-net highlighted, in the most abundant species, that flight has a circadian rhythm characterized by morning and afternoon peaks with a break or a decrease at midday.
The beginning of flight activity coincides with dawn in summer period in Gabronthus maritimus and in Alaeocharinae and Oxytelinae (not examined at species level). Flight activity’s end takes usually place at sunset or twilight. Flight activity after dusk up to an hour after sunset has been detected in the Paederinae Scopaeus debilis, Hypomedon debilicornis, Astenus b. bimaculatus and Astenus pallidulus.
There are also seasonal variations of the distance of morning and afternoon peaks from dawn and sunset: in winter they are far away from dawn and from sunset, in spring the afternoon peak gets closer to sunset, in summer morning peak moves closer to dawn and the afternoon one overlaps sunset, in autumn this two peaks move away from dawn and from sunset again.
From autumn to spring the beginning of flight activity is conditioned by temperature. High temperature seems to cause the extension of the midday break which in summer extends until mid-afternoon. Wind is also an environmental factor which influences flight: in several species wind’s high speeds reduce flight’s activities. However, afternoon peaks also occur in highly windy day. Key-words: Insect flight, circadian rhythm, car-net, window trap, alien species, Coleoptera.
1 I
NTRODUCTIONThe agricultural production systems that have been imposed in recent years compared with their high productivity have led to a significant reduction of biodiversity, both at species and habitats level (BENTON et alii2003;BUREL et alii2004;TSCHARNTKE et alii2005b).
The functional biodiversity of an agro-ecosystem (fig. 1.1) can be schematically subdivided into Planned Biodiversity, which depends on the agricultural practices used in the management of the agro-ecosystem (plant species used, rotation, tillage, etc.) and Associated Biodiversity, which includes all those components of the fauna and flora that colonize the agro-ecosystem from surrounding environments and become part of the agro-ecosystem in relation to its management and its structure (ALTIERI 1999a).
Fig. 1.1 – Diagram of functional biodiversity and relationships of its main components (from ALTIERI 1999a, modified).
Both these components contribute to the functionality of the agro-ecosystem, playing an important role in the regulation of many processes (ALTIERI 1994;ALTIERI 1999a).
At least potentially, some agricultural practices could have a direct influence on functional biodiversity, causing either its increase or its decrease. The use of pesticides, for example, while preserving the crops from harmful species, causes a general decrease in diversity and therefore that of those species which operate as natural predators of dangerous insects, with the consequently increase of these latter (GEIGER et alii 2010).
Theoretically, an biodiversity increase should fosters the stability of ecosystems promoting a sustainable production. The use of “agro-ecological practices”, such as diversification of crops and presence of marginal areas with natural or semi-natural characteristics, helps to reduce ecological simplification resulting in an increase of functional biodiversity that make agro-ecosystems more stable (ALTIERI 1995; ALTIERI 1999b; THIES & TSCHARNTKE 1999; ALTIERI 2004; WEZEL et alii 2009) as an example, to positively react to noxious species attacks, since it’s able to support in their internal structure effective helpful insects in the biological control as well as it’s able to directly inhibit the external attack of noxious species (ALTIERI et alii 2003).
However it was proved that in many cases the increase, or maintain, a high level of biodiversity in agriculture depends not so much on the reduction of conventional farming practices, but rather on other factors, where the mosaic structure of the landscape appears as the most significant one (JONSEN &FAHRIG 1997; HUNTER 2002;HOFFMANN &GREEF 2003; GOODWIN 2003;HENDRICKX et
alii 2007; DIEKÖTTER et alii 2008; GABRIEL et alii 2010; WOLTZ et alii 2012). The population dynamics of the single cultivated field are directly or indirectly influenced by those established at the wide area level (RAND & LOUDA 2006). The agricultural landscape mosaic (farmlands, tree crops, semi-natural and natural areas, etc.) provides suitable conditions to carry out the biological activities (reproduction, feeding, etc.) of many useful species for agriculture. On the contrary, these conditions do not occur in a landscape characterized by extensive monoculture.
In this context, the Associated Biodiversity represents a significant component of agro-ecosystems not only in terms of biodiversity, but also for the potential regulating capacity that it can play. For example, an increase of generalist predator species is considered useful because, directly or indirectly, they can potentially control the populations of phyto-saprophagous species harmful to agriculture.
A large part of the Associated Biodiversity of agro-ecosystems comes from outside and so it is important to define the modalities through which animals colonize them (NICHOLLS et alii 2001; JUEN & TRAUGOTT 2004; ROMERO et alii 2008; GRUEBLER et alii 2008; BUCHER et alii 2010; FOLEY & HOLLAND 2010). Many studies show that the ecological corridors or the ecotonal bands between cultivated areas and natural environments, promote the insects spillover (NICHOLLS et alii 2001;TSCHARNTKE et alii 2005a).
DUELLI & OBRIST (2003) identify five patterns of distribution of insects between agricultural and non-agricultural areas (especially stenotopic, ecotonal, “disperser” ubiquitous and agricultural species) (fig. 1.2).
Fig. 1.2 - Distribution patterns of insects among agricultural and non-agricultural environments
(from TSCHARNTKE et alii 2005a).
The ecotonal species or “disperser” colonize agricultural fields from the natural environments or habitats surrounding, but always maintain their peak abundance in the marginal areas of the field and not in the central areas, as is the case for agricultural species. The ubiquitous species, however, do not show a particular preference between the two types of environments (TSCHARNTKE et alii 2005a).
The study of these flows of species among the different components of the landscape mosaic is particularly important to understand the spatio-temporal dynamics which regulate biodiversity and
In this context, special attention should be given to flying species representing the contingent of species most involved in these dynamic exchanges between the various components of the environmental mosaic, contributing to determine a considerable part of agro-ecosystems biodiversity (GRUEBLER et alii 2008). For example, the value of ground based predators for aphid control has been questioned because selective exclusion studies indicate that the contribution they make is relatively small compared to that of aerial predators and parasitoids (SCHMIDT et alii 2003; HOLLAND et alii 2006) suggesting that levels of biocontrol may be better improved by encouraging the flying species, such as Syrphidae, Coccinellidae and Parasitica (HOLLAND et alii 2008).
Insects flying activity, in natural and agricultural landscape, has been extensively investigated at the level of systematic groups or species(AUKEMA et alii 2004; TOEWS et alii 2006;GRUEBLER et alii 2008; BARSULO & NAKAMURA 2011). Some studies have analysed the flying activities of dispersion, within or among different cultivations, of species of agro-economic interest (SHIMODA & TAKABAYASHI 2001), or between natural or semi-natural environments and cultivated areas (RAND &LOUDA 2006; SZINICZ et alii 2005).
In recent years, many studies on airborne insects, carried out with radar observations, showed an enormous aerial “bioflow” (CHAPMAN et alii 2003; GEERTS & MIAO 2005; RILEY et alii 2007; WOOD & O’CONNOR 2009) which can have important implications for ecological, physiological, and genetic studies of insects, with applications in pest management, conservation, and in environmental change programs (WOIWOD &HARRINGTON 1994; DRAKE &GATEHOUSE 1995). Flight, as many others biological processes, is characterized by circadian and photoperiodic rhythm (DANKS 2003). Circadian rhythms are endogenous, ~24-h oscillations governing various behavioural and physiological functions. The rhythm synchronizes to and is profoundly affected by light cycles. Light is the most important driver of circadian behaviour. Variations of temperature influences the movement, but entrainment to a temperature cycle does not cause after-effects; light may be unique in its ability to induce after-effects. (TOMIOKA &SAKAMOTO 2006).
The photoperiodic time measurement system (photoperiodic clock) recognizes seasonal change of day-length or night-length (PAVELKA et alii 2003), as signals for seasonally cycling deterioration of conditions for life/development, allowing organisms to prepare in advance. Physiological mechanisms of the photoperiodic time measurement system remain obscure. Part of the scientific community accepts that certain elements with circadian oscillatory nature may be functionally involved in photoperiodic clocks. This hypothesis, formulated originally by BŰNNING (1936) for plants, has later received support from other organisms including insects (SAUNDERS 2002).
The flight responds to different ecological requirements leading at different types of movement behaviour.
Migration is a behavioural process which, according to Kennedy’s definition (1985), has the following characteristics:
- Migratory movement may be accomplished by the animal’s own loco-motory exertions, or it may involve a transporting ‘vehicle’ such as wind, water, or phoresis on another organism, but in each case the migration is actively initiated and maintained through specialized behaviour patterns. - Migratory flight is often persistent.
- Responsiveness to stimuli which promote ‘station-keeping’ flight and settling are inhibited or depressed.
- Migration is usually activated by cues such as photoperiod that act as surrogates for habitat change, rather than directly by a change in the current state of resources.
‘Vegetative’ or resource-finding movements are directed towards the exploitation of resources, particularly those required for growth and reproduction (food, shelter, mates, oviposition sites, etc.), and these movements are readily interrupted by an encounter with the resource items (KENNEDY 1985; DINGLE 1996; HARDIE et alii 2001).
The term “dispersal” is often used if it is not possible to know the behavioural state of an individual insect during a particular movement. The ecological consequences of this movement is a
All these type of movements are relevant in the structuring of the networks of local populations that constitute the metapopulations (HANSKI &GILPIN 1997; HANSKI 1999): each local population may be small, and prone to extinction, but the entire metapopulation survives because re-colonisations of empty habitat patches are sufficient to balance the extinctions that do take place. Without movement, these systems would become extinct, as the local populations die out, one by one. With movement, the metapopulation may survive indefinitely.
All phases in the dispersal process are influenced by ecological and environmental factors; among them predation is perhaps the most relevant (WEISSER 2001). Predation is shown to be an evolutionary force that may: (i) select for dispersal, (ii) select against dispersal and (iii) select for conditional dispersal strategies, i.e. dispersal conditional on predator attack or an increase in the risk of predation. In the predator-prey system, many insect groups are interested on both sides.
Dispersal also strongly influences the areas over which we may need to apply management either to increase (conservation) or decrease (pest control) a species of interest (THOMAS 2001). Movements of individuals link together the various locations where breeding is achieved or attempted. The amount of movement affects how we describe these habitat networks, the dynamics we might expect, and the extent to which local adaptations may evolve. It also affects the scale at which practical management may need to be applied.
Staphylinidae are one of the most important group of epigeic invertebrates in agricultural landscapes in terms of activity and abundance (ORBTEL 1968). They represent about 19% of all beetles in terms of number of individuals. The number of Staphylinidae species is often higher than that of carabids (BOHÁČ &POSPÍŠIL 1984), and in some biotopes staphylinid abundance can be 15 times greater than that of carabid specimens (LUBKE-AL HUSSEIN &WETZEL 1993).
The family Staphylinidae (rove beetles) is one of the largest families of beetles, worldwide distributed, with about 58,240 known species (HERMAN 2001) (including Pselaphinae and Scaphidiinae to which should be added also Scydmaenidae which have recently been included in this family). Staphylinidae show a very high ecological diversification and are practically distributed in all natural, semi-natural and man-made habitats (BOHÁČ 1999).
There are practical difficulties associated with Staphylinidae taxonomy especially in the subfamily of Aleocharinae due to their morphological uniformity (see for example the iconographic catalogue of TRONQUET 2006), to the diagnostic characters difficult to detect (e. g. dichotomic keys of the tribes and genera are based on tarsal formula and on the morphology of the mouth’s parts) (BENICK &LOHSE 1974) and especially for the high number of species 16,115 (HERMANN 2001). An organic revision of European species of this subfamily is lacking.
In Italy are present more than 2,200 species (except Pselaphinae, Scaphidiinae and Scydmaenidae), whose more than 650 are present in Sicily (CICERONI et alii1995).
As regards the morphology of adult, staphylinids are a highly diverse group, for size (frequently the body length of adult ranges from 1 to 35 mm), colour pattern (brownish or yellowish to dark, other colour like red or blue are rare) and body shape (elongated and subparallel as in many species of Paederinae, flattened and short as in many Omaliinae, shortened with very long elytra as in Micropeplinae and Proteininae, carrot shaped as in most Tachyporinae, etc.).
The short elytra has allowed abdominal flexibility while maintaining the ability to fly and to protect the delicate wings. In some species wings have been secondarily lost or reduced. Wing reduction and wing dimorphism in both sexes in insect species are common phenomena. Sexual dimorphism in wing development is less common. Both are recorded in the Staphylinidae family (ZANETTI 2006;SOLODOVNIKOV 2012). Wing dimorphism in many species of insects display dispersing and nondispersing strategy. In aphid, for example, the dispersing morphs typically possess a full set of wings as well as a sensory and reproductive physiology that is adapted to flight and reproducing in a new location. In contrast, the nondispersing morphs are wingless and show adaptations to maximize fecundity (BRAENDLE et alii2006).
larvae, etc. (NEWTON 1990; BOHÁČ 1999), but there are many exceptions of mycetophagy e. g. Oxyporinae and the genus Gyropahena (Aleocharinae), and saprophagy, e. g. most of Oxytelinae feed on various organic substances. Phytophagy is less common, but for example the species of the Omaliinae genus Eusphalerum are pollen feeders (ZANETTI 1987). Some species are omnivorous and combine either mycetophagy or saprophagy with carnivory (GOOD & GILLER 1991) either during the same life stage or in different life stages (THAYER 2005). Relatively poor is the literature on the larval diet, with studies that mainly concern the species of agro-economic interest. Some members of the genus Aleochara are known to be parasitoids of fly puparia (MAUS et alii1998). Some authors report high levels of cannibalism in staphylinid larvae but this is not supported by field observations (GOOD &GILLER 1991).
In agricultural management staphylinids are recognized important as predators of some pests e. g. aphids, caterpillars, wire worms and other invertebrates. In Europe are widely identified as important to cereal aphid control. Tachyporus hypnorum, in both the larval and adult, Tachyporus obtusus, Tachyporus chrysomelinus (DENNIS et alii 1990), and Philonthus cognatus (DENNIS & SOTHERTON 1994). Atheta coriaria appears to be an effective biological control agent for certain greenhouse pests such as fungus gnats Bradysia spp. (Diptera, Sciaridae) (CARNEY et alii 2002). Adults of these species are very mobile and are capable of flying long distances; however, they tend to spend most of their life-span in growing media (HELYER et alii 2003). Both the larva and adult may feed on various life-stages of a widerange of arthropod pests, including fungus gnats, shore flies, and thrips (HELYER et alii 2003; BIRKEN & CLOYD 2007).
In Staphylinidae, the predominance of trophic habits of generalist predator type should provide biological control services at least equal to those of specialist predators. Generalist predation pressure can be more stable in an agro-ecosystem as generalist predator can subsist on non-target prey even if the target is unavailable (DENNIS & WRATTEN 1991) or may be present before the arrival of pest species or can arrive before that pests attain large population sizes so as, to prevent pest establishment or retard pest population growth (CHANG & KAREIVA 1999). The dynamics of interactions between generalist predators and their many pest and non pest prey is debated by SYMONDSON et alii (2002), which also report a review of manipulative field studies that shows, in approximately 75% of cases, that the generalist predators, whether single species or species assemblages, reduced pest numbers significantly.
Agricultural measures (tillage, manure, chemical NPK and pesticides) have a lower and more short-term influence on Staphylinidae communities compared with other factors such as relief of agricultural landscape, surrounding biotopes, soil humidity and crop change (BOHÁČ 1991).
The different responses of Staphylinidae community to the different agricultural practices are to be related both to their particular micro-environmental needs (Staphylinidae are highly dependent from humidity, temperature etc.) and to their high dispersion capability (BOHÁČ 1991).
Staphylinidae are largely used in ecological studies of agro-ecosystems (KROOSS & SCHAEFER 1998; BALOG et alii 2003; MONZÓ et alii 2005; BALOG &MARKÓ 2006; LUPI et alii 2006; CLOUGH
et alii 2007;BALOG &MARKÓ 2007; BALOG et alii 2008a;BALOG et alii 2008b; MIÑARRO et alii 2009; HONĚK et alii 2012).
Many staphylinids possess great dispersal possibilities (CROWSON 1981); this ability differs among various species and groups.
DENNIS &SOTHERTON (1994) have studied the ability of some Staphylinidae to climb cereal plants up to positions where aphid species feed. They observed that Philontus cognatus (that is a diurnal hunter on the ground) climb the wheat plants only prior to dispersal flights, while some Tachyporous spp., that usually climb lower leaves, climb to higher positions on plants if the purpose is the launch for dispersal flights.
Many species are good flyers (e.g. species of the genera Oxytelus, Philonthus, Amischa, Atheta etc.) (BOHÁČ 1999). For example, Oligota kashmirica benefica Naomi 1984 (about 1 millimetre long and specialized predator of mites) can cover by a single flight a distance up to 16 meters (SHIMODA et
occur presumably by flight. These displacements take place both within individual crops and in adjacent areas to search their prey, as in the above mentioned Oligota kashmirica benefica (SHIMODA et alii 1997).
Many small species are carried by the wind for long distances (e.g. species of the genera Oxytelus, Amischa, Atheta) and some species can be transported by man and have been distributed in this way all over the world (e.g. Lithocharis nigriceps). In recent years the expansion of some species has occurred mainly from southeast Asia (e.g., Oxytelus migrator, Philonthus spinipes) (BOHÁČ 1999). In agro-ecosystems the activity patterns of staphylinids species are highly variable. As regard the seasonal activity pattern of ground dwelling staphylinids, in Oklahoma winter wheat fields ELLIOT
et alii (2006) found that most rove beetle species showed no association with a particular season, however some species were dominant in fall or in winter. In citrus groves in Valencia (Spain) MONZÓ et alii (2006) report that rove beetles were active throughout the year, fluctuating without a clear pattern. In Sicily in a study carried out in different agricultural environments (PETRALIA 2011) was observed that the 68,18% of catches is concentrated in the months from October to January and the minimum in August, while as regard the number of species, the highest is recorded in April and May. The seasonal flight activity of Tachyporus hypnorum, Oxytelus rugosus (that show a peak in May/June) and Oxytelus inustus (that show peaks in May/June and in autumn), are reported in MARKGRAF &BASEDOW (2002), but there was no correlation in the catches comparison between the flying activity (detected by the windows traps) and the population density (detected with pit-fall traps).
Staphylinid beetles are active mainly during the day (TIKHOMIROVA 1973; SPICAROVA 1982). CHATZIMANOLIS et alii (2004) have studied the diurnal/nocturnal activity of rove beetles, sampled with flight intercept traps, in a tropical rainforests. Their results show that the 76.8% were caught during the day. The study of DENNISON &HODKINSON (1983) on the Staphylinidae flying activity patterns in a European forest, shows that most of dominant species were diurnal, but all of them showed some crepuscular activity. TAKAHASHI &MATSUMURA (1993)sampled flying Staphylinidae with a car-net, during one year. The seasonal peaks were in June and in October-November while the daily peak were one hour before sunset (with accounted for the 87.7% of the total sampled specimens).
The present study aims to investigate the diversity and flying activity of Staphylinidae in a citrus orchard of the Catania Plain (Sicily) and in its surroundings, using different sampling methods (car-net, window traps and pit-fall traps). This approach based on the study of whole of Staphilinidae flying species and on different collecting methods permits detailed analysis of the spatio-temporal dynamics of this group of beetles. It provides, in fact, a relatively comprehensive framework of the variations at the level of the single species and especially of the structure of the entire population in response to the variation of different ecological conditions (habitats, seasons, time segment, etc.). The study looks at the complex of flying species of rove beetles with the aim of defining preliminarily the structure and the faunistic and zoogeographical aspects of the populating of the study area. A second aim of the study is to investigate, using window-traps and pit-fall traps, the spatial distribution of flying Staphylinidae inside the orchard and in adjacent habitats and their characterization by qualitative and quantitative point of view. The use of window traps and monthly car-net allows to analyse the monthly flight activity of staphylinids with particular regards to the most abundant species, while the daily car-net lets to investigate their circadian flight activity with the identification of the different patterns of daily-time flying activity; it is also possible the analysis of the relation of flying activity of staphylinids with some variables like temperature, wind speed and time of the day.
The study purpose is to provide as well some basic indication on Coleoptera Staphylinidae such as the evaluation of the efficiency of trapping methods, and the identification of the most abundant
patterns in the daily flying activity, examining their variation based on the interaction between circadian rhythm, temperature, wind speed and seasons.
All this information will be very useful for the study of flight of individual species, and for the setting of further research related to the more general question concerning the way in which fliers species colonize the agro-ecosystem, their contribution to the Associated Biodiversity and their role in biological control of harmful species.
2
S
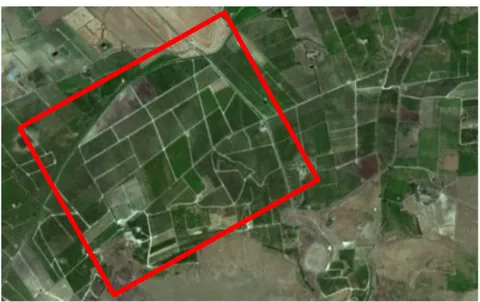
TUDY AREAThe research was conducted within the Xirumi citrus company that covers about 200 hectares and is located in contrada Serravalle in the municipality of Lentini (SR) (figs 2.1-2.2).
Biviere di Lentini Biviere di Lentini
Fig. 2.1- Location of the study area highlighted by the red dot (from Google Earth mod.).
Fig. 2.2- Detail of the study area included inside the red rectangle (from Google Earth mod.).
In the farm area are planted and cultivated different species and varieties of citrus (orange, clementine, tangerine), but the orange grove takes the greatest extent.
The company is located in an highly citrus-vocation area (fig. 2.3), dotted with numerous water reservoirs and irrigation canals, in which there are a few strips of natural vegetation: shrub and garrigues, ampelodesmos and steppe-like grasslands, mediterranean arid meadows, rupicolous environments.
It is divided into several parcels, with level course of 80 meters on average above sea level.
The native soil tends to be of medium texture, with a good amount of organic matter enriched through regular fertilization with manure and reintegration of organic residues by mechanical processing. Irrigation is performed by sprinkling under foliage and water supply from wells located within the same Farm area.
Orange cultivars in situ are, in order of size: Tarocco, Valencia late, Navelina, Moro e Ovale.The mean age of the plants varies between 10 and 25 years and the spatial area is 6x4 meters. Pruning is done in rotation among the various fields on a regular basis, weeding is done by mechanical crusher and fertilization is performed with organic and minerals compounds according to a specific program based on analytical results (on leaves and ground) which the company periodically submit fields. 2.1 Climate framework
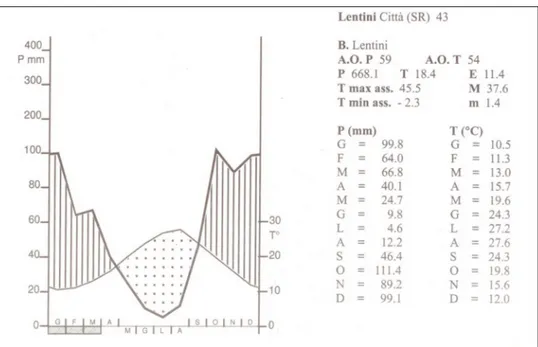
Looking at the thermopluviometric diagram of Lentini (fig. 2.1.1) it shows that the annual mean temperature is approximately 18°C, with a dry period that extends from April to September.
As for precipitation, it shows that they are 600/700 mm with a monthly distribution typically Mediterranean, and a concentration of rainfall in autumn and winter and a drastic reduction of that in the period spring-summer.
Fig. 2.1.1 – Climate diagram of Lentini thermopluviometric stations (from ZAMPINO et alii 1997). To the right are
reported elevation characteristics of the station, numbers of years of observation (A.O.), the mean annual and monthly temperature and rainfalls.
Based on available data, the study area falls in the bioclimatic range of superior themo-mediterranean thermotype and sub humid ombrotype (fig. 2.1.2).
For each type or bioclimatic range corresponds to a different kind of natural climaceous vegetation or “climax”.
It represents the most advanced natural vegetation for each bioclimatic belt. In the study area, although the deep anthropic changes have resulted in the reduction or disappearance of much of the original natural vegetation, it can be assumed that the original climax vegetation is Quercus suber wood, attributable to Stipo bromoidis-Quercetum suberis.
Fig. 2.1.2 - Bioclimatic types of South-East Sicily (from SCELSI &SPAMPINATO 1998). With black dot (●) is indicated the location of the study area.
3
M
ATERIAL AND METHODSIn this study we used three different methods of sampling. The windows traps, the pit-fall traps and the car-net.
3.1 Window traps
It is a typical windows aerial traps in panels of Plexiglas (fig. 3.1.1) with size of 33x53. Each trap was hung to a structure in wood laths. The active portion of the trap is about 1.6 meters from the ground. As trap fluid has been used a coolant for car radiator mainly composed of propylene glycol (to prevent complete evaporation), to which were addedsome water, propylene phenoxytol (an anti-bacterial agent) and liquid dish detergent (to reduce surface tension).
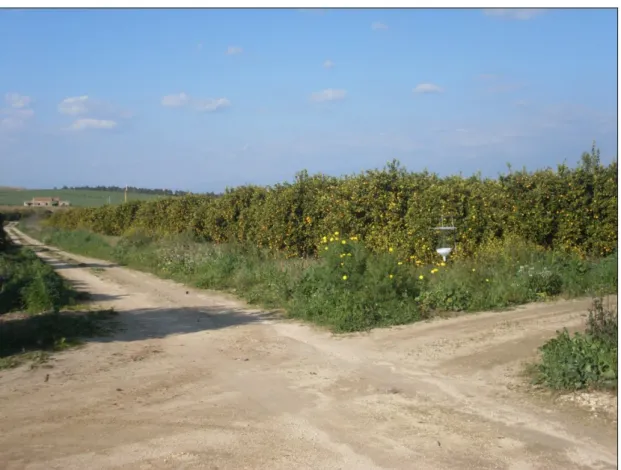
Fig. 3.1.1 – Active window trap in the sampling field (Photo A. Adorno).
The windows traps were used to highlight any differences of Staphylinidae flying activity in different environments inside the research area. (fig. 3.1.2). For this purpose, the traps were placed in four stations.
SCHRUB: two traps (1 and 2) placed in the boundary between the orchard and a shrub area (fig. 3.1.3).
CANE: two traps (3 and 4) placed in the boundary between the orchard and an irrigational canal with a monophytic community of Phragmites australis (fig. 3.1.4).
CITRUS: four traps (5, 6, 7 and 11) placed inside an parcel of the citrus grove, between the trees closely to the foliage (fig. 3.1.5).
TRACK: four traps (8, 9, 10 and 12) placed in open areas inside the orchard, at the crossroads of service roads inside the researching area, characterized by herbaceous vegetation (fig. 3.1.6).
2 1 3 4 5- 6-7-1 1 8 12 9 10 2 1 3 4 5- 6-7-1 1 8 12 9 10
Fig. 3.1.2 – Window traps position within the sampling area, further explanation in the text (form Google Earth, mod.).
Fig. 3.1.3 – SCHRUB. Ecotonal strip between the orchard
and a shrub area (Photo A. Adorno) Fig. 3.1.4 – CANE. Ecotonal strip between the orchard and irrigational canal with a monophytic community of
Fig. 3.1.5 – CITRUS. Trap placed inside a parcel of the citrus grove (Photo A. Adorno).
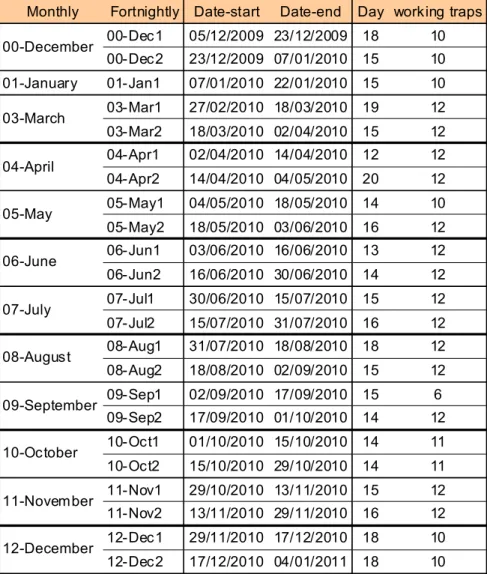
Sampling was carried out over 13 months (from December 2009 to December 2010). During the sampling period, the traps content was collected on average fortnightly, with exception of the month of January.
In February all the traps have not worked properly since on the area occurred violent storms that have broken down several traps and made unusable the material collected from the remaining ones. During the year of sampling, although sporadically, there has been the loss of some samples probably destroyed by the workers during the picking of oranges and/or maintenance of the orchard. In the table tab. 3.1.1 are shown dates and active traps for each sampling period.
Monthly Fortnightly Date-start Date-end Day working traps 00-Dec1 05/12/2009 23/12/2009 18 10 00-Dec2 23/12/2009 07/01/2010 15 10 01-January 01-Jan1 07/01/2010 22/01/2010 15 10 03-Mar1 27/02/2010 18/03/2010 19 12 03-Mar2 18/03/2010 02/04/2010 15 12 04-Apr1 02/04/2010 14/04/2010 12 12 04-Apr2 14/04/2010 04/05/2010 20 12 05-May1 04/05/2010 18/05/2010 14 10 05-May2 18/05/2010 03/06/2010 16 12 06-Jun1 03/06/2010 16/06/2010 13 12 06-Jun2 16/06/2010 30/06/2010 14 12 07-Jul1 30/06/2010 15/07/2010 15 12 07-Jul2 15/07/2010 31/07/2010 16 12 08-Aug1 31/07/2010 18/08/2010 18 12 08-Aug2 18/08/2010 02/09/2010 15 12 09-Sep1 02/09/2010 17/09/2010 15 6 09-Sep2 17/09/2010 01/10/2010 14 12 10-Oct1 01/10/2010 15/10/2010 14 11 10-Oct2 15/10/2010 29/10/2010 14 11 11-Nov1 29/10/2010 13/11/2010 15 12 11-Nov2 13/11/2010 29/11/2010 16 12 12-Dec1 29/11/2010 17/12/2010 18 10 12-Dec2 17/12/2010 04/01/2011 18 10 10-October 11-November 12-December 06-June 07-July 08-August 09-September 00-December 03-March 04-April 05-May
3.2 Pit-fall traps
In order to investigate whether relationships exist between the biotic communities sampled in aerial ambient and the soil one were placed within the site a certain number of pit-fall traps.
Pit-fall traps, consisting of plastic cups with 8.5 cm superior diameter and 11 cm profundity, filled for two-thirds of a saturated aqueous solution of sodium chloride and vinegar, worked into the ground (fig. 3.2.1); the distance between each other was at least 10 meters.
Fig. 3.2.1 – Active pit-fall trap in the field (Photo E. Allegra).
It was carried out a sampling plan limited to spring and autumn, as both data in the literature both from previous research carried out in eastern Sicily showed that Staphylinidae are most active in these two periods. Concentrating the capture effort during these periods one can get significant results.
The sampling design would have foreseen the use of 18 pit-fall traps placed inside the orchard and in adjacent areas (Scrubs and Cane). Unfortunately the sample has undergone several changes due to the destruction of the traps set within a parcel of the orchard in the month of June, as well within the reeds in the month of November and December because of the soil tillage. For this reason they are considered only 14 traps placed in the habitat Citrus, Track and Shrub (fig. 3.2.2) in the months of May, November and December and totally excluding the sampling of June (tab. 3.2.1).
CITRUS: four traps (9, 10, 11 and 12) have been placed in to the central area of a citrus grove parcel adjacent to that ones were are located the windows traps to avoid interference between the two types of traps.
TRACK1: tree traps (13,14, and 15) have been placed in north-west side of the same parcel where have been placed the citrus one .
TRACK2: tree traps (16, 17, and 18) have been placed in south-east side of the same parcel where have been placed the citrus one.
SHRUB: four traps (1, 2, 3 and 4) have been placed in mediterranean shrub area bordering with the orchard.
Fig. 3.2.2 – Distribution of pit-fall traps within the investigation site. White dots: traps placed in the citrus grove; yellow dots: traps placed in the mediterranean shrub (from Google Earth, mod.).
Date-start Date-end Days Track1 Citrus Track2 Shrub Cane 04/05/2010 03/06/2010 30 3 4 3 4 15/10/2010 13/11/2010 29 3 4 3 4 13/11/2010 17/12/2010 34 3 4 3 4 04/05/2010 03/06/2010 30 4 03/06/2010 30/06/2010 27 4 4 Citrus grove st an d ar d add ic tio na l
Tab. 3.2.1 – Summary table of the entire sampling with pit-fall traps on the number of traps found in each period at each station and the number of days of exposure of the traps. With “standard” are indicated those traps used for the biocenotic analysis; with “addictional” are indicated the other traps used only for faunistic comparisons.
3.3 Car-net
In order to analyze the daily and hourly activities of Staphylinidae flight along the year was used the technique of car-net.
It is a particular technique to collect aerial fauna present in the air layers near the ground. The technique has been used since the fifties for the sampling of Diptera (STAGE et alii 1952) adapting a cono of the roary-trap to a car. The widespread use of this collection technique by coleopterologits probably is due to the description of the method of Loshe (FREUDE et alii 1965; TÓTHOVÁ et alii 2005). Currently, however, there are different versions of this collection device which differ in shape, structure and size (see for example the images reported by TÓTHOVÁ et alii 2005) or for positioning the net in other parts of the vehicle such example in the front just above the ground (PECK & COOK 1992).
The interception device used in the present study is based on the model used by Zanetti (MASON et
alii 2002) (fig. 3.3.1). It is composed of a pyramid-shape net with the base mounted on a rectangular structure (110 cm x 64 cm) of aluminum fixed with clamps on the roof rack bars of a car. The terminal part of the network, where are concentrated the specimens collected, is constituted by a bag easily removable, so as to not having to remove the entire structure to collect the specimens sampled. The net is made tense by a rope that connects the terminal portion of the collector bag with the car. Considering the height of the car, in general the device is placed between 1.5 and 3 meters from the ground: in our case 2 meters
Fig. 3.3.1 – Car-net utilized during the present study (Photo A. Adorno).
The capture technique of the car-net allows to collect in a short time a large quantity of specimens and flying species, some of which are difficult to be sampled with other techniques. Many species considered as rare are, in fact, intercepted preferentially with this technique.
Among Coleoptera, Staphylinidae are one of the families most abundant sampled with this technique (TAKAHASHI & MATSUMURA 1993).
A limitation of this technique is to not be applicable in all meteorological conditions, such as during rain or high-speed wind.
TRACK Sampling way
TRACK Sampling way
Sampling way
Fig. 3.3.2 – Standard transect effectuated with the car-net (from Google Heart mod. and Photo A. Adorno) Sampling was carried out in the manner described below.
DAILY SAMPLING
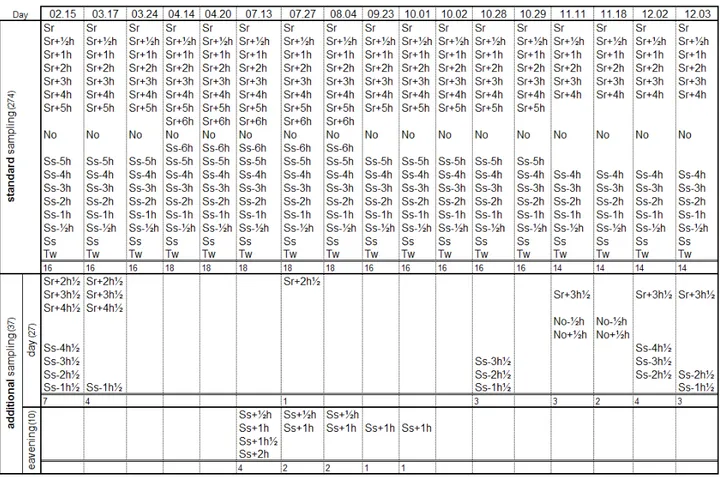
Standard sampling. Were carried out during the daylight hours from sunrise (Sr) to twilight (Tw). The whole day was divided into two groups one antemeridian, from sunrise (Sr) to noon (No) and one postmeridian, from noon (No) to sunset (Ss). From dawn to noon the following hour-segments have been identified: the first at sunrise, the next ½ hour after sunrise, the subsequent ones at intervals of 60 minutes with the last interval that falls at 4h, 5h or at 6h after sunrise, depending on the duration of the day. Using the same criteria, starting from sunset were identified postmeridian segments. Within this time-phase was also conducted a sampling at dusk occurring, depending on the season, approximately 20 minutes after sunset (tab. 3.3.1).
Additional sampling day. On some days were conducted additional sampling at intervals of 30 minutes (tab. 3.3.1).
Additional sampling evening. During the summer were also made samples from ½ hour to 2 hours after sunset (tab. 3.3.1).
Tab. 3.3.1 – Summary table of the daily sampling protocol effectuated with the car-net.
Days of sampling. During the years 2010 and 2011 were carried out 23 sampling days. Six of these were excluded from the analysis as performed in extremely windy days with negligible number of catches, or for problems of malfunctioning of the control unit for the detection of meteorological parameters, or for the inability to carry out the entire set of daily hour-sampling. Also in the month of January, due to the adverse weather conditions, have not been made samples. In the present study were taken, therefore, in consideration only 17 sampling days falling in 9 months, between the years 2010 and 2011 (tab. 3.3.2).
Environmental parameters measured. During the day of sampling have been detected, by means of a thermo-pluviometric (Watch Dog 700, Spectrum Thecnologies inc.) control unit placed inside the sampling site, with an interval of 60 seconds, the following parameters: air temperature, relative humidity, speed, draft and wind direction. For analysis and statistical processing (unless otherwise stated) were used the mean values corresponding to the five-minute sampling of standard segments and additional daytime and evening.
MONTHLY SAMPLING
The same car-net technique was used, using the same path as described above, to make a single monthly sampling over the period in which the window traps were active. A total of 11 samples were collected from December 2009 to November 2010 (tab. 3.3.3). Of these, three (highlighted in yellow in the table) correspond to the standard hour-sampling. Sampling were carried out in the late afternoon hours (sunset or near sunset) in spring and summer, and in the early afternoon hours in autumn and winter. All sampling were carried out under conditions of no wind.
Tab. 3.3.3 - Days of monthly sampling carried out with the car-net.
OTHER SAMPLES
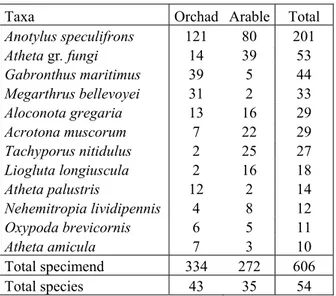
To test if the cenosis of Staphylinidae of the citrus is linked to this habitat samples were taken in a arable land bordering the citrus orchard (fig. 3.3.3). The pairs of samples were carried out between December and January in the same day and a few minutes away from each other (tab. 3.3.4).
Date Orchard citrus Arable land
23/12/2009 15.54 16.18
14.42 15.17 05/01/2010
15.55 16.14
3.4 Species identification
Staphylinidae collected with window traps, pit-fall traps and car-net were sorted previously by subfamilies and then, excluding Pselaphinae, at species level and sometimes at morphospecies level, with the exception of those collected with the daily car-net for which were excluded from the determination at the specific level Oxytelinae in relation to the large number of specimens sampled (13.461) and Aleocharinae both for the high number of counted specimens (7.809) and especially for the considerable uncertainties taxonomic and systematic that this subfamily presents in Mediterranean area.
3.5 Data standardization
It appeared appropriate and necessary to standardize the results for a uniform comparison between the stations, eliminating the factors of variability represented by the efficiency of traps (number of “active” traps for sampling) and the number of effective days for each sample: is then proceeded to calculate the Density of Activity (DA) (BRANDMAYR et alii 2005) for each Taxon, as the ratio between the total number of individuals captured during each sampling session and the number of traps found still working, multiplied for the session’s days; this result has applied an additional correction factor (CF) consisting of the ratio between the total of individuals and the DA, thus obtaining the Standard Capture Density (CSD) (ADORNO 1995)
DA = [nb.ind. / (nb.trap * dd)] FC = nb.TOT.ind. / DA CSD = [nb.ind. / (nb.trap * dd)] * FC 3.6 Data analysis
Margalef’s index (d)
This index measures the richness of taxa (in this case families or species) of the stations, calculated as follows:
d = (S-1)/lnN
where:
S = number of taxa
N = total amount of specimens collected in the station
The reference interval for this index, which considers a medium to good level in terms of richness, is between 2 and 5, where for values below 2 is considered a low diversity.
Shannon’s index (H’)
In order to assess the level of biodiversity of the stations, we used the Shannon index calculated as follows:
where:
s = number of taxa;
pj = Nj / N (relative abundance);
Nj = number of specimens belonging to a certain taxon in the station; N = total amount of specimens in the station.
This is an index that is determined by the number of species and the distribution of their relative abundances in the station. It is strongly influenced by the mean abundances (CHEMINI 1991).
Bray-Curtis index
The Bray-Curtis index or coefficient of similarity (a semi-quantitative index) estimates the similarity between pairs of samples taking into account not only the presence / absence, but also the abundances of individual taxa. This was calculated using the formula:
BC
100
2min y
ij, y
ik
i1 p
y
ij y
ik
i1 p
where:p = total number of taxa i = taxon
yij = abundance of the taxon (i) in the first sample (j)
yik = abundance of the taxon (i) in the second sample (k).
This index takes the value 0 if the two samples have no taxa in common, and is equal to 100 if the two samples are identical.
Non metric multidimensional scaling (n-MDS).
In order to highlight similarities and differences between the traps and the stations have been used also the multivariate analysis of communities using the methodology of Non-Metric Multidimensional Scaling (NMDS).
This technique is considered by CLARKE &WARWICK (2001), at least from the conceptual point of view, the easier to apply; it keeps a clear and direct link with the original data. It is also very flexible as it requires no assumptions about the form of the data distribution.
This methodology has been applied both after a square-root transformation of abundance data of each taxon. The data thus treated were then used to obtain a Bray-Curtis similarity matrix. Referring to that it was possible to construct a series of plots that allow to show the similarities between the various units of sampling (traps and stations). Each point on the graphs represents a single sampling unit, whose position is determined by all the taxa and the number of specimens collected for each of them.
In this way, homogeneous groups can be observed between the sampling units. Since the graphs projected a multidimensional space in two-dimensions or three-dimensions, the technique provides a measure of “stress” or the “forcing” of the plot. CLARKE & WARWICK (2001) suggest not to consider plots with stress values higher than 0,18 as being unrepresentative.
Analysis of similarity (ANOSIM)
This technique provides a measure of the significance of differences between the groups identified a priori (CLARKE & WARWICK 2001) The test results is a value, called R, which reflects the difference observed between the distances of the points belonging to each of the groups compared, with respect to the distance of the points belonging to other groups:
R = rb-rw/1/4 n (n-1)
where:
rb = mean diversity within the group; rw = mean diversity with the other groups;
n= total number of sample units.
units. Values less than zero, represent the opposite case.
The ANOSIM test, using a predetermined number of times, recalculates the value of R randomly permuting membership group of each replication. In this way it is obtained a distribution of R simulated with which to compare the value of R observed.
The null hypothesis is rejected when R observed falls outside the distribution of the R simulated: the higher the R observed value is away from that of R simulated values, the more likely that the clusters on the plot of the representations are not random.
Together with the calculation of R is produced an estimation of the significance that allows to evaluate the possibility of making a mistake in interpreting R.
It was also estimated the statistical significance of differences between stations using the Parwise tests, based on the value of R observed between pairs of stations.
Permutional ANOVA (PERMANOVA)
Permanova is a routine for testing the simultaneous response of one or more variables to one or more factors in an analysis of variance experimental design on the basis of any resemblance measure, using permutation methods. The main differences between ANOSIM and PERMANOVA is that, the first one, before to proceed with the analysis, rank the value of the resemblance matrix, so the derived information regard the relationship among the dissimilarities, instead of the differences on the value of dissimilarities witch is returned from the permanova methods. If this method is used with only one variable in conjunction with the Euclidean distance, the results of permanova test are the same as those of the traditional ANOVA.
Hierarchical clustering
The aims of this classificationmethod is to find “natural groupings” of samples such that samples within a group are more similar to each other, generally, than samples in different groups. For the similarity between cluster the complete linkage algorithm was used.
Similarity profile (SIMPROF)
This routine is a tests for evidence of structure in an a priori unstructured set of samples. First a resemblance profile is determined by ranking the resemblance matrix for the data. A mean profile is then calculated by randomising the order of each variables values and re-calculating the profile. The pi statistic is calculated as the deviation of the actual data profile with the mean one. This is compared with the deviations of further randomly generated profiles to test for significance. The null hypothesis is no structure so randomisation allowed
Contribution of variables to similarity (SIMPER)
This routine identify variables (species) that most contribute to the difference between two groups (stations). It decomposes the average Bray-Curtis similarities or Euclidean distances between all pairs of site groups into percentage contributions from each species, listing the species in decreasing order of such contributions.
Statistical analyzes were performed with the software “R v2.15.2 statistical programming language” and “Primer 6 v 6.1.13 & Permanova + v 1.0.3”.
R
ESULTS4
F
AUNISTIC ANALYSIS4.1 General analysis of sampling for species of Staphylinidae (excluding Pselaphinae)
Staphylinidae collected with window traps, pit-fall traps and car-net were sorted previously by subfamilies and then, excluding Pselaphinae, at species level and sometimes at morphospecies level, with the exception of those collected with the daily car-net; so we excluded from the determination at the specific level Oxytelinae in relation to the large number of specimens sampled (13.461) and Aleocharinae both for the high number of counted specimens (7.809) and especially for the considerable uncertainties taxonomic and systematic that this subfamily presents in Mediterranean area.
For the nomenclature, reference is made to the checklist of the Italian fauna (CICERONI et alii 1995) updated to LÖBL &SMETANA (2004) and others more recent reviews (ASSING 2005,ASSING 2007, ASSING 2008a, ASSING 2008b, ASSING 2010, BORDONI 2008,FELDMANN 2007,MARUYAMA 2006, TRONQUET 2004, TRONQUET 2006, SCHÜLKE 2011). The subgenus are not considered.
Regarding Geostiba plicatella (Fauvel, 1878), Stenus brunnipes Stephens, 1833, Ocypus ophthalmicus (Scopoli 1763) and Xantholinus graecus Kraatz, 1858, because of the complex taxonomic problems still unsolved, the specimens sampled were not allocated to any of the subspecies currently recognized as valid.
Chorological categories were referred at the species level and based on classification proposed by VIGNA TAGLIANTI et alii 1992. The distribution are deduced fromPILON (2004), ZANETTI (2004) LÖBL & SMETANA (2004) and the others more recent reviews above mentioned. The eventual presence of the species in the extrapalaearctic regions is given by the following acronyms: COS: Cosmopolitan; NAR: Nearctic Region; AFR: Afrotropical Region; ORR: Oriental Region; NTR: Neotropical Region; AUR: Australian Region. Also, the alien species (ias) and the introduced species (i) are indicated.
The distribution in Italy is taken from the checklist of the Italian fauna (CICERONI et alii 1995) updated according to the project CKmap (PILON 2004, ZANETTI 2004). Regarding Heterothops
minutus Wollaston 1860 it was referred to ZANETTI (2011) that records it for the whole mainland Italy, Sardinia and Sicily.
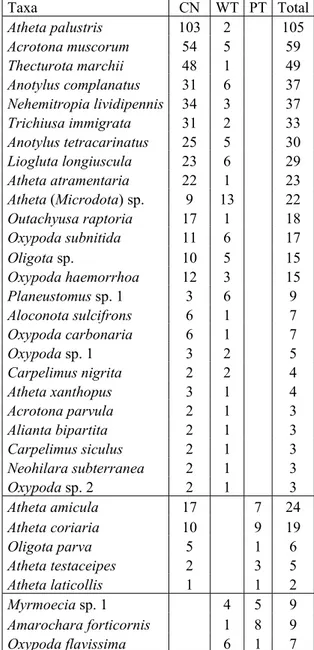
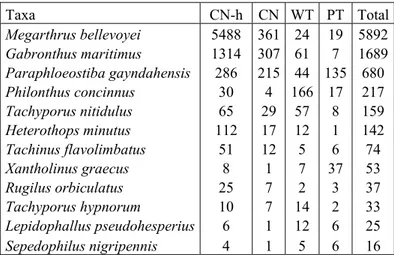
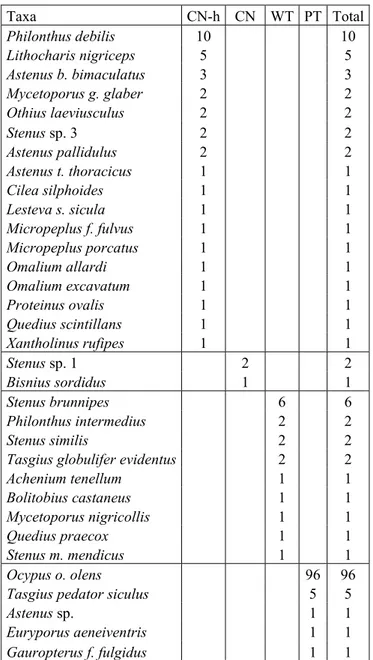
In total were surveyed 170 taxa (species, subspecies and 20 morphospecies) of Coleoptera Staphylinidae that are reported in table 4.1.1.
Subfamily Taxa Chorological category ITA dist. CN PT WT
Acrotona muscorum (Brisout, 1860) ASE N S Si – 54 5
Acrotona parvula (Mannerheim, 1830) PAL N S Si Sa 2 1
Alaobia scapularis (Sahlberg, 1831) EUR N – Si Sa 1
Aleochara bipustulata (Linné, 1760) PAL N S Si Sa 10 8 12
Aleochara clavicornis Redtenbacher, 1849 AIM N S Si Sa 1
Alianta bipartita Fauvel, 1900 Tirrenic N S Si – 2 1
Aloconota gregaria (Erichson, 1839) TEM N S Si Sa 65 3 65
Aloconota sulcifrons (Stephens, 1832) COS N S Si Sa 6 1
Amarochara forticornis (Lacordaire, 1835) EUR N S Si Sa 8 1
Amarochara umbrosa (Erichson, 1837) ASE N S Si – 278 3 14
Amischa decipiens (Sharp, 1869) EUR N – Si – 22 2 30
Amischa forcipata Mulsant & Rey, 1873 WEU N S Si – 18
Amischa nigrofusca (Stephens, 1832) TEM N S Si Sa 8
Amischa sp. - - 9
Atheta (Microdota) sp. - - 9 13
Atheta aeneicollis (Sharp, 1869) EUM N S Si Sa 35 23 27
Atheta amicula (Stephens, 1832) CEM+NTRi N S Si Sa 17 7
Atheta atramentaria (Gyllenhal, 1810) PAL+AFR+ORR N S Si Sa 22 1
Atheta cauta (Erichson, 1837) SIE N S? Si Sa? 2
Atheta coriaria (Kraatz, 1856) COS N S Si Sa 10 9
Atheta gr. fungi - - 426 29 144
Atheta inquinula (Gravenhorst, 1802) TEM N S Si Sa 110 3 22
Atheta laticollis (Stephens, 1832) ASE N S Si Sa 1 1
Atheta longicornis (Gravenhorst, 1802) PAL+ORR N S Si Sa 1
Atheta mucronata (Kraatz, 1859) ias – S Si – 32 58 7
Atheta nigra (Kraatz, 1856) ASE N S Si Sa 3
Atheta oblita (Erichson, 1839) EUM N S Si Sa 2
Atheta occulta (Erichson, 1837) PAL N S Si – 3
Atheta orbata (Erichson, 1837) EUM N S Si – 2
Atheta palustris (Kiesenwetter, 1844) PAL N S Si Sa 103 2
Atheta sp. - - 1
Atheta sp. 1 - - 1
Atheta sp. 2 - - 1
Atheta sp. 3 - - 1
Atheta sp. 4 - - 1
Atheta testaceipes (Heer, 1839) EUR N S Si – 2 3
Atheta triangulum (Kraatz, 1856) PAL N S Si Sa 1
Atheta xanthopus (Thomson, 1856) EUR N S Si – 3 1
Borboropora sp. 1 - - 1
Callicerus atricollis (Aubé, 1850) Alpine-Appeninic N S Si – 5
Caloderina hierosolymitana (Saulcy, 1865) EME – S Si – 1
Cordalia obscura (Gravenhorst, 1802) TEM+NARi N S Si Sa 329 42 23
Dacrila pruinosa (Kraatz, 1856) MED N S Si – 9 2 5
Diestota guadalupensis Pace, 1987 ias N S Si Sa 3
Falagrioma thoracica (Stephens, 1832) TEM N S Si – 3
Geostiba plicatella (Fauvel, 1878) WME – – Si – 11
Gnypeta rubrior Tottenham, 1939 CEU N S Si – 1
Liogluta longiuscula (Gravenhorst, 1802) PAL N S Si Sa 23 6
Myrmecopora fugax (Erichson, 1839) MED N S Si Sa 3
Myrmoecia sp. 1 - - 5 4
Subfamily Taxa Chorological category ITA dist. CN PT WT
Neohilara subterranea (Mulsant & Rey, 1853) EUR N S Si – 2 1
Notothecta inflata Fauvel, 1869 NAF – S Si – 1
Oligota muensteri Bernhauer, 1923 EUR – – Si – 9 3 12
Oligota parva Kraatz, 1862 EUM+AFR+NAR+NTR N S Si Sa 5 1
Oligota punctulata Heer, 1839 EUM N S Si – 15 2 2
Oligota sp. - - 10 5
Outachyusa raptoria (Wollaston, 1854) AFM – S Si – 17 1
Oxypoda brevicornis (Stephens, 1832) SIE N S Si Sa 30 4 3
Oxypoda carbonaria (Heer, 1841) EUM N S Si Sa 6 1
Oxypoda flavissima Assing, 2008 WME – – Si – 1 6
Oxypoda haemorrhoa (Mannerheim, 1830) PAL N S Si Sa 12 3
Oxypoda lurida Wollaston, 1857 EUM N S Si Sa 2
Oxypoda sp. 1 - - 3 2
Oxypoda sp. 2 - - 2 1
Oxypoda subnitida Mulsant & Rey, 1875 WME – – Si – 11 6
E Pella leonhardi Bernhauer, 1912 SIC – – Si – 2
E Pronomaea sicula Assing, 2007 SIC – – Si – 21 1 16
Pycnota paradoxa (Mulsant & Rey, 1861) EUR N – Si – 1
Tetralaucopora longitarsis (Erichson, 1839) PAL N S Si Sa 1
Thecturota marchii (Dodero, 1922) ias N S Si Sa 48 1
Tinotus morion (Gravenhorst, 1802) OLA N S Si – 1
ALEOCHARINAE
Trichiusa immigrata Lohse, 1984 ias N S Si – 31 2
HABROCERINAE Habrocerus capillaricornis (Gravenhorst, 1806) OLA+AUR+NTR N S Si Sa 93 2
Micropeplus fulvus fulvus Erichson, 1840 PAL+ORR N S Si Sa 1
Micropeplus porcatus (Paykull, 1789) PAL N S Si – 1
MICROPEPLINAE
Micropeplus staphylinoides (Marsham, 1802) EUM N S Si Sa 1 2
Eusphalerum luteicorne luteicorne (Erichson, 1840) NAF – – Si Sa? 3 4
Lesteva sicula sicula Erichson, 1840 EUR – S Si – 1
Omalium allardi Fairmaire & Brisout de Barneville, 1859 EUM+AURi N S Si Sa 1
Omalium excavatum Stephens, 1834 EUM+NAR N S Si Sa 1
OMALIINAE
Paraphloeostiba gayndahensis (MacLeay, 1871) ias N S Si Sa 504 135 44
Anotylus complanatus (Erichson, 1839) PAL+AUR+NTR N S Si Sa 31 6
Anotylus intricatus (Erichson, 1840) PAL N S Si – 2
Anotylus inustus (Gravenhorst, 1806) PAL N S Si Sa 3 3 42
Anotylus nitidulus (Gravenhorst, 1802) OLA+NTR+ORR N S Si Sa 2779 18 247
Anotylus sculpturatus (Gravenhorst, 1806) CEM N S Si Sa 24 6 55
Anotylus speculifrons (Kraatz, 1857) TEM N S Si Sa 457 3 111
Anotylus tetracarinatus (Block, 1799) OLA N S Si Sa 25 5
Carpelimus corticinus (Gravenhorst, 1806) OLA+AUR+NTR N S Si Sa 161 19 80
Carpelimus exiguus (Erichson, 1839) PAL+AFR+ORR+AUR N S Si Sa 3
Carpelimus fuliginosus (Gravenhorst, 1802) AFM N S Si – 1
Carpelimus nigrita (Wollaston, 1857) PAL+AFR+ORR N S Si – 2 2
Carpelimus pusillus (Gravenhorst, 1802) OLA+AUR N S Si Sa 2
Carpelimus siculus (Mulsant & Rey, 1878) SICAppeninic+Greece – S Si – 2 1
Carpelimus vitalei (Bernhauer, 1935) SICAppeninic – S Si Sa 1
Ochthephilus sp. 1 - - 2
Planeustomus sp. 1 - - 3 6
Platystethus degener Mulsant & Rey, 1878 OLA N S Si – 5
OXYTELINAE
Subfamily Taxa Chorological category ITA dist. CN PT WT
Achenium striatum striatum (Latreille, 1804) WME N S Si Sa 1 1
Achenium tenellum Erichson, 1840 NAF – S Si Sa 1
Astenus bimaculatus bimaculatus (Erichson, 1840) PAL N S Si Sa 3
Astenus lyonessius (Joy, 1908) EUM N S Si Sa 7 31 2
Astenus pallidulus (Wollaston, 1864) WME – S Si – 2
Astenus sp. - - 1
Astenus thoracicus thoracicus (Baudi di Selve, 1857) MED N S Si – 1
Domene stilicina (Erichson, 1840) MED – S Si Sa 2 21
Hypomedon debilicornis (Wollaston, 1857) ias N S Si – 46 2
Lithocharis nigriceps (Kraatz,1859) COS N S Si – 5
Luzea nigritula (Erichson, 1840) EUM N S Si Sa 26 1
Medon perniger Coiffait, 1978 Alpine-Appeninic N S Si Sa 4
Rugilus orbiculatus (Paykull, 1789) OLA+AUR N S Si – 34 3 2
Scopaeus debilis Hochhuth, 1851 TEM N S Si Sa 398 6
Scopaeus mitratus Binaghi, 1935 SICAppeninic+Greece N S Si – 135 9
Scopaeus sp. - - 2 1
PAEDERINAE
Sunius algiricus (Coiffait, 1970) NAF – S Si – 21 2
Megarthrus bellevoyei Saulcy, 1862 PAL N S Si Sa 5999 19 24
Proteinus atomarius Erichson, 1840 OLA N S Si Sa 294 4
PROTEININAE
Proteinus ovalis Stephens, 1834 EUR N S Si Sa 1
Bisnius sordidus (Gravenhorst, 1802) COS N S Si – 1
Euryporus aeneiventris P. Lucas, 1846 WME – S Si Sa 1
Gabrius nigritulus (Gravenhorst, 1802) COS N S Si Sa 30 4
Gabronthus maritimus (Motschulsky, 1858) ASE+AFR+ORR N S Si Sa 1663 7 61
Gauropterus fulgidus fulgidus (Fabricius, 1787) OLA+ORR N S Si Sa 1
Gyrohypnus angustatus Stephens, 1833 CEM+NARi N S Si Sa 19 1
Gyrohypnus fracticornis (O. Müller, 1776) CAE+Ni+AURi+NARi+NTRi N S Si Sa 4 1
Heterothops minutus Wollaston, 1860 EUM N S Si Sa 139 1 12
Lepidophallus pseudohesperius (Reitter, 1908) WME – – Si Sa 7 6 12
Leptacinus intermedius Donisthorpe, 1936 OLA N S Si Sa 76 8
Megalinus glabratus (Gravenhorst, 1802) TEM N S Si Sa 11 85 25
Neobisnius lathrobioides (Baudi di Selve, 1848) TEM+NARi N S Si Sa 17
Neobisnius procerulus procerulus (Gravenhorst, 1806) PAL+AFR+AUR+NTR N S Si Sa? 6
Ocypus olens olens (O. Müller, 1764) EUM+NARi N S Si Sa 96
Ocypus ophthalmicus (Scopoli, 1763) PAL N S Si Sa 51 2
Othius laeviusculus Stephens, 1833 EUM N S Si Sa 2
Philonthus concinnus (Gravenhorst, 1802) PAL+NARi N S Si Sa 36 17 166
Philonthus debilis (Gravenhorst, 1802) PAL+NARi N S Si Sa 10
Philonthus intermedius (Lacordaire, 1835) TEM N S Si Sa 2
Philonthus jurgans Tottenham, 1937 EUR+NAR N S Si – 7 2
E Quedius caelebs Rottenberg, 1870 SIC – – Si – 1 3
Quedius humeralis Stephens, 1832 TUE N S Si Sa 2
Quedius levicollis (Brullé, 1832) EUM N S Si Sa 1 1 3
Quedius pallipes P. Lucas, 1846 WME N S Si Sa 23 2
Quedius praecox (Gravenhorst, 1802) WME – – Si Sa 1
Quedius scintillans (Gravenhorst, 1806) TEM N S Si Sa 1
Quedius semiobscurus (Marsham, 1802) EUM N S Si Sa 1 2
E Tasgius globulifer evidentus (Tottenham, 1945) EUR – S? Si – 2
E Tasgius pedator siculus (Aubé, 1842) EUM – – Si – 5
Xantholinus graecus Kraatz, 1858 MED – S Si – 9 37 7
Subfamily Taxa Chorological category ITA dist. CN PT WT
Stenus brunnipes Stephens, 1833 PAL N S Si – 6
Stenus mendicus mendicus Erichson, 1840 MED – S Si Sa 1
Stenus similis (Herbst, 1784) CEM N S Si Sa 2
Stenus sp. 1 - - 4
Stenus sp. 2 - - 2 2
STENINAE
Stenus sp. 3 - - 2
Bolitobius castaneus (Stephens, 1832) TUE N S Si Sa 1
Cilea silphoides (Linné, 1767) COS N S Si Sa 1
Mycetoporus glaber glaber (Sperk, 1835) EUM N S Si Sa 2
Mycetoporus nigricollis Stephens, 1835 EUM N S Si – 1
Mycetoporus reichei (Pandellé, 1869) EME N S Si Sa 4 1
Sepedophilus aestivus (Rey, 1882) WME N S Si Sa 14
Sepedophilus marshami (Stephens, 1832) ASE+NARi N S Si – 5 5
Sepedophilus nigripennis (Stephens, 1832) EUM N S Si Sa 5 6 5
Tachinus flavolimbatus Pandellé, 1869 WME – S Si – 65 6 5
Tachyporus abner Saulcy, 1865 MED N S Si Sa 2
Tachyporus caucasicus Kolenati, 1846 EUM – S Si Sa 6
Tachyporus hypnorum (Fabricius, 1775) PAL N S Si Sa 18 2 14
TACHYPORINAE
Tachyporus nitidulus (Fabricius, 1781) COS N S Si Sa 95 8 57
Tab 4.1.1 – Taxa ofStaphylinidae surveyed. With letter E are indicated the endemic Sicilian taxa. For each taxon is also
reported the chorological category and the distribution in Italy following the symbology used in the checklist of the
Italian fauna (CICERONI et alii 1995). In bold are marked the species new for Italian fauna, in red (Si) the species new
for Sicilian fauna, in green (Si) the species confirmed for Sicilian fauna. There is also indicated the number of
specimens collected by the different techniques utilized: Car net (CN); Pit-fall traps (PT) and Windows traps (WT). Further explanations and clarifications in the text.
4.2 Commentary on the most interesting species
S
PECIES AND SUBSPECIES ENDEMIC TOS
ICILYFive taxa are Sicilian endemism.
Pella leonhardi (Bernhauer, 1912)
Habitat: The genus Pella Stephens, 1835 includes species that are myrmecophiles. Ant species with which P. leonhardi enfeoffed are not known.
Geographical distribution: The species was previously known only for the holotype (Monte Cola, Sicily) (MARUYAMA 2006) and for another specimens of Nebrodi Mounts (Messina, Santo Saba, pit-fall traps) (in coll. Zanetti).
Sampling methods: Pit-fall traps.
Pronomaea sicula Assing, 2007
Habitat: The habitat of the species of the genus Pronomaea Erichson, 1837 is poorly known. They normally inhabit the open spaces and sometimes are associated with ants, but nothing is known about their biological cycle and feeding habits. ASSING (2007) reports for P. sicula catches in a valley of the watercourse at 800 m a.s.l. and on the banks of a river.
Geographical distribution: P. sicula has recently been described as endemic of Sicily, where is vicarious for the similar P. rostrata Erichson, 1837. This second according to ASSING (l. c.) has atlanto-mediterranean distribution, being present in most of Europe except for the northern most regions, Balkans, and Maghreb (fig. 4.1).