D
OTTORATO DIR
ICERCA INS
CIENZA DEI
M
ATERIALI E
N
ANOTECNOLOGIE
-
XXX
CICLO
E
MANUELE
L
UIGI
S
CIUTO
D
EVELOPMENT OF
I
NNOVATIVE
T
ECHNOLOGIES FOR
DNA
E
XTRACTION AND
D
ETECTION
TUTOR:DOTT.SSA SABRINA CONOCI
TUTOR DIDATTICO:PROF.SSA MARIA GRAZIA GRIMALDI
COORDINATORE:PROF.SSA MARIA GRAZIA GRIMALDI
TESI PER IL CONSEGUIMENTO DEL TITOLO DI DOTTORE DI RICERCA
U
NIVERSITÀ DEGLIS
TUDI DIP
ALERMO IN CONVENZIONE CONSUMMARY
CHAPTER 1: INTRODUCTION ... 4
CHAPTER 2: CURRENT METHODOLOGIES IN DNA ANALYSIS ... 10
2.1 – DNA Extraction Methods ... 11
2.2 – DNA Detection Methods ... 17
CHAPTER 3: INTEGRATED MODULES FOR DNA EXTRACTION ... 30
3.1 – Prep Disk Technology ... 30
3.1.1 – Platform Description ... 30
3.1.2 – Functional test of hybrid disk P1B ... 34
3.2 – Silicon pillars Technology ... 44
3.2.1 – Geometrical features of the microstructures ... 44
3.2.2 – Effect of Surface-to-Volume Ratio and ionic force on extraction performance ... 48
3.2.3 – Extraction and Real-Time amplification on the chip ... 51
Experimental Part ... 54
CHAPTER 4: INTEGRATED MODULES FOR DNA DETECTION ... 60
4.1 – “CDC” Silicon Chip Technology for Real-Time PCR ... 60
4.1.1 – “CDC” Real-Time PCR device ... 60
4.2 – PCR free electrochemical detection of DNA ... 65
4.2.1 – Miniaturised Electrochemical device ... 65
4.2.2 – Electrochemical cells characterization ... 68
4.2.3 – DNA electrochemical detection strategy setup ... 71
4.2.4 – PCR free DNA detection ... 75
4.3 – Other applications of electrochemical detection technology ... 80
4.3.1 – Glucose sensing ... 80
4.3.2 – Aminoacids sensing ... 85
Experimental Part ... 87
CHAPTER 5: DNA CLONING IN THE ELECTROCHEMICAL DETECTION OF ENVIRONMENTAL ANALYTES ... 99
5.1 – Whole-cell environmental biosensor ... 99
5.2 – Molecular cloning procedure ... 99
5.3 – Electrochemical detection of Arsenite in potable water by using the E. coli bioreporter ... 102
Experimental Part ... 107
CHAPTER 6: CONCLUSIONS ... 109
1. INTRODUCTION
DNA is the code of life for every living being. However, the scientific knowledge about the structure and functioning of DNA is quite recent. Only in the 1950's, James Watson and Francis Crick discovered its chemical structure and were awarded the Nobel Prize for Medicine in 1962. Since then, the research on this molecule has been multiplied exponentially. Today, thanks to these discoveries, we have achieved fundamental progress in the diagnosis and treatment of many diseases.
In 2000, the International Consortium of the Human Genome Project announced the decoding of the whole nucleic acid sequence of human DNA or, in other words, the sequencing of the human genome. So today we know the exact order of succession of “bases” in the whole sequence, which is about three billion bases long for human being. Nowadays the sequence of thousands of genomes is known and this number is enormously increased in the last years. According to data reported in the GeneBank data-base (GeneBank https://www.ncbi.nlm.nih.gov/nucgss/ ) the sequencing of about 2350 viruses, 14800 bacteria and 2100 Eukaryote organisms (included our specie, homo sapiens) has been reached, with an active propulsion in this direction achieved in the last five years (Fig. 1). This has impressively made progresses in many fields including anthropology, forensic and, particularly, medicine. In fact, the molecular analysis of nucleic acids (DNA, RNA) operated a real disruptive innovation in healthcare area being effective in early diagnosis, personalized therapy and preventive cancer screening, helping healthcare professionals to prescribe accurate therapeutic interventions. This opened innovative medical perspectives in many fields of medicine including infectious diseases, oncology, pharmacogenomics, genetic
diseases, diabetes, forensic, and neurological, cardiovascular diseases, going towards a deep revolution in terms of high throughput pathologies characterization and personalized therapies.
Fig.1. Number of sequenced genomes submitted to NCBI for Virus (green bar), Bacteria (blue bar) and
Eukaryotic kingdoms (yellow bar). (GeneBank https://www.ncbi.nlm.nih.gov/nucgss/)
In last decade, the DNA analysis for molecular diagnosis evolved from genomic to epigenetic analysis.
DNA analysis can address different applicative approaches:
- Analysis of SNPs (Single Nucleotide Polymorfism). SNP is a difference in a single nucleotide in a specific target gene (for example, a SNP may replace the nucleotide cytosine (C) with the nucleotide thymine (T)). They are very important being correlated with some human genetic diseases (i.e. sickle cell anaemia) together with prediction of an individual’s response to certain drugs, susceptibility to environmental factors such as toxins, and risk of developing particular diseases.
- Analysis of gene expression. It consists in the analysis of the DNA sequences (genes) expressed (translated in mRNA) in the cell. This type of analysis (usually carried out by
microarray biochip [1], focusing the finding of expression level of target genes, related to some specific intracellular pathway.
- Identification of unknown sequences. It is particular relevant in the diagnosis of infectious diseases where the DNA analysis offers the advantages to know the specific bacteria specie o mutated virus.
Whatever would be the application, experimental techniques for DNA analysis should present two primary features: specificity, in order decodify the sequence as precisely as possible, and sensibility, to go deeply in genome and transcriptome quantification. Related to this, Real-Time
PCR (Polymerase Chain Reaction) is the gold standard biotechnology for DNA analysis.
PCR is a molecular reaction discovered by the American biochemist Kary B. Mullis in 1983 [2]. It is
based on the cyclic amplification of a specific DNA target sequence by a couple of small complementary oligoribonucleotides (primers) and a thermostable Taq Polymerase enzyme acting as catalyst of the amplification reaction.
Real-Time PCR (qPCR) is an advanced version of this reaction, improved by the introduction of a fluorescent probe, able to label the target sequence during its amplification [3]. The fluorescent probe can bound DNA in a specific or non-specific way. The first one is referred to fluorescent probes such as TaqMan, Molecular Beacon and Scorpions. In this case, the fluorophore is linked to one of the two ends of the probe sequence and this is complementary to a specific region inside the target gene [4]. The non-specific labeling, instead, is related to probes such as SYBR® Green, which bound the target intercalating into its DNA minor grooves, thus, without any hybridization [5].
Fig.2 reports the Real-Time PCR mechanism using specific fluorescent probes for detection (TaqMan). Chapter 2 will describe the PCR mechanism in detail.
Fig.2. Real-Time PCR mechanism using specific fluorescent probes for detection (TaqMan).
Though technologies such as Real-Time PCR are rapidly diffusing in biomedical field, their massive use is strongly limited due to their experimental procedures requiring:
- Specialized staff
- Complex protocols addressing not only the detection of DNA via RT-PCR but also the
extraction from cells.
- Expensive instruments
In order to overpass these limitations, my Ph.D. project has been focused on the development of fast, multiplex, innovative and easy-to-use technological platforms for DNA analysis (from
technologies are called Point-of-Care (PoC) and could create the conditions for a more efficient clinical analysis, introducing a series of advantages:
• Fast and cheap procedures for biological samples preparation and analysis • Fast diagnosis
• Identification and analysis of different DNA mutations (complex phenotypes and
drug-resistance related)
• Disease-specific and therapy-specific pattern definition
My research activity has been divided into three main parts, which will be described in the subsequent chapters:
1. Development and characterization of a miniaturized platform for DNA extraction. 2. Development and characterization of miniaturized systems for DNA detection with
both optical transduction methods (via RT-PCR) and electrical methods (electrochemical detection).
References
1. Schena M., Microarray Analysis, - Wiley, ISBN: 978-0-471-41443-8.
2. Mullis K., Faloona F., Scharf S., Saiki R., Horn G. and Erlich H. (1986), Specific Enzymatic
Amplification of DNA In Vitro: The Polymerase Chain Reaction, Cold Spring Harbor Symposium on Quantitative Biology 51 : 263.
3. Valasek M.A., Repa J.J. (2005), The power of real-time PCR, Advances in Physiology Education Published 1 September, 67.
4. Filion M. (2012), Quantitative Real-time PCR in Applied Microbiology, Caster Academic Press, Norfolk.
5. Zipper H. et al. (2004), Investigations on DNA intercalation and surface binding by SYBR Green I, its structure determination and methodological implications, Nucleic Acids Res. 32(12) : e103.
2. CURRENT METHODOLOGIES IN DNA ANALYSIS
DNA analysis is a crucial point for a wide range of applications, including environmental monitoring of bacterial and viral contamination, food control, homeland security and, above all, clinical diagnostics. For these applications, in fact, traditional approaches commonly used in the laboratory involved phenotypic techniques such as detection via antibody recognition and plate counting. However, these methods were affected by a series of limitations, in terms of complexity of experimental procedure adopted, costs and time consuming (48 hours to have a result in the case of plate counting) and low sensitivity (antibody methods).
In this sense, genotypic methods, based on nucleic acids detection, made a real revolution in the biological diagnosis, thanks to their ability to combine high specificity and sensitivity with precise quantification and fast response.
To execute the DNA molecular analysis, several analytical steps need to be accomplished. First of all, (a) the NA extraction from biological samples, i.e. blood, urine, saliva, swab (sample prep); then, (b) the target sequence amplification (PCR) and finally, (c) the detection of the amplified product (Fig.1).
Fig.1. Schematic illustration of DNA analysis
In this chapter, we will describe the state of art of methods and protocols for DNA analysis, from extraction to amplification and detection.
2.1 – DNA Extraction Methods
DNA purification is a preliminary step for all genetic diagnostic technologies.
The isolation and collection of genetic material from a biological sample of any species (virus, bacterial, yeast, animal cell or plant cell) and origin (blood, urine, saliva fluid or tissue biopsy) basically comprises four main phases:
1. Lysis of cells structure from sample 2. RNA and protein degradation
3. DNA separation from cell debris (binding and washing steps) 4. DNA isolation and collection (elution step)
The lysis of cells structure is focused on the denaturation of cell membrane and other intracellular compartmentalisations, so that all genetic material can be purified and released. Cell lysis, and production of debris, is usually performed by using physical manipulations such as sonication, boiling, freeze–thaw cycles [1,2] and chemical agents such as Sodium dodecyl sulphate or Triton X-100 detergents, which alter the lipid-lipid associations inside membrane causing its “dissolution”. Once released the intracellular material (DNA, RNA, proteins, polysaccharides, metals, salts, organic compounds, and dyes), RNA and proteins are degraded by enzymatic reaction by means of RNAase and protease added to the purification system.
After all degradation phases, DNA must be separated and isolated from the cell debris. For this purpose, different approaches have been developed to increase the yield of genetic material after purification. This because is important to keep as much DNA as possible, during all isolation steps, avoiding loss of material before the final elution.
The literature reports different examples of DNA purification methods and many of these are developed using plastic materials and include a complex fluidic network that manages fluid
movement such us mixing, splitting etc. etc. Strategies for DNA separation evolved from liquid– liquid purification method, such as isolation by precipitation with phenol-chloroform, to most advanced liquid–solid purification systems, mostly, based on silica in the form of micro-filter mounted in a plastic column or layers covering magnetic beads.
DNA phenol-chloroform based purification is a conventional method in which proteins, lipids, carbohydrates, and all others cell debris are removed through extraction of the aqueous phase with the organic mixture of phenol and chloroform [3,4]. Phenol denatures proteins, which stay in the organic downer phase, whereas the DNA is in the aqueous upper phase (Fig.2A). Thus, a biphasic emulsion forms when phenol and chloroform are added. The upper phase, then, is collected and DNA can be precipitated from the supernatant by adding ethanol or isopropanol and high concentration of salt. DNA precipitate is, then, collected by centrifugation and dissolved with TE buffer or sterile distilled water (Fig.2B).
A
B
Fig.2. A) Phase distribution and ethanol precipitation in phenol-chloroform DNA extraction; B)
However, a common drawback for this type of DNA purification method is related to the procedure itself, which is basically time and cost-consuming, labor intensive, dangerous (because of the use of hazardous chemicals) and low yields. Moreover, since is totally manual, there is also a strong risk of cross-contamination, thus, affecting the purity of the final product.
For these reasons, more automated solid phase extraction became the most common methods for DNA purification, since they include minimal hazardous chemicals, easier manipulations and increased efficiency. Any of the solid phase system, based on affinity chromatography by reversible surface adsorption, can be incorporated into a spin filter or column, or can imply the use of other surfaces such as beads.
Separation of DNA by plastic filtered spin columns (i.e. Qiagen kits) is obtained by a series of
centrifugations of sample in plastic tubes [5]. Theses tubes contain a silica filter on which surface, step-by-step, is collected and adsorbed the DNA to be purified (Fig.3A). Cells from biological sample, previously degraded using lysis buffers, are applied to the columns and centrifuged, and the DNA binds to the column using the appropriate pH and salt concentration conditions, provided by binding solutions. Some proteins and other debris may also bind the column, but they are later removed using washing buffers containing competitive agents during a series of washing steps. In this way, DNA molecules, adsorbed on the silica filter, are separated from cell debris. DNA is eluted, finally, in sterile distilled water or TE buffer. (Fig.3B). Kits with silica spin filters are fast to perform and do not require hazardous chemicals.
A
B
Fig.3. (A) Scheme of DNA-silica filter adsorption mechanism; B) DNA spin-column purification protocol.
A drawback, however, is that filters can be saturated with thick samples and many steps are required to load the binding, washing, and elution solutions.
Separation by paramagnetic beads (i.e. Magazorb kit). It is based on the electrostatic interaction
between the DNA molecules and magnetic beads covered by silica surface [6]. Inside the tubes containing DNA and cell debris in solution after the lysis step, magnetic nanoparticles are added to this mixture, followed by the addition of binding buffer (1.25 M sodium chloride and 10% polyethylene glycol), which composition creates cation bridges for DNA-silica interaction with beads surface (Fig.4A). The solution is mixed by inversion and incubated for 3 minutes at room temperature. Then, the tubes are located in a magnetic rack and thanks to the attraction of beads by the magnet, the washing and discarding of debris can be performed avoiding the risk of DNA
loss. The magnetic pellet is, finally, resuspended in TE buffer and DNA is eluted (Fig.4B). Surface binding capacity is determined by the area available for binding.
A
B
Fig.4. A) Scheme of DNA-bead adsorption mechanism; B) Protocol of DNA purification by paramagnetic
beads.
Sometimes silica is derivatized with positive amino-groups to bind the negatively charged DNA more effectively than naked silica. A drawback of the current extraction protocol, however, is that the use of ethanol and chaotropic salts can inhibit the PCR reaction or other molecular techniques downstream the DNA purification.
Despite the improvement in terms of yield quality and protocol safety, solid phase extraction methods still have many widespread limitations.
One of those is the volume and the amount of biological sample required to trigger all procedure for purification. From liquid-liquid to solid-phase extraction, in fact, hundreds of microliters to millilitres volumes are used; this implies invasive biological samplings from patients for diagnosis.
Another common drawback is the miniaturization and integration of the purification technology in a single portable device. A lot of stuff is required to perform the whole experiment of genetic material isolation, frequently with a complex architecture to manage the fluidic steps, which implies an increase of the design complexity, high costs and a laboratory with dedicated and specialized staff.
Finally, there is also a problem related to the material used for DNA purification. Plastic is the mostly used for tubes and other standard equipment of commercial kits. However, plastic material is not the best choice in terms of miniaturization, integration and thermal properties, thus remaining a huge limitation.
A solution to all the drawbacks above reported is offered by the microfluidic technology [7]. Microfluidic platforms are extremely attractive thanks to the number of advantages, they present, compared to macroscopic equivalents. The small volumes, required for the experimental setup, reduce sample and reagent consumption. Reduced size of device implies the possibility of miniaturization and integration together with a higher surface-to-volume ratio; this means that the exchange areas for DNA molecules transport are larger, allowing an excellent quality separation and purification of genetic material from cell debris.
Moreover, most of the microfluidic technologies developed so far can be combined with silicon material. Silicon is a very appealing material for DNA purification, thanks to various physical aspects such as low heat capacity, good thermal conductivity and possible patterned structures to increase the surface–area ratio, with consolidated production technologies and industrialization processes at high volume. Additionally, it allows the integration of electrodes and microelectronics circuitry that imprint the so-called “intelligence on board”.
In this sense, in the DNA extraction module of my Ph.D. project, I worked on the interesting approach involving the microfabricated silicon pillars. It merges the advantages to increase the
surface within the capture area with the possibility to be monolithically integrated into a miniaturized device. As described in detail in the chapter 3, the studies reported in this thesis involving pre-analytical samples (pre-purified DNA) on cells, proved this approach having a great potential towards the development of a genetic point-of-care device.
2.2 – DNA Detection Methods
As described in the chapter 1 of this thesis, the discovering of the PCR method by Kary Mullis made a revolution in the DNA analysis.
In the last years, the quality of the DNA analysis evolved following the innovation of PCR method. This because, so far, DNA amplification was the best choice for genetic detection able to guarantee high sensitivity and specificity starting from samples where the DNA target is in a very low concentration (LoD < 100 copies per ml of biological sample).
PCR is based on the cyclic amplification of a specific DNA target sequence by a couple of small
complementary oligoribonucleotides (primers) and a thermostable Taq Polymerase enzyme acting as catalyst of the amplification reaction. The primer pair (Foward and Reverse) is used to increase, by various amplification cycles, the number of copies of the target gene in an exponential way, starting from a small amount of DNA template; then, the final product (amplicon) can be studied by a both qualitative and quantitative analysis. More in details, each amplification cycle is divided into three phases (Fig.5):
1) denaturation of the DNA strand, so that the two strands of the target gene can be amplified separately.
2) annealing of the primer pair, according to complementarity between primers and target gene sequence.
3) primer extension by synthesizing a complementary strand from each one of the target template, forming the final amplicon.
Fig.5. PCR scheme: (1) denaturation; (2) annealing; (3) extension; (4) final product.
In the DNA analysis, PCR was firstly used to amplify the starting genetic material before detection. On that, several methods have been developed.
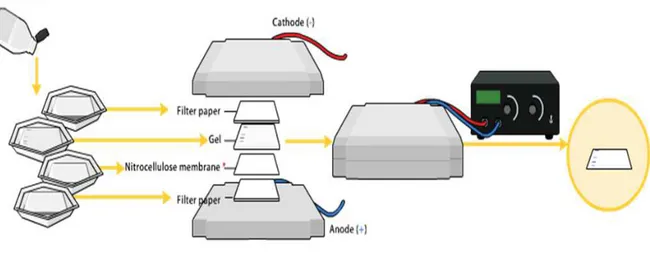
Southern blotting is one of the earliest techniques based on DNA amplification for genotypic
analysis; it is from Edwin Mellor Southern [8] and is a technique for DNA detection in a complex biological matrix. After an electrophoretic running, a gel containing amplified genetic targets, to be detected, is immersed in an alkaline solution and, then, covered by a nitrocellulose or nylon membrane, with a pile of adsorbent paper above. Thanks to the capillarity effect, alkaline solution
together with genetic material (from electrophoresis) starts going up from the gel towards the paper, causing the deposition of DNA samples on the nitrocellulose membrane. Once completed the migration of DNA, the membrane is immersed in another solution containing PCR oligonucleotides probes (labelled by fluorescent or radioactive dyes) specific for the genetic targets on membrane. In this way, probes can hybridize with the complementary DNA target and, after a washing step, allowing its identification by the optical detection of dye from probes (Fig.6).
Fig. 6. Southern blotting method.
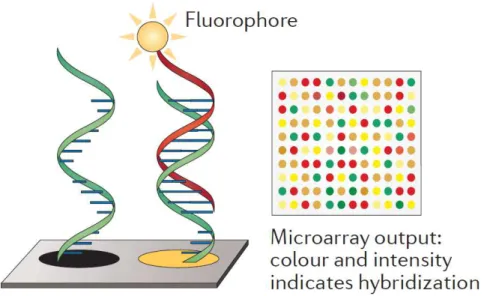
DNA molecular analysis, however, spreads with the introduction of multiplex and fast DNA detection platforms, such as DNA-microarray. It can be considered the first biochip and consists in a miniaturized system for fast, sensitive and high throughput genetic analysis of biologically relevant samples. The method is based on the reverse probes-target hybridization, which means an interaction between fixed probes and floating genetic targets from samples (Fig. 7).
Oligonucleotide probes (ssDNA) are spotted on the surface of a plastic, glass or silicon slide, in order to create an array in which each spot is specific for one of the DNA targets to be identified. In parallel, genetic targets, once amplified from biological samples by PCR, are labelled with
released on the array for the hybridization with complementary probes. The intensity of the signal is used to determine the number of bound molecules.
The main feature and advantage related to this technique is the possibility to test hundreds of targets in a single reaction, thanks to the simultaneous detection of fluorescent signals, from spots containing specific labelling for specific targets hybridized in the microarray (Fig. 7). The multiplex detection is obtained exciting dyes of targets with two or more laser sources (at different wavelength) and collecting the signals by a unique CCD detector.
Fig. 7. DNA-microarray scheme.
Microarrays are used in many applications. Single-nucleotide polymorphism (SNP) arrays identify common polymorphisms associated with disease and phenotype, DNA–protein interactions and gene expression levels (by measuring the amount of gene-specific cDNA). Microarrays remain widely used in genomic research. However, variations in hybridizations are problematic, leading some people to recommend sequencing over gene expression microarrays.
Sequencing is a DNA amplification based method that overpass the limitations in genotypic
analysis related to sensitivity and specificity.
The first sequencing approach was introduced by Fred Sanger in 1970s. This technique was based on the reconstruction of a DNA target sequence by the detection of a specific dideoxynucleoside
triphosphate (ddNTP) insertion into the DNA target amplification system. The detection is performed radiographically on the polyacrylamide gel electrophoresis (PAGE) [9,10].
First, DNA target template is amplified by using 4 different mixes containing one of the 4 specific ddNTPs (ddATP, ddGTP, ddCTP, ddTTP) and the amplification reagents (polymerase, primers, dNTPs).
Then, amplification products are loaded separately in 4 wells of the electrophoretic gel. After the run, different bands on the same lane appear; in this case, the varied sizes of bands are related to the position of the ddNTP insertion (that stopped the amplification process and broke up the target sequence). Since each lane of the gel contains a specific ddNTP amplification mix, reading bands (so amplification fragments) from the smallest to the biggest, allows the reconstruction of the total DNA target sequence (Fig.8).
Sanger sequencing has been improved, getting automated and faster, thanks to the replacement of the radiographic detection with the fluorescent one (using separate fluorescent markers for each nucleotide) and the replacement of PAGE running with capillary electrophoresis (Fig.9) [11].
Fig.9. Sanger automated sequencing method; as each band of colour (caused by collections of dye
terminated fragments, on the left in figure) pass in front the detector, through the capillary tube, it creates a fluorescent signal which is reported on the final graph.
This technique, however, suffered from few inherent limitations like decreased sensitivity for low level mutant alleles, complexities in analysing highly polymorphic regions, high amount of DNA template required, and low number of DNA sequences reconstructed per time.
Thus, Roche, Illumina and other commercial manufacturers introduced several Next Generation Sequencing (NGS) technologies in order to overcome Sanger sequencing limitations.
The Roche innovation is based on the pyrosequencing method, in which the target DNA sequence is reconstructed thanks to a luminescent reaction triggered by the incorporation of a dNTP during the DNA amplification; in this case, in fact, the dNTP releases a pyrophosphate group (PPi) each time is incorporated in the polymerization process. The PPi is, then, used by the ATP sulfurylase to produce ATP in presence of adenosine 5´ phosphosulfate. ATP triggers the reaction of luciferin oxidation by luciferase, releasing oxyluciferin and photons. The light produced in the luciferase-catalyzed reaction is detected by a camera and analyzed in a pyrogram. The excess or not incorporated bases are removed by the apyrase enzyme. This process is repeated with each of the four bases until the DNA sequence of the single strand template is determined (Fig.10).
Fig.10. Pyrosequencing scheme.
The template DNA is fixed, and solutions of A, C, G, and T nucleotides are sequentially added and removed from the reaction. Light is produced only when the nucleotide solution complements the first unpaired base of the template. The sequence of amplification mixes which produce
chemiluminescent signals (thus forming the final pyrogram) allows the determination of the sequence of the target DNA [12].
Illumina method is based on the massive sequencing of a target DNA by solid-phase PCR. In this case, the DNA is first nebulized and 200 bp fragments are obtained. The fragments are, then, ligated to specific oligonucleotides adapters, at both ends, in order to be immobilized on the surface of a glass flow cell, which contains arrays of alternate primers for the solid-phase bridge PCR amplification step. DNA fragments, in fact, binds the primers thanks to the adapters, and, once anchored, create bridges by which are massively amplified [13,14]. The amplification generates clusters of copies from a specific DNA fragment (Fig. 11A).
Fig.11. Illumina sequencing method: A) clustering of 200 bp DNA fragments by solid-phase bridge PCR; B)
sequencing of clusters and fluorescent imaging.
These clusters are, then, used for the last step of sequencing, performed by adding primers on one of the ends of the molecules and by introducing specific dNTPs to the flow cell; these are modified to terminate the polymerization of the growing sequence and are labelled with specific fluorescent dyes, one for each type of bases (similarly to the Sanger automated sequencing method).
Depending on the type of dNTP incorporated, for each cycle of sequencing the system gives a specific fluorescent signal that is collected by a CCD camera and digitalized in order to obtain a fluorescent mapping of DNA fragments clusters (Fig. 11B). The Illumina read length is approximately 35 bases, but over billion reads are generated at a time.
NGS techniques in clinical research and medical diagnostics were applied for the study of cancer variants, detection of minimal residual disease, exome sequencing, detection of Single Nucleotide Polymorphisms (SNPs) and their disease association, epigenetic regulation of gene expression and sequencing of microorganism genome.
All techniques described, however, are still quite complex to perform, needing specialized laboratories and staff and are rather expensive to be used for large-scale screening.
To allow the extensive use of these molecular methods in diagnostics, scientific research is nowadays strongly focusing on the development of new technologies and devices allowing fast and low-cost DNA analysis. Therefore, there is a huge demand for methods and systems able to perform analysis of DNA in the sample-in-answer-out format, with a sensitivity comparable to that one of conventional PCR technologies and an implementation of portability, in order to move the diagnostics to decentralized environments (Fig.12).
These technologies are the so-called “genetic Point-of-Care” (PoC), identified by the National Institute of Health (NIH) as one of the major priorities for molecular diagnostics [15]. These systems must integrate and automate all steps necessary for molecular analysis such as DNA sample preparation (extraction and purification) and detection.
In the developed world, PoC technologies could help in the decentralization of diagnostics from the hospital’s core laboratory to the physician’s office. This allow massive diagnostic screening and better facing the threat of genetic and infectious diseases. Its clinical utility could be much more relevant, for example, in developing countries where infectious disease diagnosis is still a challenge due to poor clinical laboratory infrastructures and cost constraints [16]. Based on the above considerations, multidisciplinary research teams have spent great efforts over the world to develop miniaturized biosensors based on innovative technologies and new chemical strategies for DNA analysis.
So far, the detection of DNA in PoC is based on the PCR technology for in vitro genetic analysis, directly near the patient (in hospital, in the physician office, clinic, or home).
In literature, for example, various PCR based PoC have been reported for DNA detection of different pathogen microorganisms. Fernandez-Carballo et al. in 2016 presented a portable and low-cost point-of-care (PoC) system based on continuous flow PCR for quantitative detection of Chlamydia trachomatis and Escherichia coli [17]. Hsien et al. described a sequence-specific electrochemical DNA technology (E-DNA) able to detect up to 100 copies per ml of S. typhimurium by loop-mediated isothermal amplification, 10 TCID50 for H1N1 influenza virus, and 300 copies (in 50 μl) of Salmonella enterica [18]. Other research teams reported miniaturized devices based on PCR using innovative transduction methods for the detection of pathogen species such as: Escherichia coli (by using piezoelectric-excited cantilever sensors) [19]; Neisseria meningitidis (using electrochemical transduction) [20]; Staphylococcus aureus (by means of graphene oxide
based fluorescent probes) [21]; Mycobacterium tuberculosis (using surface plasmon resonance) [22]. Example of genetic SNP (Single Nucleotide Polymorphisms) application are, also, reported [23].
Following the reported examples, in my Ph.D. project I focused on the introduction of innovative genetic PoC technologies for the detection of pathogen bacterial DNA in infectious diseases. Actually, I have been working on the development and characterization of PCR-based device for sensitive and high throughput detection of specific target DNA in miniaturized boards, integrating all stuff required for the Real-Time PCR analysis.
Among all PoC platforms reported in literature, however, there is still an unsolved issue related to the experimental procedure required for detection; PCR reaction, in fact, implies high time and costs for samples analysis.
For this reason, I have been working, in parallel, on the introduction of unconventional miniaturized devices for the PCR-free detection of DNA. These methods are more advantageous thanks to the possibility, they gave, to detect molecules of a target DNA without any amplification process, that means avoiding the necessity of specialized staff, long working period and expensive kits for the DNA detection, in addition to all advantages related to the miniaturization [24, 25].
References
1. Steiner J.J., Poklemba C.J., Fjellstrom R.G. and Elliott L.F. (1995), A rapid one-tube genomic DNA extraction process for PCR and RAPD analyses, Nucleic Acids Res, 23:2569 –70.
2. Johnson D.W., Pieniazek N.J., Griffin D.W., Misener L. and Rose J.B. (1995), Development of a PCR protocol for sensitive detection of Cryptosporidium oocycsts in water samples. Appl Environ Microbiol, 61:3849 –55.
3. Sambrook J. and Russel D. (2001), Molecular Cloning: A Laboratory Manual, vol. 3, Cold Spring Harbor Laboratory Press, New York, NY, USA, 3rd edition.
4. Chomczynski P. and Sacchi N. (2006), The single-step method of RNA isolation by acid guanidinium thiocyanate-phenolchloroform extraction: twenty-something years on, Nature Protocols, vol. 1, no. 2, pp. 581–585.
5. Padhye V.V., York C. and Burkiewiez A. (1997), Nucleic acid purification on silica gel and glass mixture, United States patent US 5658548, Promega Corporation.
6. Berensmeier S. (2006), Magnetic particles for the separation and purification of nucleic acids, Applied Microbiology and Biotechnology, vol. 73, no. 3, pp. 495–504.
7. Kim J., Johnson M., Hill P. and Gale B.K. (2009), Microfluidic sample preparation: cell lysis and nucleic acid purification, Integr Biol, 1:574 – 86.
8. Southern E.M. (1975), Detection of specific sequences among DNA fragments separated by gel electrophoresis, Journal of Molecular Biology. 98 (3): 503–517. ISSN 0022-2836. PMID 1195397. doi:10.1016/S0022-2836(75)80083-0.
9. Sanger F., Coulson A.R. (1975), A rapid method for determining sequences in DNA by primed synthesis with DNA polymerase, J. Mol. Biol. 94 (3): 441–8. PMID 1100841. doi:10.1016/0022-2836(75)90213-2.
11. Maxam A.M., Gilbert W. (1977), A new method for sequencing DNA, Proc. Natl. Acad. Sci. U.S.A. 74, 560–564.
12. Ronaghi M., Uhlen M., Nyrén P. (1998), A sequencing method based on real-time pyrophosphate, Science 281, 363–365.
13. Luo C., Tsementzi D., Kyrpides N., Read T., Konstantinidis K.T. (2012), Direct comparisons of Illumina vs. Roche 454 sequencing technologies on the same microbial community DNA sample, PLoS One 7. 14. Quail M. A. et al. (2012), A tale of three next generation sequencing platforms: comparison of Ion
Torrent, Pacific Biosciences and Illumina MiSeq sequencers, BMC Genomics 13, 341.
15. Mabey D., Peeling R.W., Ustianowski A. and Perkins M.D. (2004), Nat. Rev. Microbiol., 2, 231–240. 16. Yager P., Domingo G. J. and Gerdes J. (2008), Annu. Rev. Biomed. Eng., 10, 107–144.
17. Fernández-Carballo B.L. et al. (2016), Biomed. Microdevices, 18, 34–40. 18. Hsieh K. et al. (2015), Acc. Chem. Res., 48, 911–920 and references therein. 19. Rijal K. and Mutharasan R. (2013), Analyst, 138, 2943– 2950.
20. Patel M.K., Solanki P.R., Kumar A., Khare S. and Gupta S. (2010), Biosens. Bioelectron., 2010, 25, 2586–2591.
21. Pang S., Gao Y., Li Y., Liu S. and Su X. (2013), Analyst, 138, 2749–2754.
22. Hsu S.H., Lin Y.Y., Lu S.H., Tsai I.F., Lu Y.T. and Ho H.S. (2013), Sensors, 14, 458–467.
23. Foglieni B., Brisci A., San Biagio F., Di Pietro P., Petralia S., Conoci S., Ferrari M. and Cremonesi L. (2010), Clin. Chem. Lab. Med., 48, 329–336.
24. Sébastien D. et al. (2006) PCR-free DNA detection using a magnetic bead-supported polymeric transducer and microelectromagnetic traps. Anal. Chem., 78(13):4457-64.
25. Mahadhy A., Mamo G., Ståhl-Wernersson E., Mattiasson B. and Hedström M. (2014), PCR-Free Ultrasensitive Capacitive Biosensor for Selective Detection and Quantification of Enterobacteriacea DNA, Mahadhy et al., J Anal Bioanal Tech, 5:5.
3. INTEGRATED MODULES FOR DNA EXTRACTION
The development of miniaturized devices able to perform DNA analysis is still one of the fascinating fields in biomedical research. This marries the vision of future home-made molecular diagnosis by simply using a microchip integrated into smart portable devices.
In this field, the issue of DNA preparation from biological samples is still challenging since several starting materials can be employed (blood, urine, saliva etc.) and, consequently, complex architectures and protocols are needed. Therefore, the literature reports few examples of miniaturized sample preparation devices when compared with those for DNA detection. Many of these are developed using plastic materials and include a complex microfluidic network that manages fluid movement, mixing, splitting etc [1-8] (see chapter 2). Plastic materials for integrated microfluidics have the advantage of low cost but the miniaturization, integration and the thermal properties required by some of the extraction steps (i.e. lysis) remain the main limitations.
In this chapter the technologies developed for DNA extraction and purification during my Ph.D. are described.
3.1 – Prep Disk Technology
3.1.1 – Platform Description.
In my Ph.D. project I worked, in a first step, in the characterization of the advanced Prepdisk platform (from Qiagen) for DNA purification based on magnetic beads biotechnology (Fig.1).
This technology developed in cooperation with HSG IMIT (Germany) consists of a plastic disk (Fig. 1A) integrating all steps and modules for DNA isolation from a biological sample (blood, urine, saliva, etc.). The plastic chambers in the disk, contain all buffers normally used in the conventional DNA purification kits (lysis, binding, washing and elution buffer); two more chambers are specific for the loading of starting sample (red ring in figure) and collection of final DNA sample (green ring); one chamber contains the magnetic beads.
All chambers are connected by a microfluidic system actuated by centrifuge force so that, depending on the number and speed of rotations of Prepdisk, the mixing of sample with purification buffers and the interaction between DNA and beads (adsorption mechanism, see section 2.1) can occur. The instrument used to hold and play rotations of Prepdisk is reported in Fig.1B. The main advantage related to this technique is the gain in manual skill and time required for the experimental procedure.
Fig.1. A) Prepdisk: sample loading (red circle) and elution (green circle) chamber. B) Prepdisk player.
Once loaded the sample, the Prepdisk is introduced in the player and, through a specific software (Fig.2), the protocol for DNA purification is set, defining time and speed of a series of rotation steps; each rotation step is, then, specific for each extraction step, from lysis to elution of DNA.
Fig.2. Example rotation protocol for DNA purification in Qiagen Prepdisk.
Once the protocol is completed, DNA eluate is, then, collected from the elution chamber ready for any subsequent amplification and diagnostic experiments.
To test the extraction efficiency of this technology, I analyzed the Prepdisk DNA purification yield by using a water sample contaminated with Hepatitis B virus genome (HBV) 105 copies/ml concentrated. In this case, the final DNA eluted sample has been amplified and quantified by Real Time PCR, performed by the Q3 platform, developed by STMicroelectronics [6,7,8], and cycles threshold (Ct) obtained after the amplification have been compared.
Results, reported in Fig.3, show that DNA is not totally collected in the elution chamber. There is, in fact, a Ct value of 30 for the eluted DNA which is indicative of a concentration of 103 copies/ml, as reported in Fig.3 (red curve), that is lower than the expected one of the positive control (blue curve in figure) which is 23.7, indicative for 105 copies/ml (starting concentration of HBV genome in Prepdisk).
Fig.3 - Amplification curves and cycles threshold: positive control, 105 copies/µl (blue); DNA collected by
beads sonication, 103 copies/µl (green); DNA eluate, 103 copies/µl (red).
In order to better understand this decrease of the elution yield, I collected, in parallel, the magnetic beads from the Prepdisk (after DNA elution) and sonicated them for 5 minutes, to remove DNA eventually anchored on their surface. Then, I purified, manually, the DNA from the magnetic beads, and quantified the eluate by PCR. The Ct for this DNA sample extracted by
sonication of beads was 29.6 (residual 103 copies/ml of DNA) indicating that part of the starting sample is not totally eluted with the rotations in Prepdisk.
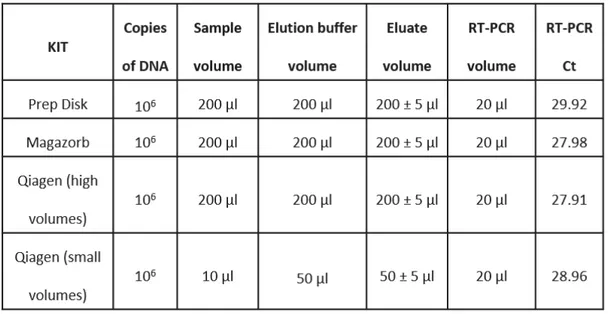
In parallel, I compared, also, the DNA yield of Prepdisk with that one from the commercial kits, using the same type and amount of sample. Results are reported in Table 1.
Table 1. Extraction efficiencies comparison.
Data, shown above, led us to suppose that notwithstanding time and automation of DNA purification have been achieved, material and chemistry adopted by Prepdisk for purification is still not, totally, efficient because of the high loss of starting DNA.
For this reason, in a second phase, I worked on the implementation of this DNA purification technology by the development of a new platform that reproduced all features from Prepdisk, but improved by the integration of new and more performant modules for DNA isolation.
3.1.2 – Functional test of hybrid disk P1B.
disk-assembled considering the integration of the fluidic system and chambers, typical of Prepdisk, and the chip for the amplification and quantification of DNA eluate at the end of the purification procedure.
In this sense, the functionality of the fluidic system on disk and player for rotation have been tested using the Prepdisk player as reference (Fig.1B).
Purification protocol by rotation has been set and split by the P1B player software, passing through the lysis, binding, washing, beads transfer and elution of DNA; in this way was possible to analyse step by step:
· Alignment of beads with magnets.
· Movements of beads among the disk chambers. · Fluidics of sample and DNA to be extracted (Fig. 4-1)
· Fluidics of purifications buffers, from sticky packs breaking up to the filling of the chambers (Fig. 4-2, 4-3, 4-4, 4-5)
Fig.4. DNA-disk platform (A) Hybrid disk: sample prep + polycarbonate disk + Real Time PCR chip
(yellow ring). (1) Sample loading chamber; (2) lysis chamber; (3) washing chamber I; (4) washing chamber II; (5) DNA elution and collection chamber; (B) P1B player and software.
For the functional test, in order to visualize the sample position inside the disk, 0.2 ml of an eosin sample diluted in water has been used. Alignment of beads has been verified comparing the magnets position in the lid of P1B with that one in the lid of Qiagen disk player.
In the above instrument, the exact distance between the two magnets and between the magnets and the crankshaft was measured by the centre of the disk holder (Fig. 5A). The detected positions have been meticulously reproduced on P1B magnets, optimizing the position of one magnet along the x/y axes and both along the z axis (Fig. 5B).
Fig.5. Magnets position: A) Qiagen disk player; B) P1B disk player.
In parallel, in the prep disk player the positions of the magnets have been recorded step by step through a normal extraction protocol, interrupting it in several steps to observe the disk (Fig.6).
Fig.6. Movements of magnetic beads in sample prep (Qiagen disk player); the red ring shows the
position of the beads during the various steps of the extraction protocol.
A first magnet displacement test was performed on the P1B hybrid disk. Results showed that the alignment problem persist despite the applied changes; the beads were in the chamber 2 during the entire extraction protocol as they were not properly aligned with the magnets (Fig.7).
Fig.7. Movements of magnetic beads in hybrid disk (disc player P1B): the red ring highlights the actual
position of beads at the end of the protocol; the green ring indicates the expected position.
This was related to a problem of rotation angles offset between sample prep in Prep Disk and hybrid disk in P1B, with a deviation of 19°. Fixed the scrap, the problem of beads-magnets alignment, in a subsequent rotation test, was solved; the displacement of the beads among the disk chambers perfectly reproduced the Qiagen player reference (Fig. 8).
Fig.8. Movements of magnetic beads in hybrid disk (P1B disk player); yellow ring highlights the position
of beads during all protocol steps.
Correction of angular offset was made considering also the orientation by which the sample prep disk was assembled to the polycarbonate disk. On other hybrid disks produced later, in fact, any slight variation in this sense affected the angular offset and, consequently, the alignment of the beads with the magnets and their movements inside the disk.
The extraction buffers, during rotations, were distributed irregularly leaving the 3 collection chambers (already described in Figures 4-3, 4-4, 4-5) almost empty.
than that of Qiagen due to higher thermal dispersion; this caused the prolongation of the lysis step from 1 to 6 minutes. We then repeat step 14 of the extraction protocol by removing the heating phase (thus bringing it back to 1 min effective); but also in this case the buffers didn’t distribute correctly (Fig.9).
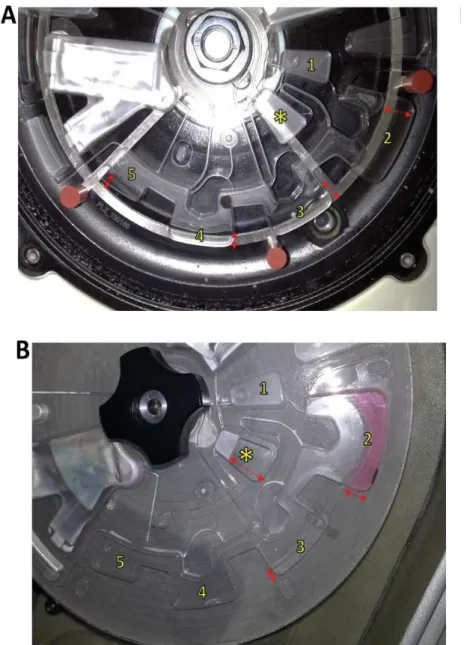
Fig. 9. Irregular fluidics of extraction buffers: A) Qiagen; B) P1B. Red arrows indicate the level of fluids
inside the extraction chambers (2-3-4-5) and inside a pre-chamber (*).
As shown in figure, despite the sample flowed correctly from room 1 to 2 (lysis), extraction buffers irregularly distributed and accumulates in an intermediate pre-chamber (Fig.9B*) leaving the
chambers 3-4-5 (respectively washing 1-2 and elution) still partially empty, as indicated by the red arrows in Fig.9B.
Subsequently, we focused on the difference in weight between the sample prep (6.18 g) and prep assembled on polycarbonate (44.7 g). We have assumed that this difference could affect the acceleration of rotations and, consequently, the fluids dynamics. Therefore, we modified step 4 of the protocol, relating to sticky pack breaking and fluids pumping inside the chambers, increasing the speed from 60 to 70 Hz; applying this modification we, then, repeated the test.
In this case, the buffers have been distributed correctly, filling the extraction chambers in the right way and with the right volumes (Fig.10B).
Fig.10. Correction of extraction buffers fluidics: A) Qiagen; B) P1B after the modification of the step 4 of
protocol. Red arrows indicate level of fluids inside the extraction chambers (2-3-4-5) and inside a pre-chamber (*)
3.2 – Silicon pillars Technology.
Silicon is a very appealing material in terms of DNA purification. It combines good physical aspects for sensing, such as low heat capacity, good thermal conductivity, and possible patterned structures to increase the surface–area ratio, with consolidated production technologies and industrialization processes at high volumes. Additionally, it allows the integration of electrodes and microelectronics circuitry that imprint the so-called “intelligence on board”.
When the DNA to be extracted is viral or bacterial, these genomes are present in very low concentration in the starting sample compared to the co-present human DNA. In this case, therefore, the purity of the extracted material must be high and, operatively speaking, after the lysis, two additional steps of purification and concentration are mandatory. Viral and bacterial DNA extractions are usually achieved by Solid Phase Extraction (SPE) based on capturing the DNA present in the lysed solution on solid surfaces (purification step) and then eluted with appropriate buffers (concentration step) [9].
SiO2 is the most used solid surface since it is well-known to bind DNA in the presence of chaotropic salts and ethanol [10]. Most of the current commercial extraction kits use silica in the form of micro-filter mounted in a plastic column or beads that are moved by external magnets. Sometimes silica is derivatized with positive amino-groups to bind the negatively charged DNA more effectively than naked silica. However, the technical features (i.e. porosity, surface-to-volume ratio, etc.) of these systems are not explicitly disclosed since they are covered by trademarks. From the prospect of achieving a chip for DNA extraction based on SPE on the silica surface, in this project, I worked on the development and characterization of a new miniaturised microfluidic module, that is a biofilter (BF) device based on microfabricated silicon micropillars, that merges the advantages to increase the surface within the capture area with the possibility to be monolithically integrated into a miniaturized device.
The characterization was focused on the analysis of efficiency to catch and release DNA. Also for this experiment, I used HBV (Hepatitis B Virus) clone water solution at a concentration typical of real samples for infectious diseases (105 copies) as analytical samples. The device has been developed in three different geometrical structures, so that the effect of the Surface-to-Volume Ratio (SVR) on the extraction efficiency can be investigated. The total extraction performance was also evaluated and compared with those of commercial kits.
Finally, the device exhibiting the best extraction efficiency was tested in combination with a silicon integrated real time PCR amplification chip as a preliminary step towards the development of genetic point-of-care devices.
3.2.1
–
Geometrical features of the microstructures
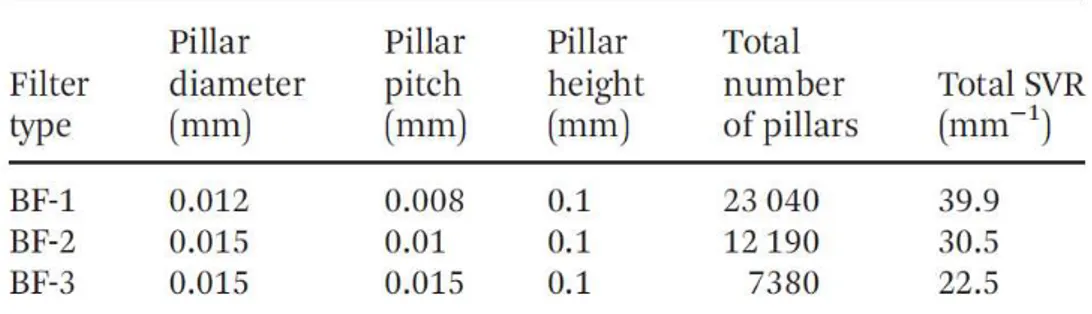
The whole biofilter system is reported in Fig.11. One of the key parameters for effectively capturing the DNA in SPE using the pillar approach is the surface-to-volume ratio (SVR): the higher the value, the larger the surface available for capture under the same chemical conditions (ionic force, pH, etc.) of the employed solutions. In order to gain more insight into the aspects related to our BF device, we developed three pillar microstructures generating three types of extraction chips (BF-1, BF-2 and BF-3) featured by different SVR characteristics. Fig. 12 illustrates a typical image of the fabricated BF microdevice (Fig.12a) and the structural features of the pillars areas in the three device typologies (Fig.12b and c). In particular,
Fig.12b clearly highlights the three kinds of packing pillar arrangements differing from each other in pillar diameter (12 μm in the case of BF-1 and 15 μm for both BF-2 and BF-3) and inter-pillar distance (8 μm in the case of BF-1, 10 μm for both BF-2 and 15 μm for BF-3).
Fig.11. a) Scheme of the silicon pillars based biofilter; b) scheme of the “sandwich” model of biofilter
Fig.12. (a) Image of a microfabricated BF device (pillar active area is highlighted); (b) optical image (50×) of
BF-1, BF-2 and BF-3 pillar areas (top view); (c) SEM images of typical pillars (BF-3 device).
It can be also noticed that the pillars are arrayed in a close-packed arrangement in order to maximise the packing feature and to increase the surface area as much as possible. In light of this, each microstructure contained a different number of pillars from about 23 000 in the case of BF-1, to 12 000 for BF-2 and to 7300 for BF-3. The pillars are cylindrically shaped as shown in the SEM image reported in Fig.12c.
A system of breakwater, located before and after the pillars array, regulates the input (Fig.13A) and output (Fig.13B) of sample flow.
Fig.13. Breakwater system upstream (A) and downstream (B) the pillars array.
The above discussed geometrical features yield different surface-to-volume ratios (SVR). As summarised in Table 1, the device exhibiting the highest SVR value is BF-1 (39.90 mm−1) while BF-2 and BF-3 exhibit lower values equal to 30.11 mm−1 (BF-2) and 22.50 mm−1 (BF-3), respectively. It can be noticed that the major contribution to the total S/V comes from the active pillar area. Such an area contributes to the total surface of the BF chip, about 78% in the case of BF-1, 71% in the case of BF-2 and 61% in the case of BF-3. On the basis of this finding, we can reasonably attribute
3.2.2 – Effect of Surface-to-Volume Ratio and ionic force on extraction performance
The extraction performance of the BF devices was measured using synthetic DNA clone of the HBV genome at a concentration close to that found in real samples (105 copies/µl). This clone was selected as an analytical model to assess the extraction performance before testing real samples (such us blood, urine, and saliva etc.) that include the so-called “bias” interference [11].
Experimental detail on reagents and protocol adopted for the tests are reported in the
Experimental Part section at the end of this chapter.
We firstly evaluated both the binding and elution capability of the above-described microstructures. After sample loading, the unbound, washed and eluted DNA was measured by real time PCR on the tube.
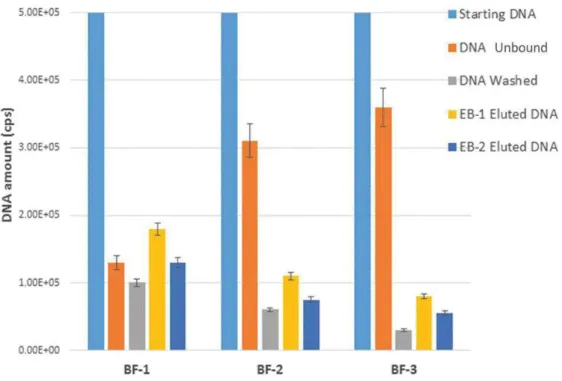
Fig.14 illustrates the comparison of the obtained data in terms of DNA amount (total cps) for the three typologies of BF devices. It can be clearly noticed that the DNA binding capacity increases with the SVR of the device. The BF device exhibiting the highest SVR (BF-1) also shows the highest values of captured DNA. This latter is defined as the difference between the total starting DNA (blue bar) and the sum of total unbound (orange bar) and total washed DNA (grey bar). In agreement with this, the calculated binding efficiency (Eq 1) corresponds to 54% for BF1 (SVR 39.9 mm−1) versus 26% for BF-2 (SVR 30.5 mm−1) and 22% for BF-3 (SVR 22.50 mm−1). This is expected on the basis of the increasing number of potential binding surface sites upon SVR increasing.
Cstarting = starting total amount of HBV clone; Cnot-bound = not-bound amount of HBV clone after flowing into
the BF devices.
Even if the trials were performed on the uncoated SiO2 surface, a remarkable amount of DNA was captured: about 1.8 × 10⁵ cps for BF1, 1.1 × 10⁵ cps for BF2 and 8.0 × 10⁴ cps for BF3 in the case of
for BF3 in the case of EB2 (blue bars of Fig.14). This is due to the presence of silanol groups on the surface formed during the chemical treatment with NH4OH : H2O2 : H2O. These groups probably induce the formation of hydrogen bonds between the surface and the skeleton of the DNA molecule in the presence of high ionic strength solutions. Further mechanistic investigations are currently under way in our laboratories in this concern.
Fig. 14. - Binding and elution profiles of BF devices.
It should be emphasized that the binding capacity occurs without the employment of chaotropic salts or ethanol that are well-known inhibitors of the PCR or other molecular techniques and make the design of miniaturized systems more complex (vide supra).
In terms of elution capability, we observe that water (EB-1) works better than the low-ionic strength buffer EB-2. In fact, the calculated elution efficiency percentage (Eq 2) in the case of water was about 50% higher than EB-2 buffer (75% water versus 50% EB-2). This can be tentatively attributed to the better ability of water to make the electrostatic interaction between DNA and surface hydrating DNA molecules thermodynamically unstable.
Finally, we calculated the total extraction efficiency of the three types of BF devices by means of Eq 3 and compared them with those related to two commercial state-of-the-art kits, Magazorb and Qiagen based on magnetic beads and silica filter, respectively.
Celuted = eluted amount of HBV clone; Cbound = amount of HBV clone bound into the BF [Cstarting − (Cnot-bound +
Cwashed)];
Celuted = eluted amount of HBV clone; Cstarting = starting total amount of HBV clone;
Fig.15 illustrates the obtained results. It is noteworthy that BF-1 shows the best extraction performance achieving about 36% efficiency using water as elution buffer versus 22% for BF-2, 16% for BF-3 (blue bars) and 20% for both Magazorb and Qiagen (green bars). Using EB-2 as elution buffer (orange bars), the final extraction efficiency of BF-1 is comparable with those of the commercial kits, while those of BF-2 and Bf-3 were slightly lower. The latter finding is in line with the previous results discussed above for elution efficiency. As far as the better result displayed by BF1 is concerned, we believe that a probable synergy between the filter structure and the experimental protocol adopted may play a key role.
(Eq 3) (Eq 2)
Fig.15. Comparison of extraction efficiencies of BF devices and commercial kits.
3.2.3 – Extraction and Real-Time amplification on the chip
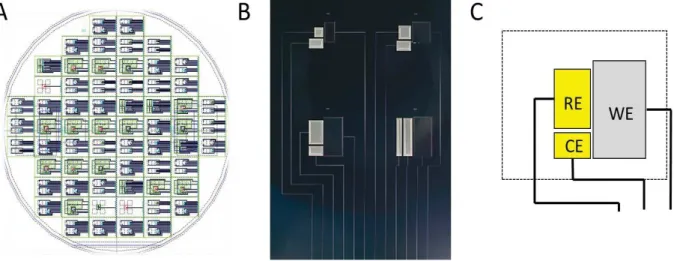
As a preliminary step towards the development of a genetic point-of-care device, we evaluated, in a semi-integrated configuration, the real genetic testing using the biofilter exhibiting the best extraction efficiency (BF1) in combination with a silicon integrated real time PCR amplification chip. In order to be compliant with the analytical procedure for quantitative analysis, the microchip has been designed to feature six reaction chambers to host both positive (Ctr+) and negative (Neg) controls and the sample. Furthermore, the microchip contains integrated temperature sensors and heaters to perform a one-step Real Time PCR process quickly [12–14]. Fig.16a illustrates the scheme of the system configuration (the BF-1 extraction chip combined with the real time PCR chip) employed for this study. The on-chip amplification results on the extracted sample by BF1 are shown in Fig.16b.
Fig.16 (a) System configuration for semi-integrated genetic PoC test: extraction step with BF1 filter and real
time PCR with a microchip; (b) semi-integrated experiment results (the inset reports a fluorescence image captured during the PCR).
The Ct values for both the starting (5 × 10⁵ cps) and the BF1-extracted solutions were 22.4 and 26.3, respectively. The final concentrations of these solutions were calculated by the calibration curves embedded into the chip. Specifically, it was obtained by means of the Ct values exhibited by the three positive controls (1 × 10⁶, 1 × 10⁴ and 1 × 10³ cps) equal to 19.4, 23.9 and 31.0, respectively (the negative control gave no results as expected). The calculation led to values of about 1.9 × 10⁵ for the starting solution and 7.8 × 10⁴ for the extracted solution. Based on these results, the extraction efficiencies calculated by Eq 3 correspond to about 40%. This is fully in
agreement with the results obtained previously in the analytical characterization of BF1, and confirms the best extraction performance with respect to the commercial kits. Furthermore, our results indicate that technology that uses micropillars in combination with an integrated real time PCR microchip can be very appealing for future developments of a fully-integrated genetic PoC device able to perform molecular genetic analysis close to the patient.
Experimental Part
3.2 – Silicon pillars Technology.
Materials.
Stock solutions of a HBV clone complete genome (ref product 05960116), consisting of the HBV genome 3.2 kbps and a plasmid PBR322 vector 3.8 kbps in TE (Tris 10 mM, EDTA 1 mM, pH = 8) and the HBV real time PCR kit (ref product FO2 HBV MMIX KIT 48) were purchased from Clonit and used according to the Instructions for Use. Tris-HCl, EDTA, TE buffer and sterile deionized water were purchased from Sigma and used as received.
Silicon biofilter fabrication.
The BF devices (30 mm × 13 mm in size) consist of a microfabricated corner-shaped silicon channel (linear length 20 mm, large 1.8 mm) in which silica coated pillar arrays were etched in an area (5 mm long, 1.8 mm large) located in the middle of the channel. Three series of pillars arrays with a size of 5 × 1.8 mm2 (BF-1, BF-2 and BF-3) were fabricated varying the pillar diameter (from 12 to 15 μm) and the pillar-to-pillar distance (from 8 to 15 μm). The height of the pillar in all three arrays was 100 μm. The inlet and outlet ports of the channel are circular holes, 4 mm in diameter. Table 2 summarizes the geometrical details of all BF types.
The microfabrication of these devices was carried out by a standard VLSI (Very Large Scale Integration) technology based on multi-step processes. The first step was the cleaning of the wafer with a solution of H2O2 : H2SO4 (1 : 1) followed by washing with deionized water and drying at 90 °C. After that, the silicon wafer was coated with a positive photoresist layer (KrF (248 nm) purchased from FujiFilm) of 4.7 μm by a spin coating process (1000 rpm, for 1 min). UV light irradiation was performed through a photomask, and the development process with TMAH (tetramethylammonium hydroxide)-based solution (OPD4262 purchased from FujiFilm) was carried out. After that, the microstructures were fabricated by silicon etching using a standard Bosch process (United States Patent 5501893) forming silicon channels (18 mm long × 1.8 mm large), the active pillar areas (2.5 mm long × 1.8 mm large) and the inlet and outlet holes (4 mm diameter), respectively. A next stripping step by oxygen plasma was carried out to remove the residual photoresist. A subsequent final dry oxidation process at 1000 °C with O2, and H2O gas (rate 1 cm s−1) was carried out, leading to a surface silicon oxide layer of 320 nm in thickness. This was measured by Scanning Electron Microscopy (SEM) analysis obtained using a high-performance Schottky field emission, LEO 1550 SEM. The instrument was operated at 5 kV in a secondary electron imaging mode. The silicon part was then sealed with a glass slide (0.5 mm thickness) by a standard anodic bonding process producing the final microchip. The internal volume of the device was 5 μL. The microstructures of the microfabricated devices were imaged by both optical microscopy (OLYMPUS SZX16) and SEM.
Fluidics.
To test the BF devices an appropriate fluidic connection was fabricated. A PDMS layer (3 mm thickness) was employed to cover the device from both sides. A final polycarbonate rigid holder (5 mm thickness) was mounted on to guarantee the structural rigidity and the ease of handling the
device. Both PDMS layers and the polycarbonate holder contained holes that are aligned with the inlet and outlet ports of the silicon device. The fluid was actuated into/out of the devices by applying/removing pressure through syringes mounted on top of the inlet and outlet ports (Fig.11).
BF chemical treatment.
Before using, the BF devices were chemically treated by flowing through their channel a solution of NH4OH : H2O2 : H20 (5:1:1) preheated at 60 °C for 5 min. Then channel rinsing was carried out 3 times with deionized water. Finally, the devices were dried under nitrogen flowed through the inlet port.
Extraction experiments and BF functional characterization.
DNA binding/elution experiments were performed by using a starting solution containing 105 copies/μL of HBV complete genome dissolved TE buffer. A 5 μl volume of this solution (starting solution) was loaded into the BF channel through the inlet port and incubated for 10 min at room temperature. The solution was then recovered by aspiration from the outlet port (not-bound solution). A washing step with 10 μL of TE buffer was then carried out. The final elution step was executed by flowing 5 μL of elution buffer.
Two types of elution buffers were tested: (EB-1) water (EB1-elution solution); (EB-2) Tris-HCl 10 mM, EDTA 1 mM at pH = 8.0 (EB-2-elution solution). All experiments were performed at room temperature. The recovered samples (not-bound solution, EB1-elution solution and EB2-elution solution) together with the starting solution were quantified in terms of HBV clone concentration by using real time PCR. The experiments were performed on an AB7500 Thermo-Cycler. 5 μL of the above-mentioned solutions were added to 20 μL of a HBV kit master mix. The PCR thermal cycling