__________________________________________________________________________________________________________________________________________________________________________________________________________________________ ____________________________________________
____________________________
Dear readers,
In this sixth issue of our quarterly newsletter ‘Inequality Matters’, we specifically focus on Latin American countries (LACs) with many respects. First of all, LIS is excited about its longest data series for Latin America – Chile comes with 12 new micro datasets (CL90-CL15) added to the LIS Database. In a short data highlight, Louis Chauvel explores the Chilean data and exemplifies the quite unique structure of the Chilean income distribution.
Latin America is also strongly covered by our first Inequality Matters article by Laura Policardo, Lionello F. Punzo, and Edgar J. Sanchez Carrera, who argue that the changes in income inequality are a result from several forces often operating in distinct directions, with GDP having a little or no effect on them, thus, contradicting the argument of the Kuznets Curve. Carmen Petrovici looks at the elderly in Paraguay – the article in the Highlights section explores the low coverage of the contributory pension system and the recently introduced non- contributory assistance programs for the elderly.
In the second Inequality Matters article, Andrej Cupak, d’Artis Kancs, and Pavel Ciaian focus on immigrant-native wage gaps in 11 high-income OECD countries. Using the LIS data, the authors reveal a first snapshot of huge cross-national variation with respect to the magnitude of immigrant-native wage gaps.
Our Highlights also cover a short study by Nishant Yonzan, Branko Milanovic, Salvatore Morelli, and Janet Gornick on comparing measurement differences in income in the top income decile between survey data and tax data for the United States. Piotr Paradowski, Teresa Munzi, and Jörg Neugschwender put the fairly good economic growth in Poland in comparison with Germany. The authors are exploring how Poland is performing in terms of inequality levels, poverty and wage growth. The second LIS/LWS Users Conference was dedicated to the legacy of Tony Atkinson – Carmen Petrovici shares some impressions of the conference which was held on May 3-4, 2018. Enjoy reading! Jörg Neugschwender, editor
Inequality Matters
1 Unsustainable inequality? Empirical evidence for Latin American countries
by Laura Policardo, Lionello F. Punzo, and Edgar J. Sanchez Carrera 4 Immigrant-native wage gaps: evidence from the LIS Database
by Andrej Cupak, d’Artis Kancs, and Pavel Ciaian
Working Papers & Publications
7 Focus on ‘The persistence of the gender earnings gap: cohort trends and the role of education in twelve countries’
by Eyal Bar-Haim, Louis Chauvel, Janet Gornick, and Anne Hartung 7 Recent LIS/LWS working papers – publications
Data News
8 Data releases and revisions 8 Data release schedule
News, Events and Updates
15 LIS Summer Lecture 201815 Call for papers: ECSR Thematic Workshop
15 Call for papers: 13th International Conference of the AFD 15 Research Agreement with the AFD
15 MoU with the Economic Research Forum (ERF)
16 Workshop on “Harmonization of Household Surveys, Fiscal Data and National Accounts” at the Paris School of Economics
16 Inequality by the Numbers - 2018
Highlights
9 A new step in the understanding of extreme inequality dynamics: Chile comes with 12 waves 1990- 2015 by Louis Chauvel
10 Comparing top incomes between survey and tax data: US case study by Nishant Yonzan, Branko Milanovic, Salvatore Morelli, and Janet Gornick
11 Elderly in Paraguay – a vulnerable group by Carmen Petrovici
13 Catch me if you can – a comparison of Poland with Germany by Piotr Paradowski, Teresa Munzi, and Jörg Neugschwender 14 The legacy of Tony Atkinson in inequality analysis
Highlights of the 2nd LIS/LWS Users Conference by Carmen Petrovici
Contents
www.lisdatacenter.org/newsletter
Inequality Matters, LIS Newsletter, Issue No. 6 (June 2018)
Interested in contributing to the Inequality Matters policy/research briefs? Please contact us:
Inequality Matters
Inequality Matters
LIS Newsletter, Issue No. 6
__________________________________________________________________________________________________________________________________________________________________________________________________________________________ ____________________________________________Unsustainable inequality? Empirical evidence for Latin American countries
Laura Policardo , Italian Ministry of Economy and Finance; Lionello F. Punzo , DEPS Siena University and INCT/PPED at UFRJ (Brazil);
and Edgar J. Sanchez Carrera , DESP University of Urbino Carlo Bo
Disclaimer: Opinions expressed in this publication are those of the authors and do not necessarily reflect the official opinion of the Italian Ministry of Economy and Finance.
Introduction
Seminal literature studies the relationship between inequality and economic growth. More than fifty years have passed since the classic works of Lewis and Kuznets, speculating about the causal link between them. The earliest studies can be connected with contemporaneous Kaldor (1956, 1957), and later with Stiglitz (1969). In general terms, inequality is claimed to favor growth by providing incentives by promoting both savings and investment because rich people save a higher fraction of their income and thus for accumulation, innovation and entrepreneurship (Lewis, 1954; Kaldor, 1957). Not all scholars share the opinion, however. Some claim inequality to be harmful for growth as it deprives the poor of the ability to stay healthy and to accumulate human capital; it may generate political and economic instability that cuts down investment, and finally it may impede social consensus. Benhabib (2003) finds the inequality/growth relationship to be generally nonlinear.
Inequality matters for poverty, matters for growth, and matters in its own right. Greater inequality is a significant factor behind crime, social unrest and violent conflict. Hence, this paper revolves around some big questions (that can only be tangentially treated) such as: How much inequality is too much?
In this connection, several authors have pointed out that countries with high-income inequality, experience an equally great pressure for redistribution1. However, evidence is not clear-cut, only part of the ambiguity stemming from the fact that many studies are forced to using imperfect proxies for redistribution. Still, this is a key concern lying in the background motivations of our work. We argue, e.g., that unequal income distribution may result into an unstable socio-political environment, and high levels of inequality would tend to be socially unsustainable.
In fact, this article will show that the existence, as it emerges from an analysis of a set of Latin American Countries (LACs), of a threshold level of income inequality such that income inequality (pre-) determines its own dynamics and induces reversal dynamics. We believe our research to be the first attempt in the literature to show such a result.
LACs have specific characteristics that motivate the choice of our sample. A known peculiarity is that they represent an area with the greatest unequal distribution of income, and for this very reason they are “outliers”' in a cross-country distribution (see e.g. Palma, 2011) One more stylized fact of LACs is that main inequality indicators have decreased over the last decade (CEPAL 2010, 2011), whereas they had dramatically increased during the 1980s and '90s. Trying to understand the determinants of such a change is challenging: this change of dynamics does not seem to be based on a change in fundamentals.
Why LACs?
As briefly indicated in the introduction (and, at length, reviewed in previous contributions), the relationship between growth and inequality has been discussed within two distinct frameworks. More recently, it has made its appearance within the growth approach, where its stability and directional causality were questioned, basically without generally accepted conclusions. On the other hand, originally it had emerged within the framework of development theory (being associated with Simon Kuznets, and his famous Kuznets Curve). The KC posits causality from per capita GDP (pcGDP) to a measure of income concentration (most often the Gini coefficient) together with a nonlinear functional relation describing a process of stages of growth first with increasing which is followed, after reaching a turning point in pcGDP, by diminishing income concentration. In cross-section analyses, such a curve with an inverted-U graph, appears recurrently, one way or another. Often, the literature has raised the fundamental question of its very existence: e.g., Palma (2011) has shown a horizontal distribution of developing and developed countries in 2005, arguing that a KC could be recovered only by adding the LACs, even though the latter are obviously outliers. This fact partly explains the special attention for LACs in this article.
On the other hand, some raw data for several LACs seem to support well that income inequality has first increased, along low levels of income, to then decline once reached a certain pcGDP level. However, the latter largely varies across countries, whereas the KC literature tries to estimate a common and punctual switching value. Thus, this raises our key question in this respect: is it really pcGDP that - beyond a certain level - induces income inequality to decrease after an often long increase?
The literature generally agrees that the high-income inequality afflicting Latin America for centuries has its roots in the concentration of land, assets, and political power in the hands of a privileged few inherited from the colonial era. This would have led to developing institutions that, well into the 1980s and 1990s, perpetuated the privileges of small agrarian, commercial and financial oligarchies. For the last quarter of the twentieth century, Latin America suffered low growth, rising inequality, and frequent financial crises (CEPAL, 2010; Lopez-Calvaa and Lustig, 2010). Although poverty rates clearly decreased in the last decade, in most countries 15% of the population who got out of poverty, has living standards just above the minimum threshold and suffers a constant risk of new social decline; meanwhile, the richest 10% own about 50% of national income (CEPAL, 2011). Extreme inequality shows up not only in terms of income and wealth, but also in a disparate access to land and essential public services such as education, health and social security. Women, children, the elderly and certain ethnic groups are particularly disadvantaged, an impairment that is a structural issue in Latin America, as access to positions and social goods represents permanent, consolidated constraints spanning over generations.
Such persistence of the extreme social inequality is even more striking especially because, throughout its often tormented history, a variety of different development models have been implemented in the region, at times, also elaborated instances associated to a welfare regime.
Burchardt’s (2010) “Latin American Paradox”, i.e. the persistent convergence between democracy and social inequality even in periods of economic prosperity, is often attributed (though the position is also questioned) to political and institutional “defects”, as well as to insufficient resources devoted to welfare.
At any rate, between 2002-10, inequality, at least as measured by the Gini coefficient, fell and, by 2010, the region had returned to levels of inequality of pre-liberalization, i.e. of early 1980s. Such a drop appeared to be permanent, for inequality continued to fall even during the crisis of 2009-12. The exceptionality of such dynamics is exposed by the fact that during the 2000s no other region experienced a comparably sizeable and generalized decline of inequality (Cornia, 2014).
In the 2000s, Latin America appears to have entered a new stage of the political cycle. In several countries, new Administrations came into power promising a more active role of the State in the economy and to implement ambitious redistributive policies. Besides the rhetoric, some governments did engage in a more active role in the labor market, widened the scope and coverage of social policy, nationalized enterprises, intervened in some of the markets, and subsidized certain bundles of goods and services. It is very likely that these measures had equalizing results, still more research is needed for a complete assessment of their effective impact on the income distribution, the factual progressiveness of the subsidies introduced, and their long-term consequences.
In other words, there may be many plausible factors behind the fall in inequality in the LAC region, e.g. (i) employment growth, (ii) a change in relative prices, (iii) realignments after reforms, (iv) realignments after macro shocks, (v) cash transfer programs, and (vi) increased concerns for inequality.
Thus, we would be arguing that the changes in income inequality sprung up from several forces often operating in distinct directions, with GDP having a little or no effect on them. In particular, we are going to conclude that high levels of income inequality are socially and politically unsustainable. It is this hypothesis that we test for 13 of the Latin American countries.
The Econometrics
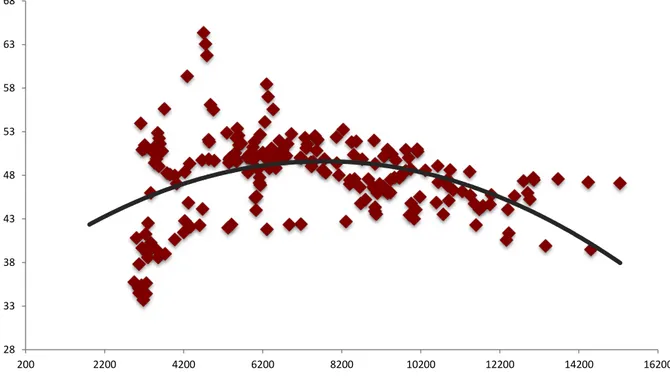
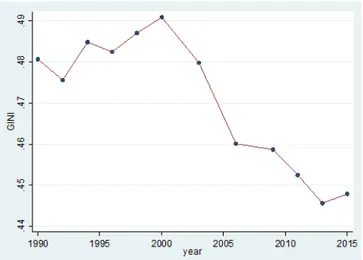
Countries considered in our sample are: Argentina, Brazil, Chile, Colombia, Dominican Republic, Ecuador, El Salvador, Guatemala, Honduras, Mexico, Paraguay, Peru and Trinidad and Tobago. As in any empirical analysis, it is desirable to have a database of acceptable quality that allows comparisons both between countries and over time. Data on income inequality has generally been unevenly distributed among nations and over time, which has led to using only a subset of the data or some form of interpolation. Especially, the effect of income inequality on long run economic growth has remained an open question mostly due to insufficient data on income distribution. Fortunately, in continuing contributions since 2011, Solt has gathered data for the Gini-index that has a consistent, long time series for several countries. Thus, our inequality measure will be the Gini index, calculated on the per capita family income. The path of inequality in most LACs has been upwards but, once reached the first half of the 2000s, it turned to decrease. Hence, the downward tendency in Gini values from the beginning to the mid 2000 years could be explained by the existence of a “turning point'”. Figure 1 plots an example of the data used, over the period 1970-2011, for this relationship “Gini vs GDP per capita” for a set of six LA countries: Argentina, Brazil, Chile, Colombia, Mexico, Paraguay. It can be noticed that an inverse u may exist, so our aim in what follows is to statistically test its significance.
Source: Own elaboration. GDP per capita (in constant 2005 U.S. dollars PPP) from The Penn World tables 8.0 for years 1970 through 2011. Income inequality, measured by the Gini index. From The Standardized World Income Inequality Database (Solt, 2014), http://myweb.uiowa.edu/fsolt/swiid/swiid.html. From this database we use the variable called gini_net, which is an estimate of Gini index of inequality in equalized (square root scale) household disposable income, using Luxembourg Income Study data as the standard. Years considered: 1970-2011.
28 33 38 43 48 53 58 63 68 200 2200 4200 6200 8200 10200 12200 14200 16200
Figure 1. Gini index (y-axis) vs GDP per capita (x-axis) for a panel of LA countries (Argentina, Brazil, Chile, Colombia, Mexico, Paraguay)
Inequality Matters
LIS Newsletter, Issue No. 6
__________________________________________________________________________________________________________________________________________________________________________________________________________________________ ____________________________________________We performed tests to check for non-stationarity. Both levels and first differences of the Gini index of income inequality are stationary according to various tests.
We used a log transformation of the macroeconomic variables, which provides a better fit in the class of nonlinear models. Then, a threshold model is estimated using a panel fixed effect (following Hansen (1996, 1999, 2000)). By estimating it for different values of a parameter 𝐺𝐼𝑁𝐼∗, chosen in ascending order, the latter’s optimal values obtained by finding such a value that minimizes the residual sum of squares (RSS) of the regression2 . Parameter 𝐺𝐼𝑁𝐼∗ represents the threshold level such that the relationship between the current variation of income inequality (i.e. today) and past inequality is given by:
• At Low inequality: 𝛽1; and • At High inequality: 𝛽1+ 𝛽5
Table 3 (Policardo, Punzo and Sanchez Carrera, 2018) reports the main results of the threshold regression. These are:
1. Below a Gini = 44, neither income nor the previous values of Gini index are able to explain variations in income inequality today. 2. Estimation finds a threshold around a Gini value equal to 44,
beyond which an increment in past levels of Gini implies a negative variation of Gini today.
3. Beyond Gini = 44, per capita GDP and square per capita GDP remain not significant in the determination of ∆𝐺𝐼𝑁𝐼, and past values of Gini becomes significant in explaining negatively variations in actual levels of income inequality.
Then, it seems that the dynamics of economic inequality is explained by itself, with a turning point of inequality around a Gini level of 44, while per capita GDP seems to have no statistically significant effect on such dynamics.
Conclusion
Our findings are best to be read against established (e.g. Kuznets’ own) and more recent research. The analysis developed by the former sees economic growth to affect income inequality and it links such relationship to a theory of the stages of economic development. Kuznets’ argument, recall is based on the idea that economic growth is a process strictly associated with the industrialization process of an essentially rural economy. The average incomes earned in the two sectors being different, the transfer of labor from the rural to the industrial sector would reduce inequality. Then, for the lesser-developed countries, the relationship between inequality and development is positive, though, with the level of per capita GDP increasing along with the industrialization process. The correlation with income concentration would turn out to be negative. This result has been later confirmed by the estimation of an augmented Kuznets curve, thus confirming also the existence of such an inverted-U relation. We have extended such a model with the inclusion of a human capital-related variable (Human capital index (HC), from the Penn World tables 8.0, for years 1970 through 2011).
Rejecting the existence of the KC, Palma (2011) shows that more than 80% of the world countries have a Gini index not far from 40, despite huge differences in their development levels. Countries exhibiting the “inverted-U” behavior would be in Latin America and South Africa. The outlier nature of these countries is crucial for testing the “inverted-U” hypothesis: were both these regions excluded, or (more appropriately) were they controlled by a dummy variable, the “inverted-U” hypothesis would no longer appear. We looked at LACs for a confirmation of Palma’s conclusions, though we came to an altogether different explanation.
Maybe, our results accommodate Piketty’s view that capitalism would be geared to favor the wealthy ones, for the wealth of the latter increases faster than the incomes of the workers. However, history would also show how: “capitalism automatically generates arbitrary and unsustainable inequalities that radically undermine the meritocratic values on which democratic societies are based”. In fact, our detected turning point in income inequality exhibits the unsustainability of levels of inequality that are perceived to be excessive, one of the key questions mentioned above.
Future research should concentrate on understanding the different cultural, institutional, socio-political factors that, together with economic factors, contribute to the inequality's turning point and its unsustainability.
1 While we may think of some categories of spending as redistributive (such as
education or social insurance spending), they need not be redistributive in practice, consider spending on post-secondary education in poor countries or on social protection for formal sector workers in many developing countries.
2 In practical terms, we run this regression starting from an arbitrarily threshold
level for GINI equal to 39, and then go up to 60. The initial value for Gini is set to 39 because we want at least 30 observations below that threshold.
References
Burchardt, H. (2010). “The Latin American Paradox: Convergence of Political Participation and Social Exclusion”, Internationale Politik und Gesellschaft No 3, pp. 40-51.
CEPAL (Comisión Economica para America Latina y el Caribe). Panorama social de America Latina, ONU, Santiago de Chile, noviembre de 2010 e noviembre 2011; Cornia, A. (2014). Falling Inequality in Latin America: Policy Changes and Lessons. Oxford University Press.
Kaldor, N. (1956). “Alternative theories of distribution”. The Review of Economic
Studies 23(2), 83-100.
Kaldor, N. (1957). “Alternative theories of distribution”, The Economic Journal 67(268), 591-624.
Lopez-Calva L., and N. Lustig (2010). “Declining Inequality in Latin America. A Decade of Progress?”. Programa de las Naciones Unidas para el Desarrollo (pnud) and Brookings Institution Press, Nueva York-Washington, DC.
Palma, J. G. (2011). “Homogeneous middles vs. heterogeneous tails, and the end of the ‘Inverted-U’: It's all about the share of the rich”, Development and Change 42(1): 87-153.
Policardo L., L. Punzo, and E. Sanchez Carrera (2018). “¿Desigualdad insostenible? Evidencia Empírica para países de América Latina”, in America Latina en la larga
historia de la desigualdad, Puchet Anyul and Puyana Mutis (Eds). FLACSO – Mexico,
Press.
Solt, Frederick (2011). “Standardizing the World Income Inequality Database”, Social
Science Quarterly 90(2):231-242.
Stiglitz, J. (1969). “The distribution of Income and Wealth Among individuals”,
Immigrant-native wage gaps: evidence from the LIS Database
Andrej Cupak , LIS; d’Artis Kancs , JRC, European Commission; and Pavel Ciaian , JRC, European Commission
Disclaimer: The views and results presented in this paper are those of the authors and do not necessarily represent the official opinion of the European Commission. Any remaining errors are solely ours.
The issue of systematic differences in labor market outcomes between otherwise comparable vulnerable/discriminated groups of individuals (e.g. ethnic minorities, immigrants, etc.) on the one hand and the mainstream population on the other hand has received considerable attention in the labor economics literature as well as from policymakers during the last years.
The vast majority of previous empirical studies have been based on a single-country analysis (e.g Van Kerm et al. (2016) for Luxembourg, Lemos (2017) for the UK, and Smith and Fernandez (2017) for the US and Canada). One disadvantage of single-country studies is that they can say little about a global extent of the problem. Only few studies have analyzed the problem in a broader international context, including Fortin (2005) or Guzi et al. (2015), who employ international microdata. However, the focus of these studies is mainly on differences in the labor force participation of immigrants versus natives rather than wage differentials.
In this short note we offer a snapshot on the immigrant-native wage gaps in 11 high-income OECD countries based on cross-nationally harmonized and comparable microdata coming from the Luxembourg Income Study (LIS) Database covering the period from
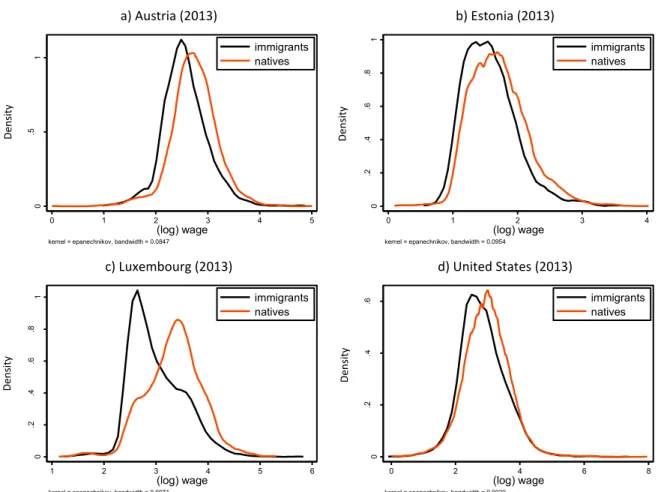
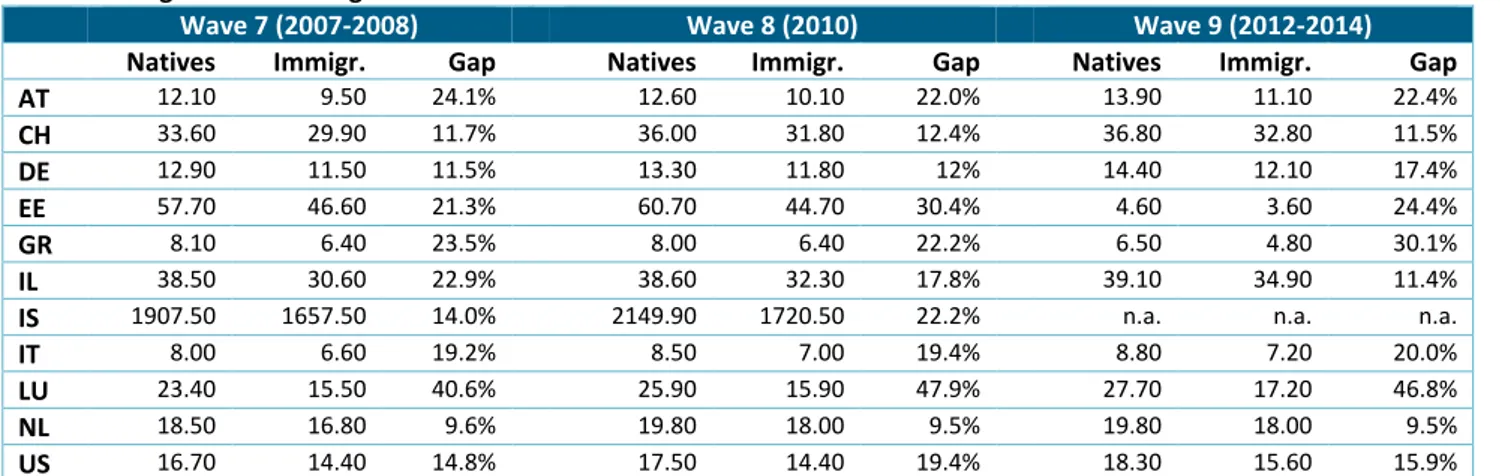
2007 to 2014. While in total the LIS Database covers about 50 countries around the world, the immigration status1 and wages2 (our outcome variable) can be observed in a comparable way only for a subset of countries: Austria (AT), Switzerland (CH), Germany (DE), Estonia (EE), Greece (GR), Israel (IL), Iceland (IS), Italy (IT), Luxembourg (LU), the Netherlands (NL), and the United States (US). Our descriptive results suggest that the wage gap3 between natives and a foreign-born population is present in the majority of countries. Figure 1 illustrates the distribution of wages (for selected countries) by immigration status. The data suggest that the wage gap is the most obvious in Luxembourg. As summarized in Table 1, wage differentials (at the median) between natives and immigrants vary between around 9% in the Netherlands to more than 40% in Luxembourg across the 11 countries and over time.
Furthermore, in Figure 2 we zoom in at the level of earnings of immigrants in selected countries versus the time they have lived in the receiving country which we use as a proxy for their integration/assimilation4. The results indicate that there is no significant correlation between the two variables, hence the wage gap does not close for those foreign-born individuals who have been living in the receiving country even for decades. These results indicate that there might be present impediments hindering migrants’ integration in the labor markets in the selected OECD countries. This suggests that the potential of policies towards addressing integration of migrants into the labor market has not been fully reached.
Figure 1: Distribution of wages in selected countries by immigration status
a) Austria (2013)
b) Estonia (2013)
c) Luxembourg (2013)
d) United States (2013)
Note: conditional on being a dependent employee. Source: LIS Database
0 .5 1 De nsit y 0 1 2 3 4 5 (log) wage immigrants natives
kernel = epanechnikov, bandwidth = 0.0847
0 .2 .4 .6 .8 1 De nsit y 0 1 2 3 4 (log) wage immigrants natives
kernel = epanechnikov, bandwidth = 0.0954
0 .2 .4 .6 .8 1 De nsit y 1 2 3 4 5 6 (log) wage immigrants natives
kernel = epanechnikov, bandwidth = 0.0971
0 .2 .4 .6 De nsit y 0 2 4 6 8 (log) wage immigrants natives
kernel = epanechnikov, bandwidth = 0.0929
D ens it y D ens it y D ens it y D ens it y
Inequality Matters
LIS Newsletter, Issue No. 6
__________________________________________________________________________________________________________________________________________________________________________________________________________________________ ____________________________________________For example, a study by Guzi et al. (2015) reveals that in the EU, institutional indicators including differences among welfare systems, trade openness, and employment protection legislation are responsible for a large part of the immigrant-native gap in employment. In addition, Kancs and Lecca (2018) have assessed long‐term social, economic and fiscal effects of immigration into the EU of alternative integration policies: status quo versus forward-thinking integration policies. They find that, although less costly in
the short-run, the social, economic and fiscal benefits of currently implemented migrant integration policies in EU Member States are likely to be considerably lower in the long-run, when compared to the potential of forward-thinking integration policies.
However, a further more comprehensive research agenda is needed to evaluate the effectiveness of integration policies and policies promoting equality of opportunities as well as their socio-economic implications in the long-run. As the next step, we aim to apply
Table 1: Immigrant-native wage differentials across countries
Wave 7 (2007-2008)
Wave 8 (2010)
Wave 9 (2012-2014)
Natives
Immigr.
Gap
Natives
Immigr.
Gap
Natives
Immigr.
Gap
AT
12.10 9.50 24.1% 12.60 10.10 22.0% 13.90 11.10 22.4%CH
33.60 29.90 11.7% 36.00 31.80 12.4% 36.80 32.80 11.5%DE
12.90 11.50 11.5% 13.30 11.80 12% 14.40 12.10 17.4%EE
57.70 46.60 21.3% 60.70 44.70 30.4% 4.60 3.60 24.4%GR
8.10 6.40 23.5% 8.00 6.40 22.2% 6.50 4.80 30.1%IL
38.50 30.60 22.9% 38.60 32.30 17.8% 39.10 34.90 11.4%IS
1907.50 1657.50 14.0% 2149.90 1720.50 22.2% n.a. n.a. n.a.IT
8.00 6.60 19.2% 8.50 7.00 19.4% 8.80 7.20 20.0%LU
23.40 15.50 40.6% 25.90 15.90 47.9% 27.70 17.20 46.8%NL
18.50 16.80 9.6% 19.80 18.00 9.5% 19.80 18.00 9.5%US
16.70 14.40 14.8% 17.50 14.40 19.4% 18.30 15.60 15.9%Note: Wages refer to hourly wages in national currency: in Euros, except Switzerland (Swiss Franc), Estonia (Estonian Kroon for 2007-2010 period), Iceland (Icelandic Krona), Israel (New Israeli Sheqel), and the US (US Dollar). Median values of wages presented conditional on being employed. Figures computed using survey weights.
Source: LIS Database
Figure 2: Correlation between the wage of immigrants and the number of years they have been living in the country
a) Austria (2013)
b) Estonia (2013)
c) Luxembourg (2013)
d) United States (2013)
Source: LIS Database
1 2 3 4 5 (lo g) wa ge 0 10 20 30 40
years since arrived in country linear fit corr. = 0.13 0 1 2 3 4 (lo g) wa ge 0 20 40 60 80
years since arrived in country linear fit corr. = -0.14 1 2 3 4 5 6 (lo g) wa ge 0 20 40 60
years since arrived in country linear fit corr. = 0.14 0 2 4 6 8 (lo g) wa ge 0 20 40 60
years since arrived in country linear fit corr. = 0.17 (l o g) W ag e (l o g) W ag e (l o g) W ag e (l o g) W ag e
various decomposition techniques from the labor economics and policy evaluation literature to provide a more nuanced analysis of the immigrant-native wage gaps. LIS microdata offer a good opportunity for conducting analyses in this subject, as the available country coverage allows for a broader analysis beyond the European context. 1 In our case, the immigration status is a binary variable taking the value of 1 if
an individual was born outside of the considered country. We do not consider individuals born outside the country whose parents were actually born in a domestic country as immigrants. For details on the immigration status see the online documentation system: http://www.lisdatacenter.org/frontend#/home.
2 Wages in our context are defined as gross (net) hourly wage earned in the first
dependent job. We do not consider wages of the self-employed as they are often not reported.
3 We note that individuals differ along many dimensions like work experience or
education – the human capital factors which need to be considered in any analysis on wage differentials – which we have not considered in this short note. These differences are relevant and need to be considered when conducting a thorough empirical investigation.
4 As noted by Venturini (2017), the two terms are used interchangeably among
economists with the same connotation. We are aware that, ideally, one would like to measure assimilation of migrants by a variable capturing their working experience with individual-level panel data, however, this is not feasible with the LIS microdata.
References
Fortin, N. M. (2005). Gender role attitudes and the labour-market outcomes of women across OECD countries. Oxford Review of Economic Policy 21(3), 416–438. Guzi, M., Kahanec, M., & Kureková, L. M. (2015). What Explains Immigrant-Native
Gaps in European Labor Markets: The Role of Institutions (No. 8847). IZA Discussion
Papers.
Kancs, D. and Lecca, P. (2018). Long‐term social, economic and fiscal effects of immigration into the EU: The role of the integration policy, World Economy,
https://doi.org/10.1111/twec.12637
Lemos, S. (2017). Mind the gap: A detailed picture of the immigrant-native earnings gap in the UK using longitudinal data between 1978 and 2006. Regional Science and
Urban Economics 63, 57–75.
Smith, W. C. and F. Fernandez (2017). Education, Skills, and Wage Gaps in Canada and the United States. International Migration 55(3), 57–73.
Van Kerm, P., Yu, S. and Choe, C. (2016). Decomposing quantile wage gaps: a conditional likelihood approach. Journal of the Royal Statistical Society: Series C
(Applied Statistics), 65(4), 507-527.
Venturini, A. (2017). Immigrant Assimilation in the Labour Market: What Is Missing in Economic Literature. In Weinar, A., Unterreiner, A., Fargues, P.(eds.) Migrant
Integration Between Homeland and Host Society Volume 1 (pp. 21-42). Springer,
Inequality Matters
LIS Newsletter, Issue No. 6
__________________________________________________________________________________________________________________________________________________________________________________________________________________________ ____________________________________________LIS working papers series
LIS working papers series - No. 733Radical Right Populism and the Role of Positional Deprivation and Inequality
by Brian Burgoon, Sam van Noort, Matthijs Rooduijn, Geoffrey Underhill
LIS working papers series - No. 734
More Necessary and Less Sufficient: An Age-Period-Cohort Approach to Overeducation in Comparative Perspective by Eyal Bar-Haim, Louis Chauvel, Anne Hartung LIS working papers series - No. 735
How redistributive policies reduce market inequality: Education premiums in 22 OECD countries
by David Weisstanner, Klaus Armingeon Puplished in the Socio-Economic Review:
https://doi.org/10.1093/ser/mwy018 (March 2018)
LIS working papers series - No. 736
Manufacturing jobs: implications for income inequality by Natalija Novta, Evgenia Pugacheva
Published in the World Economic Outlook: Cyclical Upswing, Structural Change “Manufacturing Jobs: Implications for Productivity and Inequality”, Chapter 3 (April 2018). LIS working papers series - No. 737
The persistence of the gender earnings gap: cohort trends and the role of education in twelve countries
by Eyal Bar-Haim, Louis Chauvel, Janet Gornick, Anne Hartung
LIS working papers series - No. 738
Universal child allowances in 14 middle income countries: options for policy and poverty reduction
by Martin Evans, Alejandra Hidalgo, Mei Wang
LIS working papers series - No. 739
Inequality of Opportunity in Developing countries: Does the income aggregate matter?
by Ana Suárez Álvarez, Ana Jesús López Menéndez LIS working papers series - No. 740
Job Tasks and the Comparative Structure of Income and
Employment: Routine Task Intensity and Offshorability for the LIS by Matthew C Mahutga, Michaela Curran, Anthony Roberts Published in the International Journal of Comparative Sociology 59(2): 81-109 (April 2018).
LIS working papers series - No. 741
Trade, Inequality, and Subjective Well-Being: Getting at the Roots of the Backlash Against Globalization
by Barbara Dluhosch
LIS working papers series - No. 742
A Care Convergence? Quantifying Wage Disparities for Migrant Care Workers Across Three Welfare Regimes
by Naomi Lightman
LWS working papers series
LWS working papers series - No. 28How Patient are Consumers? Evidence from Luxembourg Wealth Study
by Walid Merouani
Working Papers & Publications
Focus on ‘The persistence of the gender earnings gap: cohort trends and the role of education in twelve countries’ - LIS WP No. 737 by Eyal Bar-Haim (University of Luxembourg) , Louis Chauvel (University of Luxembourg), Janet Gornick (Graduate Center, CUNY& LIS), and Anne Hartung (University of Luxembourg)
In recent generations, in many high-income countries, gender gaps in academic attainment reversed. However, for this change to affect labor market outcomes, younger generations of more educated women must replace the earlier generations. In the context of generational replacement, our study assesses whether gender earnings gaps have closed in tandem with a marked narrowing of gender educational gaps. This question is particularly well-suited to the Luxembourg Income Study (LIS) Database, which allows us to analyse 12 countries, over 30 years, using harmonized microdata on educational attainment, earnings, employment status (yes/no), and family structure. We use a new Age-Period-Cohort model, which integrates the Blinder-Oaxaca method, to assess how generational changes contribute to inequality reduction. We decompose cohort gaps into their explained component (due to lower education and fewer weekly work hours in the older generations) and their unexplained component.
We find that, in general, women’s educational gains contributed to their relative improvement with respect to earnings. In most countries, in the later years, young male adults were less educated than their female counterparts. However, even if this dramatic change had marked impacts on other dimensions of social life, its role in reducing gender earnings gaps has been limited and even decreasing over successive cohorts. Employment status and occupation were more important explanatory factors.
The part of the earnings gap not explained diverges largely across countries. In most of our study countries (exceptions are the UK and the US), the unexplained portion of the gender earnings gap has remained stable during the 30 years studied. This implies that, if countries want to reduce gender earnings gaps, they will have to tackle inequalities operating inside labor markets and workplaces rather than focusing on gender gaps in educational attainment or in employment rates.
Complex national-level historical, economic, and political configurations, and their legacies, seem to have distinct impacts in different cohorts; the standard welfare regime or gender typologies capture only a small part of the story. The LIS microdata offer the opportunity to generalize beyond recent single-country studies (mainly on the US) that have found similar results. Our study is the first to expand this question into cross-national context, including a substantial number of countries.
Data releases
__________________________________________________________________________________________________________________________________________________________________
Luxembourg Income Study (LIS)
ChileLIS is delighted to announce that it has acquired an entire series of income microdata from Chile. As of today, twelve new datasets (CL90, CL92, CL94, CL96, CL98, CL00, CL03, CL06, CL09, CL11, CL13, and CL15) have been added to the LIS Database. The datasets are based on the corresponding waves of the National Socio-Economic Characterization Survey (CASEN) carried out by the Ministry of Social Development.
Germany
Continuing on the effort to annualise the German LIS series, seven additional data points based on the German Socio-Economic Panel (GSOEP) carried out by the German Institute for Economic Research (DIW) have been added to the LIS Database (DE14, DE12, DE09, DE08, DE05, DE03, DE02). With this addition, the German LIS series is now completely annual starting from the year 2000.
Hungary
One new dataset, HU15 (Wave X), has been added to the LIS Database. The dataset is based on the 2015 wave of the Tárki Household Monitor Survey carried out by the Tárki Social Research Centre.
Poland
One new dataset from Poland, PL16 (Wave X) has been added to the LIS Database. The dataset is based on the 2016 wave of the Household Budget Survey carried out by the Central Statistical Office(GUS).
Israel
Two new datasets, IL14 and IL16 (Wave X) have been added to the LIS Database. The datasets are based on the 2014 and 2016 waves of the Household Expenditure Survey (HES), carried out by the Central Bureau of Statistics.
Data revisions
__________________________________________________________________________________________________________________________________________________________________
Luxembourg Income Study (LIS)
Hungary - The entire LIS series for Hungary has undergone a
substantial revision, whereby most income subcomponents have been substantially affected and are now fully comparable.
Israel - The information on household composition and living
arrangements has been improved in the IL86, IL92 and IL97 datasets, giving rise to a substantial upwards revision of the child poverty rates for those three years.
Canada - The standardised education variable EDUC for the six
datasets from CA75 to CA97 have been changed to be consistent across the entire Canadian LIS series.
Poland - Variable GROSSNET was revised in PL13, PL10, PL07,
PL04 and PL99, in order to better reflect the fact that only a very small part of income taxes and contributions are captured in the data. In addition, individual wage data, previously not available for the year 2004, have been made available.
LIS/LWS Data Release Schedule
__________________________________________________________________________________________________________________________________________________________________
Data News
Fall 2018 Winter 2018 Spring 2019 LIS Database Australia AU04/14 Colombia CO16 Georgia GE16 Iceland IS13 Italy IT02/06/12/16 Mexico MX16 Russia RU16 Serbia RS16 Slovenia SI15South Africa ZA15
LWS Database Australia AU04/14 Canada CA16 Italy IT02/06/12/16 Spain ES02/05/08/ 11/14
South Africa ZA15
United Kingdom UK13/15
Chile - a new member in the LIS Database
With the addition of Chile to the LIS Database, LIS expands its coverage in the Latin America and Caribbean region to 10 countries, namely Brazil, Chile, Colombia, Dominican Republic, Guatemala, Mexico, Paraguay, Peru, and Uruguay.
Chile is a long, narrow strip of land in South America between the Andes to the East and the Pacific Ocean to the West; it covers a total area of 756,096 km2, with approximately 17.6
million inhabitants.
Over the last decade, Chile has witnessed tremendous progress in terms of improving the life of its citizens. The Chilean average GDP per capita, PPP (International US$), has reached in 2016 $ 23,194, well above the LACs average $ 15,211. In 2010, Chile became a member of the Organization for Economic Co-operation and Development (OECD).
Professor Louis Chauvel takes a first look at the 12 new Chilean datasets from the National Socio-Economic Characterization Survey (CASEN) in the LIS Database here.
Inequality Matters
LIS Newsletter, Issue No. 6
__________________________________________________________________________________________________________________________________________________________________________________________________________________________ ____________________________________________A new step in the understanding of extreme inequality dynamics: Chile comes with 12 waves 1990- 2015
Louis Chauvel , University of Luxembourg
This June, Chile is a new country in LIS: this new case will be particularly helpful for understanding extreme inequalities. Even if Chile is not alone in the group of high Gini indices – South Africa, Columbia and other Latin American countries may be more radical in extreme inequality – we, for the first time, can now observe a long trajectory, with 12 waves spread across a time span of 25 years 1990-2015: this means a time span twice longer than South Africa or other extreme countries like Brazil, Guatemala or Uruguay.
With its traumatic history during the Pinochet regime (1973–1990), that redesigned the social structure in an extreme model of inequality, and then a process of recovery of democracy. The first analysis shows a rapid, steady process of income equalization after the 2000s, when the Gini index of the “level of living” (disposable income per consumption unit) was close to .50. Under the presidency of center left Ricardo Lagos (2000-2006) and then Michelle Bachelet (2006-2010), the intensity of inequality dropped by almost 5 points in a decade, a not common trait in LIS countries.
Chile is interesting for its trends, but also for a not so usual structure of distribution. In many LIS countries we observe a relative equality of the top decile to median ratio d9/d5, and the median to lower decile ratio d5/d1. This means a general symmetry of the histogram of the logged income. When we look closer to the more than 300 Lis datasets (as of June 2018, 335 datasets), we find that in 72% of the cases (d9/d5) is smaller than (d5/d1). In the majority of countries, we observe a dissymmetry from the median where the poor go deeper in poverty than the rich climb to the top of affluence. This means in the majority of countries, the limitation in
richness (e. g. through progressive income tax) is relatively stronger than reduction of
poverty (e. g. through social
redistribution). The U.S. distribution is a strong example of this feature where relative poverty can reach extreme levels. Chile is an opposite case and represents in this respect an exception: the poorer are not so far below the median (given the intensity of inequality in Chile) but the rich diverge far away above the median at an exceptional magnitude. This fits with the general impression of visitors to Chile who consider relative social homogeneity at the bottom of the Chilean society and extreme income affluence at the top. This means also a new lower middle class is developing with very specific traits.
This contributes to explain why Chile, with a much higher Gini index than the U.S. (.45 in Chile, .38 in the U.S.) the Chilean relative poverty rate (60% of the median) is below the American one (23.2% in CL15 compared to 24.2% in US16). This is due to the fact that the Gini is more sensitive to inequalities at the top, and evidently less so to poverty and inequalities at the bottom.
This is why the inclusion of Chile in LIS might help understand better how societies might experience rapid changes in the intensity and shape of inequality: Chile could be more than an additional country but an important clue in the politics and inequality nexus.
Highlights
References
Contreras, D. and Ffrench-Davis, R. (2012). “Policy regimes, inequality, poverty and growth: The Chilean experience, 1973 – 2010” WIDER Working Paper 2012/04. Espinoza, V; Barozet, E.; Méndez, M. L. (2013). Estratificación y movilidad social bajo un modelo neoliberal: El caso de Chile, Revista Lavboratorio , 14(25), 169-191.
Figure 1: Change in the Gini index of equivalised disposable income Chile 1990-2015
Source: Luxembourg Income Study (LIS) Database
Figure 2: Dissymmetry of the income distribution horizontal axis = ln(d5/d1), vertical axis = ln(d9/d5)
Comparing top incomes between survey and tax data: US case study
Nishant Yonzan , Branko Milanovic , Salvatore Morelli , and Janet Gornick , Graduate Center, CUNY
There are two main sources of microdata used to measure income – data based on household surveys and data from fiscal sources (specifically tax data). Both sources capture the distribution of income, but there are substantial differences between them. While the share of the population that report their income to fiscal authorities is high (in the US in 2013, 90% of the population filed taxes; see Figure 1), fiscal data are collected by tax authorities, and hence vary with tax codes both within countries over time, and across countries. On the other hand, surveys are based on samples of the population, which creates a potential for differences in income, compared with the tax source, at the top of the distribution. However, survey income is more stable over time and is defined according to international conventions and is thus more comparable across countries. In addition, survey income concepts are broader, not restricted by tax codes, and survey data have the advantage that they are available in highly disaggregated form (that is, they include many more categories of income). One benefit of this flexibility is that it allows us to use survey data to construct income definitions that match those in the available fiscal data, and to assess where the differences between the two sources lie.
In this study, we do exactly this. We compare income in the top income decile between survey data and tax data. We use the Luxembourg Income Study (LIS) Database for the survey data and the World Wealth and Income Database (WID) for the tax data. We break the top decile into three income groups – the top 1% (p99p100), the next 4% (p96p99), and the bottom 5% (p91p95). Within each group, we disaggregate income into three sources - labor, business, and
capital income. The purpose of our study is twofold: first, to understand at what point the difference in income, between the two sources, begins (whether at the 90th, 95th or 99th percentile); and second, to assess the components of this difference. We present preliminary results for the US case below.
The primary unit of analysis in household surveys is the household. The unit of analysis in fiscal data depends on the national tax code. For example, tax units in the US are composed of couples and singles and their dependents, while, in the UK, all the tax filing units are individuals. Figure 1 shows the total number of household units, tax filers, and tax units for the US in 2013. Tax filers are units that file taxes1. The non-filers are added to the tax filers to get to total tax units. In 2013, there were 25% fewer household units compared to tax units2.
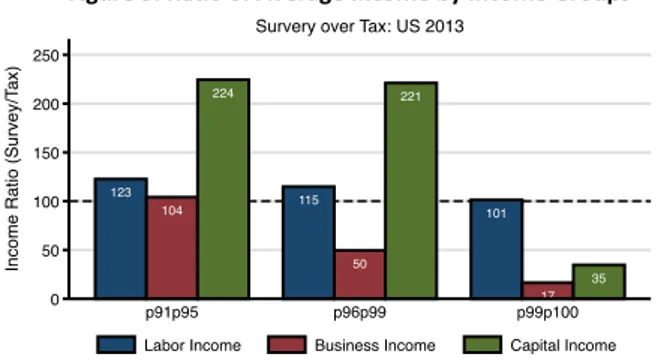
Figure 2 compares the composition of total income between these survey and tax data. While the composition of the top 1% is substantially different between the two data sources, the composition of labor and non-labor income within the two lower groups are similar. Within the top 1%, in the tax data, 44% of the income comes from non-labor source compared to only 15% in the survey data. Figure 3 compares the average income of the three groups by income source. As with the composition reported in Figure 2, survey mean non-labor incomes are substantially less than the tax mean non-labor income for the very top percentile. Mean labor income, on the other hand, is roughly equal across the income groups, and mean capital income is over-reported in the p91p95 and p96p99 groups.
We have thus far seen that there is substantial difference of income only within the very top percentile, and almost all of this is driven by the non-labor portion of income. Figure 4 presents the percentage point gap, within the top 1%, between income shares from tax versus Figure 1: Comparison of Units by Income Source: US 2013
Figure 2: Composition of Income by Income Group
Figure 3: Ratio of Average Income by Income Groups
Inequality Matters
LIS Newsletter, Issue No. 6
__________________________________________________________________________________________________________________________________________________________________________________________________________________________ ____________________________________________ survey data. Two things stand out: first, there is an increase overtime in this gap in the US, and second, non-labor income plays a substantial role in this increase. In 2013, 72% of the gap is explained by non-labor income. Within the non-labor income, it is business income that explains most of the difference. Its reporting on tax forms has increased following the US Tax Reform Act of 1986; business income alone accounts for 53% of the gap between the two sources in 20133.
1 Not all tax units file taxes. In the US, the fraction of tax units filing taxes (or tax
filers) were, on average, 94% in the post-World War II period (Atkinson and Lakner, 2017).
2 There are generally fewer total households than total tax units because there
are typically more than one tax unit within a household. We find that the number of total household units are on average 80% of total tax units.
3 S-corporation filing status became more attractive following the US Tax
Reform Act of 1986, which reduced the top personal tax rate to below the corporate tax rate (Slemrod, 1996).
References
Atkinson, A., & Lakner, C. (2017). Capital and labor: the factor income composition of top incomes in the United States, 1962-2006.
Atkinson, A. B., Piketty, T., & Saez, E. (2011). Top incomes in the long run of history.
Journal of economic literature, 49(1), 3-71.
LIS (2018). LIS Database. Retrieved from http://www.lisdatacenter.org/our-data/lis-database/
Slemrod, J. (1996). High-income families and the tax changes of the 1980s: the anatomy of behavioral response. In Feldstein, M and Poterba, J. M. Empirical
foundations of household taxation, pp. 169-192, University of Chicago Press.
Elderly in Paraguay – a vulnerable group
Carmen Petrovici , LIS
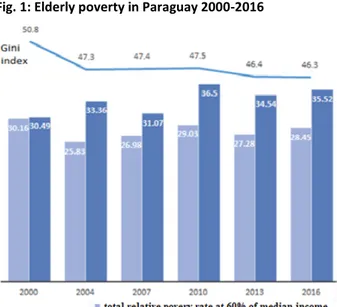
Paraguay is one of the poorest countries in Latin America, although over time a slight decrease of poverty and inequality can be observed. Nevertheless, with a Gini of 46.3 % in 2016, inequality remains at a very high level. Following the same trend, the overall poverty rate (at 60% of the median income poverty) slightly decreased over time, however, not for all groups, as we can see in Fig. 1 below: if in 2000, poverty among the elderly was close to the overall poverty rate, with a bit over 30%; over the years, the elderly poverty increased by 5 percentage points reaching 35.5% in 2016, which represents a gap of more than 7 percentage points compared to the overall poverty rate. Therefore, it seems that the elderly are one of the most vulnerable groups facing poverty in Paraguay, even though the country made recently efforts to implement social policy in order to improve their financial wellbeing.
Fig. 1: Elderly poverty in Paraguay 2000-2016
Source: LIS data
The question that arises is: why, while the overall situation in the country is improving, the situation of the households with seniors is deteriorating? One of the most evident reasons could be the low coverage of the pension system in Paraguay. As shown by Schwarz (2003), in 2001, only 14% of the total Paraguayan labour force was contributing to the pension system, one of the lowest percentage in the region, in the same cluster with Bolivia (11.7%) and Nicaragua (13.6%). On the other end of the spectrum, there was the leading group of Latin American countries in which at least half of the working force was covered: Argentina (53%), Chile (54.8%), Costa Rica (50%), Panama (51.6%) and Uruguay with an impressive 82% coverage (Schwarz, 2003).
Pension system coverage is an essential indicator of the efficiency of the public policy regarding income security: if the system is not covering most of those who are supposed to be protected against income deprivation, this can be seen as a failure of the state (see Rofman et al., 2007). The vulnerable group of the elderly can be covered by contributory pension schemes or non-contributory ones. In 2016, the coverage of the contributory pension system was still very low in Paraguay, with only 21% of the employed persons participating in a pension scheme (including private ones, which are still very underdeveloped, with under 1% coverage rate). Nevertheless, this represents an increase of 8.6 percentage points over the years since 2000 (LIS data). If the contributory system’s coverage is low, the state could compensate with non-contributory schemes either targeting the most vulnerable elderly (means-tested benefits) or, if the system is financially sustainable, could grant a universal minimum pension to all senior citizens. As Dethier et al. (2010) are stressing, reducing elderly poverty requires a different approach from other age groups for which active labour market policies are more efficient than the passive ones on long term, whereas for the elderly only transfer of real income is efficient. Seeing other countries from Latin America introducing social assistance targeting the elderly in the mid 2000s, senior citizens from Paraguay were protesting actively to get a pension of their own (see Pension Watch). Finally, their needs were acknowledged by the policy makers, who introduced in 2009 the social pension in Paraguay. The programme is called Adultos Mayores and aims to improve the quality of life of the elderly living in extreme poverty.
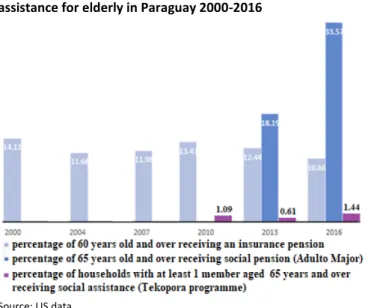
Fig. 2: Coverage of the pension system and other social
assistance for elderly in Paraguay 2000-2016
Source: LIS data
The implementation of the programme took a couple of years (till 2011) because, besides the minimum required age of 65 years, the eligibility is based on a means test of the household’s income and assets and these needed time to be assessed. Set at 25% of minimum wage, the social pension is slightly above the World Bank recommendation of 2.5 $/day.
Looking at the overall coverage in Fig. 2 we can see that in 2016 only 10.7% of the elderly of 60 years and over were receiving an insurance based pension, while 33.6 % of the elderly aged 65 years and over were receiving the assistance pension (LIS data). This represents an impressive increase of 15.4 percentage points in coverage of assistance pension since 2013. However, at the same time, with the introduction of the social pension, coverage of the insurance-based pension is decreasing, as well as decreasing over time since 2000, in a non-linear way.
One explanation of this divergent trend could be the fact that the two types of pensions are non-cumulative, therefore if the social pension was higher than the insurance-based one, seniors would opt for the latter. However, even with such a substantial increase in social pension coverage, the poverty rate of the elderly still increased by 1 percentage point between the two waves, therefore the effectiveness of the Adultos Mayores programme still needs to be evaluated in detail in order to see why a substantial impact on improving the living conditions of the elderly was not observed so far. In fact, the Paraguayan Government is running a survey to assess the programme’s full impact on the seniors’ wellbeing.
In order to have a comprehensive picture of the coverage of assistance benefits, we looked also at other social benefits that can reach the seniors. In 2005, the first conditional monetary transfer programme was introduced, called Tekopora, targeting vulnerable groups in Paraguay, including also households with elderly in poverty
(means tested). Still, as we can see from Fig. 2, only a bit over 1% of the households with at least one member aged 65 years and over received this type of assistance transfers in 2010. The decrease by almost half by 2013 is explained by the fact that, since the introduction of the social pension, having a household member aged 65 years or older is no longer among the eligibility criteria for receiving this benefit. Some households with seniors continue to receive it because they fulfil other eligibility criteria (minor children, pregnant women, disabled person). Nevertheless, the Tekopora programme contributed to the decrease of the overall poverty rate during the last decade in Paraguay.
To conclude, although policy efforts were made, the coverage of social assistance towards vulnerable groups is still rather low in Paraguay, targeting only the extreme poor. One of the explanation can be seen in the limited financial resources, for example in 2010 only 0.25% of GDP was allocated to the Tekopora programme and this number decreased to 0.14% of GDP by 2013. In contrast to this, Uruguay is allocating to a similar assistance programme (Asignaciones Familiares) 0.46% of its GDP for 2015 (Ministry of Finance, Paraguay, 2016). With the highest pension coverage from the continent, Uruguay had an elderly poverty rate of only 18.4% in 2016, below the overall poverty rate of 20.7% (LIS data). This is a leading example to be followed by the other countries in the region, including Paraguay. A coherent social policy, focusing on increasing the coverage of both current labour force for future contributory benefits and current social assistance benefits needs to be implemented in order to reduce elderly poverty in Paraguay. Furthermore, such policy should not only be targeting people in extreme poverty, but also aiming to reach more people in need and especially people from vulnerable groups such as elderly who cannot provide for themselves anymore.
References
Dethier, J., Pestieau, P. and Ali, R. (2010). “Universal Minimum Old Age Pensions Impact
on Poverty and Fiscal Cost in 18 Latin American Countries”, Policy Research Working
Paper 5292, World Bank.
Ministry of Finance, Paraguay (2016). “Evaluación de impacto del programa Tekoporã”, May 2016, available at:
http://www.economia.gov.py/application/files/9514/7939/4429/Evaluacion_de_Impact o_del_Programa_Tekopora_07062016.pdf.
Rofman, R. and Lucchetti, L. (2007). “Pension Systems in Latin America: Concepts and
Measurements of Coverage”, SP discussion paper no. 0616.
Schwarz, A. (2003). “Old Age Security and Social Pensions Social Protection”, World Bank.
Website sources
Global Age Watch: http://www.helpage.org/global-agewatch/population-ageing-data/country-ageing-data/?country=Paraguay.
Paraguay Government: www.paraguay.gov.py.
Pension Watch: http://www.pension-watch.net/country-fact-file/paraguay/. Poverty in action: https://www.poverty-action.org.
Inequality Matters
LIS Newsletter, Issue No. 6
__________________________________________________________________________________________________________________________________________________________________________________________________________________________ ____________________________________________Catch me if you can – a comparison of Poland with Germany
Piotr Paradowski , LIS and Gdańsk University of Technology, Teresa Munzi , LIS, and Jörg Neugschwender , LIS
Poland is a country that struggled with many free market economy issues related to labour market and welfare economics because of the socio-economic transition process starting in the 1990s. In recent years, Poland has been showing a fairly good economic growth and it
is expected to stay on this path together with some other EU
member states. According to the OECD Economic Outlook 2018, the unemployment rate is falling since 2013, wages have been growing rapidly from 2016, and “consumption is growing strongly thanks to a booming labour market and the recent child benefit programme, which has buttressed households’ disposable income.” Is this a sign of economic convergence?
In this short note, we would like to highlight several economic trends that could be revealed from harmonized Polish microdata over 20 years. We believe that this is best done, when putting it in comparative perspective, and we have chosen to compare Poland to its neighboring high-income economy, namely Germany. Specifically, we would like to explore how Poland is performing in terms of inequality levels, poverty and wage growth.
Figure 1 shows the plot of the Gini index of disposable income for Poland and Germany. Income inequality levels of the two countries were very different in the mid-1990s, with the German Gini index being 6 points lower than the Polish one, and gradually converged towards a very similar level over more than 20 years. While Poland’s inequality measure goes rapidly down from 2013 to 2016, the indicator of German inequality was on the rise from the 2000s
onwards (with a small downwards trend in the middle). A very similar story is portrayed in Figure 2 that illustrates relative total and children poverty rates. A striking finding is that, by the end of the period, the poverty rate is significantly lower in Poland than in Germany, especially when looking at households with children. This is very likely due to the spurt of social transfers for children since 2016, but further investigation is needed. The decreasing poverty levels and income inequality are most likely due to the redistribution: as a matter of fact, the percentage difference between the Gini index for disposable income and market income (defined as the sum of labour income, capital income, occupational pensions and private transfers) increases in Poland from 35% in 2013 to 39% in 2016, which signifies an increased effect of the public transfers redistribution.
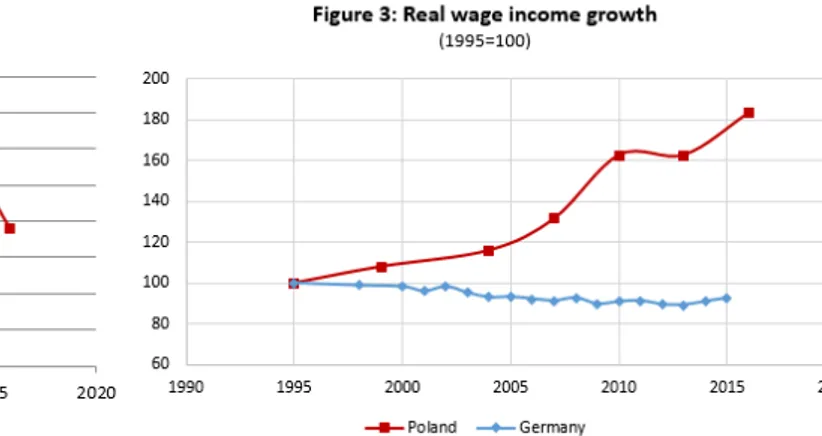
Figure 3 shows the median wage growth adjusted for PPPs and inflation with reference to 1995. While German data indicate a small downward shift of wages until the mid-2000s and a very small fluctuation over the last 10 years, Poland’s path of wages was on the rapid rise from 2004 to 2010 and again from 2013 to 2016. It does not mean that Polish wages are higher in real terms than those in Germany. Despite the firm growth of wages, the income in real terms in Poland is still lower than in Germany. Figure 4 demonstrates this by plotting the ratio of disposable income (adjusted for housing costs) in Poland and Germany in real terms across the bottom 20%, middle 60% and top 20% of the income distribution. In 1995, the Polish middle class (middle 60%) received income that was only around 32% of what German middle class household had. In the most recent year this figure has changed to around 58% -- more than