DOI 10.1393/ncc/i2019-19222-7
Communications: SIF Congress 2018
Thermodynamic thresholds in water/methanol solutions
C. Corsaro(∗)
Dipartimento di Scienze Matematiche e Informatiche, Scienze Fisiche e Scienze della Terra (MIFT), Universit´a di Messina - Viale F. Stagno d’Alcontres 31, 98166 Messina, Italy
received 14 February 2019
Summary. — The non-ideality of water/methanol solutions is established by the interplay between hydrophilic and hydrophobic interactions that take place within the system and determine its physical properties. These interactions have a dif-ferent energetic dependence on the temperature and the measurement of transport parameters, such as self-diffusion coefficient and relaxation time, allows to obtain important information about that dependence. Here it is shown how thermodynamic parameters such as temperature and concentration determine the character and the physical properties of the solutions. Furthermore, the thermodynamic thresholds that separate the different energetic regions were identified.
1. – Introduction
Aqueous solutions of molecules containing moieties with opposite behaviour with re-spect to attracting water molecules display a non-linear trend in dynamic and thermo-dynamic quantities as a function of the concentration. The main interactions taking place within these solutions are the hydrophilic (water-loving, polar) and hydrophobic (water-hating or lipophilic) ones, that compete with each other to determine the prop-erties of the solution and depend on the thermodynamic conditions such as temperature and concentration [1]. The comprehension of the interplay between these interactions within aqueous solutions is very important from different points of views, especially from a biological side. In fact, it is well known that the biological macromolecules and life itself need a minimum amount of water to support their activities [2, 3]. However, the complexity of large molecules does not allow an easy modeling and comprehension of the microscopic mechanisms underlying amphiphilic aqueous solutions [4, 5].
The simplest molecule, that in solution with water shows both hydrophilic and hy-drophobic interactions (i.e., an amphiphile), is methyl alcohol (or methanol) that indeed
(∗) E-mail: [email protected]
tried to address the important issue of determining the solution properties at specific thermodynamic conditions [13-21], also for the related industrial applications [22].
Recently, a careful study of the relaxation times going from high (360 K) to very low temperature (160 K) showed opposite thermal behaviors for water/methanol solutions [1]. At the highest temperatures, the thermal energy and van der Waals interaction destabi-lize the hydrogen bonds and hydrophobic forces determine the properties of the solution. This holds for temperatures higher than 320 K, whereas for lower temperatures the hy-drogen bonds progressively increase their strength and lifetime with the development of low-density liquid (LDL) structures down to about TL = 225 K. This temperature
has been identified with that of the fragile-to-strong crossover for water below which the tetrahedral network of water is fully developed for aqueous systems with different dimensionality [23]. The crossover temperature corresponds also to the maximum for the correlation length of water molecules that in turn defines the locus of the Widom line, the critical isocore departing from the hypothesized liquid-liquid critical point for water [24, 25]. Within the mentioned study, the dependence of the Widom line on the concentration has been pointed out [1]. Furthermore, by looking at the microscopic mechanisms underlying the different interactions occurring in water/methanol solutions, their competition has been studied by means of Nuclear Magnetic Resonance (NMR) spectroscopy [21].
Here, we will merge the results of both structural and dynamical experiments obtained by using NMR spectroscopy on water/methanol solutions. The aim is the definition of the thermodynamic thresholds that separate different regions corresponding to different structural arrangements and dynamical regimes. We find that only the thermal threshold defining the hydrophilic/hydrophobic competition is slightly dependent on the molar fraction of the solution. On the other hand, the concentration thresholds determining the solution properties seem to soften on cooling.
2. – Methods
Nuclear Magnetic Resonance (NMR) is a very powerful experimental technique al-lowing the observation of the individual molecular species present in a solution. NMR experiments were performed on water/methanol solutions from ambient temperature to the freezing temperature (of the considered concentration) by spanning the whole range of concentration. For the measurements we used a Bruker Avance spectrometer operating
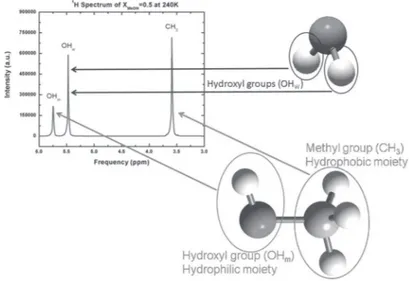
Fig. 1. – The1H NMR spectrum of the water/methanol solution for a methanol molar fraction of 0.5 and a temperature of 240 K. Water and methanol molecules, with their protons originating the NMR signal are highlighted.
at 700 MHz (proton resonance frequency) and the experimental details are reported in [6, 18].
In fig. 1 the proton NMR spectrum of the water/methanol solution with methanol mo-lar fraction (XMeOH) equal to 0.5 is reported for T = 240 K. The individual assignments
of the NMR peaks are indicated by the arrows from the corresponding moiety. Note that each peak is well resolved, furthermore at the equimolar concentration the area below the water hydroxyl protons (OHw) and methanol methyl protons (CH3) peaks is respectively
double and triple compared to that below the methanol hydroxyl protons (OHm).
For the investigation of dynamical regimes, we considered the measurement of the self-diffusion coefficient (DS) and of the relaxation times of the nuclear magnetization
(the spin-lattice, T1, and spin-spin, T2) in the whole range of molar fractions down to the
lowest temperature of 205 K. DS was measured by using the Pulsed Gradient Stimulated
Echo pulse sequence as described in [18], whereas T1 and T2 were evaluated by means
of the inversion recovery and spin-echo pulse sequences, respectively [6]. Furthermore, by assuming that both relaxation times can be expressed in terms of the same average correlation time (τc), this quantity can be calculated by solving the following equation [21,
26]:
(1) 12B(ω0τc)4+ (37B− 8)(ω0τc)2+ 10B− 5 = 0,
where B is T2/2T1 and ω0 the proton Larmor frequency.
3. – Results and discussion
For what concerns the structural investigations, from the values of the measured chemical shift, δ, we observed that the temperature behavior is not so affected by the concentration. In fact, all the considered molar fractions, going from pure water to
exchange because the two molecular species experience different chemical environments. This means that for a larger peaks distance the hydroxyl species are poorly correlated or randomly mixed. However, interesting information about the hydrogen bonding depen-dence on temperature and concentration can be achieved by looking at the dependepen-dence on the molar fraction, at a fixed temperature, of the chemical shift of the water peak. From an inspection of fig. 2 in fact, it is possible to note that the largest slope is observed at the lowest methanol concentration and at the highest temperature. The flattest region is that at intermediate molar fractions and seems to extend at the lowest temperatures where the overall trend would approach an ideal behavior [1].
The chemical shift of water hydroxyl protons increases with the methanol molar frac-tion due to the increasing shielding effect of methanol methyl groups [18,33]. This effect is more pronounced at high temperature and high water content that is when the
hydropho-Fig. 2. – The chemical shift of the water peak as a function of the methanol molar fraction at fixed temperatures in the range 250–300 K. Figure adapted from [18].
Fig. 3. – The water self-diffusion coefficient, DS, measured for the same samples (and at the
same conditions) reported in fig. 2. Figure adapted from [18].
bic interaction can destabilize hydrogen bonding and may provoke a rearrangement of the water HB network. Thus, for XMeOH< 0.2 the solution shows a higher sensitivity to
changes in concentration with a subsequent different structural configuration. This hap-pens also, but to a lesser extent, for XMeOH> 0.7 when the presence of water molecules
provokes a structural rearrangement of chains and rings sub-domains that are character-istic of methanol [20, 34]. Finally, the small value of the slope within the intermediate concentration region confirms that mixed and stable clusters form in solution and have a slower dynamics with respect to that in pure liquids [6]. This is testified also by fig. 3 in which we show the water self-diffusion coefficient measured for the same samples (and at the same conditions) reported in fig. 2.
From this figure, it is indeed evident that the dynamics in the solution is slower than that of the pure compounds especially at equimolar condition [6,14,35]. In particular, the occurrence of a minimum is evident for values of methanol molar fractions corresponding to about two to four water molecules per methanol molecule. For 0.7 < XMeOH < 0.2
the “guest” molecules are solvated within the hosting structures causing a progressive morphological modification. For intermediate values instead, the number of molecules of both substances involved in the formation of long-lived clusters is comparable. The evidence that the minimum is shifted toward the water concentrated region and that its depth decreases with temperature confirms the dominant role of hydrogen bonding.
In a previous work, the relaxation times of the nuclear magnetization were measured in water/methanol solutions as a function of the temperature discriminating the different contribution from all the individual molecular groups [6]. It was found that the spin-lattice relaxation time, T1, is shorter for the molecules in the solution than in pure liquids.
moieties [21]. In fact, as already mentioned, since the highest non-linearity (excess) lies approximately at the equimolar value, here the mixed clustering of water and methanol molecules is more enhanced. Moreover, a temperature of about 200 K can be reached without crystallization intervening and thus the water supercooled regime can be explored.
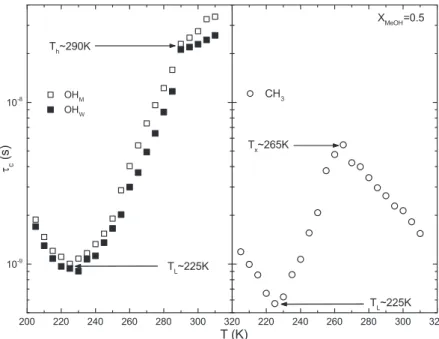
The thermal behaviour of the correlation time for the different moieties has very inter-esting features. That of hydroxyl protons shows a first change at about 290 K (left panel of fig. 4). This coincides with the temperature beyond which hydrophobicity is able to com-pete with hydrophilicity. Its onset is instead located at about 265 K where τc of methyl
Fig. 4. – The average correlation time as a function of the temperature for hydroxyl protons of water and methanol (left panel) and for methyl protons of methanol (right panel) for the equimolar solution. Figure adapted from [21].
protons shows an inversion of its trend (right panel of fig. 4). For higher temperatures, and in particular for T > 320 K, the hydrogen bond lifetime is too small (less than picoseconds) to form stable structures and water behaves as a simple liquid [36, 37].
The τc of both moieties, instead, shows a minimum at 225 K where the correlations
between water molecules reach their maximum value and the hydrogen bond network is completely developed [24, 38]. A smaller value in τc corresponds to faster correlation
because of stronger interactions. The temperature TL is also crucial for hydrated
bio-logical systems because above it the hydrogen bond network, formed by hydration water molecules, becomes softer due to the increase in the number of disordered water local structures [39, 40]. This phenomenon has been observed for many biological systems (e.g., proteins, DNA, etc. [7, 41, 42]) and from our data we have the confirmation that this happens also for the smallest amphiphilic molecule. The hydrogen bond network, developed by water molecules, acts as a plasticizer of displacements strictly connected to the biological activity [43, 44].
4. – Conclusions
In conclusion, in our study we were able to identify the thermodynamic thresholds and their meaning in water/methanol solutions. As far as the concentration thresholds are concerned, they can be summarized as follows:
• XMeOH ∼ 0.2 is the concentration of minimum compressibility marking structural
changes on the arrangement of water molecules induced by the hydrophobic effect.
• XMeOH ∼ 0.4 is the concentration of maximum slowing down for the dynamics
of the solution, associated with the longest lifetime of mixed hydrogen bonded structures [45].
• XMeOH ∼ 0.7 is the threshold concentration of perturbation effects induced by
water molecules on the methanol structures.
Note that these values are in agreement with those obtained by means of Terahertz Time-Domain Spectroscopy at 293 K [46] and Soft X-ray Absorption Spectroscopy at 298 K [47]. However, from our investigation these thresholds seem to soften and progres-sively disappear at the lowest temperatures.
Finally, we can list the temperature thresholds:
• Th ∼ 290 K is the threshold of the hydrophilic/hydrophobic competition, above
which the hydrophobic force dominates over the hydrophilic interaction. This value is slightly dependent on the concentration being influenced by the amount of hy-drophobic molecular groups present in the solution.
• Tx ∼ 265 K is the onset temperature of the hydrophobic effect, and it does not
depend on the molar fraction.
• TK ∼ 245 K marks the onset of segregation processes. Below this temperature,
independent of the concentration, water and methanol molecules probe different chemical environments corresponding to those of pure compounds.
• TL∼ 225 K is the temperature of the water dynamical crossover. For lower
temper-atures the hydrogen bonded network, characteristic of water, is completely devel-oped and only a dynamics involving hopping processes, with a single characteristic time, is permitted.
[4] Bellissent-Funel M. C., Hassanali A., Havenith M., Henchman R., Pohl P., Sterpone F., van der Spoel D., Xu Y. and Garcia A. E., Chem. Rev., 116 (2016) 7673.
[5] Gallo, P., Amann-Winkel K., Angell C. A., Anisimov M. A., Caupin F., Chakravarty C., Lascaris E., Loerting T., Panagiotopoulos A. Z., Russo J.
et al., Chem. Rev., 116 (2016) 7463.
[6] Corsaro C., Spooren J., Branca C., Leone N., Broccio M., Kim C., Chen S.-H., Stanley H. E.and Mallamace F., J. Phys. Chem. B, 112 (2008) 10449.
[7] K¨ohler M. H., Barbosa R. C., da Silva L. B. and Barbosa M. C., Phys. A Stat.
Mech. Appl., 468 (2017) 733.
[8] Gibson R. E., J. Am. Chem. Soc., 57 (1935) 1551.
[9] Frank H. S. and Evans M. W., J. Chem. Phys., 13 (1945) 507.
[10] Koga Y., Mixing Schemes in Aqueous Mono-ols, in Solution Thermodynamics and its
Application to Aqueous Solutions (second edition), edited by Fedor J. (Elsevier B. V.)
2017, pp. 115–197.
[11] Kauzmann W., Adv. Protein Chem., 14 (1959) 1.
[12] Mallamace F., Corsaro C., Longo S., Chen S.-H. and Mallamace D., Colloids
Surf. B: Biointerfaces, 168 (2018) 193.
[13] Dixit S., Crain J., Poon W. C. K., Finney J. L. and Soper A. K., Nature, 416 (2002) 829.
[14] Dougan L., Bates S. P., Hargreaves R., Fox J. P., Crain J., Finney J. L., Reat V. and Soper A. K., J. Chem. Phys., 121 (2004) 6456.
[15] Yano Y. F., J. Colloid Interface Sci., 284 (2005) 255.
[16] Dougan L., Hargreaves R., Bates S. P., Finney J. L., Reat V., Soper A. K. and Crain J., J. Chem. Phys., 122 (2005) 174514.
[17] Soper A. K., Dougan L., Crain J. and Finney J. L., J. Phys. Chem. B, 110 (2006) 3472.
[18] Corsaro C., Maisano R., Mallamace D. and Dugo G., Physica A, 392 (2013) 596. [19] Lam R. K., Smith J. W. and Saykally R. J., J. Chem. Phys., 144 (2016) 191103. [20] Poˇzar M., Kerasidou A., Lovrinˇcevi´c B., Zorani´c L., Mijakovi´c M., Primorac T.,
Sokoli´c F., Teboul V.and Perera A., J. Chem. Phys., 145 (2016) 144502.
[21] Corsaro C., Mallamace F., Vasi S., Chen S.-H., Stanley H. E. and Mallamace D.,
Front. Phys., 13 (2018) 138201.
[22] Austin J. G., Kurata F. and Swift G. W., NASA Tech Briefs, 10274 (1968).
[23] Mallamace F., Branca C., Corsaro C., Leone N., Spooren J., Stanley H. E. and Chen S.-H., J. Phys. Chem. B, 114 (2010) 1870.
[24] Xu L., Kumar P., Buldyrev S. V., Chen S. H., Poole P. H., Sciortino F. and Stanley H. E., Proc. Natl. Acad. Sci. USA, 102 (2005) 16558.
[25] Ni Y. and Skinner J. L., J. Chem. Phys., 144 (2016) 214501. [26] Carper W. R., Concepts Magn. Reson. A, 11 (1999) 51.
[27] De Marzio M., Camisasca G., Rovere M. and Gallo P., J. Chem. Phys., 144 (2016) 074503.
[28] Chong S.-H., Chen S.-H. and Mallamace F., J. Phys.: Condens. Matter, 21 (2009) 504101.
[29] Debenedetti P. G. and Stillinger F. H., Nature, 410 (2001) 259. [30] Yip S., Mol. Simul., 42 (2016) 1330.
[31] Royall C. P. and Williams S. R., Phys. Rep., 560 (2015) 1.
[32] Mallamace F., Corsaro C., Stanley H. E. and Chen S.-H., Eur. Phys. J. E, 34 (2011) 94.
[33] Corsaro C., Mallamace D., Vasi S., Cicero N., Dugo G. and Mallamace F., Nuovo
Cimento C, 39 (2016) 301.
[34] Guo J. H., Luo Y., Augustsson A., Kashtanov S., Rubensson J. E., Shuh D. K., ˚
Agren H.and Nordgren J., Phys. Rev. Lett., 91 (2003) 157401.
[35] Guevara-Carrion G., Vrabec J. and Hasse H., J. Chem. Phys., 134 (2011) 074508. [36] Mallamace F., Corsaro C. and Stanley H. E., Sci. Rep., 2 (2012) 993.
[37] Mallamace F., Corsaro C., Mallamace D., Vasi C. and Stanley H. E., Faraday
Discuss., 167 (2013) 95.
[38] Mallamace F., Corsaro C., Mallamace D., Vasi S., Vasi C. and Stanley H. E.,
J. Chem. Phys., 141 (2014) 18C504.
[39] Gallo P., Amann-Winkel K., Angell C. A., Anisimov M. A., Caupin F. et al.,
Chem. Rev., 116 (2016) 7463.
[40] Mallamace F., Corsaro C., Mallamace D., Vasi S. and Stanley H. E., J. Chem.
Phys., 145 (2016) 214503.
[41] Chen S.-H., Liu L., Chu X., Zhang Y., Fratini E., Baglioni P., Faraone A. and Mamontov E., J. Chem. Phys., 125 (2006) 171103.
[42] Mallamace F., Baglioni P., Corsaro C., Chen S.-H., Mallamace D., Vasi C. and Stanley H. E., J. Chem. Phys., 141 (2014) 165104.
[43] Doster W. and Settles M., Biochim. Biophys. Acta Proteins Proteom., 1749 (2005) 173.
[44] Mallamace D., Fazio E., Mallamace F. and Corsaro C., Int. J. Mol. Sci., 19 (2018) 3825.
[45] Ferrario M., Haughney M., McDonald I. R. and Klein M. L., J. Chem. Phys., 93 (1990) 5156.
[46] Li R., D’Agostino C., McGregor J., Mantle M. D., Zeitler J. A., and Gladden L. F., J. Phys. Chem. B, 118 (2014) 10156.
[47] Nagasaka M., Mochizuki K., Leloup V. and Kosugi N., J. Phys. Chem. B, 118 (2014) 4388.