UNIVERSITÀ DEGLI STUDI DELLA TUSCIA DI VITERBO
DIPARTIMENTO per la INNOVAZIONE
nei sistemi BIOLOGICI AGROALIMENTARI e FORESTALI
Corso di Dottorato di Ricerca in Ecologia Forestale XXV ciclo
Applications of Airborne Laser Scanning for the spatial
estimation of forest structural parameters in Mediterranean
environments
SSD AGR/05Dottorando:
Dott. Rosaria CARTISANO
Coordinatore del corso Tutore
Prof. Paolo DE ANGELIS Prof. Piermaria CORONA
Co-tutore Dr. Anna Barbati
Ringraziamenti
Il mio ringraziamento va innanzitutto al Prof. Piermaria Corona e alla Dott.ssa. Anna Barbati per i preziosi consigli e suggerimenti.
Desidero inoltre ringraziare tutto il gruppo SisFor per il supporto costante durante questi anni.
Contents
1 Introduction and dissertation overview ... 1
1.1 Remote sensing and forest inventory ... 1
1.2 The role of Airborne Laser Scanning in fuel modeling ... 2
1.3 Objectives of the dissertation ... 4
1.4 Structure of the dissertation ... 5
2 Current applications of Airborne Laser Scanning for spatial estimation of forest structural parameters ... 6
2.1 Introduction ... 6
2.2 Data availability ... 7
2.3 Area-based and Individual Tree Crown approaches... 8
2.4 ALS - assisted assessment of forest stand and structure ... 9
2.5 ALS - assisted assessment of forest standing volume and biomass ... 10
2.6 Conclusions ... 13
3 Different applications of multi-temporal monitoring of variation in woody biomass availability for energy production in riparian forest ... 16
3.1 Introduction ... 16
3.2 Experimental methodology ... 17
3.2.1 Study area ... 19
3.2.2 Land cover change assessment ... 21
3.2.3 Growing stock and aboveground woody biomass assessment from forest ... 23
3.3 Results ... 25
3.4 Discussion ... 29
3.5 Conclusions ... 30
4 Analysis of the spatial variability of Mediterranean fuel models ... 32
4.1 Introduction ... 32
4.2 Dataset description ... 35
4.3 Experimental design ... 39
4.3.1 Experiment 1: use of ALS-derived metrics for the characterization of fuel types ... 39
4.3.2 Experiment 2: integration of raster ALS data and field survey for spatial estimation of target forest structural parameters ... 42
4.4 Experimental results ... 46
4.5 Discussions ... 59
5 Conclusions ... 61
Chapter 1
1
Introduction and dissertation overview
In this chapter an introduction to the dissertation is given. An overview on the remote sensing technology applied to forestry inventory and on Airborne Laser Scanner role in fuel modeling is presented. The main objectives of this dissertation are also shortly illustrated. Finally, the structure of the dissertation is described.
1.1 Remote sensing and forest inventory
During the past decades, forestry has been focused mainly on the assessment of timber resources and the management practices have been mostly addressed to the production of wood. In the past twenty years, this concept evolved and forests begin to be considered as a complex multi-functional system (Ciancio, 1997). For this reason it is important to acquire more accurate, timely information about their current status and, in particular, changes over time. This information is required for a range of spatial and temporal scales, from local forest inventories used for economic resource management purposes and updated annually, up to global data on carbon, water and energy fluxes required for environmental management over a number of decades (Cohen & Goward, 2004).
Remote sensing, involving the acquisition of information about a surface, object, or other phenomenon from devices that are not in contact with the feature under investigation, can play a crucial role in providing information across these scales. It is a useful tool for assessing forest condition and it notably supports forest monitoring, allowing the generation of data on large scale at regular time intervals.
There are two types of remote sensing devices that can be differentiated in terms of whether they are passive or active. Passive sensors detect only energy emanating naturally from an object, such as reflected sunlight or thermal infrared emissions; active sensors provide their own energy source as radar waves and record its reflection on the target. Each type of sensors has their own specialized purpose or task for which it was designed and often used for. (Franklin, 2001).
Lately, there has been a progressive evolution of remote sensing approaches for the collection of forest resource information: remote sensing with GIS and direct field
measurements have shown the potential to facilitate the mapping, monitoring and modeling of the forest resources. Remote sensing provide a systematic, synoptic view of earth cover at regular time intervals and it is useful for detecting changes in land cover and to assess aspect of biological diversity directly (Hall et al., 1988; Roughgarden et al., 1991; Turner et al., 2003; Cohen & Goward, 2004).
The proliferation of low cost, widely available, remotely sensed data has been the basis for many of the important recent technological improvements in forest inventory techniques. Forest inventory is the statistical estimation of the quantitative and qualitative attributes of the
forest resources in a given region. The assessment of the relationship between remotely
sensed data and the biophysical attributes of forest vegetation (standing wood volume, biomass increment, etc.) allows also the construction of maps of the attributes at the sample inventory units for the whole region of interest, i.e., the attributes can be predicted for all the pixels in the region producing maps. Remotely sensed data have not only contributed to
enhance the speed, cost efficiency, precision, and timeliness associated with inventories, but
they have facilitated construction of maps of forest attributes with spatial resolutions and accuracies that were not feasible even a few years ago.
In the present dissertation, specific attention will be given on active remote sensing, with a focus on Airborne Laser Scanning, based on a LiDAR system (Light Detection and Ranging
or Laser Imaging Detection And Ranging) mounted on an airplane or an helicopter. LiDAR is
an active remote sensing technique in which a pulse of light is sent to the Earth’s surface; the pulse reflects off of canopy materials such as leaves and branches. The returned energy is collected back at the instrument by a telescope. The time taken for the pulse to travel from the instrument, reflected off of the surface and be collected at the telescope is recorded. From this ranging information various structure metrics can be calculated, inferred or modeled.
1.2 The role of Airborne Laser Scanning in fuel modeling
In recent years, the topic of using of ALS data to describe fuel characteristics has been studied at a certain extent. Fire researchers and managers have long recognized the influence that fuel characteristics have on fire behavior and have attempted to incorporate key characteristics into models used to predict fire dynamics. Biomass estimates are needed to assess fuels, primary productivity, carbon content and budgets, nutrient cycling, treatment effects, and competition within plant communities; they are also needed to assess the effects of different fire regimes on plant communities (Murray & Jacobson 1982, Hierro et al. 2000).
Accumulation of fuel loadings in forest stands is an important determinant of fire frequency and severity (Paatalo, 1998; Cochrane et al., 1999). Therefore, information regarding the quantification and distribution of fuels in relation to time elapsed since last fire has been used to investigate how rapidly fires will spread, their intensity, and ultimately their ecological effects (Rothermel, 1972; Kauffman et al., 1994; Paatalo, 1998).
Fuel characteristics are difficult to measure for a number of reasons. For uniform forest stands, it is assumed that canopy biomass is uniformly distributed vertically, but this assumption does not hold true in a complex forest stand. This is due to multiple layers in the canopy, presence of ladder fuels and variation within tree species and within the forest stand. Although destructive sampling is the most accurate way to measure canopy fuels, it is not a desirable or effective way of acquiring data.
Quantification of vertical structure of the canopy is of importance to wildland fire managers, who are interested in managing the landscape for the reduction of ladder or transitional fuels that facilitate the spread of fire into the canopy (Skowronski et al., 2011).
Maps of fuel loading can also be used to predictfire behavior and guide operational responses
during active fire suppression, to prioritize areas for hazardous fuel reduction treatments, and to evaluate the effects of past fires or other disturbances.
Physical and chemical properties of fuels are characterized by significant variability across space and time. This variability took place according to daily (for example, the moisture content varies according to the weather conditions), seasonal and yearly modifications or in relation to specific processes that occur over decades (successional stages). The quantitative assessment of the fuel characteristics in a given area is generally unsuitable; however, the considerable need to predict fire behavior on a large scale through decision making support tools requires representing this complexity through mapping techniques (Rollins et al., 2004; Chirici & Corona, 2006).
LiDAR is a promising technology for generating reliable representation of the horizontal and vertical forest structure, due its capacity to scan wide areas and produce precise vertical and horizontal estimates of forest attributes (Ahokas et al., 2003). Recent studies highlight that fire behavior modeling can benefit from such technology because, in combination with optical remotely sensed images, it improves estimation of forest variables (e.g. Riaño et al., 2003; Mutlu et al., 2008; Erdody & Moskal, 2010). A certain number of studies, conducted mostly in temperate and boreal forests of Europe and North America, indicate the potential of ALS data for estimating tree or forest variables as a component of fuel models. For example, tree height can be readily estimated from the ALS point cloud (e.g. Magnussen et al., 1999;
Means et al., 1999; Lim et al., 2002; Næsset, 2002; Popescu et al., 2002; Corona & Fattorini 2008; Barbati et al., 2009). ALS technology appears more limited for predicting the characteristics of ground fuels (grass, shrubs, small trees), especially for low vegetation canopy heights (Riaño et al., 2007). The extraction of data on understory vegetation (e.g. percentage cover and height of the shrub layer) has been investigated in only a few studies (e.g. Harding et al. 2001; Riaño et al. 2003; Maltamo et al., 2005).
The utility of ALS data for characterizing forest ecosystems both for mapping forest classes or forest types and for estimating quantitative variables such as forest biomass, has been confirmed by some studies (e.g. Zhao et al., 2011; Corona et al., 2012). Many of these studies focused on estimating variables useful for fire management (Arroyo et al., 2008) and relied on the combined use of ALS with optical data (Mutlu et al., 2008; Koetz et al., 2008; Garcia et al., 2011).
All these authors identify the need for more research on the use of ALS data for these purposes, especially with reference to Mediterranean forest ecosystems, which are peculiar for their complex structural features.
1.3 Objectives of the dissertation
In this dissertation some of the main questions related to the use of ALS data for the assessment of forest structural parameters, with a special focus on forest stand height and aboveground biomass estimation, have been addressed. The distinctive overall target of this dissertation is to compare different ALS data and methods for assessing forest aboveground biomass under Mediterranean environments.
To accomplish this goal, the research has been set up according to specific objectives that can be summarized as follows:
1. to provide an overview of the current applications of ALS for forestry purposes in Italy, with a special focus on the spatial estimation of forest structural parameters; this objective has been covered by a detailed review literature, to obtain an exhaustive understanding of the topic;
2. to test the potential for innovation offered by ALS data for the spatial estimation of living aboveground biomass through the integration of ALS raw data and ALS-derived information and the application of different remote sensing techniques.
1.4 Structure of the dissertation
The dissertation is organized in five chapters. Chapter 2 provides general considerations, in the form of a scientific review, about ALS applications under alpine, temperate and Mediterranean environments in Italy; the analysis is supported by a remarkable number of case studies and provides special considerations to the common problems in the operational use of ALS systems. Chapters 3 and 4 are focused on the estimation of aboveground biomass using ALS data. Chapter 3 reports an experimental testing of raster Canopy Height Model for the spatial estimation of the aboveground biomass by coupling ALS data and field survey in a riparian forest. Chapter 4 reports an experimental testing of raw ALS data for detecting forest structural variables critical for fuel modeling. Various methods have been analyzed integrating remote sensing techniques with field measurements. The final chapter summarizes main outcomes drawn by the study and provides recommendations for future applications on research development.
Chapter 2
2
Current applications of Airborne Laser Scanning for spatial
estimation of forest structural parameters
1In this chapter general considerations with reference to selected experiences of ALS applications under alpine, temperate and Mediterranean environments in Italy are provided. The main issues concern the potential use for ALS data exploitation in forest inventories on large territories, their use for silvicultural systems detection and for the estimation of fuel load in forest stands.
2.1 Introduction
Information about the state and changes to forest stands is important for environmental and timber assessment on various levels of forest ecosystem planning and management and for the global change science community (Corona & Marchetti, 2007). Standing volume and above-ground tree biomass are key parameters in this respect. Currently, fine-scale studies have demonstrated the influence of structural characteristics on ecosystem functioning: characterization of forest attributes at fine scales is necessary to manage resources in a manner that replicates, as closely as possible, natural ecological conditions. To apply this knowledge at broad scales is problematical because information on broad-scale patterns of vertical canopy structure has been very difficult to be obtained. Passive remote sensing tools cannot help for detailed height, total biomass, or leaf biomass estimates beyond early stages of succession in forests with high leaf area or biomass (Means et al., 1999). Over the last decades, survey methods and techniques for assessing such biophysical attributes have greatly advanced (Corona, 2010). Among others, laser scanning techniques from space or airborne platforms have developed to the point where they can provide vertical profiles of forest vegetation.
As pointed out in the previous chapter, ALS systems provide a three dimensional point cloud, where over vegetated terrain some of the signals are caused by reflections in the
1
This chapter has been published on European Journal of Remote Sensing, Vol. 45, pp. 27 – 37, March 2012, with the title:“Airborne Laser Scanning to support forest resource management under alpine, temperate and Mediterranean environments”. Authors: Corona P., Cartisano R., Salvati R., Chirici G., Floris A., Di Martino P., Marchetti M., Scrinzi G., Clementel F., Travaglini D. and Torresan.
vegetation canopy and some by reflections at the ground surface (Hollaus et al., 2006). Basic elaboration processes involves the elimination of LiDAR returns identified as below the nominal ground surface or above the expected canopy height, then the remaining LiDAR returns from the ground are separated from those from above ground targets (Donoghue et al., 2007).
The airborne LiDAR back-scattered signals can be used as they are (i.e. point data or waveform) or they can be spatially interpolated to produce digital models. Signals from the ground are used to produce Digital Terrain Models (DTM) while above ground returns are used to produce Digital Surface Models (DSM). In areas covered by trees the algebraic subtraction of DTM from DSM corresponds to the Canopy Height Model (CHM), which provides a measure of the height of the upper canopy for each forest pixel in the surveyed area (Kraus & Pfeifer, 1998).
ALS data can convey a rich summary of forest features due to their ability to capture the forest heights: the accuracy of retrievable information is highly dependent on both the extrinsic specifications of the ALS survey as well as the intrinsic effects of the underlying forest structures. Most literature concerns applications under boreal environments (Maltamo
et al., 2005; Næsset & Gobakken, 2008).
2.2 Data availability
ALS data most commonly used for forestry applications under alpine, temperate and Mediterranean environments are not produced by dedicated flights: forest technicians simply exploit the raster CHM available at low (Clementel et al., 2012) or even no cost from ALS surveys carried out for purposes other than forest applications. In Italy around 30% of the land has been covered so far for accurate hydraulic modeling. Laser-scanning data are the best information source for this kind of models, that are necessary to prevent damages by floods, as well to assure water resources for people and agriculture.
However, surveys aimed to generate DTM or topographic measurements, to be used e.g. for land planning or hydrogeological purposes, are frequently characterized by a relatively low density of points per square meter and, above all, they are usually made in winter to minimize the noise by vegetation, since the aim is to achieve a high penetration rate through the vegetation canopy, i.e. to ensure that a high number of pulses reach the ground (Kraus & Pfeifer, 1998). In summer, penetration rates less than 25-30% are normally obtained under forest stands (Kilian et al., 1996). In the case of deciduous species (i.e. without green foliage during winter), which are those mostly frequent under temperate and Mediterranean forest
environments, these rates can significantly be raised by winter surveys (Ackermann et al., 1994): thus, commercial ALS flights for DTM production are almost always made between November and March under temperate and Mediterranean environments and even under alpine environments, at least in those areas not permanently covered by snow in that period. On the contrary the most favorable season to obtain ALS data specifically suitable for forestry applications under temperate and Mediterranean environments is summer, since in winter only the wooden part of the prevalently deciduous canopies generates LiDAR-significant returns (Clementel et al., 2012).
Summer and winter CHMs have been compared by Clementel et al. (2010) in an alpine site, showing strong correlation but with a systematic, significant stand height underestimation by the winter CHM. A tendency to slightly underestimate the real height is unavoidable with summer flights as well, because the pulse emitted by laser tends to penetrate into the canopy before a significant signal of return can be recorded and also, in the case of raster CHM, the point interpolation on regular cells determines a certain smoothing of tree height (Brandtberg
et al., 2003). However the stand height underestimation from summer ALS data is negligible
for most operative forestry purposes. In general, the most accurate information on the height of the upper canopy in forest areas can be obtained by comparing summer and winter ALS data for canopy height and DTM, respectively.
2.3 Area-based and Individual Tree Crown approaches
Experiences about exploitation of ALS data to support forestry are especially focused on: (i) qualitative and quantitative characterization of forest stands and description of their morphological and structural attributes; (ii) quantitative spatially explicit estimation of forest standing volume and biomass. Data sources and methods for this type of analysis is under evaluation at various scales: the value of LiDAR data derives from their ability to support the monitoring of ecosystem vertical structure which can be used to estimate aboveground ecosystem attributes.
There are two broad categories of ALS data analysis approaches to support forest inventory and management: area-based approaches (AB), called also statistical canopy height distribution approaches, and individual tree crown approaches (ITC).
In the AB approaches, plot level data is related to ALS data aggregated at plot level to estimate stand biophysical attributes; AB approaches relates CHM raster pixels or point ALS data to measured plot characteristics to build parametric (e.g. regression) or non-parametric models to predict the forest attributes of interest. Collective biophysical variables are
considered, referred to plots ranging from hundred up to thousand square meters; the established models have been shown to explain the majority of the variation in stand height, volume, and biomass (e.g. Næsset, 1997; Hudak et al., 2006; Hollaus et al., 2006; Garcia et
al., 2010).
The ITC approaches include all the methods based on the detection of the individual trees (or at least of the distinguishable trees) in a given forest stand. ITC approaches may use both raster CHM and point ALS data to build individual crown polygons and/or 3-dimensional tree profiles; these individual tree records can then be aggregated to any scale required to create stand-level or ecosystem-level estimates (Akay et al., 2009).
AB and ITC approaches to estimating biophysical attributes are not mutually exclusive, and several authors demonstrated how they can be combined (e.g. Lindberg et al., 2010; Vastaranta et al., 2012).
2.4 ALS - assisted assessment of forest stand and structure
The accuracy and coverage of ALS observations in forestry application is highly dependent on both the extrinsic specifications of the LiDAR survey as well as the intrinsic effects such as the underlying forest structure. Various AB approaches have been used to characterize and classify forest stands in terms of mean height. Floris et al. (2010) have observed a correlation coefficient of 0.90 between mean height data measured on the ground
(plot sizeof 1256 m2) and mean height measured on CHM in an alpine conifer forest. Barilotti
et al. (2005) and Fusco et al. (2008) have obtained similar results in mixed
conifers-broadleaves forests, and in mixed broadleaved coppices, respectively. Other features related to hypsometric variables detected by ALS have been proposed by Floris et al. (2009), like stand density and canopy roughness identifying the multi-layered or mono-layered structure of the stand: these descriptive features, appropriately combined, can be exploited to guide both the delineation of forest management units and to support forest stand stratification for inventory purposes.
Barilotti et al. (2005) have observed that the capability of the laser pulses to reach the ground in forest areas (laser penetration index, LPI) is inversely proportional to tree height and density of the stands; additionally, LPI proves to be closely and inversely proportional to the Leaf Area Index (LAI) measured on the ground, evidencing the potential of ALS data to feed ecological process models that rely on LAI assessment.
ALS data can be used for forest canopy gaps detection, which is relevant both for the ecological studies of stand dynamics and even to exclude the gaps from the sampling process
for inventory purposes so to increase the sampling efficiency. Barbati et al. (2009) have applied the hot-spot analysis based on the calculation of the local statistic variable Gi* of Getis-Ord (Getis & Ord, 1992) in a coastal Mediterranean pine forest. Bottalico et al. (2009) did a comparison between the hot-spot analysis and the morphological functions proposed by Koukoulas & Blackburn (2004) to extract gap boundaries. Floris et al. (2009) have adopted a rule of spatial contiguity on a minimum surface under alpine conditions. Barilotti et al. (2007a) have developed automated extraction of individual trees from CHM: they have been detected through a sequence of morphological transformations by a Top Hat algorithm implemented under open-source GrassGIS environment (Neteler & Mitašova, 2004). Top Hat is a mathematical function of image processing that allows to highlight the relief structures (Schmidt & Hewitt, 2004), which in the case of forest stands are constituted by the tree apexes. Barilotti et al. (2007b) have also developed the automatic delineation of tree crowns by the subsequent use of a segmentation algorithm able to classify the laser points in subsets belonging to the individual crowns. The technique has proved to detect less than 80% of the trees in the examined alpine conifer stands, and even less in stands mainly composed by broadleaved trees. In the latter case, the delineation of individual tree crown contours is generally difficult, due to the frequent high geometric irregularity of crown shapes, high local variation of foliage and branch density and the more pronounced tendency of tree crowns to interpenetrate each other than in conifer stands (Heurich, 2008). Abramo et al. (2007) have applied the methods developed by Barilotti et al. (2007a, b) in various types of spruce, beech-spruce-fir, beech-spruce-fir, spruce and beech forests, detecting 71% of the trees with a stem diameter at breast height (dbh) greater than 5 cm, 89% of the trees with dbh greater than 17.5 cm and about 94% of the dominant trees. ITC approaches based on segmentation algorithms was also used by Dalponte et al. (2011a), exploiting the algorithm developed by Hyyppä et al. (2001a, b), and by Forzieri et al. (2009), who have obtained acceptable results for stands where the ratio between the mean tree interdistance and the mean tree crown diameter is greater than 0.6.
2.5 ALS - assisted assessment of forest standing volume and biomass
Under alpine, temperate and Mediterranean environments the assessment of the forest standing volume and biomass has been mainly carried out by AB approaches (see 2.3). The strategy is to establish models predicting the stand attributes of interest on the basis of ALS-derived metrics. Such metrics are computed by the raw (point or waveform) ALS data, that
allow to calculate plot metrics like number of returns, above ground elevation of highest return, height percentiles, coefficient of variation of return height, skewness and kurtosis of returns height, non-ground percent of total returns, etc., or simply by the raster CHM values, that allow to calculate plot metrics like mean height per pixel, coefficient of variation of the height per pixel or the sum of the heights of all the pixels in the plot.
Corona et al. (2008) have examined the correlation between volume measured in circular
plots of 314 m2 and the sum of the CHM heights (raised to a power) within plots in a
temperate broadleaved forest. The relationship has proved to be heteroschedastic and linear through the origin, with correlation coefficient equal to 0.78. Starting from this finding, Corona & Fattorini (2008) have subsequently proposed a design-based approach for the AB ALS-assisted estimation of forest standing volume: adopting the height of the upper canopy at pixel level as auxiliary information, a ratio estimator of the total volume is derived, together with the unbiased estimator of its sampling variance and the corresponding confidence interval. With reference to the same above mentioned broadleaved forest, these authors have shown that the use of ALS data as auxiliary information can give rise to a confidence interval of the estimation approximately between half and two-thirds smaller than that obtained by field sampling plots only. Barbati et al. (2009) have tested the same estimation approach in a coastal Mediterranean pine forest, finding a correlation coefficient between the volume
measured in circular plots of 1256 m2 and the sum of the CHM heights within the plots equal
to 0.88. A study of Fusco et al. (2008) on mesophillous coppice stands confirms the relationship between the woody biomass and the sum of CHM heights, with a correlation coefficient equal to 0.87. Extensive AB experimentations for assessing forest standing volume under alpine environments have been carried out by Floris et al. (2010): these authors developed regression models between CHM metrics and standing volume measured in sample plots in spruce forests and found that the CHM mean height (excluding those pixels with height less than 2 m) can reliably predict the volume, with a correlation coefficient equal to 0.94. Under alpine conditions, Tonolli et al. (2011) have also analyzed the relationship
between the standing volume measured on plots with size ranging from 400 m2 to 3600 m2
and metrics obtained from point ALS data: the most explicative metrics resulted the mean height of the first return and, with much less importance, the median of the heights of the second return. These authors also found that the relationship is significantly influenced by the plot size, with correlation coefficient increasing from 0.7 to 0.8 in the considered plot size range.
For professional application purposes and, distinctively, for forest planning, it is interesting to assess the accuracy of the ALS-assisted estimation over forest areas of a certain size (e.g., an entire forest compartment). In this case, if the estimates of standing volume by ALS metrics are unbiased, a compensation of positive and negative errors can be assumed, and good overall accuracy is presumed. Floris et al. (2010) have examined this topic for a compartment of 10 ha in an alpine spruce forest where a full callipering was available, observing a difference of the estimate of the total volume less than 3% with respect to the true value. Moreover, ALS-assisted models allow to map the variability of the volume at sub-compartment level: this is an important and innovative issue for forest planning aims (e.g. harvesting planning), not achievable with the traditional forest inventory practices based on field plots only. Overall, the presented results demonstrate that AB approaches have now reached the maturity to be used for mapping forest canopy heights and stand volume and biomass under complex environments throughout large areas.
ITC approaches (see 2.3) to predict forest standing volume or biomass comprise various steps: (i) single tree detection, (ii) ALS measurement of the height of each detected tree, (iii) prediction of dbh of each detected tree by inversion of the height-dbh relationship established in the field, (iv) estimation of the volume of each detected trees through double-entry (height, dbh) volume equations. Beyond the mentioned difficulties to pinpoint single trees (even if this issue is relatively less relevant for stand volume estimation since most volume is due to the bigger trees, which are those normally more reliably detected), this approach significantly involves error propagation across the considered steps. The results by Dalponte et al. (2011a)
in alpine spruce forests shows that the capability of the ITC approach to assess tree dbh is
relatively low (about 6 cm of absolute bias on trees with dbh equal to 45 cm), with overestimation for dbh up to 40 cm and underestimation for larger dbh, and standard errors of
volume estimates around 0.7-0.8 m3 for trees with average volume around 2.3 m3. However,
for the whole 481 examined trees, the bias of the volume estimation is only -5%. A study by Abramo et al. (2007) shows that the differences between the volume assessed by field plots and that predicted by the ITC approach is equal to 5-6% for spruce stands (except for a case in which the difference was 11%), 10% for beech high forests and around 19% for beech coppices. On the other hand, it is difficult to infer from the above results the reliability of the prediction over large areas, since in this case species identification of each detected tree is required (distinctive height-dbh and volume models are valid for the different species), making mandatory the tree species reconnaissance, e.g. by fusion of ALS data with multi- or hyper-spectral optical data (Dalponte et al. 2008; Tonolli et al., 2011).
2.6 Conclusions
In the last years the interest of ALS applications is remarkably increased, because of ALS data ability to capture dimensional information of the Earth’s surface. The development of methodologies for ALS data processing has led to an increase of the number of applications also in forestry. Distinctively, in many boreal countries ALS techniques are already under operative use for obtaining information on forest standing volume, biomass and stand structural attributes. The overview presented in this paper highlights the relative suitability of ALS-assisted inventory procedures also with respect to alpine, temperate and Mediterranean environmental and operative conditions in Italy.
Under such conditions AB approaches have been much more applied than the ITC ones. However, these latter may have distinctive relevance when the interest is not only the assessment of forest standing volume or biomass but also the 3-D representation of forest stands, as required e.g. for ecological studies (e.g. habitat suitability studies) or for studies and simulations related to aesthetic preferences.
One of the main outcomes from the ALS area-based literature here considered is that mean height or median height or sum of the heights provides enough information for reliable estimation of forest standing volume, making even the simple auxiliary information provided by CHM very cost-effective to support forest inventories in many situations. This information is often available at low or even no cost from ALS surveys carried out for purposes other than forest inventories, while it is usually much harder or more expensive to get the whole original dataset of backscattered signal returns, as is required to compute metrics from ALS point or waveform data.
The possibility to integrate ALS data in forest inventory over large areas using probability sampling schemes is an aspect to be further developed. In this perspective, the availability of ALS data can range between full coverage over a given territory, where ALS data can be exploited as ancillary data known for the entire population so to adopt e.g. a ratio estimation approach like that proposed by Corona & Fattorini (2008), to a sample of the territory based on transects below the flight lines to spot samples within transects, so to adopt e.g. a multiphase/multistage estimation approach like those proposed by Gregoire et al. (2011) and Ståhl et al. (2011). Maselli et al. (2011) investigated the application of parametric and non parametric methods to Landsat satellite imagery in order to extend stem volume estimation from LiDAR data taken over few strips to the entire forest area.
A critical aspect of all the ALS-assisted procedures is the need for georeferencing and coregistration of both LiDAR measurements and ground truth locations. Ground reference
data collection represents an important element in the prediction of ALS-assisted estimation of dendrometrical attributes, and at present it is the most expensive part of such analyses. However, an experiment by Dalponte et al. (2011b) in an alpine site, where the presence of a complex landscape increases the uncertainty of the Global Positioning System (GPS) accuracy, has shown that the GPS error did not significantly influence the volume predict accuracy of AB approaches. These results, obtained in a complex mountainous area, allow to infer that similar (or better) results could also be obtained within non mountainous areas.
A poorly investigated topic is the ALS detection of silvicultural systems under temperate and Mediterranean conditions, i.e. the discrimination between high forest and coppice stands. So far, no published paper covers such an issue, that has been long remained unresolved by optical remote sensing: conversely, since ALS can pinpoint the vertical structural properties of a forest stand, it should provide effective support information to such an end. Moreover, it would be likely possible to detect understory in forest or new forest and other wooded lands in rural abandoned spaces rapidly growing. Preliminary evidences seem to indicate that ALS data can distinguish sparsely-distributed individual trees and shrubs on forest-pasture and forest-field ecotones (Sankey & Glenn, 2011).
Another relatively poorly investigated topic is linked to the attributes associated to the forest structure: for example, to what extent ALS information can be used in forest fuel models mapping, which is currently usually based on expensive field surveys. Few studies on this aspect (e.g. Seielstad & Queen, 2003; Mutlu et al., 2008) suggest the processing of ALS-derived metrics able to distinguish some fuel models used as input data in fire behavior models, as it improves the forest fuel parameters estimation either by using information processed from ALS point data, when ALS metrics are significant predictors of canopy bulk density and canopy base height for generating maps of canopy fuels for input into fire behavior models, such as in FARSITE (Peterson et al., 2007), or combining multispectral passive imagery (e.g. Riaño et al., 2003; Mutlu et al., 2008; Erdody & Moskal, 2010).
As mentioned, ALS paired with other optical remote sensing data is a well-established approach to spatially estimating forest attributes (Ioki et al., 2009; Straub et al., 2010; Breidenbach et al., 2010). The use of optical remote sensing data in conjunction with ALS data is helpful in both delineating crown boundaries and in differentiating between species. The ability to make species level distinctions is especially important when estimating merchantable timber volumes and biomass, as these attributes differ between species in trees that are the same size.
ALS technology is evolving very quickly and the forestry sector can directly benefit from it, as shown by the selected literature here presented and discussed. It is important to match processing methods with the appropriate scale and scope: some processing methods are valid at the plot scale, whereas other procedures perform well at the regional scale; to be effective, certain ALS data analyses require a minimum point density, whereas other methods perform well using large-footprint sensors (Pirotti, 2011).
Due to the expected technical innovations of ALS systems (e.g., see Koch, 2010), it can be assumed that ALS data will play a even more prominent role in estimation of forest standing volume and biomass in the next years. Multitemporal ALS survey will even be potentially effective to support the assessment of current annual volume increment and the detection of harvesting rates and stand structural degradation. However, it is still particularly important to relatively lower data acquisition costs, so to make ALS data even more accessible for dedicated professional application.
Chapter 3
3
Different applications of multi-temporal monitoring of variation in
woody biomass availability for energy production in riparian forest
2In this chapter an operational methodology to assess and map the aboveground woody biomass is presented. This approach couples optical remote sensing, ALS (raster CHM values) and field survey data and it is formulated as a case study on a poplar-dominated riparian forest in Central Italy. Experimental results point out the effectiveness of the proposed approach.
3.1 Introduction
As described in Section 2.5, many studies have been published in the literature dealing with the assessment of the aboveground biomass. In riparian forests, the high level of resilience and productivity of riparian tree species like Populus, contributes to the rapid biomass accumulation of riparian vegetation making these ecosystems of potential interest for biomass production for energy.
Natural river systems are dynamic bodies that continuously change as a result of their inherent physical conditions. Frequent disturbances like floods, caused by seasonal variation of weather conditions, affect flow patterns on a local scale originating a complex mosaic of landforms and biological communities (Gregory et al., 1991; Dècamps, 1996), making rivers the most active component of the rural landscape. Riparian vegetation is adapted to this periodical disturbance. It naturally regenerates on the replenished habitat created by the redistribution of river sediments during floods, playing an important role in the maintenance of stream and riverbank stability (Bradbury et al., 1995).
Riparian vegetation has an important function as a source of energy and matter for the aquatic ecosystems. In addition, riparian zones are an essential component of the integrity of river ecosystems, creating ecological corridors between other habitats, such as woodland, and promoting biological diversity at different scales.
2
This chapter has been published on Biomass and Bioenergy (2012) http://dx.doi.org/10.1016/j.biombioe.2012.10.023, with the title: “Assessing and mapping biomass potential productivity from poplar- dominated riparian forests: A case study”. Authors: Cartisano R., Mattioli W., Corona P., Scarascia Mugnozza G., Sabatti M., Ferrari B., Cimini D. and Giuliarelli D.
Besides these important ecological functions, riparian vegetation is also characterized by high biomass accumulation rates. Distinctively, riparian tree species like poplars and willows have generally high growth rates and a relevant resilience that allows them to recover ecosystem alterations in short times (Spinelli & Magagnotti, 2007). Because of the relatively high growth rates, riparian forests store large quantities of carbon whose estimation might be of interest for assessing bioenergy production potential in rural areas. In fact, the increasing biomass market is leading to a global re-evaluation of the multiple natural sources of energy. Current interest in biomass potential productivity from riparian forests is greater than in the past, when it was usually neglected due to the alleged poor quality. Nevertheless, very few studies have analyzed the potential of riparian vegetation as source of biomass for energy production and have considered the connected benefits
and drawbacks from the economic, environmental and management points of view (Recchia et al., 2010). Monitoring data and methods for assessing the status and the rapid changes of riparian ecosystems over large geographic areas are lacking. In addition, just a few published data are available on the quantification and change of the carbon stock from
riparian forests in comparison to other terrestrial ecosystems (Fail et al., 1986; Tufekcioglu et
al., 2001).
In this section, an experimental methodology for assessing and mapping the aboveground woody biomass is presented. The study is carried out on riparian forests that are characterized by rapid dynamics and high biomass accumulation rates. Results from this study provide a map at very high spatial resolution of the woody aboveground biomass that can be used to analyze its spatial distribution and to support the users for planning the harvesting.
3.2 Experimental methodology
Multitemporal land cover mapping is essential to investigate the dynamics of riparian vegetation. The rapid dynamic of riparian vegetation tied with ephemeral morphological and topographic conditions might lead to a quick obsolescence of the information acquired, thus demanding suitable change detection tools. Additional issues are related to human activities and land management (i.e. mineral extraction and agriculture) that can potentially affect biomass availability in riparian forest (Giese et al., 2003), making difficult to find an appropriate monitoring strategy. On the other hand, analyzing trends over large areas through a systematic monitoring approach is necessary to assess the conditions of riparian systems and the effectiveness of riparian management programs.
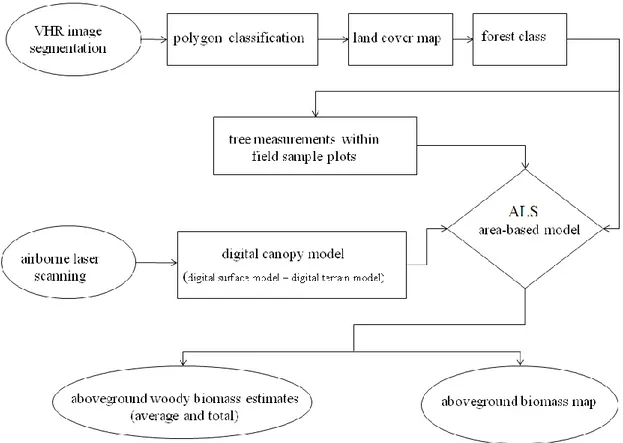
A methodology to quantify changes in riparian forest ecosystems and estimate variation in biomass stock, based on the integration of different remote sensing techniques (Fig. 3.1), is presented:
- land cover change detection by on screen interpretation of multitemporal high resolution orthophotos supported by automatic segmentation, exploited in the case study to quantify changes in the surfaces of riparian forests along a given river tract over a period of seventeen years (see Section 3.2.2);
- mapping aboveground woody biomass using spatialized biomass estimates at selected sampling plots representative of the investigated river tract by means of a spatially explicit model based on tree height canopy measured from ALS data (see Section 3.2.3).
Figure 3.1 - Flow chart of the procedure proposed to assess and map the aboveground woody biomass of forest vegetation.
3.2.1 Study area
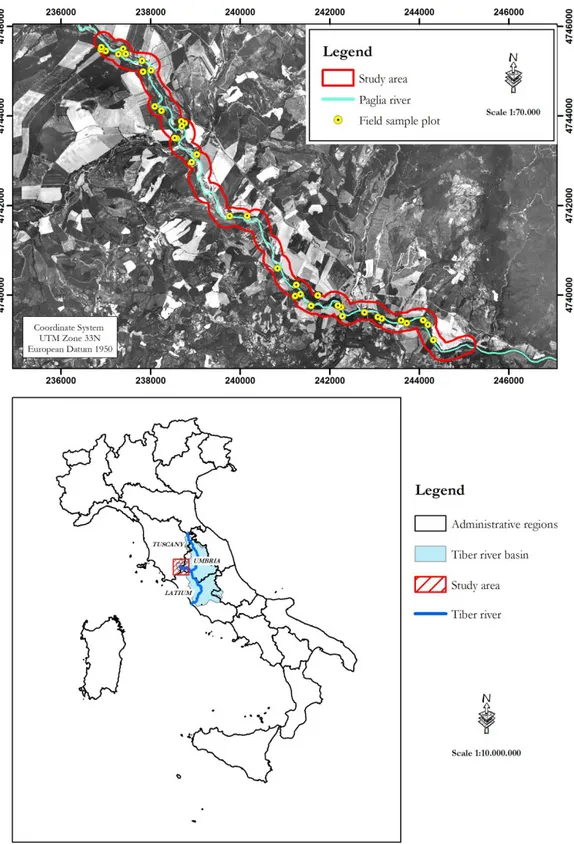
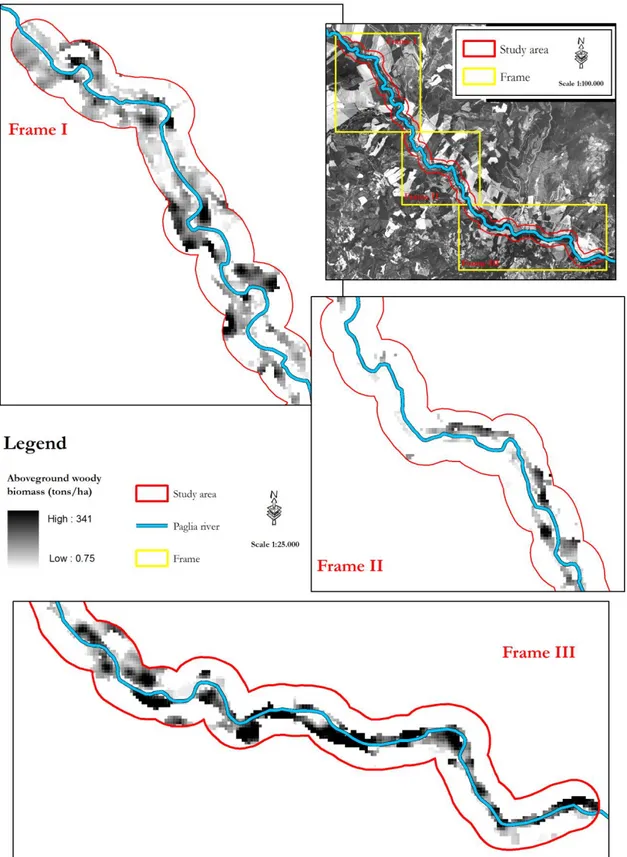
The selected case study is located in the Paglia Valley (lat. 42°47'14'' N; long. 11°48'44'' E), in Central Italy. Paglia river is a western tributary of the Tiber river (Fig. 3.2 bottom). A bottomland two hundreds of meters wide, along a 14.6 km tract of the river was analyzed (total area 560 ha), (Fig. 3.2 upper).
Paglia river drains a watershed of 1338 km2 (7.8% of the Tiber watershed) and more than
27% of this area is above 900 m a.s.l. The climate is classified as temperate Mediterranean characterized by a gradient in the average annual precipitation within the watershed. Peak flows are reached in 24-48 h with episodic high levels from fall to spring, while low levels are generally present throughout summer. Floods are closely related to snow and rainfall patterns and sediments deposited where the slowing water can no longer move them, provide essential areas for the regeneration of poplars and willows. The forest constantly changes over time as a consequence of natural disturbance caused by frequent flooding and by human activities (gravel extraction, clearcuts). The riparian vegetation is characterized by vertical and horizontal patterning, reflecting the strong influence of flooding and water availability on species distribution.
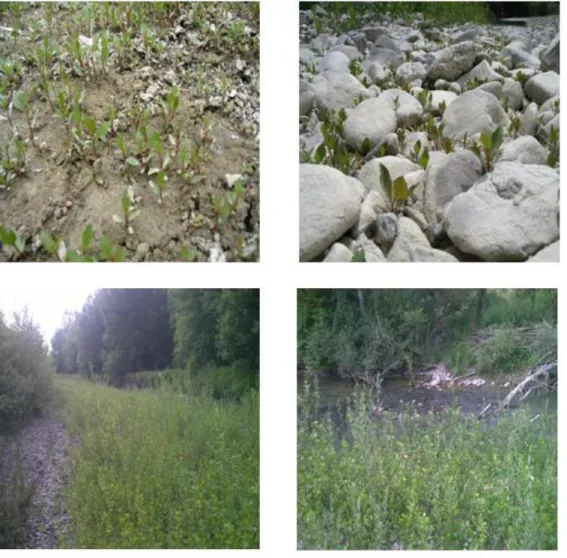
Tree stocking on the riverbanks is highly variable. Three forest types can be identified in the study area: (a) an uneven-aged poplar forest with abundant natural regeneration, both of gamic and agamic origin (Fig. 3.3), localized in the most dynamic areas of the river in association with willows (Salix spp.); (b) scattered groups dominated by alder (Alnus
glutinosa L.) in the most frequently flooded areas without drainage; (c) Turkey oak (Quercus cerris L.) coppices regularly managed for firewood production, located to a greater distance
from the river and less disturbed by the river dynamics. Secondary species, like Acer
monspessulanum L., Acer campestre L., Carpinus betulus L., Fraxinus angustifolia subsp. oxycarpa M.Bieb. ex Willd., Fraxinus ornus L., Malus sylvestris Mill., Prunus avium L., Pyrus piraster L., Robinia pseudoacacia L., Quercus pubescens Willd., Ulmus minor Mill.
can also be found. The shrub layer is represented mostly by Cornus mas L., Prunus spinosa L., Ligustrum vulgare L., Corylus avellana L., Crataegus monogyna Jacq., Sambucus nigra L.
Figure 3.2 - In the upper picture, the 200 m-wide buffer of the Paglia river investigated tract (14.6 km length) is shown with a black line; white dots show the location of field sample plots. On the bottom picture, the location of the study area at the boundary among Latium, Umbria and Tuscany regions (central Italy), within the Tiber river basin.
Figure 3.3 - Poplar natural regeneration on the Paglia riverbanks; seeds are produced every year and rapid germination takes place on moist mineral substrates.
3.2.2 Land cover change assessment
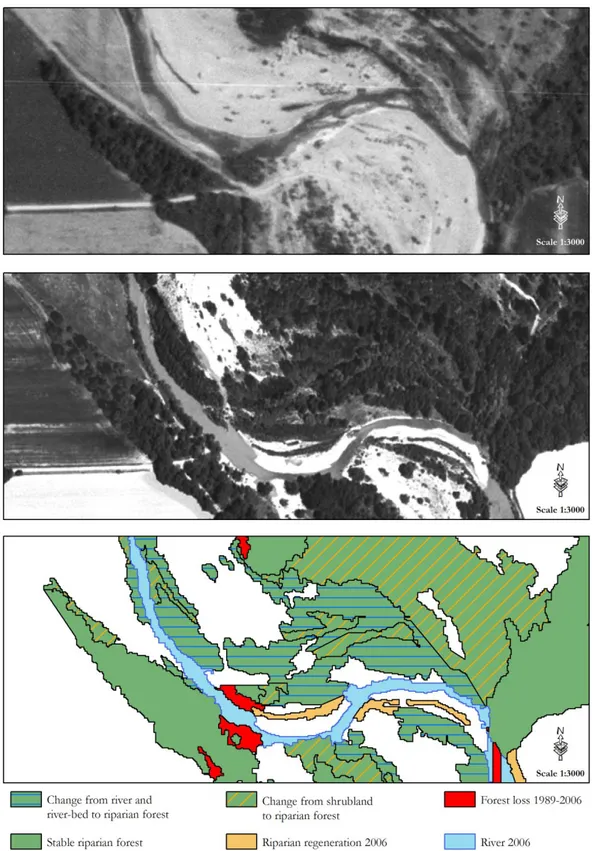
The dynamics of riparian vegetation was analyzed by comparing land cover maps produced by photointerpretation of one meter/pixel resolution greyscale aerial orthophotos, taken in summer in 1989 and 2006. The interpretation process was supported by an automatic multitemporal segmentation, using eCognition® software (Definiens Imaging, Germany), allowing the derivation of two multitemporal segmentation levels (i.e. a set of spectrally and spatially coherent objects), identical for both images (Fig. 3.4). The first level, with a scale factor equal to 100, a geometric homogeneity equal to 0.3, and a compactness equal to 0.9, was suitable to distinguish urban/arable areas from natural areas. At the second level of
segmentation, the scale factor was reduced to 50 to allow a correct identification of the limit of natural and semi-natural land classes.
Figure 3.4 - Example of land cover change over the considered period (1989 - 2006); in the upper picture, the summer 1989 aerial orthophoto; in the middle the summer 2006 orthophoto; at bottom, the post-segmentation classification of land cover change (scale 1:3000).
Land cover classes were identified for each polygon created by the second level of segmentation in the years 1989 and 2006: 1. artificial areas (including gravel extraction sites, rural buildings and industrial areas); 2. cropland; 3. riparian forest; 4. shrubland; 5. riparian tree regeneration area (colonized mainly by poplar seedlings); 6. river-bed; 7. river; 8. grassland; 9. Turkey oak coppices; 10. oak reforestation; 11. fruit orchards. Land cover changes from 1989 to 2006 were assessed with reference to minimum mapping units of 5000
m2 for artificial areas and cropland, and of 500 m2 for the other classes.
3.2.3 Growing stock and aboveground woody biomass assessment from forest
For 1986 the growing stock and aboveground woody biomass estimation was based on field sample plots. For 2006 the estimation was based on the ALS-assisted area-based approach proposed by Corona & Fattorini (2008), coupling ALS and field plots data.
For the field survey, 37 circular 531-m2-wide permanent plots were randomly distributed
across the area classified as forest. In the second inventory occasion, the center of each plot was geo-referenced applying a post-processing differential correction to the data recorded through a Global Positioning System (GPS) with an estimated accuracy of less than 1 m.
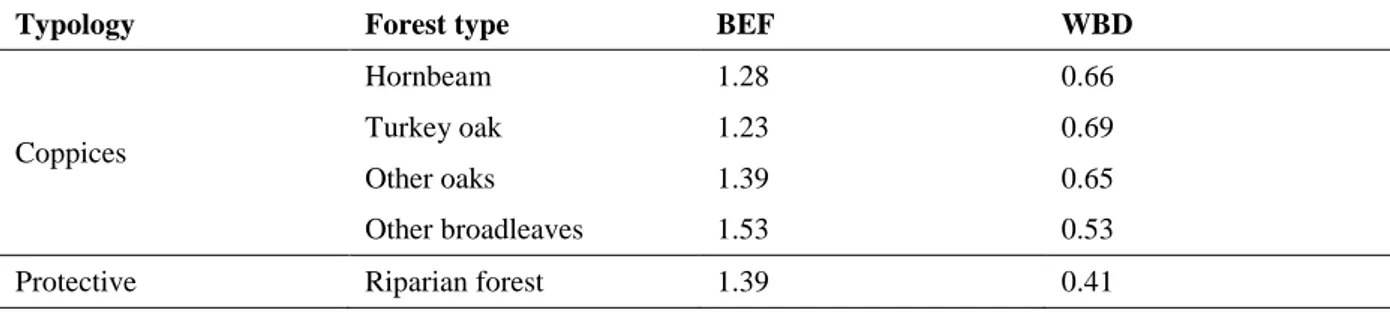
The diameter at breast height (dbh) of all the trees within each plot was measured with a calliper (minimum threshold of 4.5 cm) and, for a subsample, the height was detected. Growing stock (GS) of wood volume from each plot was computed on the basis of allometric equations, based on tree dbh and height, developed within the first Italian National Forest Inventory (Castellani et al., 1984). The growing stock of wood volume was converted to aboveground woody biomass (WB, expressed in Mg) by the application of the equation WB = GS*BEF*WBD, where BEFs are the biomass expansion factors and WBDs are the wood basic densities reported in Table 3.1.
The ALS survey was carried out by an ALS ALTM (Airborne Laser Terrain Mapper) Gemini which employed a laser at 1064 nm, installed on I-GIFE plane. The average flying height was 1300 m a.s.l., with a total scan angle of 23°. The swath width was 700 m and the light beam was 1 cm, with a vertical accuracy of 15 cm. A Digital Terrain Model (DTM) and a Digital Surface Model (DSM) with a geometric resolution of 1 m were produced through ALS data elaboration. The raster Digital Canopy Model (DCM) was derived by algebraic subtraction of the DTM from the DSM, providing the height of the upper canopy for each pixel included in the forest survey.
Table 3.1 – Adopted biomass expansion factor and wood basic density for each considered forest type (source: APAT, 2007).
Typology Forest type BEF WBD
Coppices
Hornbeam 1.28 0.66
Turkey oak 1.23 0.69
Other oaks 1.39 0.65
Other broadleaves 1.53 0.53
Protective Riparian forest 1.39 0.41
For the first inventory occasion, the estimation of the total of the aboveground woody biomass (and of the growing stock) was carried out by the classical estimator of simple random sampling without replacement. For the second occasion, the estimation was carried out according to the mentioned ALS-assisted area-based approach (Corona & Fattorini,
2008). Distinctively, the total (TA) over a given area A was estimated as
xA A kT Tˆ ˆ (1) where
N j j xA h T 1 (2)hj = height of the upper canopy provided by DCM for the j-th pixel
N = total number of pixels over the given area A
P T kˆ (3)
n i Ti n T 1 1 (4)where Ti is the aboveground woody biomass (or the growing stock) measured in the i-th
sample plot and n is the number of sample plots
n i Pi n P 1 1 (5) where Pi is the total of the heights (raised to power β) of the upper canopy provided by DCM over the set of the pixels belonging to the i-th sample plot.The standard error of was estimated as
n i i i A cT ckP n n T e 1 2 ˆ 1 1 ) ˆ ( ˆ (6)where c = A/a, with a equal to the sample plot size (expressed in the same measurement unit of A).
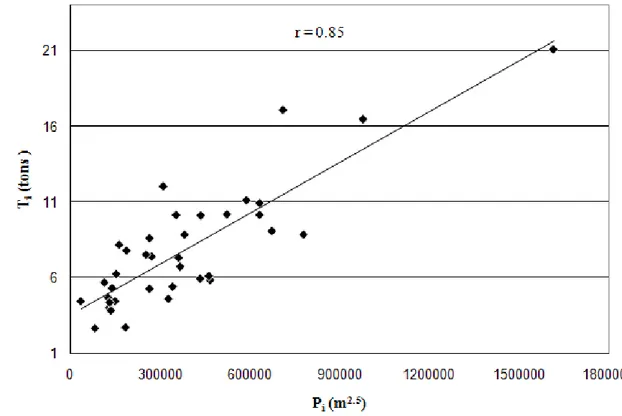
The value of the power β was pinpointed on the basis of the observed relationship
between Tis and Pis. The highest correlation coefficient and the lowest relative root mean
squared error were obtained with a value of β equal to 2.5 (Fig. 3.5), both for the aboveground woody biomass and the growing stock.
The adopted ALS-assisted area-based approach allowed also to map the aboveground woody biomass (and the growing stock) by multiplying by kˆ the total of the heights (raised to
power β) of the upper canopy provided by DCM for each 531-m2
-wide set of pixels covering the entire investigated area.
Figure 3.5 - Relationship between the observed aboveground woody biomass in the sample plots and the total of the heights (raised to 2.5) of the upper tree canopy provided by the raster ALS-derived CHM over the set of the pixels belonging to the same plots.
3.3 Results
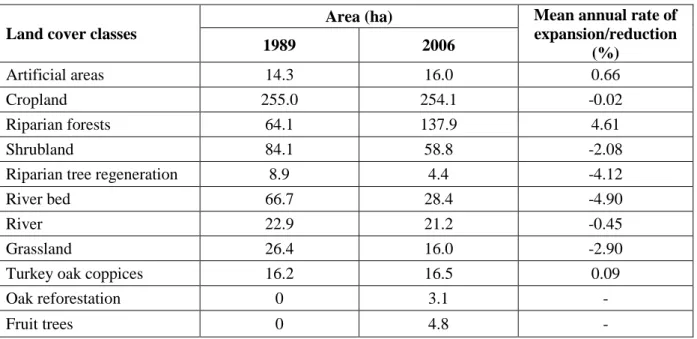
Land cover change over the observed period is shown in Table 3.2. The most substantial land cover change between 1989 and 2006 concerns riparian forests with a meaningful expansion of the poplar forest area. In spite of a decrease of 7 ha of the riparian forest, 81 ha of poplar forest were created with a mean annual rate of increase of 4.6 percent. Other expanding land cover classes are artificial areas and managed Turkey oak coppices, but both with a moderate increase. There have not been meaningful changes for cropland, while the
area of all the other land cover classes has decreased. The highest mean annual rate of area loss was observed in the river-bed class. Shrub vegetation and grassland have also shrunk significantly over the examined period.
Table 3.2 – Land cover classes in 1989 and in 2006 and corresponding mean annual rate
((17 1)*100
1989
2006 A
A ) of expansion/reduction.
Land cover classes
Area (ha) Mean annual rate of
expansion/reduction (%) 1989 2006 Artificial areas 14.3 16.0 0.66 Cropland 255.0 254.1 -0.02 Riparian forests 64.1 137.9 4.61 Shrubland 84.1 58.8 -2.08
Riparian tree regeneration 8.9 4.4 -4.12
River bed 66.7 28.4 -4.90
River 22.9 21.2 -0.45
Grassland 26.4 16.0 -2.90
Turkey oak coppices 16.2 16.5 0.09
Oak reforestation 0 3.1 -
Fruit trees 0 4.8 -
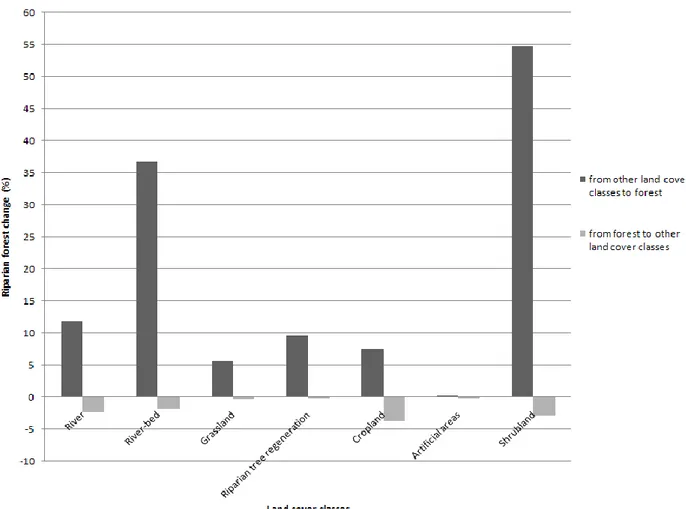
The most significant transition over the 1989-2006 period has concerned the shrubland change to riparian forest. Other main classes contributing to the riparian forest expansion were the river-bed and the river (Fig. 3.6).
Around 10 percent of the riparian forest comes from areas detected as riparian regeneration in 1989 and, finally, a slight increase of the riparian woodland was also due to the change from croplands. There were no substantial transitions from forest to other land cover classes: the river dynamic (expressed by the river and river-bed classes) has led to a loss of 4 percent in terms of area, while another 4 percent of the riparian forest was changed into cropland.
Figure 3.6 - Transition to forest from other land cover classes (in black) and from forest to other land cover classes (in grey) over the 1989 - 2006 period.
The total volumes assessed for the riparian forest and for the Turkey oak coppices in
2006 are 19,452 m3 (146 m3 ha-1) and 1650 m3 (100 m3 ha-1), respectively. The overall volume
in the surveyed area is 137 m3 ha-1. The total woody aboveground biomass of the riparian
forest is 5945 Mg (relative standard error = 21.8%) in 1989 and 11,650 in 2006 (relative standard error = 11.8%). The higher precision of the estimate from the second inventory occasion is due to the contribution by the ancillary ALS data through the adopted model-assisted procedure. Fig. 3.7 shows the map of the aboveground woody biomass in 2006: the highest values were recorded in the lower tract of the river, with a maximum value of around
3.4 Discussion
This study synthesizes the main outcome of a methodological exercise to test the assessment and mapping of aboveground biomass dynamics of a poplar-dominated riparian forest along a 14.6 km tract of the Paglia river, in Central Italy. The results show that the surface of riparian vegetation has significantly changed over the considered seventeen-years period. More than 70 hectares of new poplar-dominated forest were naturally regenerated during the 1989-2006 period, evidencing the rapid changes characterizing these environments. Shrub vegetation and grassland have decreased in favour of the riparian forest. Surfaces covered by river and river-bed in 1989 have been colonized by riparian forest as redistribution of river sediments during floods has favored the re-colonization of the newly replenished habitat. Over the examined period there were no substantial transitions from forest to other land cover classes. In the study area, the land cover changes have been probably influenced by human operations causing the variation of the hydrological regime due to flood protection measures and extraction activities impacting the morphology of the riverine system. This has determined the presence of locations where silt and clay settle out and poplar seedlings find
suitable conditions for a quick establishment.
The main motivation of this work was to gather reliable information at high spatial resolution on the biomass potential from riparian forest environments, for which very few data can be found in the literature. Multitemporal optical remote sensing data, combined with the imagery segmentation process and improved by ALS data in the second inventory occasion, have allowed the rapid identification and quantification of the surfaces affected by the dynamics of riparian vegetation. Distinctively, the survey approach here proposed, based on the ALS-derived CHM, has proved to be highly effective to support the assessment of the riparian forest wood volume and biomass, providing comparable results in terms of accuracy to previous experiments carried out under different forest environments (Corona & Fattorini, 2008; Corona et al., 2008). Using solely canopy height, instead of more sophisticated ALS metrics, leaves out some information, but this survey approach is truly feasible from a practical point of view: first of all, full coverage of raster CHM is often available at low or no cost (as a byproduct from ALS surveys on large territories committed, mainly by public administrations, for purposes other than forest applications) while it proves to be much more expensive (or harder when public administrations are the data owners) for forest professionals to get the whole original data sets of back-scattered LiDAR signal returns, as is required to calculate more sophisticated ALS metrics; furthermore, the handling of raster CHM is much
more straightforward for forest professionals than the handling of the original data sets of back-scattered LiDAR signal returns.
A map of the aboveground woody biomass, as produced in this study, can be used to analyze its spatial distribution so to support the users for planning the precision harvesting of aboveground woody biomass of riparian stands, whose distribution is usually not homogeneous, as demonstrated by the case study: in the examined river, a maximum value of
about 340 Mg ha-1 was found in the last tract of the sampled area while much lower values
were assessed in the middle tract where the proximity of the extraction quarries has continuously influenced negatively the regeneration of the riparian forest.
Coupling the cleaning of the river bed for hydraulic maintenance to the utilization of the obtained biomass for energy production may offer relevant opportunities for the energy biomass supply: harvesting practices can be safely encouraged given the assessed high regeneration capacity of riparian forests. Nearby the case study, harvesting rates of 80-85%
(around 70 Mg ha-1) of available biomass in poplar-dominated riparian areas managed with
clearcut did not have a negative impact on the preservation of the riparian forest; these areas, in fact, appear to be immediately recolonized by poplar regeneration. However, the percentage of the deliverable biomass has to be modulated depending of the levels of the hydraulic risk, affecting the different tracts of the river. Despite this, such interventions appear to be economically sustainable for the energy production (Spinelli & Magagnotti, 2007; Spinelli, 2005) and for the actual working conditions, generally favorable to the harvesting operations.
3.5 Conclusions
Woody biomass from riparian forests may constitute an important source of biomass for the small-scale energy production. In the examined case study, an average aboveground
woody biomass of about 90 Mg ha-1 was assessed within poplar-dominated riparian forest,
corresponding to an amount of available biomass of 800 Mg km-1 along the river axis. For
comparison, in Italy the riparian forests, which cover nearly 0.3 million hectares (i.e. 1% of
the national land area), are characterized, on average, by woody biomass around 60 Mg ha-1
(INFC, 2005). A recent study by Spinelli & Magagnotti (2007) estimated the biomass
available from the cleaning of river beds to be higher than 400 Mg km-1, assuming a selective
wood removal: such an amount, albeit lower than those usually exploitable from specialized forest crops, highlights the unnegligible woody biomass harvesting potential within riparian environments.
Under such a perspective, the innovative strategy here proposed to assess and map at a very high spatial resolution the aboveground woody biomass of riparian forest meets the monitoring requirements to support energy production based on modern, non-conventional biomass harvest planning options (Lasserre et al., 2010).
Chapter 4
4
Analysis of the spatial variability of Mediterranean fuel models
In this chapter an experimental test for investigating the structural variability of Mediterranean fuel models is presented. An analysis of the effectiveness of ALS raw and raster data in the estimation process is performed and two different methodological approaches coupling ALS data processing with field sampling are presented . Experimental results from this analysis highlight the potential of ALS data to provide detailed map of the spatial distribution of forest fuels and the quantification of the structural parameters able to characterize fuel types.
4.1 Introduction
An accurate description of the forest in terms of fuel conditions is essential to support fire management and to predict fire risk (Chuvieco et al., 2004).
The description of fuels is extremely complex because multiple variables must be considered. The total amount of biomass in the different forest components (herbs, shrubs, trees), fuel structural characteristics (surface-area-to volume ratio, fuel density, fuel loading, height and stratification of fuel strata), fuel chemical composition and moisture content all
affect fire behavior. To simplify the description of a forest area in terms of these
characteristics, vegetation types with similar fuel conditions are grouped together under "fuel types". Forest areas classified within the same fuel type have similar fire hazard and/or fire propagation behavior (Hardy, 2005; Pyne et al., 1996).
Several fuel type classification systems are used worldwide (Arroyo et al., 2008). One of the most widely used is the system of 13 standard fuel types developed by the Northern Forest Fire Laboratory (NFFL), Rocky Mountain Research Station, U.S. Forest Service (Burgan & Rothermel, 1984) and used for input by the most common fire simulation models (Behave, Farsite). These fuel type models, known as standard Fire Behavior (Albini, 1976; Burgan & Rothermel, 1984), were designed to describe the characteristics of surface fuels over large areas. Fuel types associated with the different forest cover types may fall into grassland, shrubland or ground litter types depending on the vertical structure of fuelbeds and, accordingly, the fuelbed stratum identified as the main vector for surface fire propagation