e-Commerce website performance
and user-perceived web quality
A bi-dimensional and
multi-methodological framework
All rights reserved. ISBN: ISBN-13:
Part I – Background
1. Introduction Pg. 7
2. Literature Review Pg. 16
Part II – Quantitative Techniques for conversion rate management
3. Determinants of e-commerce conversion rate Pg. 33
Part III – Qualitative Techniques for the online service quality
4. Kano Model for e-commerce website quality Pg. 44
5. Pareto Chart for the UPWQ in e-commerce Pg. 62
Part IV – Final Remarks
6. Conclusion Pg. 81
7. Bibliography Pg. 88
ACNOWLEGMENTS
Firstly, I would like to express my sincere gratitude to my advisor Prof. Gandolfo Dominici, not only for the continuous support during my PhD studies and related researches, but also for is role as “kybernetes” for my life. His guidance helped me in all the time in work- life balance, in research activities and in writing of this thesis. I could not have imagined having a better advisor and mentor for my PhD studies.
I would also like to thank my thesis advisor Prof. Arabella Mocciaro Li Destri of the University of Palermo. Her door office was always open whenever I ran into a trouble spot or had a question about my research or writing. She consistently steered me in the right the direction whenever she thought I needed it.
Besides my advisors, I would like to thank my collegue Dr. Walter Vesper, Dr. Roberto Musotto, Dr. Ivan Nania, Dr. Vittorio D’Aleo, Dr. Giacomo Morabito and Dr. Salvatore Lo Bue, for their insightful comments and encouragement, but also for the hard question which incented me to widen my research from various perspectives.
Finally, I would like to thank my wife Alessandra Reina: I particularly appreciated her patience and motivation to conduct my studies. Without her precious support it would not be possible to complete this PhD course.
Part I
CHAPTER ONE
INTRODUCTION
1.1 Premise
Nowadays, the widespread diffusion of personal computers, smartphones and tablets, combined with the ease of Internet access, has multiplied online purchase opportunities. Shopping online has become a widespread phenomenon all around the world, and the Internet has become a new megastore for the commercialization of products previously sold through traditional channels (Moretti et al., 2017).
Specifically in 2015, online world sales grew by more than 20% with respect to the previous year, reaching almost 1,600 billion dollars. The online market represents about 6% of the entire retail sector (EMarketer, 2016).
Yet all that glitters is not gold: 96% of website visits do not end with purchases (McDowell et al., 2016). Retailers thus need to manage a significant problem: the low value of the purchases-to-visitors ratio, commonly called the conversion rate (Farag et al., 2003).
Generally speaking, the conversion rate on e-commerce website is about 2%–4% (Holzwarth et al., 2006; Sohrabi et al., 2012).
Previous studies of conversion rate management argued that these low values are due to several reasons: sometimes online products have high prices (Wolfinbarger and Gilly, 2003; Grewal et al, 2004); buyers are price sensitive, because competitors websites are just a click away (Clarke, 2001; Frost et al., 2010); there is risk of a security breach of consumer personal information, credit cards, or other payment methods (Koufaris & Hampton-Sosa, 2004; Chen and Barnes, 2007); and trust (McKnight & Cervany, 2001; McKnight et al., 2002).
This is only a brief overview of the topics discussed in detail in Chapter 2, which consists of a review of the conversion rate management literature from the retailer point of view and of user-perceived web quality (UPWQ) from the customer point of view.
1.2 Research Proposal
Given this premise, online retailers make significant efforts to manage functionalities that can, on one hand, attract visitors and convert them to purchasers (Ayanso and Yoogalingam, 2009); on the other hand, web retailers must also cut costs, providing an accessible business model, considering that e-commerce is a strategy for rapid growth, especially for small and medium-sized enterprises (Grandon et al., 2011).
This thesis aims to provide an original contribution using a bilateral and multimethodological framework for the e-commerce phenomenon: it gathers the research activities performed during
the three years of a PhD program and represents a point of contact between qualitative and quantitative methods. Indeed, the novelty of the framework proposed here is that it is able to capture both commerce website performance from the sellers’ point of view and the user-perceived web quality (UPWQ), using respectively quantitative and qualitative approaches.
The rationale is that, on one hand, online retailers are interested in maximizing their e-commerce conversion rate; on the other hand, website users expected a certain qualitative standard. If the determinants of the conversion rates converge with the factors that determine the quality perceived by users, a virtuous circle for both parties could arise. The aim of this research is to shed light on such a win–win strategy (Nowak, 2006), both for online retailers and for purchasers, by identifying features that increase the user-perceived web quality and boost the conversion rate.
In this way, the proposed framework is bilateral, as it considers both the perspective of the sellers and of the purchasers; it is also multi methodological: indeed, e-commerce phenomena will be analysed using both qualitative and quantitative methodologies so as to provide a better understanding of the conversion rate (from the sellers’ point of view) and website quality (from the purchasers’ point of view).
Mingers and Brocklesby (1997) have defined a methodology as a structured set of guidelines or activities to assist people in undertaking research or intervention. Generally, a methodology
will develop, either implicitly or explicitly, within a particular paradigm, and will embody the philosophical assumptions and principles of that paradigm. This thesis is concerned with linking two paradigms—the points of view of sellers and purchasers—to look towards the possibility of paradigm commensurability.
Specifically, after a review of the literature (Chapter 2), the research begins with an econometric study of the variables that determine the conversion rate; this is based on the literature, but involves original contributions, explained in detail in Chapter 3. It employs a fixed-effect estimator capable of capturing some a priori differences between websites.
In the second part, there is a shift to a qualitative approach using the Kano model (Chapter 4), which is a theory of product development and customer satisfaction created in the 1980s, and which classifies customer preferences into five categories. This chapter will consider in greater detail the factors that affect website quality in terms of perception by customers. This research thus revises the model of Barnes and Vidgen (2002) of perceived website quality (Chapter 5), considering Pareto Charts (Juran, 1951) used to analyse data on the frequency of problems or causes in a process. The aim of this section is to develop an e-commerce website-specific research design by adapting a model designed for generic websites to e-commerce sites (Chen and Dubinsky, 2003). With respect to the qualitative methodology (explained in detail in later sections), the use of the Pareto Chart and the Kano conceptual model is based on their commensurable paradigms: both
12
approaches stat that a small number of “causes” can explain the majority of the “effect” (Wilson, 1972; Griffin and Houser, 1993).
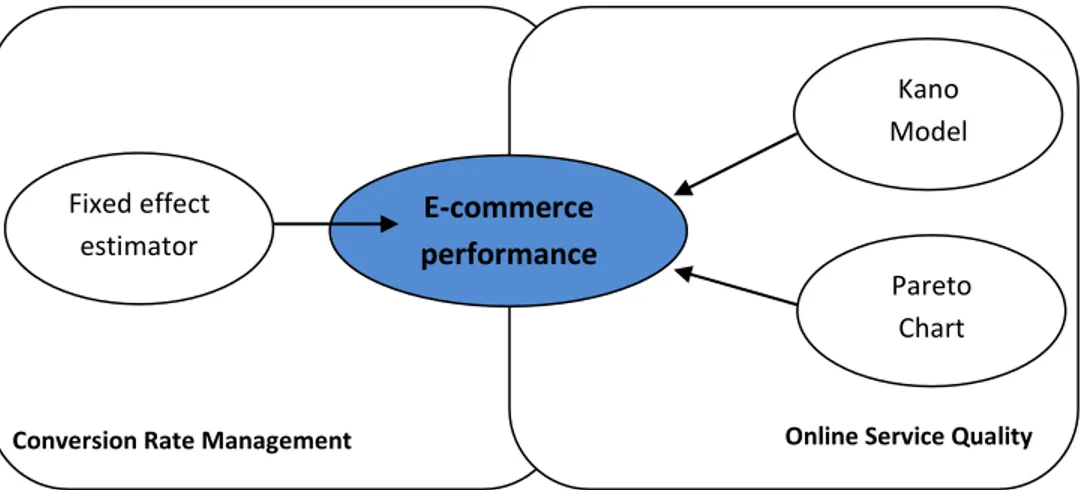
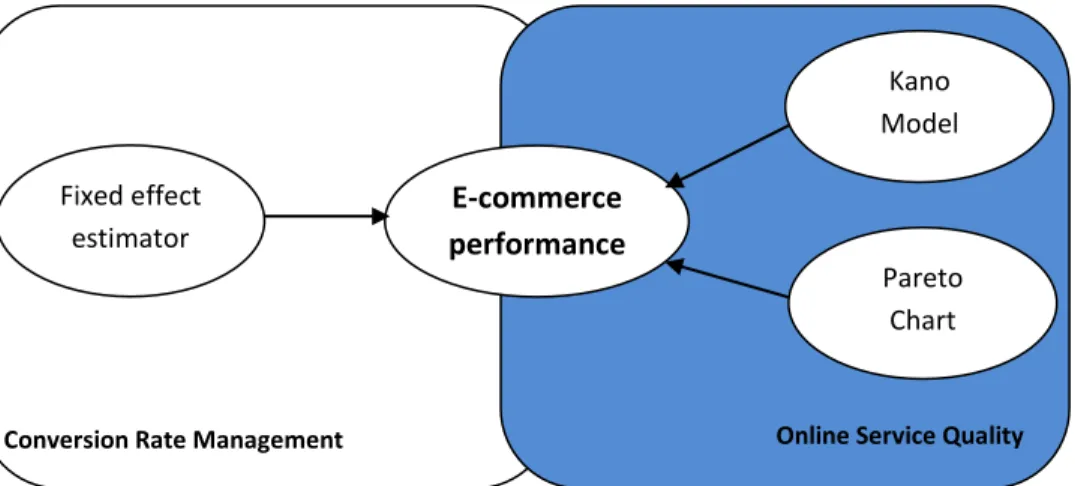
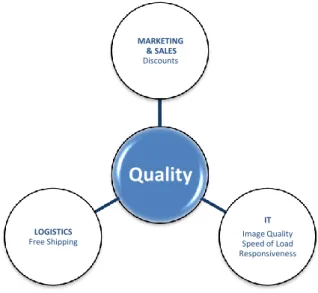
In summarizing, our research question in the quantitative analysis is “Which factors affect e-commerce conversion rate?” (RQ1). In the second step, employing qualitative methodologies, the research question is “Which factors affect user-perceived e-commerce website quality?” (RQ2). The full set of methodologies (or conceptual models) adopted are summarized in the following picture, paying attention to their respective theoretical backgrounds: RQ1 relates to the above-mentioned studies on conversion rate management, and RQ2 to the online quality literature; both are analysed in Chapter 2. The bidimensionality is this given by considering the point of view of the sellers (conversion rate management) and of the buyers (online service quality). The multimethodological approach arises by combining qualitative and quantitative techniques.
Figure 1: Research Design
Conversion Rate Management Online Service Quality
E-commerce performance Kano Model Pareto Chart Fixed effect estimator
It is also important to comment briefly on the findings, because the originality of this thesis relies on the convergence between quantitative and qualitative techniques to identify some common factors that increase user-perceived quality and at the same time, boost conversion rate—such as discounts, free shipping, and ease of use of the website.
Building on these results, the final section also provide s relevant practical implications for managers involved in online business, and may prove useful in better allocating resources to the most critical factors that affect e-commerce performance, including both the determinants of conversion rate management and the qualitative analysis of customers’ feelings and perceptions.
In summary, this thesis aims to identify the common factors that on one hand enhance the experience of the user browsing an e-commerce website (perceived web quality), and on the other hand increase the ratio of sales to website visitors (conversion rate).
A win–win strategy arises when these factors are aligned for both retailers and purchasers. This situation has the potential to produce a virtuous circle that increases the perceived quality (which is valuable to customers) and boosts sales (valuable to retailers).
1.3 Structure of the Thesis
This thesis represents a gathering of research activities performed in the past three years, merging the quantitative
of Messina, Italy, at the Bertinoro Summer in Panel Data (Bertinoro, 2014), and at the Structural Equation Modeling Summer School (UniCal, 2015), with the qualitative approach characterizing the SEAS Department at the University of Palermo, Italy, and in collaboration with Professor Gandolfo Dominici and with participation at the Content Analysis Summer School (UniPa, 2016) conducted by Klaus Krippendorff, founding father of the this methodology.
The present manuscript is d ivided into four parts which constitute a unitary design to provide a multilateral approach to e-commerce website performance.
Specifically, the first part (“Background”) is divided into two chapters: an introduction (Chapter 1), which aims to contextualize the phenomenon of online retailing through e-commerce websites, and a literature review (Chapter 2), which provides a theoretical framework for the previous studies in the field of conversion rate management and user-perceived web quality (UPWQ).
The second part, c o ncer n e d wi t h quantitative techniques, is devoted to a n analysis of the conversion rate from the perspective of the seller, investigating what levers a r e useful f o r increasing conversion rates, a n d thus sales. This section deals with quantitative research activities for capturing the determinants of conversion rate, which will also be analysed from the qualitative point of view in the third section.
The third part deals with qualitative techniques and analyses the quality as perceived by the user of the e-commerce website.
This part is divided into two chapters, each treating one of the methods used: the Kano model in Chapter 5 and the Pareto Chart for UPWQ in Chapter 6.
The fourth and final part provides a brief summary of the main findings and concluding remarks, while also suggesting useful insights in terms of practical implications.
In line with the guidelines of the PhD board, each chapter is designed to be publishable alone.
1.4 Preliminary Definitions
Bidimensional: considering the points of view of both retailer and purchaser.
Conversion rate: the ratio of e-commerce sales to website visitors.
Multimethodological: linking two paradigms—the
quantitative and qualitative.
User-perceived web quality (UPWQ): the quality perceived by users who navigates a website on the Internet.
Win–Win strategy: a piece of terminology from game theory referring to possible outcomes of a strategy in which all participants profit.
CHAPTER TWO
LITERATURE REVIEW
Keywords: conversion rate management, online service quality, user-perceived web quality.
2.1 State of the art
The present dissertation will follow a bi-dimensional perspective aiming to consider both the seller and the retailer point of view. The guideline will be an ideal feel rouge that will cross the entire manuscript, including this literature review.
This chapter is, indeed, divided around two broad concept: section 2.2 will discuss the quality perceived by e-commerce users / buyers; section 2.3 will deal with the issue of conversion rate management to understand, from the retailers’ perspective, in order to understand which features help to boost sales.
The purpose of the thesis is to identify the common factors that concerning on the one hand the enhancement of the website user experience (online perceived quality), and on the hand, change in the conversion rate.
When these factors are aligned, a win-win strategy arises (Nowak and Sigmund, 1993; Nowak, 2006), giving rise to a virtuous circle that increases the perceived quality (customer point of view) and boot sales (retailers point of view).
2.2 Online Service Quality
The literature on service quality is abundant (Grönroos, 1984; Parasuraman et al. 1988; Cronin and Taylor 1992), but according to (Gounaris and Dimitriadis, 2003) “very little work has-been done on the
assessment of the quality of services delivered over the Web” (p. 530), in other
words the online service quality or electronic service quality (e-service quality).
Before dealing with online service quality, it is necessary a preliminary definition about online services. Starting from the conceptualization of the phenomenon, currently there is not a unanimously accepted definition of online services. A first proposal, still today widely accepted, is provided by Grönroos (1984), which stated online services are composed predominantly of two dimensions: a functional type, which refers to the effects of abuses, and a technical, related to development of the service.
This approach is supported by several authors which claim that the definition of on-line service should go beyond the mere conceptualization of electronic commerce (e-commerce) taking into account all the issues and interactions that occur during and after the delivery of electronic services: forum, blog etc (Rust and Lemon,
2001; Parasuraman et al., 2005; Yan and Jun, 2002; Bauer et al. 2006; Rowley, 2006).
Another definition, following Boyer et al. (2002), considered e-services those delivered on the internet using advanced telecommunications, information, and multimedia technologies.
Regardless of the definition, there are some common aspects to all online services that help you narrow (and thus define) this concept. There is a general agreement in the previous literature about the multidimensional nature of the construct of e-service quality (Olšina et al. 1999; Aladwani and Palvia, 2002; Kim and Lee, 2002; Kim and Stoel, 2004; Bauer et al., 2006; Barrutia and Gilsanz 2009).
It should also be noted that these studies are very heterogeneous and they are focused on products that are extremely diverse, ranging from the banking sector, academic institutions and clothing. Indeed, the relevant quality attributes may differ from product to product, or from sector to sector (Elliot and Fowell, 2000).
In this section, our aim is not only review the previous studies, but start to “lay the groundwork” in order to provide a framework context specific e-commerce website and the related perceived quality.
2.2.1 A brief history about e-service quality
The quality of service is the result of the comparison on two aspects: on the one hand between expected service and perceived
service; on the other hand, between technical and functional quality (Grönroos, 1984 and 1990).
Parasuraman et al. (1988) introduced the SERVQUAL model, based on the difference between perception and expectation of the consumer than five factors: (1) Reliability: it is the ability to deliver the promised service with reliability and accuracy. (2) Responsiveness: it is the willingness to help customers and provide prompt service. (3) Security (or assurance): it is the knowledge and courtesy of employees and their ability to convey trust and confidence. (4) Empathy: it is the ability to provide customers with personalized attention and consideration. (5) Appearance (or tangibles): it relies on physical facilities, equipment, personnel and communication materials. The perceived quality of service was measured as the difference, in amount and direction, between the scores of expectation and perception of service for each of the five factors.
Cronin and Taylor (1992) proposed a different approach to assess the quality of services based exclusively on the evaluation of services obtained, the so called SERVPERF. Basically the difference between SERVEPERF and SERVQUAL is that the first model analyzes how well a service satisfies customer expectations, considering only their perceptions (SERVPERF or perceptions-only); the second model considers the gap between perceptions and expectations (SERVQUAL or perceptions vs. expectations).
The superiority of one of the two models on the other has long been debated: Cronin and Taylor (1994) responded to concerns raised by Parasuraman about the relative efficacy of their quality
measures. Other scholars (Jain and Gupta, 2004) argued SERVPERF provide a more convergent and discriminant explanation of service quality, but it has weak diagnostic power. Instead SERVQUAL has a higher diagnostic power to pinpoint areas for managerial interventions.
According to Gounaris et al., (2005) and González et al. (2007), the SERVQUAL model is still the most widely used for the evaluation of services thanks to its validity and robustness.
Parasuraman et al. (2005) updated the SERVQUAL model: the basic E-S-QUAL scale developed in the research is a 22-item scale of four dimensions: (1) efficiency, (2) fulfilment, i.e. the ability to meet the needs, (3) system reliability (or availability), and (4) privacy. The second scale, E-RecS-QUAL, is salient only to customers who had non-routine encounters with the sites and added 11 items in three dimensions: (5) responsiveness, (6) compensation, and (7) contact.
This is a cornerstone for research in this field, but other models have been proposed. According to Wolfinbarger and Gilly (2003) quality is expected to be a determinant of online retailer success as well, therefore they studied the dimensions of the e-tail customer experience, developing a reliable and valid scale based on four factors: website design, fulfilment, privacy/security and customer service.
Thus, in the following table is proposed an overview of the most important scales and dimensions for the service quality measurement.
Perceived Service model (Grönroos, 1984) 1. Technical
service quality
2. Functional service quality
SERVQUAL (Parasuraman , Zeithaml and Berry 1988)
1. Reliability 2. Assurance 3. Tangibles 4. Empathy 5. Responsiveness SERVPERF (Cronin & Taylor, 1992)
1. Tangibility 2. Reliability 3. Responsiveness 4. Assurance 5. Empathy E-S-QUAL (Parasuraman, Zeitham and Malhotra, 2005) 1. Efficiency 2. Fulfillment 3.Reliability 4. Privacy
E-REcS-QUAL (Parasuraman, Zeitham and Malhotra, 2005)
1. Efficiency 2. Fulfillment 3.Reliability 4. Privacy 5. Responsiveness 6. Compensation 7. Contact
e-TailQ (Wolfinbarger & Gilly, 2003) 1.Website design 2.Fulfillment 3 Security-
privacy
4. Customer Service
2.2.2 Some considerations about e-service quality
From the literature review, it is possible to draw two main insights. First of all, research on the quality of websites is very fragmented and offers different solutions: in evaluating the quality of Web sites much attention was paid to define the size or number of factors (Grönroos, 1984; Parasuraman et al., 1988, 2005; Barnes and Vidgen, 2001, 2002).
Zeithaml et al. (2001; 2002) stated size varies from product to product, as consumers refer to different factors when assessing the quality of online products or services of different types. Many scholars suggested criteria based on a few dimensions (at least 3 or 4 items), while others suggest a lot of items, i.e. Loiacono et al. (2000)
used 12 factors; Yang et al. (2003) suggested 14 factors; Yang and Fang (2004) considered 16 factors.
Generally speaking an excessive number of factors raise some computational problems and dispersion phenomenon (Bauer and Scharl, 2000). However, the debate about the perfect number of item still remain open, also considering that Francis (2007) argued that one size cannot fit at all.
The second consideration is that many authors propose indices or without application of theoretical models or empirical verification. We observed the existing literature attempted to offer good models for a general context: could be useful keep well in mind that there may be differences between specific activities and sectors, or different products.
Therefore our suggestion is a model context-specific, without closing the door to a possible generalization, under tested conditions.
2.2.3 More emphasis on the consumer: the user-perceived web quality (UPWQ)
Aladwani and Parwia (2002) recognized the need to shift the attention to quality perceived by users who navigates the website: the so-called user-perceived web quality (UPWQ). The authors found three dimensions of perceived quality: (1) technical adequacy, (2) web content e (3) web appearance. Each of them has the following sub-dimensions: (1) technical adequacy referrers to security; ease of navigation; broadcast services; limited use of special plug-ins; search
facilities; anonymity; availability; valid links; reliability; browser sniffing; personalization or customization; speedy page loading; interactivity; ease of access; multi-language support; protected content; bookmark facility. (2) Web content relies on usefulness of content; completeness of content; clarity of content; uniqueness of content; broadness of content; originality of content; currency of content; conciseness of content; accuracy of content; finding contact info.; finding people without delay; finding site maintainer; finding links to relevant sites; finding firm’s general info.; finding products/services details; finding customers’ policies; finding customer support; finding FAQ list; finding free services; using limited registration forms; finding online help; diversity of content; finding free info. (3) Web appearance considers attractiveness; distinctive hot buttons; changing look; organization; proper use of fonts; proper use of colours; proper use of graphics; graphics-text balance; proper use of multimedia; style consistency; proper choice of page length; good labelling; text-only option; proper use of language/style; color consistency.
Seethmaraju (2004) supported these findings with a structural equation model, providing the same dimensions of UPWQ. In its study, only few items do not converged with Aladwani and Parwia model, they are: customisation, speed of page loading and interactivity, ease of navigation, attractive web site, and organised web site.
Yang et al. (2005) follow to this stream, but they rework the classification of UPWQ in (1) information quality and (2) service
quality which reconfigured UPWQ dimensions. With respect to (1) information quality the dimensions are: usefulness of content and adequacy of information. With respect to (2) service quality the dimensions are: usability, accessibility, privacy/security, and interaction.
Ahn et al. (2007) enriched this model adding also system quality: therefore they considered (1) system, (2) information and (3) service quality. More in detail: (1) System quality items are: design, navigation, response time, security, availability, functionality, and error-free transaction, multimedia. (2) Information quality: contents, completeness, detail, accuracy, timeliness, information reliability, format. (3) Service quality: responsiveness, credibility, assurance, empathy, follow-up service, competence. They also found that UPWQ had a significant impact on the perceived ease of use, playfulness, and usefulness, and consequently, they also discovered that it encouraged website use in the context of online retailing (Ahn et al., 2007).
2.2.4 Applying UPWQ to e-commerce
Many scholars studied online satisfaction (Bay et al., 2008; Muylle et al., 2014) or web quality (Zeithaml et al., 2002; Cox & Dale, 2002; Aladwani & Parwia, 2002; Seethmaraju, 2004; Ahn et al., 2007), but there is a need for more focused research about specific e-commerce quality even after 15 years after the call of Cox and Dale (2001) for
further research to identify suitable specific determinants for e-commerce.
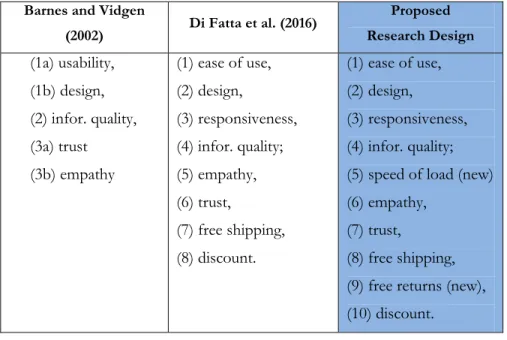
Barnes and Vidgen (2002) proposed an integrative approach to the assessment of e-commerce quality. They suggested a classification in three main components: (1) usability, (2) information, (3) service interaction.
These components underline five sub-dimensions: (1a) usability/ease of use, (1b) design, (2) information quality, (3a) trust and (3b) empathy i.e., issue for transaction and security.
This model provided an application of the concept of web quality for an e-commerce; however it is still much tied to technical approach to website quality. Our proposal is also to consider commercial aspects (such as the free shipping option or the presence of discounts and promotions) to study how such factors are perceived by user.
Moreover, to keep pace with the times, it will also be considered the compatibility with smart phone and tablet in compliance with the new studies in the mobile commerce (m-commerce) field (Tarasewich et al., 2002; Park & Chen, 2007; Ngai & Gunasekaran, 2007; Palumbo & Dominici, 2015; Chang et al., 2015).
M-commerce offers potential opportunities for further research and applications (Barnes & Scornovacca, 2004; Di Fatta & Cupido, 2016): through smartphone and tablet, users are connected to the Internet more easily and quickly (Lin, 2012; Liang, 2015). In addition, the use by the users of the various devices can be monitored and interpreted through increasingly sophisticated systems for data
analysis, which open up new possibilities in terms of profiling of marketing campaigns through effective segmentation (Palumbo et al., 2014).
2.3 Conversion Rate Management
On the opposite point of view, we have to consider the purchasers situations: online retailers aim to boost their sells managing the conversion rate. Indeed, customer visiting a traditional or online store may or may not purchase something. In other words, it is not assured that each visit will end with a purchase. In truth, daily retailing process consists of many customers leaving stores without purchases (Söderlund et al., 2014).
In the previous literature is commonly accepted that many customers, searching for a particular kind of product, visit several store before buying (Newman and Staelin, 1972; Newman and Lockeman, 1975).
Newman argument is the basis of the recent studies on the conversion rate management (Ludwig et al., 2013) extending this concept to the online store. Specifically we will focus on the online conversion rate for e-commerce website, but, generally speaking, the conversion rate concept could be extended to each factor reaching a goal. For instance, from the social media management point of view, conversion refers to newsletter subscribers, or the number of Twitter followers, or Facebook likes etc etc. In the further sections, we are going to focus on the e-commerce conversion rate.
2.3.1 E-commerce conversion rate
The ratio between purchases and number of visitors is defined “e-commerce conversion rate” (Farag et al., 2003). Conversion rate management is one of the most frequently discussed topics in online retailing, receiving great attention from the literature (Overbuy and Lee, 2006; Ha and Stoel, 2009; Ayanso and Yoogalingam, 2009; Olbrich & Holsing, 2011; Ludwing et al., 2013), but its determinants are still not clear.
Because of the characteristics of the Internet, there is a very low conversion rate in e-commerce websites: it tends to sit between 2 and 4% (Holzwarth et al., 2006; Sohrabi et al., 2012). This is due to several reasons such as: competitors’ websites that are just one click away (Clarke, 2001; Frost et al., 2010); the low online search cost and effort often attract customers to visit an e-commerce website, without the real intention of making a purchase, but simply to collect information (Moe and Fader, 2004; Soopramanien and Robertson, 2007); there is also the risk of a security breach related to consumer personal information, credit cards or other payment methods (Koufaris & Hampton-Sosa, 2004; Chen and Barnes, 2007), implying trust problem (McKnight & Cervany, 2001; McKnight et al., 2002).
Assumed that the conversion rate is generally low for the above-mentioned reasons, this implies a high cost for the acquisition of each customer. For this reason conversion rate management could became
a source of competitive advantage for online retailers (Kotha et al., 2004).
Summarizing, the main arguments in conversion rate management literature is that the low conversion rate implies a high cost for the acquisition of each purchaser. How to increase it? Unfortunately there is not a magic formula, but our study aims to clarify some determinants of the conversion rate. Basically our idea is that an increase in the conversion rate leads to a decrease in the cost to acquire new (potential) buyers.
With this in mind, in the quantitative part of this thesis, setting conversion rate as dependent variable, we are going to study the impact of free shipping, free returns, discounts and webpage speed of load.
2.3.2 Logistics: free shipping and free returns
In order to satisfy e-commerce users’ needs, a structural rethinking of the logistic function is often required to manage the delivery of the purchased goods (Simoni, 2011; Ordanini, 2011). Given this premise, online retailers have actually two strategic options (Lewis et al., 2006; Gehrke and Turban, 2009; Zhou et al., 2012; Turban et al., 2015). Option (1), online retailers pay the delivery cost full cost, giving free shipping service for the purchasers. Option (2), online retailers overturn such costs to the purchaser.
In truth, between these two extreme situations, there are actually a set of mixed strategies (Koukova et al., 2012), such as homage the
shipment when the user reach a certain value of its shopping cart (e.g. free shipping, if you spend more than 100 euro), or free shipping only for registered users (e.g. free shipping, if you give us personal information such as email to sign-up for newsletter, or a telephone number). Dominici and Di Fatta (2016), using Kano Model for quality, argued free shipping is an “attractive factor” for e-commerce website from the users point of view. Shifting from the retailers’ point of view, could be interesting thinking about how to manage the free shipping option.
This is only the first step of the delivery process. Indeed, once received the product or service purchased, the buyer might don’t like it (Petersen and Kumar, 2015). Therefore, the buyer can exercise (within the time allowed by the law) the right of withdrawal: second step, return policies. The user can then find themselves in a difficult situation due to, on the one hand, properly organize a shipment, on the other hand, to have to incur costs.
The logistic issues can be summarized in the following research hypotheses:
H1a: Free shipping affect e-commerce conversion rate. H1b: Free return affect e-commerce conversion rate.
2.3.3 Discounts
The first studies about online discounts in fashion e-commerce websites are related to Udo and Marquis (2002), which found that online customer satisfaction is positively related to promotional sales
and discounted price. Other scholars, (Zhang et al., 2015) suggested also temporary discounts affects positively online user perception and (Di Fatta et al. 2016) highlighted which factor influence the user-perceived website quality of e-commerce (UPWQ) using a Pareto chart: the first is discount, the second is free shipping and the third is ease of use which cumulatively represents almost 70% of the UPWQ.
From the online retailers’ point of view, this manuscript aim to study how pricing policy and discounts can be used in order to increase e-commerce conversion rate. Therefore,
H2: Discounts affect e-commerce conversion rate.
The presence of discounts and promotion is often combined with a particular period of year: in other words, we have also to consider the impact of seasonality on the purchases. In the fashion sector, as is well known to most people, there are two seasons: winter season, September to February; and summer season, March to August (Jackson, 2007). Usually, in the last two months of each season, retailers tend to discount their products, which cannot be sold in the following season, in order to avoid generating large stock and unsold merchandise (almost unsellable in the future).
2.3.4 Speed of load
In the early 2000s, a steam of the literature studied how technical features such as speed of load, the navigability of the site, programming language affect the online user experience (Kim and Lee, 2002; Kim and Stoel, 2004). Focusing on e-commerce websites,
Di Fatta et al. (2016) concluded that these technical aspects have a very low impact on customer perception: they are considered as a minimum functionality set which have to reach a standard level (must be requirements).
In practical terms, our research hypothesis is that increasing the speed of navigation of the website over a particular “critical value”, the conversion rate is not influenced. However, if the speed falls below this critical value, the purchaser is annoyed and therefore conversion rate is negatively affected.
Part II
Quantitative Techniques for
conversion rate management
CHAPTER THREE
DETERMINANTS OF
CONVERSION RATE IN E-COMMERCE
Keywords: e-commerce conversion rate, conversion rate management, fixed effect estimator
3.1 Abstract
This chapter aims to focus on the online apparel industry, especially on e-commerce websites, in order to analyze which factor affects the conversion rate using fixed effect estimator.
In this way we want to contribute, on the one hand advancing theory in conversion rate management; on the other hand, in terms of practical implications, providing concrete guidelines for retailers wishing to decrease their cost-per-conversion understanding online consumer behaviour browsing an e-commerce website.
3.2 Introduction
34
conversion rate is about 2-4% (Holzwarth et al., 2006; Sohrabi et al., 2012). This is due to several reasons such as high priced products (Wolfinbarger and Gilly, 2003; Grewal et al, 2004), price sensitivity, because competitors websites are just one click away (Clarke, 2001; Frost et al., 2010), risk of a security breach related to consumer personal information, credit cards or other payment methods (Koufaris & Hampton-Sosa, 2004; Chen and Barnes, 2007) and trust (McKnight & Cervany, 2001; McKnight et al., 2002). Specifically, with respect to the fashion industry (and thus also to the apparel one), it is often lower than 2% (Di Fatta et al., 2016).
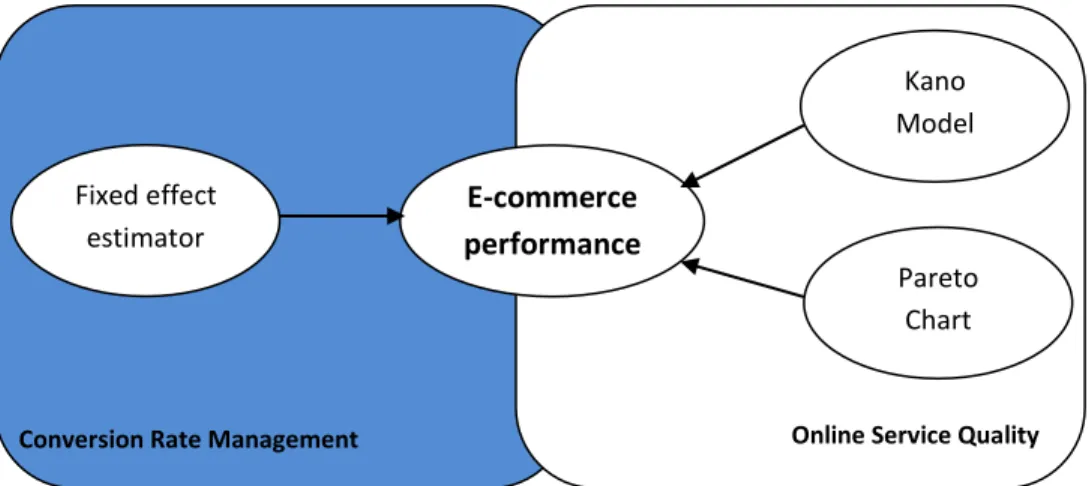
Recalling the research framework provided in chapter 1, now we are going to analyze the left side (in blue).
Figure 2: Research Design – Focus on Conversion Rate Management
The structure of the chapter is the following: next section 3.2 will
dsadsa
Conversion Rate Management Online Service Quality
E-commerce performance Kano Model Pareto Chart Fixed effect estimator
provide a literature review referring to the conversion rate management for small and medium enterprises (SMEs); section 3.3 will describe data and methodology; section 3.4 will present the results and section 3.5 will conclude with discussion, implications and further studies proposals.
3.3
Theoretical
background
and
research
hypotheses
Online retail sales reached more than $1.3 trillion in 2014, which is over 5% of total global retail sales (EMarketer, 2014). On one hand, web retailers invest significant efforts in order to manage functionalities to improve the number of visitors and convert these visits into purchasers (Ayanso and Yoogalingam, 2009). On the other hand, web retailers face also the need for efficiency, especially in small and medium sized enterprises (Grandon et al., 2011).
3.3.1 Focus on SMEs
In the past, the major reason for small businesses to not engage in e-commerce was their perception that online sales were not strategically relevant (Bharadwaj and Soni, 2007). In the recent years there has been a sudden change of directions: digital marketing has received great attention by SMEs showing the emerging role of networks and information and communication technologies (Bocconcelli et al., 2016).
Despite the difficult to compete with the marketplaces (industry industry giants such as Amazon, EBay etc), a lot of small and medium-sized enterprises engaged in e-commerce following a four step procedure (Daniel et al., 2002). In the first stage of e-commerce adoption firms develop their first e-commerce service. In the second step, they start to use e-mail to communicate with customers. At the third level, firms have information-based websites and begin to develop on-line ordering facilities. The most advanced e-commerce adopters have on-line ordering in operation and are developing lean online payment capabilities.
By now, many SMEs are still in an embryonic state in the e-commerce adoption process: Kim et al., (2013) showed that while most of the “fifty best SMEs1“ correctly adopted Web 2.0 tools, the others need to increase their efforts to improve their performances, to connect with consumers and to remain competitive. The present study is intended as a guideline to understand what factors are most relevant to increase online sales. The present study is intended as a guideline to understand what factors are most relevant to increase conversion rate and thus online sales.
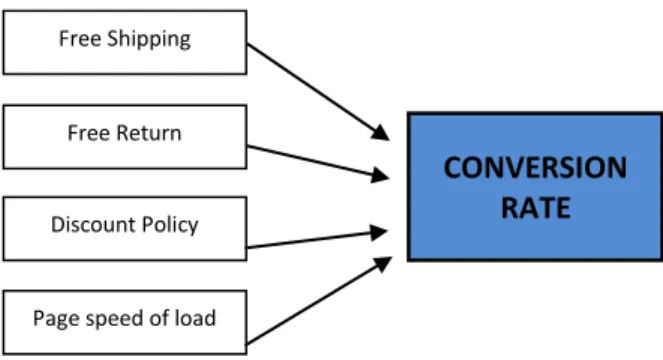
3.3.2 Determinants of conversion rate
Recalling chapter 2, four hypotheses were developed about determinants of conversion rate: free shipping affects e-commerce conversion rate (H1a); free return affects e-commerce conversion
rate (H1b); discount policy affect e-commerce conversion rate (H2); web page speed of load affects e-commerce conversion rate (H3).
The following picture shows graphically the proposed research framework outlining determinants of conversion rate.
Figure 3: Conversion Rate Determinants
3.4 Sample and Methodology
The analyzed sample is based on perfectly balanced panel data: 1184 daily observations from six different e-commerce websites in the fashion industry along a time period observation of six months (from 2016/01/01 to 2016/06/30). The following table shows average and standard deviation:
Table 1: Descriptive Statistics
Free Shipping
CONVERSION RATE
Free Return
Discount Policy
Type of variable Variable Average SD Dependent variable Conversion Rate (%) 6.84 1.03
Independent variables Free shipping (0 no -1 yes) 0.59 0.49 Free returns (0 no -1 yes) 0.05 0.22
Discounts (%) 0.13 0.20
Speed of load (0-100) 63.10 1.52
The selected methodology, fixed-effect estimator, is particularly adapted in order to analyze the impact of variables that vary over time within the same website. Furthermore, each website has its own individual characteristics that could or could not affect the predictor variables (Green, 2007).
Given that, in order to build our research model, the following assumptions have been posed:
Assumption 1. Some time-invariant specific characteristics within the single website may impact or bias the predictor or outcome variables and we need to control for this. Fixed-effect estimator removes those time-invariant characteristics so we can access the net effect of predictors on the outcome variable.
Assumption 2. The time-invariant characteristics of each website do not be correlated with other individual characteristics. Each website is different, therefore the website’s error term and the constant should not be correlated with the others.
3.5 Results and discussion
In order to answer our research questions we implemented a fixed effect estimator using the conversion rate as dependent variable and a set of independent variables:
Conversionit =
αit+β1speedit+β2freeshippingit+ β3freereturnit+ β4discountit+ β5month+ εit
Conversion is the ratio between the number of visits and the
number of transactions registered by the ith website at time t; speed is the speed of load of images of the ith website at time t; freeshipping is a dummy variable taking the value of 1 if the ith website offered
freeshipping at time t and 0 otherwise; freereturn is a dummy variable
taking the value of 1 if the ith website offered free return at time t and 0 otherwise; discount is the discount rate of the ith website at time t.
Furthermore, aiming to check for certain temporal effect and/or seasonality, the model also considered months (a dummy variable for each month) in order to capture consumer temporal preferences for their on-line shopping2.
2 A second version of the model also considered the variable day (a dummy variably for each day of
the week) to test the presence of some preference (for instance in the week end). Conversionit=αit+β1speedit+β2freeshippingit+ β3freereturnit+ β4discountit+ β5day + β6month+ εit
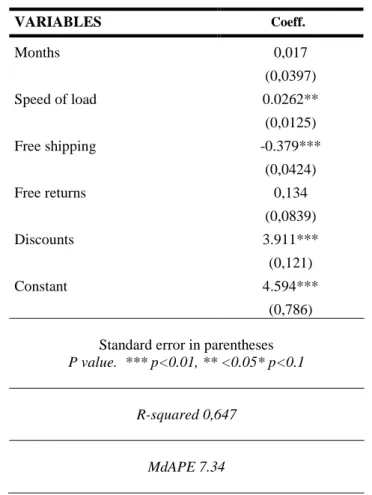
Table 2: Regression on Conversion Rate VARIABLES Coeff. Months 0,017 (0,0397) Speed of load 0.0262** (0,0125) Free shipping -0.379*** (0,0424) Free returns 0,134 (0,0839) Discounts 3.911*** (0,121) Constant 4.594*** (0,786) Standard error in parentheses
P value. *** p<0.01, ** <0.05* p<0.1
R-squared 0,647
MdAPE 7.34
In order to test the predictive accuracy of the proposed model, this manuscript also considers goodness of fit measures based on the R-square and the Median Absolute Percentage Error, or simply MdAPE (Armstrong, 2012). The previous table provided both the R-squared and the MdAPE, suggesting a fairly good explanatory power
of the models.
3.6 Conclusion
The hypotheses developed in the previous section rely on three different aspects of the e-commerce conversion rate: logistics (H1), pricing policy (H2) and webpage speed of load (H3).
Among these three, H2 showed the greatest relevance, indeed, the effect of discounts on e-commerce conversion rate is positive and statistically significant.
This finding does not mean that other variables do not influence at all the conversion rate, but the correct interpretation is that discount has a higher weight compared with other variables affecting conversion rate.
This reflection constitutes a step forward in the conversion rate management field by highlighting the key role of pricing policy in the e-commerce marketing strategy with direct impact on sales.
Recalling that the conversion rate is the relation between purchases and website visitors, increasing this ratio (keeping constant website visitor users, exogenous variable in our model) means increase sales.
This theoretical argument is likely to be interpreted in terms of practical implications for managers and professionals in the apparel industry. Indeed, there is also an important managerial implication for decision makers of an e-commerce website: they should point to an adequate discounts management in order to increase sales.
This research does not consider the impact of the pricing policy and discount on the profitability of the firm. This limitation could became an interesting research opportunity for further studies guessing the break heaven point between the increasing in sales (driven by discounts) and the decreasing in net profit.
Part III
Qualitative Techniques
for the online service quality
CHAPTER FOUR
KANO MODEL FOR
E-COMMERCE WEBSITES QUALITY
3Keywords: online service quality; Kano Model, web quality.
4.1 Abstract
The aim of this chapter is to shed light on the key factors that determine the quality and attractiveness of e-commerce, in order to provide not only interesting theoretical reflections, but also useful practical implications for managers and practitioners in this sector.
The selected method is the Kano model, a qualitative and interpretative method, capable to identify the user / customer perceived quality.
The results of this work are summarized in the identification of the drivers determining e-commerce web quality in Italy, as perceived by web users, ranking these factors according to the categories identified by Kano.
3 This chapter is based on the research proposal presented at the XXIX Sinergie Annual Conference. 9-10 June 2016, University of Udine (Italy).
The main limitation is related to the sample size used that may seem limited. However, this limit could became an opportunity for further researches, in a comparative way with respect to other geographical areas or countries, in order to confirm the results obtained in the present work.
The immediate practical implication of this study is the identification of the driver for the quality of e-commerce, particularly in the brick and clicks model. These drivers can be useful guidelines for the implementation of an e-commerce.
The innovative contribution of this study is the specific analysis for e-commerce websites in Italy by using a qualitative method can provide measurable results e-commerce.
4.2 Introduction
In order to effectively implement an e-commerce strategy is useful understand the quality drivers as perceived by website users (Turban et. al, 2015). Many scholar deals with website quality requirements, (among others Huizingh, 2000; Loiacono et al., 2002; Muylle et al., 2004), however there is not clarity about e-commerce quality drivers.
Indeed, according to (Kuo, 2004) e-commerce website might satisfy users need differently from other websites such as social network, forum, web-community etc.
In order to fill this gap, we are going to use an extension of the Kano Model for quality in order to identify, collect and classify quality requirement specific for e-commerce website. In other words,
46
the research question inspiring this chapter can be summarized as follow: “Which are requirement affecting web quality from the users point of
view?”
The novelty of this proposal is the focus on e-commerce phenomenon extending previous study about generic websites. The main contribution is opening a new research path e-commerce specific, but also, from the practical point of view, providing helpful implications for managers and practitioners.
Recalling research framework developed in chapter 1, now we are going to analyze the right side (in blue) in the following figure.
Figure 4: Research Design – Focus on Online Service Quality
More in detail, this chapter is structured as follows: next section 4.3 will provide the theoretical background about the Kano Model (1982); section 4.4 will describe the methodology behind the Kano
dsadsa
Conversion Rate Management Online Service Quality
E-commerce performance Kano Model Pareto Chart Fixed effect estimator
approach which is a conceptual model; section 4.5 will describe results and, finally, the last section 4.6 concludes with implications.
4.3 Theoretical Background
Chapter 2 already discussed about online service quality. In this section, referring to (Zeithaml et al., 2002) we want just remember that online service quality delivery through websites is an essential strategy to success. In order to deliver superior service quality, managers should firstly understand how customers perceive and evaluate their service.
The problem is that customers are not always able to specify exactly the desired (or desirable) attributes for a given product or service. Thus, we have to consider a methodological support to formalize and interpret customer signals. This section, considering the composite use of plural methods/methodologies converges the approaches to create improved outcomes (multi-methodological framework): this chapter deals with the Kano Model, next chapter Pareto Chart. The common trait is the previous literature on quality (see chapter 2), revised in the light of the Internet exploitation to capture this new phenomenon. Recalling the well known Pareto Rule, Griffin and Hauser (1993) found that only 20-30 customers interviews are sufficient to determine about 90-95% of all possible product service requirements.
The Kano model (1984) in his original formulation, aims to estimate the quality perceived by customers / users of a given product / service and the relative satisfaction / dissatisfaction resulting from the discrepancy between the expected and the perceived quality. The starting point for constructing the Kano questionnaire is the above mentioned identification of product requirements which have been determined in explorative investigations (Matzler and Hinterhuber, 1998).
For these reasons, the Kano model is a qualitative, interpretative and non-linear approach. Unlike quantitative methods applied to the evaluation of customer satisfaction in the search for a deterministic causation, the Kano Model, instead, seeks the understanding and extrapolation of similar and comparable situations (Kano, 1984; Johnson, 1997).
One of the main advantages of this model is the ability to overturn the conviction that there is a linear relationship between a certain feature in a product / service and the degree of customer satisfaction (Dominici et al., 2015b). In this regard Kano (1984; 2001) has shown that some factors generate more satisfaction than other ones. More in depth, Kano model identifies the perceived quality, classifying quality attributes in five dimensions:
- Must be factors (identified by the letter M): if they are not present, customer satisfaction is very low. However, their presence in abundance will not increase proportionally the level of perceived quality;
- one-dimensional factors (O): increased customer satisfaction for their presence is proportional to the ability to meet its needs; - attractive factors (A): they have the greatest influence on
customer satisfaction, but if they’re missing, do not generate dissatisfaction;
- indifferent factors (I): customers are not very interested in these attributes;
- Reverse quality factors (R): customers do not wish these factors, indeed their presence leads to dissatisfaction.
If two or more requirements are ambiguous, we have to consider the so-called MOAI rule (CQM, 1993). This is a classification rule taking into account the greatest impact on perceived quality: practically, the preferential order of choice is M > O > A > I.
With this in mind, comparing the Kano Model to other methods such as principal component analysis or structural equations that are more rigid, it should be emphasized that this methodology appears more flexible: specifically, Witell and Lögfren (2007) have recognized the Kano model the advantage of knowing how to identify priorities in relation to certain attributes that influence user choices and provide an ordered classification of the product characteristics, as well as the ability to highlight the importance of the attributes and the different ways in which they influence consumer satisfaction.
Other scholars (Sauerwein et al., 1996; Chaudha et al., 2011) have instead investigated the capacity of Kano model in providing
directions that can be used in the project design phase or in the improving of an existing product increasing customer satisfaction
4.4 Methodology
Our research began with the identification of the key question (referring quality factor) for the questionnaire (Matzler and Hinterhuber, 1998).. Following previous studies (Shiba et al, 1993; Dominici et al., 2015b), we collected 20 quality factors using semi-structured indepth interviews and provided this list to a focus group. The focus group has, in fact, the ability to put at ease the participants through the use of an industry idiomatic language and concepts typical of the discipline by encouraging the spread of articulated reflections and at the same time providing the researcher with the opportunity to observe the sense-making process in action (Wilkinson, 1998).
Our focus group consisted of 8 subjects, divided equally between men and women: 4 web marketing experts and 4 regular buyers of online shopping, (i.e. individuals who have performed more than 10 online purchases in the previous year).
The preliminary results of the analysis showed 8 key factors on which the focus group members had reached an agreement: the web page loading speed; website compatibility with smartphone and tablet (i.e. responsiveness); free shipping; free returns; image quality; presence of discounts on price; accuracy in the textual description of the products; information about the company that owns e-commerce.
Following the widespread literature (Aladwani and Prashant, 2002; Wang et al., 2007) and also taking into account the results of the focus group, the questionnaire has been developed. Therefore, around the above mentioned 8 components, we built 16 questions (two for each component). In this way we feel both the positive outlook is the negative one.
In other words, two questions were posed for each component: how much would you be satisfied if the “x” attribute were present? How much would you be dissatisfied if the “x” attribute was absent? The rationale is to take the two-dimensional aspect of quality: both in a positive sense, which is in relation to the benefit for the user associated with the presence of that factor, both in the negative that is, in relation to the malus that the absence of that factor determines in the customer.
Respondents were asked to indicate the degree of agreement or disagreement with respect to each question by selecting a score from one to five of the Likert scale: strongly disagree, disagree, neither disagree nor agree, agree, strongly agree (Dawes, 2008).
Previous studies shown some advantages in using a five-point scale: with respect to a seven or nine point scale, it has the ability to restrict outliers values providing balanced answers; focus the attention of the respondent on a limited spectrum, indeed too many response options can be confusing (Wyatt and Meyers, 1987; Dawes, 2008).
The analysis of the survey results through the Kano model has allowed us to identify the major factors of attractiveness for e-commerce website quality (Aladwani and Prashant, 2002). These findings are also supported by the customer satisfaction index (CSI) and customer dissatisfaction index (CDI) (Berger, 1993; Tarasewich et al., 2002) which will be computed in the next sections.
4.5.1 Survey
The questionnaire was administered to a sample of 476 usual e-commerce shoppers (at least 2 purchases in the last year) in the bags and accessories industry. 438 questionnaires were correctly filled.
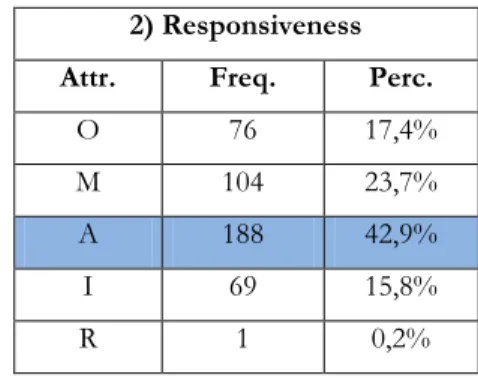
The following table show how the 8 components identified by the focus groups are classified using the Kano Model, recalling that O is equal to One dimensional requirement, M = Must Be, A = Attractive, I = Indifferent and R = Reverse quality.
Table 3: e-commerce Websites Quality Requirements
1) Speed of load 2) Responsiveness Attr. Freq. Perc. Attr. Freq. Perc.
O 78 17,8% O 76 17,4%
M 210 47,9% M 104 23,7%
A 100 22,8% A 188 42,9%
I 50 11,4% I 69 15,8%
Tot. 438 1 Tot. 438 1 3) Free shipping 4) Free returns Attr. Freq. Perc. Attr. Freq. Perc.
O 132 30,1% O 67 15,3% M 95 21,7% M 87 19,9% A 189 43,2% A 102 23,3% I 22 5,0% I 180 41,1% R 0 0,0% R 2 0,5% Tot. 438 1 Tot. 438 1
5) Image quality 6) Discounts Attr. Freq. Perc. Attr. Freq. Perc.
O 73 16,7% O 190 43,4% M 154 35,2% M 80 18,3% A 120 27,4% A 132 30,1% I 89 20,3% I 36 8,2% R 2 0,5% R 0 0,0% Tot. 438 1 Tot. 438 1
7) Product descriptions 8) Information about web-holder Attr. Freq. Perc. Attr. Freq. Perc.
O 96 21,9% O 74 16,9% M 106 24,2% M 107 24,4% A 61 13,9% A 74 16,9% I 174 39,7% I 182 41,6% R 1 0,2% R 1 0,2% Tot. 438 1 Tot. 438 1
“Discounts” is one dimensional requirement according to more than 43% of the respondents. In other word customer satisfaction in
proportional to this factor: more discounts imply a higher level of satisfaction. This result is consistent with Udo and Marquis (2002) which highlighted in the web users a particular attention to discounted prices revealing sensibility to promotions.
We take a look at the logistics with regard to shipments of the purchased goods purchased. On the one hand, “free shipping” is considered an attractive factor (43% of the respondents), but on the other hand, the possibility of “free return” is considered indifferent (41% of the respondents).
What does it mean? For an e-commerce website strategy, it is much more important ensuring the free home delivery rather that offering free return services. These results are consistent with the previous literature (Zhou et al., 2012; Turban et al., 2015). In fact, in order to attract potential buyers, many e-commerce websites offer at its own cost free shipping to their customers as an additional service (and Meng Rong, 2015). These results are also supported by Bay et al., (2008) who studied the impact of the web quality on customer satisfaction, considering free shipping one of the crucial web quality requirements.
“Compatibility” with smartphone and tablets is an attractive requirement for 42% of users. This result is confirmed by previous research (Barnes and Scornovacca, 2004; Park and Chen, 2007) argued the huge spread of the Internet and of the telecommunications sector has created new possibilities for the development of what has been defined not simply electronic
commerce (e-commerce), but specifically m-commerce, namely mobile commerce (Balasubramanian et al., 2002; Chang, 2015).
Let’s move to must be requirements. “Webpage speed of load” is a must be requirement for 48% of the respondents. In other words, users expected a certain level of speed (must be), but they don’t care if the current values exceeds the threshold (Turban et al., 2015).
In the opinion of users, another key factor is the “image quality”, considered a must be requirement by 35% of the respondents. This is consistent with previous studies (Barnes and Vidgen, 2002), highlighted the visual aspect has a greater impact on customer experience rather than textual one. Indeed, “product description” is an indifferent requirement for quality (40% of the respondents). Fensel et al. (2001) argued product descriptions within an e-commerce should be as natural as possible and do not seem contrived.
Another indifferent factor is the information about “e-commerce ownership”: such knowledge on the ownership of the site does not appear to be of interest to web users. This is consistent with previous studies by Jutla et al., (1999) and by Liu and Arnett (2000).
4.5.2 CSI and CDI checkpoints
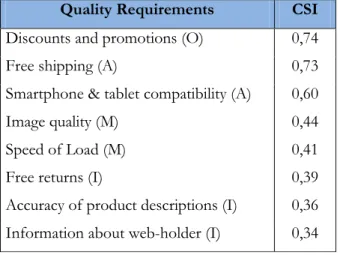
In order to confirm previous results, we are going to perform the so-called Customer Satisfaction Index (CSI). This is an indicator quantifying the ability of each quality requirements in satisfying customer needs (Berger et al., 1993).
CSI ranges from 0 to 1. If the value is closet o 1, the greater will be the impact on customer satisfaction. The following table provide our eight quality requirements ordered from the higher CSI value to the lower.
Table 4: CSI scores
Quality Requirements CSI
Discounts and promotions (O) 0,74 Free shipping (A) 0,73 Smartphone & tablet compatibility (A) 0,60 Image quality (M) 0,44 Speed of Load (M) 0,41 Free returns (I) 0,39 Accuracy of product descriptions (I) 0,36 Information about web-holder (I) 0,34
The most important factor for customer satisfaction seems to be discounts and promotion, the second is free shipping and the third is compatibility with smartphone and tablet. It is important to note that they are one dimensional and attractive requirement. Their presence boosts customer satisfaction.
Image quality and speed of load are must be requirement, thus user expected their presence and are negatively affected if they are absent. Not coincidentally, the last three factors in the ranking of the
CSI values are indifferent factors: free returns, accuracy of the products description and owner information. However, adequate consideration must be careful in order to do not misinterpret these results: in fact, a low value of CSI does not mean these three attributes have no relevance for quality, but simply these indifferent requirements have a lower incidence in influencing customer experience (Yang and Fang, 2004).
This issue provide an insight to what will be more precisely outlined in the conclusions: a first clear and obvious practical implication is that managers should focus their attention and resource in the optimization of those factors having a greater impact on customer satisfaction of users (i.e. those requirements having the highest CSI values).
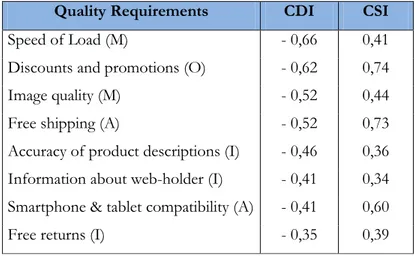
Moving on to the analysis of the dark side of quality we have also to consider the dissatisfaction. Customer Dissatisfaction Index (CDI) indicates the degree of dissatisfaction resulting from the non-fulfilment of a need, and therefore takes on a negative connotation in the incidence on customer experience (Berger et al., 1993; Rust and Oliver, 2000).
This index rages between -1 and 0. The closer to -1, the greater the negative impact on the level of user satisfaction, thus generating dissatisfaction. Conversely, if it approaches to zero, it implies a low
Table 5: CSI and CDI – A comparison
Quality Requirements CDI CSI
Speed of Load (M) - 0,66 0,41 Discounts and promotions (O) - 0,62 0,74 Image quality (M) - 0,52 0,44 Free shipping (A) - 0,52 0,73 Accuracy of product descriptions (I) - 0,46 0,36 Information about web-holder (I) - 0,41 0,34 Smartphone & tablet compatibility (A) - 0,41 0,60 Free returns (I) - 0,35 0,39
It is important to note the higher CDI values are speed of load (-0,66) and discount (-0,62), respectively must be and one dimensional requirements. Image quality (that is also a must be requirement) has the third values (-0,52).
As above mentioned, user expected the presence of a must be requirement, otherwise they are very dissatisfied. This is consistent with Brignall et al. (1991) founding that fulfilling of this minimum requirement is necessary, but overcome this value does not get “bonus points”.
More critical is the situation about discounts being one dimensional requirement: customer satisfaction is proportional to their presence and dissatisfaction to their absence. This is a double-edged sword for e-commerce managers which need to use discounts with caution.