U
NIVERSITÀ DEGLI
S
TUDI DI
C
ATANIA
Dottorato di Ricerca in Scienza e Tecnologia dei Materiali - XXVIII ciclo
Giuseppe Cacciato
Metal-TiO
2
nanocomposites towards
efficient solar-driven photocatalysis
Tutor: Prof.ssa M. G. Grimaldi Supervisors: Dr. M. Zimbone, Dr. F. Ruffino Coordinatore: Prof.ssa M. G. Grimaldi
ABSTRACT ... 7
CHAPTER 1: METAL-TIO2 NANOCOMPOSITES ... 9
1.1INTRODUCTION ... 9
1.2TIO2-BASED PHOTOCATALYSIS ... 11
1.2.1 Principles of photocatalysis ... 16
1.2.2 Photocatalytic test ... 19
1.3PLASMONIC METAL-TIO2 NANOCOMPOSITES ... 23
1.3.1 Localized Surface Plasmon Resonance (LSPR) ... 24
1.3.2 Field enhancement in metal gaps ... 34
1.3.3 Metal-TiO2 nanocomposites ... 35
1.4CONCLUSION ... 40
1.5REFERENCES ... 40
CHAPTER 2: TIO2 NANOPARTICLES OBTAINED BY LASER ABLATION IN WATER... 45
2.1PULSED LASER ABLATION IN LIQUID ... 45
2.1.1 Laser ablation mechanism ... 47
2.2PHOTOCATALYTIC AND ANTIBACTERIAL ACTIVITY OF TIO2NPS OBTAINED BY LASER ABLATION IN WATER ... 50
2.2.1 Synthesis ... 50
2.2.2 Materials and methods ... 50
2.2.3 Structural and morphological characterization ... 53
2.2.3 Photocatalytic and antibacterial tests ... 62
2.3AG-TIO2 MIXTURE ... 67
2.3.1 Ag nanoparticles obtained via pulsed laser ablation in liquid ... 67
2.3.2 Effect of the Ag on the photocatalytic performance of the laser ablated TiO2 NPs ... 68
2.4CONCLUSIONS ... 70
2.5REFERENCES ... 70
CHAPTER 3: METAL NANOSTRUCTURES ON TOP OF TIO2 THIN FILMS ... 75
3.1THIN METAL FILM DEWETTING AS NANOSTRUCTURATION STRATEGY ... 75
3.2AU NANOPARTICLES ON POLYCRYSTALLINE ANATASE AND RUTILE ... 78
3.2.1 Phases of TiO2 thin films ... 78
3.2.2 TiO2 films growth and characterization ... 80
3.2.3 Au nanoparticles on TiO2: structural and morphological characterization . 82 3.2.4 Optical characterization ... 85
4
3.3CONCLUSIONS ... 88
3.4REFERENCES ... 89
CHAPTER 4 TIO2 SUBSURFACE EMBEDDED AG NANOPARTICLES VIA LOW ENERGY ION BEAM SYNTHESIS ... 93
4.1OPTICAL ENGINEERING ... 93
4.1.1 Low energy ion beam synthesis (LE-IBS)... 94
4.1.2 Optical amplification ... 96
4.2TIO2 SUBSURFACE EMBEDDED AG NPS ... 99
4.2.1 Materials and methods ... 99
4.2.2 Structural characterization: TEM imaging ... 101
4.2.3 Optical response: plasmonic optical enhancement ... 103
4.2.4 Raman spectroscopy in Ag NPs and TiO2 ... 107
4.2.5 LO-phonon-plasmon modes in TiO2 ... 110
4.2.6 Electron-phonon confinement in Ag NPs ... 113
4.2.7 Electron-hole generation and transfer: photocatalytic activity ... 116
4.3CONCLUSIONS ... 117
4.4REFERENCES ... 118
CHAPTER 5 TIO2/AG/TIO2 NANOCOMPOSITE FILM OBTAINED VIA SEQUENTIAL SPUTTERING ... 121
5.1 OPTICAL ENGINEERING OF TIO2/AG/TIO2 NANOCOMPOSITE FILMS FOR VISIBLE DRIVEN PHOTOCATALYSIS ... 121
5.1.1 Optical engineering ... 122
5.1.2 Materials and methods ... 124
5.1.3 Structural characterization ... 126
5.1.4 Optical characterization ... 130
5.1.5 Photocatalytic response under visible irradiation ... 134
5.2CONCLUSIONS ... 135 5.3REFERENCES ... 135 CONCLUSIONS ... 137 LIST OF PUBLICATIONS ... 139 CURRICULUM VITAE ... 143 ACKNOWLEDGEMENTS ... 145
7
Abstract
Water, together with energy and food, has been addressed as one of the main urgent problem of humanity. The reduction of fresh clean water sources will definitely lead to huge issues in the next future, especially in developing countries. The conventional wastewater treatments suffer some limitations related to the effectiveness in decontamination (mechanical filtration), in the heavy use of chemicals (chlorination), or in elevate operational costs and energy requirements (desalination and reverse osmosis). In this sense, new materials such as nanocomposites may overcome these issues taking advantage of the peculiar properties of materials at nanoscale. Research on novel nanotechnologies must bring advances in order to contrast and prevent water scarcity and pollution. In order to be effective, these nanotechnologies should run at low operational cost, even in places unequipped by strong infrastructures and in concert with conventional cheap methodologies.
Among the alternative water purification methods, TiO2-based
photocatalysis has attracted great attention due to material stability, abundance, non-toxicity and high decontamination efficiency. In this material, electron-hole pairs, generated by light absorption, separate from each other and migrate to catalytically active sites at the surface of the photocatalyst. Photogenerated carriers are able to induce the water splitting reaction and, consequently, to decompose organic pollutants. The main deficiency of this material, related to its large band gap, is that only the UV fraction of the solar spectrum is effective to this purpose. Several approaches have been proposed to overpass this issue and, among them, the use of metal-TiO2 nanocomposites with proper nanostructurarion
seems very promising for water purification strategies.
Aim of this work is to investigate the possibility to develop efficient solar-driven TiO2 photocatalyst taking advantage of metallic nanostructures
8
to efficiently couple the incident light to the photoactive semiconductor. Two approaches have been followed: TiO2 nanoparticles obtained via
pulsed laser ablation in liquid and optical engineering of multilayered metal-TiO2 thin films. The first approach maximizes the exposed surface,
thus enhancing the photocatalytic efficiency. However, in this case nanomaterials is dispersed in the surrounding environment, and in order to avoid this drawback we have investigated, as second approach, the use of metal-TiO2 thin films.
The outline of the thesis is the following:
Chapter 1 is devoted to the description of the fundamental processes involved in TiO2 photocatalysis and to the most recent
development in metal-TiO2 nanocomposites. Particular attention is
given to plasmonic metal nanostructures, giving the principles of Localized Surface Plasmon Resonances (LSPR).
Chapter 2 reports on TiO2 nanoparticles obtained via laser ablation
in liquid.. The structure and morphology of the nanoparticles as well as the photocatalytic activity are accurately described, also in Ag-TiO2 mixtures. Arguments will be presented to identify the
processes responsible for the activity enhancement.
Chapter 3, Chapter 4 and Chapter 5 describe the studies on metal-TiO2 nanocomposite films. In these chapters, nanocomposite film of
plasmonic metal (Au or Ag) nanoparticles and TiO2 are structurally,
morphologically and optically characterized. More in detail, in Chapter 3 the thermal dewetting is employed as nanostructuration strategy. Then, in Chapter 4 a proper optical engineering of the nanocomposite films has been demonstrated the key factor in order to obtain an enhanced optical response of the film and, in Chapter 5, in order to observe a high photocatalytic activity under visible irradiation.
9
Chapter 1: Metal-TiO2 nanocomposites
The conventional wastewater treatments suffer some limitations related to the effectiveness in decontamination, in the heavy use of chemicals, or in elevate operational costs and energy requirements. In this sense, specific nanomaterials and nanocomposites may overcome these issues taking advantage of the peculiar properties of materials at nanoscale. Among the water purification methods, TiO2-based photocatalysis has
attracted great attention due to material stability, abundance, non-toxicity and high activity.
In this chapter we will present the principles of titanium dioxide photocatalysis, followed by a brief review of the recent promising results regarding metal-TiO2 nanostructures and nanocomposite and the strategies
to adopt for environmental remediation applications. Particular attention will be given to the properties and effects of plasmonic metal nanostructures, especially for solar-driven photocatalysis.
1.1 Introduction
Water, together with energy and food, has been addressed as one of the main urgent problem of humanity. The reduction of fresh clean water sources will definitely lead to huge issues in the next future [Win08] [Suà08][Mal09]. The conventional wastewater treatments suffer some limitations related to the effectiveness in decontamination (mechanical filtration), in the heavy use of chemicals (chlorination), or in elevate operational costs and energy requirements (desalination and reverse osmosis)[Sha08]. In this sense, new materials such as nanocomposites may overcome these issues taking advantage of the peculiar properties of materials at nanoscale. Research on novel nanotechnologies must bring advances in order to contrast and prevent water scarcity and pollution. In order to be effective, these nanotechnologies should run at low operational
10
cost, even in places unequipped by strong infrastructures and in concert with conventional cheap methodologies. In Fig. 1.1 is ideally suggested such a picture, where the advances from nanotechnology can insert at the reverse osmosis step and in the disinfection treatment.
Figure 1.1: Membrane bioreactor (MBR) treatment system for direct conversion
to potable water. Depiction of a next generation MBR-based treatment method that can potentially take wastewater from municipal, agricultural, livestock or other high-organic-content sources and convert it to potable water. Future methods may be able to omit the RO step with a nanofiltration membrane, and follow with a visible light disinfection step to ensure that all pathogens, including viruses, are inactivated. From ref. [Sha08].
Among the alternative water purification methods, TiO2-based
photocatalysis has attracted great attention due to material stability, abundance, non-toxicity and high activity [Has05][Fuj08][Cho10]. In this material, electron-hole pairs, generated by a flux of photons, separate from each other and migrate to catalytically active sites at the surface of the photocatalyst. Photogenerated carriers are able to induce the water splitting reaction and to decompose organic pollutants. Depending on the reaction path, highly reactive species (OH ∙,O2−, H2O2) can be created in
solution. These reactants are able to decompose and mineralize most of the organic pollutants in solution as well as destroy bacteria [Fuj08]. The main deficiency of titanium dioxide relies on its wide band gap (~3.2 eV) that makes it inefficient for solar-driven applications. However, proper nanostructuration of titanium dioxide and metal-TiO2 nanocomposites have
11 been demonstrated able to improve its efficiency, thus making this material an ideal candidate for water purification strategies.
1.2 TiO
2-based photocatalysis
Whatever the application, such as water or air purification, solar energy conversion, water splitting etc., photocatalytic reactions are always the result of complex and concurring processes occurring on the surface at the nanoscale. These processes are [Hof95][Fuj08]: (i) the absorption of light creating electron–hole excitations in a thin layer of a semiconducting compound, (ii) the separation followed by (iii) the transfer of these charges to the surface in contact with water or air, (iv) their interaction with organic or inorganic molecules located on this surface through oxidation and reduction reactions, leading finally (v) the electronic system to recover its ground state.
Figure 1.2: Schematic representation of the phenomena taking place in a
semiconductor photocatalyst. The photogenerated carriers can recom-bine at a surface trap (A) or in the bulk (B) otherwise they can interact with acceptor (C) or donor (D) species. Adapted from [Lin95].
12
These processes are sketched in Fig. 1.2. In this figure an energetic photon generates a e-/h+ pair. The carriers can recombine at a surface trap (A) or in the bulk (B) otherwise they can interact with acceptor (C) or donor (D) species adsorbed on the surface.
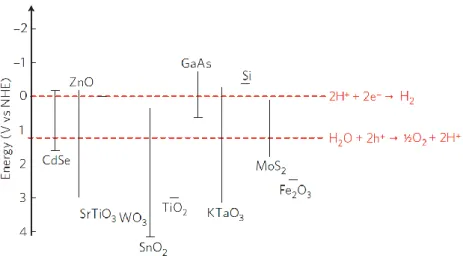
In Fig. 1.3 are reported the valence band (VB) and the conduction band (CB) positions (at pH = 0) for a range of semiconductors on a potential scale (V) versus the normal hydrogen electrode (NHE). Dashed red lines represent the energy levels for the water-splitting half-reactions redox potentials. For the water-splitting reaction to be thermodynamically favorable, the bandgap of the semiconductor photocatalyst should straddle these redox potentials, that is, the CB should have higher energy (more negative potential) than the hydrogen-evolution potential and the VB should be lower in energy (more positive potential) than the oxygen-evolution potential.
Figure 1.3: VB and CB for a range of semiconductors on a potential scale (V)
versus the normal hydrogen electrode (NHE) at pH = 0. Redox potentials for the water-splitting half-reactions versus the NHE are also indicated by dashed red lines. From [Lin11].
Prior to the Honda-Fujishima effect in titanium dioxide [Fuj72], interest in photocatalysis was centered on ZnO, which has similar CB and VB
13 to TiO2. The material is, however, limited by intrinsic photocorrosion upon
excitation in aqueous media by the photoinduced hole weakening of Zn2+−O2− bonds to produce O2 and soluble Zn2+ [Ger66]. Hematite (α-Fe2O3)
is another material that was originally thought to be an ideal photocatalyst due to its low cost, abundance, and narrow bandgap for harnessing solar energy (bandgap = 2.0-2.2 eV, excitation wavelength up to 620 nm) [Teo12]. However, the material suffers from rapid charge recombination (lifetime <10 ps) and a short charge carrier diffusion length (2−4 nm) [Teo12]. Tungsten trioxide (WO3) is another narrow bandgap material (band
gap = 2.7 eV) that has received fresh interest. The primary disadvantage of WO3 lies in its low CB, which is below that required for the single-electron
reduction of molecular oxygen [Teo12]. Despite the narrow band gap and the ideal position of VB and CB energy levels with respect to water splitting semi-reactions potentials, CdSe (either in bulk or in quantum dot) is known to be toxic [Der04], thus is not suitable for pollution remediation.
The interest in titanium dioxide as the most studied photocatalytic material remains indisputable. This material has the advantage of being stable, abundant, non-toxic and highly active [Has05][Fuj08][Cho10]. TiO2
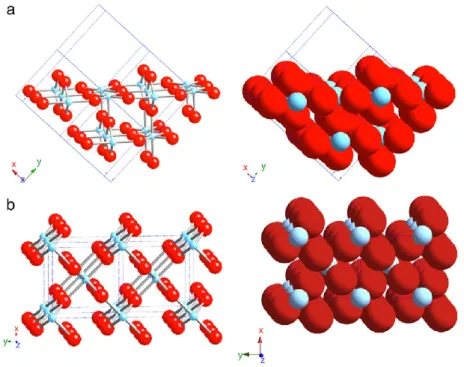
has three main polymorphs [Han11]: rutile (stable), anatase (metastable) and brookite (metastable). These have different activities for photocatalytic reactions, but the precise reasons for differing activities is a matter of debate and have not still been elucidated in detail. The most common studied phases are anatase and rutile. Rutile has three main crystal faces, two that are quite low in energy and are thus considered to be important for practical polycrystalline or powder materials [Ram94]. These are: (110) and (100) (Fig. 1.4 (a) and (b)). The most thermally stable is (110), and therefore it has been the most studied. It has rows of bridging oxygens (connected to just two Ti atoms). The corresponding Ti atoms are 6-coordinate. In contrast, there are rows of 5-coordinate Ti atoms running parallel to the rows of bridging oxygens and alternating with these. The (100) (Fig. 1.4 (b)) surface also has alternating rows of bridging oxygens and 5-coordinate Ti atoms, but these exist in a different geometric relationship with each other.
14
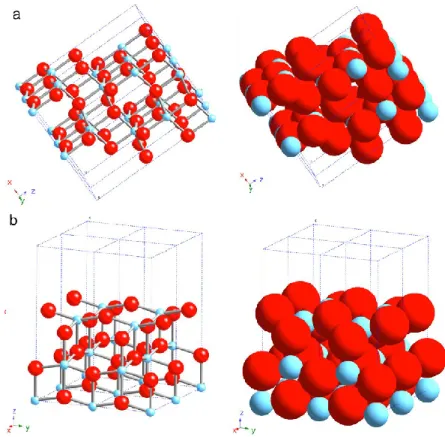
Anatase has two low energy surfaces, (101) and (001) (Fig. 1.5 (a) and (b)), which are common for natural crystals [Hen00]. The (101) surface, which is the most prevalent face for anatase nanocrystals, is corrugated, also with alternating rows of 5-coordinate Ti atoms and bridging oxygen, which are at the edges of the corrugations. The (001) (Fig. 1.4 (b)) surface is rather flat [Hen00].
Figure 1.4: Schematic representations of selected low-index faces of rutile: (a)
(110) and (b) (100). From [Fuj08].
The commercial standard is the Aeroxide P25® (formerly Degussa P25). The P25 is a powder composed by a mixture of anatase (75%) and rutile (25%) [Ohn01]. There is a large debate in literature claiming whether rutile or anatase is the best phase for photocatalytic reaction [Lut14]. Anatase seems to be more active than rutile [Lut14], even if some studies
15 suggest that the mixture of the two phases is the best compromise [Sca13]. Moreover, one has to consider that, in view of decontamination strategies, the use of a photocatalyst fixed onto a substrate instead of a powder dispersed in solution may represent a clear advantage. In the work presented in this thesis, we will adopt both strategies: on one hand, we will synthetize and characterize TiO2 nanoparticles obtained via pulsed laser
ablation in liquid; on the other hand, we will elaborate nanostructured TiO2
thin films. In the first approach we aim to maximize the exposed surface, while in the second we prefer to obtain a photocatalytic film that does not disperse nanomaterial in aqueous solution.
Figure 1.5: Schematic representations of selected low-index faces of anatase:
16
1.2.1 Principles of photocatalysis
Photocatalysis is generally thought of as the catalysis of a photochemical reaction at a solid surface, usually a semiconductor. This simple definition, while correct and useful, however, conceals the fact that there must be at least two reactions occurring simultaneously, the first involving oxidation, from photogenerated holes, and the second involving reduction, from photogenerated electrons. Both processes must be balanced precisely in order to conserve the charge neutrality and for the photocatalyst itself not to undergo change (which is, after all, one of the basic requirements for a catalyst). In other words, photocatalysis is based on “back-to-back” or short-circuited photoelectrochemical and electro-chemical reactions, balancing electrons and holes [Fuj08]:
ℎ𝜐 → e−+ h+ (1.1)
2H2O + 4h+→ O
2+ 4H+ (1.2)
O2+ 4H++ 4e−→ 2H
2O (1.3)
Because reduction or oxidation by the photoinduced charges of the reacting species involves electron transfer, these redox processes usually occur with species adsorbed to the surface. In competition with the charge carriers transfer processes, recombination takes place, either in bulk or at the surface. Retarding the recombination processes could effectively enhance the photocatalytic activity. Thereby, the presence of trap centers at the surface could extend the life mean time of e-/h+ pairs. The typical time scale in photocatalytic reactions is reported in Fig. 1.6.
Even in a perfect crystal one observes the occurrence of a certain number of defects, especially at the surface [Kit08]. In correspondence of these particular locations there will be a trap center for carriers, whose position in the band diagram will depend on the type of defect. Since h+ are attracted by oxygen atoms in the lattice, while e- are attracted by Ti, one
17 can state that defects which influence oxygen or titanium in the lattice correspond to level close to the valence band or close to the conduction band, respectively. Actually, one of the most common defects in TiO2
surface is represented by an oxygen vacancy [Fuj08]. The Ti4+ site left from this vacancy can attract an e-, thus becoming a Ti3+ site. Ti3+ on the surface is an ideal site for adsorption of oxygen [Fuj08]. Moreover, when two oxygen vacancies are close to the same Ti site on the surface, then the Ti atom can translate from its position thus becoming an interstitial defect. Interstitial Ti, interacting with the oxygen of the TiO2 lattice, is a trap for
photogenerated holes [Gop10].
Figure 1.6: Time scale in photocatalysis [Fuj08].
In TiO2 photocatalysis, surface adsorbed O2 acts as the primary
electron acceptor and no photocatalytic organic degradation is observed to occur in the absence of O2 [Hof95]. The reduction of O2 has been
demonstrated to be the rate-limiting step in semiconductor photocatalysis [Hof95]. O2 plays a critical role in enhancing photocatalysis by acting as an
18
highly oxidative species such as H2O2. These reactive oxygen species
contribute to the oxidation of organic compounds by either directly attacking the organic or by producing hydrogen peroxide, which is a source of hydroxyl radicals that act as a strong oxidizer as shown in:
O2+ 2e−+ 2H+→ H2O2→ 2HO ∙ (1.4)
In aqueous solutions, several different pathways have been suggested for O2 reduction. For example, Hoffman suggested that O2 first
adsorbs to the TiO2 surface before gaining an electron and then combines
with two protons to form H2O2, which subsequently converts to hydroxyl
species that degrade organic compounds [Hof95][Fuj08]. Nakamura suggested two mechanisms for this process; one where an O− on the TiO2
surface transfers an electron to an O2 in solution that then reacts with H+
to form HO2− and eventually H2O2; and a second mechanism involving an
O2 in solution that adsorbs to a surface Ti4+ site by sequentially accepting
two electrons and subsequently reacting with two protons to form H2O2,
which is released into solution upon addition of the secondH+[Nak03]. Mattioli et al. and Filippone et al. both suggested that O2 accepts two
electrons as it adsorbs on the TiO2 surface and subsequently accepts two
protons to form adsorbed H2O2, which then desorbs [Mat06][Fil07].
Surface adsorbed water or hydroxide anions act as the main hole acceptors in TiO2 photocatalysis, although it has been suggested that
certain organic materials may be directly oxidized by holes from TiO2
[Hof95][Fuj08]. Indeed, holes are primarly oxidizing species in photo-catalytic reactions.
Most organic pollutant in water can be decomposed and mineralized on the surface of TiO2 under UV irradiation. There are,
obviously, several factors affecting the mineralization processes: light intensity, pH, ions dispersed in solution, etc. [Fuj08]. TiO2 Photocatalytic
reaction reasonably follow first-order kinetics with respect to the concentration of the organic compound adsorbed, and 𝛼 order with respect to light intensity [Hof95]:
19
𝑟 = 𝑘Γ𝐼𝛼 (1.5)
where 𝑟 is the reaction rate, 𝑘 the first-order constant, Γ the concentration for surface unity and 𝐼 the light intensity. At high intensity 0 < 𝛼 < 1, while at low intensity 𝛼 = 1.
1.2.2 Photocatalytic test
There are a large and growing number of research groups and industries associated with semiconductor photocatalysis. Thus, it appears obvious the necessity of a methodology that allows at the same time to evaluate the photocatalytic performance of a material and to compare it with the results obtained elsewhere. In this sense, standards help researchers as well as manufacturers to develop and deliver products which have the defined characteristics. However, how the activity of a given photocatalyst sample can be represented by a single test method is not an easy task. Indeed, it is known the fact that the activity of a photocatalyst depends on how it is measured limits the general applicability of a specific test method [Ryu08].
Nonetheless, methylene blue (MB) discoloration test has become one of the most popular method for assessing photocatalytic activity of titania films and powders [Mil07][Mil12]. This methodology has been developed for the determination of photocatalytic activity of surfaces in an aqueous medium by degradation of methylene blue (ISO 10678:2010 [ISO10]), by International Organization for Standardization (ISO) [ISO15]. Using this method it is possible to extract the reaction constant rate for a certain material. To do so, a sample is immersed in a MB-water solution and irradiated by UV (or visible) light. By measuring the dye concentration as a function of time one can evaluate the photocatalytic activity relative to the sample. In Fig. 1.7 is sketched the experimental set up for the test. Usually the sample is placed at the bottom of a cylindrical vessel filled with
MB-20
water solution. The solutions is left for a certain time in dark to allow the adsorption of MB onto sample and vessel surfaces and then illuminated. During light irradiation the vessel is covered with quartz in order to avoid evaporation during irradiation. Two important indications of the standard refer to the ideal concentration of the MB solution (about 10−5M, showing an absorbance value of about 1.0-1.2) and to the intensity of the external irradiation (~1 mW/cm2). In fact, both these parameters can strongly affect the activity evaluation.
Figure 1.7: Irradiation set up for the methylene blue standard, com-prising: (1)
UV light source, (2) cover glass, (3) testing cylinder, (4) testing area and (5) sample under test. From [Mil12].
Actually, during the test, one measures the absorbance of the MB solution at the wavelength of 664 nm and relates it to the concentration according to the Lambert-Beer law:
𝐴 = 𝐶𝜖𝑥 (1.6)
where 𝐴 is the absorbance, 𝐶 is the dye concentration, 𝜖 is the molar extinction coefficient (for MB at 664 nm 𝜖𝑀𝐵664= 7.4 ∙ 104M−1cm−1) and 𝑥
21 parameters stay constant apart from the MB concentration, it is possible to extract the discoloration rate measuring the absorbance of the solution that is undergoing to photocatalytic reactions. As a matter of fact, one refers to the initial concentration 𝐶0 thus measuring the variation 𝐶𝐶0=𝐴𝐴0.
Moreover, it is assumed that the reaction occurs according to a first order exponential law:
𝐶 = 𝐶0𝑒(−𝑘𝑡) ⇒ ln (𝐶
𝐶0) = −𝑘𝑡 (1.7)
being 𝑘 the reaction rate constant and 𝑡 the time.
Figure 1.8: Absorbance spectra of a MB (dark blue dash-dot line, left y scale)
and emission spectra of the UV lamp used for the photocatalytic test (light blue line, right y scale).
The reason why the wavelength of 664 nm is chosen is easily understandable looking at the typical absorption spectra of MB. In Fig. 1.8 is reported the MB absorption spectra together with the irradiance spectra of
22
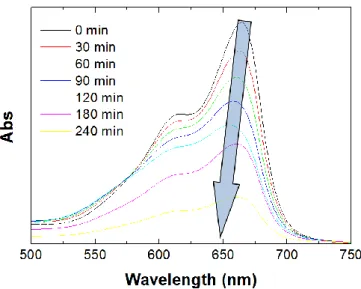
the UV lamp used for photocatalytic tests (TL 8 W BLB 1FM, Philips). The absorption spectrum of MB has two peaks, one at 664 nm and the other one at about 610 nm. While the first one is related to monomer absorption, the second one is related to the dimer [Liu12]. Thus, one records the absorption at the wavelength corresponding to the monomer concentration, i.e. 664 nm. In Fig. 1.9 are reported the absorbance measurements related to a test on Degussa P25 titania powder. It is clear that the concentration of MB decreases under illumination. This results evident from Fig. 1.10 where are reported the absorbance value of MB solution at 664 nm versus time, for different concentration of TiO2 powder.
Figure 1.9: Absorbance spectra of a MB solution irradiated with UV light versus
time. The solution contains Degussa P25 titania powder.
In our following experimental consideration we will adopt this methodology in order to evaluate the photoactivity of the elaborated samples.
23
Figure 1.10: Absorbance value of MB solution at 664 nm versus time, for
different concentration of TiO2 powder.
1.3 Plasmonic metal-TiO
2nanocomposites
Due to its wide band-gap, TiO2 (either rutile or anatase) absorbs
only in the UV range of the electromagnetic spectrum. However, sunlight contains a small amount of UV photons (~5%). Thus, in the last 20 years have been developed several strategies devoted to increase the efficiency of titanium dioxide under visible (solar) irradiation. Among the most extensively studied methods we cite the doping with N [Asa01], transition metals [Lit99] and C [Kha02], the coupling with a narrow band-gap semiconductor quantum dots [Rob06], the preparation of oxygen-deficient and/or hydrogen-rich TiOx [Che11][Che15] and the use of plasmonic metal
nanostructures [Lin11][Hou13].
We are interested, in particular, in this last approach. Plasmonics exploits the physics of collective oscillations of free electrons in metals, induced by the interactions with electromagnetic radiation. Incident light
24
can be either coupled to the metal-dielectric interface in a form of propagating Surface Plasmon Polariton (SPP) waves, or confined in the nanoscale metallic structures at Localized Surface Plasmon Resonance (LSPR) [Mai07][Nov06]. While SPPs are partially propagative (2D or 1D) plasmonic modes, LSPRs are completely localized modes (0D). When an electromagnetic wave hits a metal nanoparticle, one observes a scattered field whose composition can be split into two components: the far-field and the near-field. The first regards the propagation of the scattered wave, while the second regards an evanescent field localized few nm close to the metal nanostructure surface [Nov06]. In the following we will discuss LSPR and the effects of coupling plasmonic metal nanostructures with TiO2.
1.3.1 Localized Surface Plasmon Resonance (LSPR)
LSPRs are non-propagating excitations of the conduction electrons of metallic nanoparticles in an oscillating electromagnetic field. As schematically shown in Fig. 1.11 the interactions with a fixed background of positively charged ion cores gives a restoring force on the driven electrons so that a resonance can arise, leading to field amplification both inside and in the near-field zone outside the particle. The model is similar to that of a damped harmonic oscillator.
Since the conduction electrons in metals have nearly a continuum of available states, the optical properties of metals can be explained by a classical Drude model of free-electron gas moving against crystal lattice of positive ions [Gre98]. In the model, the details of lattice potential are approximated by an effective mass of electrons m, while the electron-electron and electron-electron-phonon interactions, as well as scattering on lattice defects or grain boundaries, are described by damping occurring with a characteristic frequency 𝛾 with typical values on the order of 1014 s-1 at room temperature. Within the Drude-Lorentz model, the dielectric function of a metal can be approximated as:
25 𝜀(𝜔) = 1 − 𝜔𝑝 2 𝜔2+ 𝑖𝛾𝜔 (1.8) where 𝜔𝑝= 𝑛𝑒 2
𝜀0𝑚 is the plasma frequency of the electron gas, depending on the electron density 𝑛.
Figure 1.11: Schematic of plasmon oscillation for a sphere, showing the
displacement of the conduction electron charge cloud relative to the nuclei. If we assume that the dimension of the metallic nanoparticle is much smaller than the wavelength of the exciting radiation, i.e. 𝑑 ≪ 𝜆, than the phase of harmonic electromagnetic field is nearly constant over the particle volume. Under this hypothesis, the charges in the nanoparticle will feel a static electromagnetic field. Therefore, the scattering problem can be simplified to a particle in an electrostatic field, known as quasi-static approximation [Mai07].
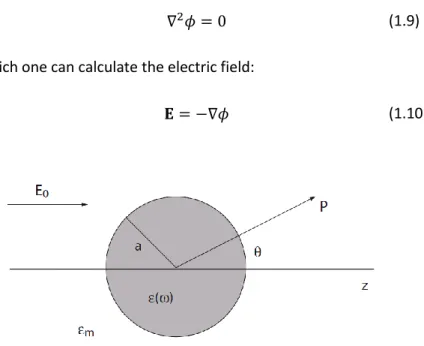
Consider a homogeneous spherical particle having radius 𝑎 and complex dielectric function 𝜀 = 𝜀(𝜔), embedded in an isotropic and non-absorbing medium having dielectric constant 𝜀𝑚. Assume that the particle
is immersed in an electrostatic field 𝐄 = E0𝑧̂. These hypothesis are
sketched in Fig. 1.12. The light scattering problem is addressed by solving the Laplace equation for potential 𝜙:
26
∇2𝜙 = 0 (1.9)
from which one can calculate the electric field:
𝐄 = −∇𝜙 (1.10)
Figure 1.12: Sketch of a homogeneous sphere placed into an electrostatic field. Due to the azimuthal symmetry of the problem, the general solution is of the form:
𝜙(𝑟, 𝜃) = ∑[𝐴𝑙𝑟𝑙+ 𝐵𝑙𝑟−(𝑙+1)] ∞
𝑙=0
𝑃𝑙(cos 𝜃) (1.11)
where 𝑃𝑙(cos 𝜃) are the Legendre Polynomials of order 𝑙, and 𝜃 is the angle
between the position vector 𝒓 at the z-axis. The coefficients 𝐴𝑙 and 𝐵𝑙 are
determined from the boundary conditions: (i) at 𝑟 → ∞and (ii) from equality of potentials, tangential components of the electric field, and normal components of the displacement field at 𝑟 = 𝑎 (sphere surface). Without presenting the detailed calculations [Jac99], the potentials inside 𝜙𝑖𝑛 and outside 𝜙𝑜𝑢𝑡 the sphere can be written as:
27 𝜙𝑖𝑛= − 3𝜀𝑚 𝜀 + 2𝜀𝑚E0𝑟cos 𝜃 (1.12) 𝜙𝑜𝑢𝑡 = − E0𝑟cos 𝜃 + 𝐩 ∙ 𝐫 4𝜋𝜀0𝜀𝑚𝑟3 (1.13)
being 𝜀0 the dielectric constant in vacuum and 𝐩 the dipole moment,
defined as:
𝐩 = 𝜀0𝜀𝑚𝛼𝐄0 (1.14)
introducing the polarizability 𝛼:
𝛼 = 4𝜋𝑎3 𝜀 − 𝜀𝑚
𝜀 + 2𝜀𝑚 (1.15)
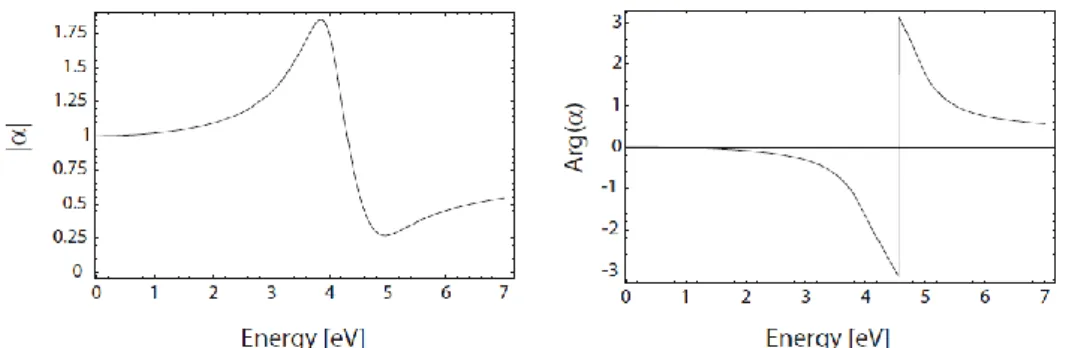
Fig. 1.13 shows the absolute value and phase of 𝛼 with respect to frequency 𝜔 (in energy units) for a dielectric constant varying as 𝜀(𝜔) of the Drude form (equation 1.8), in this case fitted to the dielectric response of silver [Mai07]. It is apparent that the polarizability experiences a resonant enhancement under the condition that |𝜀 + 2𝜀𝑚| is a minimum,
which for the case of small or slowly-varying Im{𝜀} around the resonance simplifies to:
Re{𝜀(𝜔)} = −2𝜀𝑚 (1.16)
This relationship is called the Fröhlich condition and the associated mode (in an oscillating field) the dipole surface plasmon of the metal nanoparticle. For a sphere consisting of a Drude metal with a dielectric function (1.8) located in air, the Fröhlich criterion is met at the frequency 𝜔0= 𝜔𝑝⁄√3.
Condition (1.16) further expresses the strong dependence of the resonance frequency on the dielectric environment: the resonance redshifts as 𝜀𝑚 is
28
Figure 1.13: Absolute value and phase of the polarizability 𝛼 (1.15) of a
sub-wavelength metal nanoparticle with respect to the frequency of the driving field (expressed in eV units). Here, 𝜀(𝜔) is taken as a Drude fit (equation 1.8) to the dielectric function of silver from [Joh72]. Taken from ref. [Mai07].
From the potential (1.12) and (1.13) it is possible to calculate the electric field:
𝐄𝑖𝑛 = 3𝜀𝑚
𝜀 + 2𝜀𝑚𝐄0 (1.17)
𝐄𝑜𝑢𝑡 = 𝐄0+3𝐧(𝐩 ∙ 𝐧) − 𝐩
4𝜋𝜀0𝜀𝑚𝑟3 (1.18)
where 𝐧 is the unit vector in the direction of the point of interest. As expected, the resonance in 𝛼 also implies a resonant enhancement of both the internal and dipolar fields. It is this field-enhancement at the plasmon resonance the peculiar characteristic of metal nanoparticle.
The above considerations demonstrate that in the quasi-static approximation (𝑎 ≪ 𝜆) a metal nanoparticle can be represented as an ideal dipole. Thus, we can extend the model in the case of time-varying fields, neglecting spatial retardation effects over the particle volume. From the viewpoint of optics, it is worth noting that another consequence of the resonantly enhanced polarization 𝛼 is a concomitant enhancement in the efficiency with which a metal nanoparticle scatters and absorbs light. The
29 corresponding scattering and absorption cross sections, calculated via the Poynting vector, are given by [Mai07][Boh83]:
𝜎𝑠𝑐𝑎 = 𝑘4 6𝜋|𝛼|2= 8𝜋 3 𝑘4𝑎6| 𝜀 − 𝜀𝑚 𝜀 + 2𝜀𝑚| 2 (1.19) 𝜎𝑎𝑏𝑠= 𝑘Im{𝛼} = 4𝜋𝑘𝑎3Im { 𝜀 − 𝜀𝑚 𝜀 + 2𝜀𝑚} (1.20)
where 𝑘 =2𝜋𝜆 is the wavenumber.
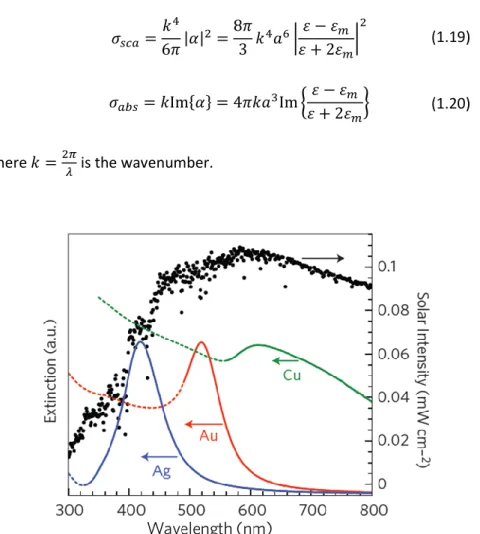
Figure 1.14: Simulated normalized extinction spectra of spherical Ag (38 nm
diameter), Au (25 nm), Cu (133 nm); in black the intensity of solar spectrum. From ref. [Lin11].
For noble metals, silver and gold, in air the resonance is observed in the visible region of the electromagnetic spectrum. Indeed, the wavelength (energy) at which plasmon resonance occurs strongly depends on the
30
metal. At a fixed electron density (i.e. for a certain metal), the plasmon resonance peak depends on the shape and on the dimension of the nanostructure [Kel03][Moc02][Nog07]. In fig 1.14 are reported the simulated extinction spectra (𝜎𝑒𝑥𝑡= 𝜎𝑠𝑐𝑎+ 𝜎𝑎𝑏𝑠) for nanoparticles
composed by Ag (blue), Au (red) and Cu (green). Note that the peak position changes for each metal. Moreover, one observes, especially for Au and Cu, a high value of the extinction for lower wavelengths (dashed lines) due to intraband transitions.
Figure 1.15: Experimental optical spectroscopy measurements of individual
silver nanoparticles having different shapes. From ref. [Moc02].
In Fig. 1.15 are shown the experimental data for Ag nanostructures having different shapes. In general, it is not obvious to predict how a certain shape will influence the position of the resonance peak.
31
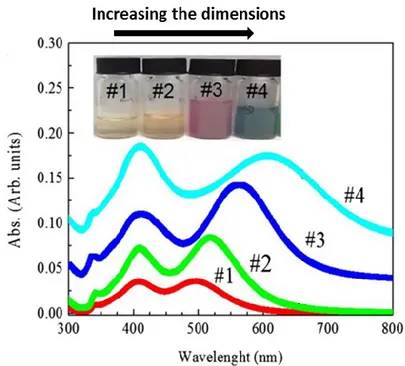
Figure 1.16: UV–Vis spectra of different Ag nanoplatelet solutions. The
nanoplatelets have a transversal size of 20 nm and a longitudinal length in the range 65–92 nm (growing from sample #1 to sample #4). In the inset, a photographs of the corresponding solutions are shown. From ref. [Zim15].
However, asymmetric and complex shapes can reveal several resonances, depending on the polarization of incident light [Kel03][Zim15]. In Fig. 1.16 are reported the UV-Vis spectra of Ag nanoplatelets whose transversal size is fixed (20 nm) while the longitudinal length varies in the range between 65 nm and 92 nm [Zim15]. This data are interesting since it is possible to observe two resonance peaks. The first one, located at about 400 nm, is fixed for all the samples and is related to the transversal size of the nanostructures. The second one redshifts from about 500 nm to about 650 nm and, at the same time, broadens as the longitudinal dimension increases.
32
Two mechanisms occur as the nanostructure size increases: a redshift and a broadening of the resonance peak [Cat08]. The first one is due to the dynamic depolarization: increasing particle dimensions, conduction electrons no longer move in phase, reducing the depolarization field and thus the restoring force, causing a redshift of the resonance. The second one is due the radiative damping: as scattering becomes significant, this re-radiation leads to a radiative damping correction to the quasi-static polarizability, the effect of which is to significantly broaden the plasmon resonance. Taking into account these effects, the polarizability will take the form [Mei83]: 𝛼 ≈ 1 − 1 10 (𝜀 + 𝜀𝑚)𝑥2 (13 + 𝜀𝑚 𝜀 − 𝜀𝑚) − 1 30 (𝜀 + 10𝜀𝑚)𝑥2− 𝑖4𝜋 2𝜀 𝑚3 2⁄ 3 𝜆𝑉03 𝑉 (1.21)
with 𝑥 =𝜋𝑎𝜆 is a size parameter. Comparing this equation with (1.15), one notes several new terms. In particular, the term 𝑥2 in the numerator accounts for retardation effects of the exciting field on the volume of the particle, causing a shift of the resonance. The same effect has the term 𝑥2 in the denominator, this time due to retardation in the depolarized field. For noble metals (and also for Drude metals) the total shift occurs towards lower energies (longer wavelengths). This is qualitatively explainable since in bigger particles there will be a greater distance among the charges at the opposite sides of the particles. This translates in a smaller resting force and thereby to lower resonance energy. The term in 𝑖 in the denominator of equation (1.21) takes into account the radiative damping coming from electrons oscillations [Kok72]. This phenomena is the main responsible for the broadening of the plasmon peak with the increase of particles size.
33
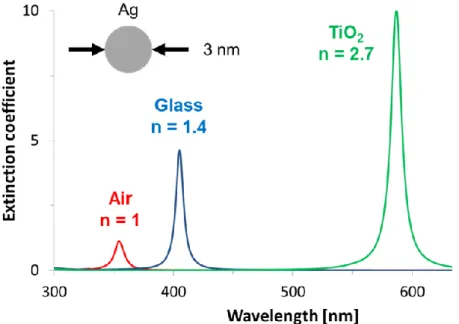
Figure 1.17: Simulation of the extinction spectra versus wavelength of a silver
sphere having diameter of 3 nm immersed in air (red), glass (blue) or TiO2 (green). The refractive index at the resonance peak wavelength of each medium is also reported.
The red-shift and broadening of the resonance with increased nanoparticle size would generally be expected to be an advantage for solar-driven applications, since it translates in an enlarged absorption of the visible spectrum.
As already pointed out, the dielectric constant of the embedding medium also dramatically influences the plasmon resonance and its quality factor [Kel03]. In Fig. 1.17 are reported the simulations of the extinction spectra of a silver sphere having diameter of 3 nm immersed in air (refractive index 𝑛 = 1), glass ( 𝑛 = 1.4 ) or TiO2 ( 𝑛 = 2.7 ). The
simulations clearly show how the plasmon peak shifts to higher wavelengths (lower energies) as the refractive index increases. At the same
34
time, one observes an increasing of the quality factor of the resonance, due to a higher confinement of the electric field.
1.3.2 Field enhancement in metal gaps
As previously mentioned, in the neighboring of the plasmonic metal nanoparticle one observes a high enhancement of the electromagnetic field, in particular during the occurrence of a LSPR. Such a high rise in the intensity of the field can, in principle, lead to non-linear effects both in the metal particle and in the embedding matrix. In Fig. 1.18 is reported the simulated magnitude of the electromagnetic field in the vicinity of a silver nanocube of diameter 75 nm, at a wavelength of λ = 420 nm matching the plasmon resonance [Lin11]. The field intensity is redistributed leading to a region where the field enhancement reaches a factor up to 103 times the incident intensity.
Figure 1.18: a) Spatial distribution of the SPR-induced enhancement of electric
field intensity at the SPR peak wavelength (420 nm), from a FDTD simulation of a 75 nm Ag nanocube. b) Enhancement in the electric field intensity at the SPR peak wavelength as a function of distance d along the dashed line indicated in a). Taken from ref. [Lin11].
35 The field enhancement is particularly strong inside metal gaps, i.e. in the space between two metal nanostructures close (few nm) each other [Pav13]. As an example, in fig 1.19 is shown the calculated maximum enhancement in the electric field intensity as function of distance between two Ag cubic particles [Lin11]. Remarkably, in this case the enhancement reaches a factor up to 104 for very close nanostructures.
Figure 1.19: Maximum enhancement in the electric field intensity as function of
distance between two Ag particles, calculated from a series of finite-difference time-domain (FDTD) simulations. Data taken from ref. [Lin11].
1.3.3 Metal-TiO2 nanocomposites
As previously mentioned, one of the main deficiency of TiO2 relies
on its wide band-gap. In order to enhance the material efficiency in the visible range of the electromagnetic spectrum, surface-plasmon mediated photocatalytic activity of TiO2 has become a hot research topic [Awa08]
36
As depicted in Fig. 1.20, metal nanostructures in presence of an external exciting electromagnetic field can interact with a photoactive substrate at least in three different ways [Nov06][Bha09]:
A. the far-field component of the scattered field will induce a prolonged optical path for photons and thereby will increase the probability of absorption within the semiconductor substrate; B. the near-field component of the field can cause locally
enhancement of the field intensity in the vicinity of the nanostructure, thus leading to non-linear effects as well as local heating effects;
C. as a consequence of the metal-semiconductor junction, a direct injection of photoexcited carriers into the substrate can occur as well as a charge separation process due to the Schottky barrier [Sze07].
Figure 1.20: Schematic of different interactions between a metal nanoparticle
and a photoactive substrate: (A) far-field scattering, (B) near-field scattering, and (C) direct injection of photoexcited carriers into the semiconductor. From ref. [Bha09].
For photocatalysis, the last two effects are particularly important. The advantage of the formation of e-/h+ pairs, close to the semiconductor surface, is that these charge carriers are readily separated from each other and easily migrate to the surface, where they can perform photocatalytic transformations.
37 Experimental evidences of the improvement in the photocatalytic activity under visible irradiation have been recently reported [Awa08] [Ing11][Lin11][Liu11][Hou13]. In Fig. 1.21 is reported the comparison between oxygen and hydrogen evolution from solution of Ag-TiO2 and bare
TiO2 nanocomposites upon illumination with a broadband visible source
(400-900 nm, ~500 mW/cm2, spectral peak at 580 nm) [Ing11]. The solution was prepared mixing a colloidal solution of Ag nanocubes with nitrogen-doped TiO2 (N-TiO2) solution. The composite was 5% metal by weight. The
presence of silver nanostructures is responsible for the enhancement in the activity of the photocatalyst through charge injection. According to this model, electrons near the metal Fermi level Ef are excited to surface
plasmon (SP) states; then, after the relaxation of the plasmon oscillations, some electron can transfer to the nearby semiconductor and, at this point, activate electron-driven processes such as the hydrogen-evolution half-reaction [Lin11] [Gov14](Fig.1.22).
Figure 1.21: H2 (squares) and O2 (circles) production upon visible illumination of N-TiO2 (black symbols) and Ag/N-TiO2 (blue symbols) photocatalysts, as measured by mass spectrometry. From ref. [Ing11].
38
In another experiment conducted by Liu et al. [Liu11], the enhancement in the photoactivity of an Au-TiO2 nanocomposite film is
explained in terms of the local electric field enhancement near the TiO2
surface, rather than by the direct transfer of charge between the two materials. According to the authors, in this case the near-field optical enhancement increases the electron-hole pair generation rate at the surface of the TiO2. In Fig. 1.23 (a)-(d) are reported the FDTD simulations on
the 5 nm thick Au film onto TiO2 substrate, showing the presence and
distribution of region of high electromagnetic field intensity (hot spots) within metal gaps. In Fig. 1.23 (e)-(f) are reported the experimental photocurrent measurements emphasizing the better performance of the Au-TiO2 composite film in the spectral range of interest for LSPR in gold (red
region of the visible spectra).
Figure 1.22: Mechanism of SPR-induced charge transfer with approximate
energy levels on the NHE scale. Dashed red lines refer to the water-splitting redox potentials (see Fig. 1.3). From ref. [Lin11].
39
Figure 1.23: On the left, (a) SEM image of a 5 nm thick Au island film on TiO2; FDTD simulated electric field intensity, in the plane xy (b,c) and in a vertical section (d). On the right, (e) photocurrent of anodic TiO2 with and without Au nanoparticles irradiated with λ = 633 nm light for 22 s; (f) photocurrent enhancement ratio spectrum; the dashed line refers to the bare TiO2 (value 1). From ref. [Liu11].
However, it has been also proposed a photocatalytic reaction directly on the surface of the plasmon excited metal nanoparticle [Chr11][Zha13][Gov14].In this picture, excited NPs inject hot electrons to
40
the states (orbitals) of the adsorbed species (reactants). It is a process similar to charge injection but without the mediation of the semiconductor material.
Whatever the process involved, it seems clear that the presence of metal nanostructures can effectively improve the efficiency under visible (solar) irradiation.
1.4 Conclusion
TiO2-based photocatalysis appears to be a promising technology for
a number of applications such as air purification, hazardous waste remediation and water treatment and disinfection. Indeed, in the framework of environmental friendly and sustainable technologies, solar-driven photocatalysis rises as ideal candidate for such a purpose. Towards the development of green photocatalysts, metal-TiO2 nanocomposites
appear as the ideal candidates for green remediation technology.
1.5 References
[Asa01] R. Asahi, T. Morikawa, T. Ohwaki, K. Aoki, Y. Taga, Science, 293, 269 (2001).
[Atw10] H. A. Atwater, A. Polman, Nature Materials 9, 205–213 (2010). [Awa08] K. Awazu, M. Fujimaki, C. Rockstuhl, J. Tominaga, H. Murakami, Y. Ohki, N. Yoshida, T. Watanabe, J. Am.Chem. Soc., 130, 1676–1680 (2008). [Bha09] P. Bharadwaj, B. Deutsch, L. Novotny, Adv. Opt. Photonics, 1, 438– 483 (2009).
[Boh83] C. F. Bohren; D. R. Huffman, Absorption of Light by Small Particles, Wiley: New York, 1983.
[Cat08] K. R. Catchpole, A. Polman, OPTICS EXPRESS, 16 (26), 21793 (2008). [Che11] X. Chen, L. Liu,P. Y. Yu, S. S. Mao, Science, 331, 746 (2011).
41 [Che12] K.-H. Chen, Y.-C. Pu, K.-D. Chang, Y.-F. Liang, C.-M. Liu, J.-W. Yeh, H.-C. Shih, Y.-J. Hsu, J. Phys. Chem. C, 116, 19039–19045 (2012).
[Che15] X. Chen, L. Liu, F. Huang, Chem. Soc. Rev., 44, 1861 (2015).
[Cho10] M. N. Chong, B. Jin, C. W.K. Chow, C. Saint, Water research, 44, 2997-3027 (2010).
[Chr11] P. Christopher, H. Xin, S. Linic, Nature Chemistry, 3, 467–472 (2011). [Dah14] M. Dahl, Y. Liu, Y. Yin, Chem. Rev., 114, 9853–9889 (2014).
[Der04] A. M. Derfus, W. C. W. Chan, S. N. Bhatia, Nano Letters, 4(1), 11–18 (2004).
[Fil07] F. Filippone, G. Mattioli, A. A. Bonapasta, Catal. Today, 129, 169−176 (2007).
[Fuj08] A. Fujishima, X. Zhang, D. A. Tryk, Surf. Sci. Rep., 63, 515-582 (2008). [Fuj72] A. Fujishima, K. Honda, Nature, 238, 37-38(1972).
[Ger66] H. Gerischer, J. Electrochem. Soc., 113, 1174−1182 (1966).
[Gov14] A. O. Govorov, H. Zhang, H. V. Demir, Y. K. Gun’ko, Nano Today, 9, 85-101(2014).
[Gre98] W. Greiner, Classical Electrodynamics, Springer, New York (1998) [Gop10] N. O. Gopal, H.-H. Lo, S.-C. Sheu, S.-C. Ke, J. Am. Chem. Soc., 132, 10982–10983 (2010).
[Han11] D. A. H. Hanaor, C. C. Sorrell, J. Mater. Sci. , 46, 855-874 (2011). [Has05] K. Hashimoto, H. Irie, A. Fujishima, Jpn. J. Appl. Phys., 44, 8269-8285 (2005).
[Hen00] R. Hengerer, B. Bolliger, M. Erbudak, M. Grätzel, Surf. Sci., 460, 162–169 (2000).
[Hof95] M. R. Hoffmann, S. T. Martin, W. Choi, D. W. Bahnemann, Chem. Rev., 95, 69-96 (1995).
[Hou13] W. Hou, S. B. Cronin, Adv. Funct. Mater., 23,1612–1619 (2013). [Jac99] J. D. Jackson, Classical Electrodynamics, John Wiley & Sons, Inc., New York, NY, 3rd edition (1999).
[Joh72] P. B. Johnson, R. W. Christy, Phys. Rev. B, 6(12), 4370–4379 (1972). [Kel03] K. L. Kelly, E. Coronado, L. L. Zhao, G. C. Schatz, J. Phys. Chem. B, 107, 668-677 (2003).
42
[Kit08] C. Kittel, Introduzione alla Fisica dello Stato solido, , Casa Editrice Ambrosiana, Italy, 8th Edition (2008).
[Kok72] Th. Kokkinakis, K. Alexopoulos, Phys. Rev. Lett., 28, 1632 (1972). [Ing11] D. B. Ingram, S. Linic, J. Am. Chem. Soc., 133, 5202–5205 (2011). [ISO10] ISO 10678:2010, “Fine ceramics, advanced technical ceramics –
determination of photocatalytic activity of surfaces in an aqueous medium by degradation of methylene blue”, ISO, Geneva, 2010.
[ISO15] http://www.iso.org/iso/home.html (accessed November 2015). [Lin95] A. L. Linsebigler, G. Lu, J. T. Yates Jr., Chem. Rev., 95, 735-758 (1995).
[Lin11] S. Linic, P. Christopher, D. B. Ingram, Nature Materials, 10, 911–921 (2011).
[Lit99] M. I. Litter, Appl. Catal. B, 23, 89-114 (1999).
[Liu11] Z. Liu, W. Hou, P. Pavaskar, M. Aykol, S. B. Cronin, Nano Letters 11, 1111-1116 (2011).
[Liu12] B. Liu, L. Wen, K. Nakata, X. Zhao, S. Liu, T. Ochiai, T. Murakami, A. Fujishima, Chem. Eur. J., 18, 12705 – 12711 (2012).
[Liu14] E. Liu, L. Kang, Y. Yang, T. Sun, X. Hu, C. Zhu, H. Liu, Q. Wang, X. Li, J. Fan, Nanotechnology, 25, 165401 (2014).
[Lut14] T. Luttrell, S. Halpegamage, J. Tao, A. Kramer, E. Sutter, M. Batzill, Scientific Reports 4, Article number: 4043 (2014) doi:10.1038/srep04043. [Mai07] S. A. Maier, Plasmonics: Fundamentals and applications, Springer, New York, (2007).
[Mal09] S. Malato, P. Fernandez-Ibanez, M. I. Maldonado, J. Blanco, W. Gernjak, Catal. Today 147, 1-59 (2009).
[Mat06] G. Mattioli, F. Filippone, A. Amore Bonapasta, J. Am. Chem. Soc., 128, 13772−13780 (2006).
[Mei83] M. Meier, A. Wokaun, Optics Letters, 8(11), 581-583 (1983). [Mil07] A. Mills, M. McFarlane, Catalysis Today, 129, 22–28 (2007).
[Mil12] A. Mills, C. Hill, P. K. J. Robertson, J. Photochem. Photobiol. A, 237, 7-23 (2012).
[Moc02] J. J. Mock, M. Barbic, D. R. Smith, D. A. Schultz, S. Schultz, J. Chem. Phys., 116, 6755 (2002).
43 [Nak03] R. Nakamura, A. Imanishi, K. Murakoshi, Y. Nakato, J. Am. Chem. Soc., 125, 7443−7450 (2003).
[Nog07] C. Noguez, J. Phys. Chem. C, 111, 3806-3819 (2007).
[Nov06] L. Novotny, B. Hecht, Principles of Nano-Optics, Cambridge Univ. Press, Cambridge, UK, (2006).
[Noz96] A. J. Nozik, R. Memming, J. Phys. Chem., 100, 13061-13078 (1996). [Ohn01] T. Ohno, K. Sarukawa, K. Tokieda, M. Matsumura, J. Catal., 203, 82–86 (2001).
[Pav13] P. Pavaskar, I.-K. Hsu, J. Theiss, W. H. Hung, S. B. Cronin, J. Appl. Phys., 113, 034302 (2013).
[Ram94] M. Ramamoorthy, D. Vanderbilt, R.D. King-Smith, Phys. Rev. B, 49, 16721 (1994).
[Rob06] I. Robel, V. Subramanian, M. Kuno, P. V. Kamat, J. Am. Chem. Soc., 128(7), 2385-2393 (2006).
[Ryu08] J. Ryu, W. Choi, Environ. Sci. Technol., 42, 294–300 (2008).
[Sca13] D. O. Scanlon, C. W. Dunnill, J. Buckeridge, S. A. Shevlin, A. J. Logsdail, S. M. Woodley, C. R. A. Catlow, M. J. Powell, R. G. Palgrave, I. P. Parkin, G. W. Watson, T. W. Keal, P. Sherwood, A. Walsh, A. A. Sokol, Nature Materials, 12, 798–801 (2013).
[Sha08] M. A. Shannon, P. W. Bohn, M. Elimelech, J. G. Georgiadis, B. J. Marinas, A. M. Mayes, Nature, 452, 301-310 (2008).
[Sta09] S. D. Standridge, G. C. Schatz, J. T. Hupp, J. Am. Chem. Soc., 131, 8407–8409 (2009).
[Suà08] S. Suàrez, M. Carballa, F. Omil, J. M. Lema, Rev. Environ. Sci. Biotechnol. 7, 125-138 (2008).
[Sze07] S. M. Sze, K. Ng Kwok, Physics of semiconductor devices, Third edition, John Wiley & Sons, NY, (2007).
[Teo12] W. Y. Teoh, J. A. Scott, R. Amal, J. Phys. Chem. Lett., 3(5), 629–639 (2012).
[Win08] T. Wintgens, F. Salehi, R. Hochstrat, T. Melin, Water Sci. Technol. 57, 99-107 (2008).
[Zha13] X. Zhang, Y. L. Chen, R. S. Liu, D. P. Tsai, Rep. Prog. Phys., 76, 046401 (2013).
44
[Zim15] M. Zimbone, E. Messina, G. Compagnini, M. E. Fragalà, L. Calcagno, J. Nanopart. Res., 17, 402 (2015).
45
Chapter 2: TiO2 nanoparticles obtained by laser ablation in
water
In this section we report about TiO2 nanoparticles (NPs) obtained by
a novel, industrially scalable and eco-friendly technique such as laser ablation in liquid. In particular, we observed that the photocatalytic performance of the synthetized nanomaterials is close to that of the commercial TiO2 powder (P25). Remarkably, the antibacterial performance
of the nanomaterial resulted higher than that of the commercial standard. The latter is in the crystalline state, while nanoparticles obtained via laser ablation are in amorphous phase. In order to describe the unexpected high photocatalytic activity, we suggest an explanation based on the high hydrogen content, as showed by FT-IR measurements. In addition, we studied the influence of metal nanoparticles by mixing TiO2 NPs with Ag
NPs.
2.1 Pulsed laser ablation in liquid
In the past two decades, with the rise of nanoscience, laser ablation has been broadly applied and developed for the synthesis of nanostructures [Zen12]. Nanoparticles are of great interest for a variety of application, including photocatalysis, due to the extremely high surface to volume ratio [Bey99][Lan13]. Pulsed Laser Ablation in Liquids (PLAL) has been proposed as a green, alternative nanoparticles synthesis method, addressing some of the drawbacks of the common chemical processes [Bar13]. By this method, laser radiation is used to ablate a solid target in a liquid environment, resulting in the formation of a nanoparticle colloid. A huge advantage of this synthesis route is its independence from chemical precursors (such as metal-organic substances), avoiding the use of toxic substances or by-products that possibly adsorb onto the nanoparticle surface. At the same
46
time, the post laser irradiation of suspended nanomaterials can be applied to further modify their size, shape, and composition [Zen12].
Laser ablation is a physical process that is fundamentally different from chemical nanoparticle synthesis routes. In the past, this process has been widely performed in a vacuum chamber (UHV or moderate gas pressure) and only recently systematic studies of laser ablation in liquids have been conducted [Yan12]. Such laser-generated colloidal nanoparticles are characterized by several potential advantages:
versatility: compared to common chemical reduction or
precipitation routes which rely on the availability of the respective precursors, this physico-chemical laser ablation method allows for the production of nanoparticles from any base material (metal, alloy, semiconductor, ceramic) and in numerous liquids, including polymer dissolving organic liquids or even ionic liquids.
availability of precursors: the solid raw material for laser-based nanoparticle production is easily available and often 5 to 10 times cheaper than commonly used metal-organic precursor compounds. purity: the synthesis method gives access to highly pure colloids,
without residual chemical precursors and without necessity of expensive cleaning treatments; this may also result in a high nanoparticle surface activity because the particle surface is not blocked by the chemical ligands or residues of the reducing agents. defects: under controlled conditions, defect-rich materials and
suboxides can be synthesized [Gol06][Zen05][Sem10], potentially broadening the range of optical, semiconducting, or catalytic properties.
The main disadvantage of this technique relies on the size polydispersity (20-40%).
47
2.1.1 Laser ablation mechanism
The laser-target interaction can be designed in different environments (vacuum, gas, or liquid) in order to fabricate various materials. The ablation of the target material upon laser irradiation is a very complex process. The incident laser pulse penetrates into the surface of the material within a certain penetration depth. This dimension is dependent on the laser wavelength and the refraction index of the target and is typically in the range of 1000 - 10 nm. At a laser fluence of some J/cm2, the material is typically converted to a plasma, which contains various energetic species including atoms, molecules, electrons, ions, clusters, particulates, and molten globules, and therefore possesses some unique characteristics such as high temperature, high pressure, and high density [Zen12]. Subsequently, the large pressure difference between the laser produced initial seed plasma and ambient conditions of the external environment causes a rapid expansion of the plasma plume that then cools down. This process is nearly adiabatic and transonic [Cha07]. Under suitable condensation conditions (temperature and pressure), the plasma species will nucleate and grow into desirable nanostructures, either on a substrate or in a cool liquid medium.
In the case of laser ablation in liquid, when the laser beam heats the metal target, plasma, vapor, and metal micro- or nanosized droplets can be generated as possible initial products, which further react with the liquid medium to form nanoparticles [Yan12]. So far, the main formation mechanisms of laser ablated nanostructures were based on: i) the thermal evaporation (and thus formation of the vapor or plasma phase) with the subsequent interactions with the liquid and ii) the explosive ejection of nanodroplets [Zen07][Liu08b][Niu10][Niu10b].
In Fig. 2.1 the laser ablation process in liquid ambient is sketched. First, a laser beam is focused onto a target substrate immersed in a liquid (Fig. 2.1(a)). As the beam energy is suddenly absorbed by the target surface, the temperature rises. The target material starts to vaporize and, as a consequence of the rise in the temperature, the liquid undergoes to phase
48
transition and reach the vapor phase. These phenomena induce a rapid increase in the pressure, thus a shock wave propagates, leaving behind a cavitation bubble (Fig. 2.1(b)). The cavitation bubble contains the plasma with a mixture of electrons, atoms and molecules coming from the target and the liquid. The cavitation bubble expands (Fig. 2.1(c)) till when the energy is relaxed and the material inside the bubble collapses in clusters and, subsequently, in nanoparticles (Fig. 2.1(d)).
Figure 2.1: Schematic representation of the laser ablation process.(a) A laser
beam is focused onto a target substrate immersed in a liquid. (b) As the beam energy is suddenly absorbed by the target surface, the sudden rise in temperature and pressure translates in a shock wave and a cavitation bubble. (c) The cavitation bubble contains a hot plasma with a mixture of electrons and atoms coming from the target and the liquid. The cavitation bubble expands and shrinks several times before (d) the formation of nanoparticles.
The ablation mechanisms is greatly determined by the laser parameters [Zen07][Niu10][Yan07]: the incident energy per unit area (fluence, 𝐹), the wavelength 𝜆𝐿, the pulse duration 𝜏𝐿 and the optical and
49 absorbed by the electrons of the target, leading to the formation of a gas of hot carriers which eventually transfer their energy to the ions through repeated emission of phonons; the ions and electrons gas eventually reach equilibrium (the temperature of the electrons gas, 𝑇𝑒, equals that of the
lattice, 𝑇), and this occurs on a timescale 𝜏𝐸= 10−12− 10−11 s [Sie95].
This timescale is crucially important for a proper description of the phenomenon, as it sets the boundary between strictly thermal and possible non-thermal routes to ablation, as well as between “long” and “short” pulses [vdL97]: if 𝜏𝐿≫ 𝜏𝐸, equilibrium between electrons and phonons
prevails throughout the heating stage and phase changes can be regarded as slow thermal processes involving quasi-equilibrium thermodynamics. In contrast, for ultrashort pulses (𝜏𝐿≤ 10−12 s), the material is driven into a
highly non-equilibrium state and 𝑇𝑒 ≫ 𝑇 [Yan12]: in this case, the time with
which structural changes take place, 𝜏𝑀, determines whether thermal
mechanisms are involved (𝜏𝑀≫ 𝜏𝐸) or not (𝜏𝑀< 𝜏𝐸 ). In the case of ns
pulses, the processes take place in the thermal regime. The hot electrons gas relaxes via electrons-phonons interaction and thermal effects are dominant. A portion of the target of the order of the temperature diffusion length melts and vaporizes. The fluence threshold is set by the minimum energy required the expulsion of the material:
𝐹 > 𝐹𝑡ℎ ≈ 𝜌Ω√𝐷𝜏𝐿 (2.1)
being 𝜌 the material density, Ω the evaporation enthalpy, 𝐷 the thermal diffusion coefficient and 𝜏𝐿, previously mentioned, the laser pulse. For
titanium 𝐹𝑡ℎ~ 3 J/cm2.
The literature concerning Ti ablation in water is controversial since some authors claim that the ablation of a titanium target in water results in the formation of metallic titanium nanoparticles [Sem10], while others have obtained TiOx particles [DeB13][Hua10][Nik09] or a mixture of amorphous
and crystalline phases [Bou13]. Reasonably, the details of laser ablation process have a strong impact on the properties of nanoparticles.
50
2.2 Photocatalytic and antibacterial activity of TiO
2NPs obtained
by laser ablation in water
2.2.1 Synthesis
The synthesis of laser ablated TiO2 nanoparticles (LA-NPs) was
performed by the PLAL method. A Nd:YAG (Giant G790-30) 1064 nm laser (10 ns pulse duration, 10 Hz repetition rate) was employed to irradiate a titanium metal plate (Goodfellow, purity 99.9%, as rolled). The laser was focused using a lens (focal length of 20 cm) on the bottom of a teflon vessel filled with 5 ml of deionised Milli-Qwater (resistivity 18 MΩ∙cm). The sample was irradiated at a fluence of 5 J/cm2 and the spot size was approximately 3.5 mm in diameter. The mass of the ablated material was estimated by weighting the target before and after the ablation with a microanalytical balance (Sartorius M5) with a sensitivity of 100 μg. The titanium concentration in solution was calculated assuming that ablated material has been totally converted in nanoparticle.
Commercial standard TiO2 nanoparticles (C-NPs) by Sigma-Aldrich
were used as a reference for the discoloration experiments. Batch solution is obtained by dissolving 8 mg of powder in 8 ml of Milli-Q water (final concentration of 1 mg/ml) and stirring for 30 min.
2.2.2 Materials and methods
The UV–Vis spectra were collected using a Perkin-Elmer Lambda40 spectrometer in the wavelength range 350-900 nm with an integrating sphere (Labsphere 20). DLS measurements were performed by a homemade apparatus [Zim12]: briefly, the illumination source was a 660 nm diode laser whose power ranged between 15 and 150 mW, and the light scattered at 90° with respect the forward direction was recorded. The