UNIVERSITÀ DEGLI STUDI DI CATANIA
DIPARTIMENTO DI MEDICINA CLINICA E SPERIMENTALE
Dottorato di ricerca in Biomedicina Traslazionale - XXXI ciclo
2018
M
ATILDE
C
IRNIGLIARO
Profiling of circulating microRNAs
in body fluids from
Autism Spectrum Disorder patients
D o c t o r a l t h e s i s
Supervisor:
P
ROF.
M
ICHELEP
URRELLOCoordinator:
“… The willingness to risk failure is an essential component of most successful initiatives. The unwillingness to face the risks of failure -or an excessive zeal to avoid all risks- is, in the end, an acceptance of mediocrity and an abdication of leadership. To use a sports metaphor, if you do not come to bat at all, or, when at bat, wait hopefully for a walk, you cannot hit a home run. At best, you can get to first base. Major leaguers can decide to play in the minor leagues, and they may have more hits and fewer failures there, but their impact on the game and on society would be very much diminished. The risk of failure is intrinsic to significant accomplishment. Even the great Babe Ruth struck out almost twice as often as he hit home runs. Successful change depends on experimentation with uncertain results. A willingness to occupy new ground always involves the risk of losing your footing along the way. We must also beware of raising the flag of failure too quickly. The world too often calls it failure if we do not immediately reach our goals; true failure lies, rather, in giving up on our goals. …”
Shapiro HT. The willingness to risk failure. Science. 1990;250(4981):609. doi: 10.1126/science.250.4981.609.
Abstract
Autism Spectrum Disorder (ASD) is the name for a heterogeneous group of complex neurodevelopmental conditions, which are clinically defined by: (1) defects in social interaction and communication; (2) fixed interests and repetitive behaviors. Given its prevalence and social impact, ASD is drawing much interest.
Molecular basis of ASD is heterogeneous and only partially known. In particular, ASD is genetically highly heterogeneous. ASD-associated variants have been characterized in hundreds of genes and separate transcriptome studies have identified points of convergence among these loci, proving that common biological processes play an essential role in this disorder. However, no common ASD-associated variants with large effect size, that would be appropriate for its molecular diagnosis, have been identified to date, and therefore, diagnosis just relies on clinical assessment and confirmation. Many factors, including disorders comorbid with ASD, like Tourette syndrome (TS), complicate ASD behavior-based diagnosis and make it vulnerable to bias.
Since their identification and characterization in serum and plasma of humans and other animals, extracellular microRNAs (miRNAs) have attracted researchers for their potential as new non-invasive tools for diagnosis, prognosis, and treatment evaluation of many human diseases and disorders. Circulating miRNAs can be detected, associated with extracellular vesicles, like exosomes and macrovesicles, or conjugated to RNA-binding proteins and lipoproteins, in all mammalian body fluids, from serum to saliva. Stability and general consistency of levels among individuals, along with the existence of specific expression signatures in association with both physiological and pathological conditions, make circulating miRNAs appropriate biomarkers: their convenient features also suggest the prospective alternative use of liquid biopsies as sources of biomarkers in the clinic.
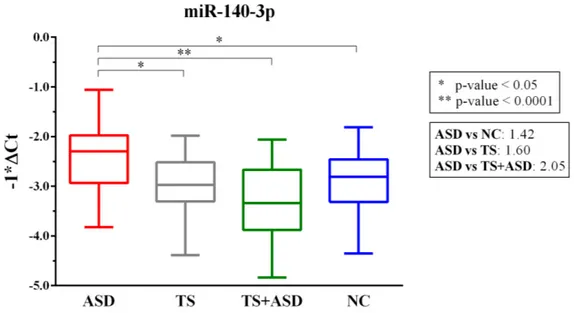
To further investigate ASD heterogeneous etiology and to identify potential biomarkers to support its precise (even differential) diagnosis, we used TLDA (TaqMan Low Density Array) technology to profile serum miRNAs from ASD, TS, and TS+ASD patients and NCs (unaffected controls). Through validation assays, we demonstrated that miR-140-3p is upregulated in ASD vs: NC, TS, and TS+ASD. We found that ΔCt values for miR-140-3p and YGTSS (Yale Global Tic Severity Scale) scores are positively correlated and show a linear relationship. Our network functional analysis showed that nodes controlled by miR-140-3p, especially CD38 (CD38 molecule) and NRIP1 (nuclear receptor interacting protein 1) that are its validated targets, are involved in processes convergingly dysregulated in ASD, such as synaptic plasticity, immune response, and chromatin binding. Through biomarker analysis, we proved that serum miR-140-3p can discriminate among (1) ASD and NC, (2) ASD and TS, and (3) ASD and TS+ASD, showing that it could be particularly useful to strengthen the behavior-based diagnosis of either ASD or TS+ASD, which can be challenging in some clinical cases.
Among all body fluids, saliva represents the most accessible and complete source of different types of molecules that could reflect genetic, epigenetic, environmental, metabolic, emotional, and behavioral alterations in ASD. For this reason, we also used NanoString nCounter technology to profile supernatant saliva circulating miRNAs from ASD patients and NCs. Through validation assays, we demonstrated that both miR-29a-3p and miR-141-3p are upregulated in ASD saliva compared to NC one. We observed that ΔCt values for both miRNAs are correlated with overlapping neuropsychiatric scores evaluating ASD defects in social interaction and verbal communication. Target genes of miR-29a-3p and miR-141-3p, in particular the well-documented ASD susceptibility gene PTEN (phosphatase and tensin homolog), represent main components and regulators of pathways and processes known to be dysregulated in ASD (i.e., PI3K-Akt-mTOR signaling pathway, neuronal differentiation, synaptic function, and methionine metabolism). Through biomarker performance evaluation, we proved that saliva 29a-3p and miR-141-3p when used in combination could be useful and non-invasive tools for discriminating ASD patients from NCs. In particular, these miRNAs could be used as supportive means for the recognition of ASD verbal and social defects.
Overall, our findings suggest that profiling of circulating microRNAs in body fluids can represent an easy and innovative approach to address and solve important biomedical issues, such as the need for molecular biomarkers and the necessity to further investigate neurodevelopmental and psychiatric disorders through more accessible patient biopsies. In fact, through the characterization of circulating miRNAs in serum and saliva from ASD patients, we identified three miRNAs that could facilitate ASD clinical assessment and confirmation and that are worth being further investigated for their potential central role in neurodevelopment.
I
Table of contents
Chapter 1. Autism Spectrum Disorder ... 1
1.1. Autism Spectrum Disorder (ASD): clinical definition and epidemiology ... 1
1.2. Heterogeneity of ASD etiology: genetic, epigenetic, and environmental factors ... 2
1.3. Multiple levels of ASD alterations ... 5
1.4. Converging molecular mechanisms in ASD ... 8
1.5. ASD behavior-based diagnosis ... 10
1.6. References ... 13
Chapter 2. Circulating microRNAs as potential biomarkers for neurodevelopmental disorders 16 2.1. MicroRNAs (miRNAs): the best characterized class of non-coding RNAs ... 16
2.2. Role of miRNAs inside the nervous system cells ... 22
2.2. Intracellular dysregulation of miRNAs in ASD ... 23
2.3. Extracellular miRNAs as non-invasive biomedical tools: the alternative use of liquid biopsies in neurodevelopmental and psychiatric disorders ... 23
2.4. Project hypotheses and aims: an easy and innovative approach to address important biomedical questions and needs ... 25
2.5. References ... 27
Summary of research ... 31
Chapter 3. Expression and Regulatory Network Analysis of miR-140-3p, a New Potential Serum Biomarker for Autism Spectrum Disorder ... 32
3.1. Abstract ... 32
3.2. Specific background and aims ... 32
3.3. Results ... 34
3.3.1. High-throughput expression analysis of circulating miRNAs in ASD, TS, and TS+ASD patients ... 34
3.3.2. Dysregulated expression levels of miR-140-3p in serum from ASD patients ... 34
3.3.3. Correlation between miR-140-3p expression and neuropsychiatric parameters ... 35
3.3.4. Reconstruction of miR-140-3p-mediated regulatory network: functional and expression analyses of network node genes ... 38
II
3.3.5. Serum levels of miR-140-3p in the discrimination of ASD patients ... 46
3.4. Discussion ... 50
3.5. Summary and conclusions ... 57
3.6. Materials and methods ... 58
3.6.1. Patient selection ... 58
3.6.2. Sample processing ... 59
3.6.3. RNA extraction ... 60
3.6.4. MiRNA profiling... 60
3.6.5. MiRNA profiling data validation ... 61
3.6.6. Correlation between miR-140-3p expression and neuropsychiatric parameters ... 61
3.6.7. Computational Analyses ... 62
3.6.7.1. Reconstruction of the miR-140-3p-mediated regulatory network ... 62
3.6.7.2. Network functional analysis ... 62
3.6.7.3. Network expression analysis ... 62
3.6.8. ROC curve analysis and biomarker performance evaluation ... 63
3.7. Supplementary Figures ... 64
3.8. References ... 71
Chapter 4. Circulating miRNAs in supernatant saliva from ASD patients ... 83
4.1. Abstract ... 83
4.2. Specific background and aims ... 83
4.3. Results ... 85
4.3.1. Profiling of circulating miRNAs in saliva from ASD patients ... 85
4.3.2. Dysregulated expression levels of miR-29a-3p and miR-141-3p in saliva from ASD patients ... 86
4.3.3. Correlation between expression levels of dysregulated miRNAs and neuropsychiatric parameters ... 88
4.3.4. Functional analyses of validated targets of miR-29a-3p and miR-141-3p ... 95
4.3.5. Saliva levels of miR-29a-3p and miR-141-3p in the discrimination of ASD patients .. 99
III
4.5. Summary and conclusions ... 112
4.6. Materials and methods ... 113
4.6.1. Patient selection ... 113
4.6.2. Saliva sample processing ... 114
4.6.3. RNA extraction and precipitation ... 114
4.6.4. MiRNA profiling through NanoString nCounter technology ... 115
4.6.5. MiRNA profiling data validation ... 116
4.6.6. Correlation between expression levels of dysregulated miRNAs and neuropsychiatric parameters ... 116
4.6.7. Functional analyses of validated targets of miR-29a-3p and miR-141-3p ... 117
4.6.8. ROC curve analyses and biomarkers’ performance evaluations ... 117
4.7. Supplementary Figures ... 119
4.8. References ... 126
IV
List of Figures and Tables
Figure 1. 1. Weighted 3-month prevalence rates for other DSM-IV diagnoses in comorbidity with
ASD in a British cohort of 112 ASD patients (Simonoff et al., 2008). ... 2
Figure 1. 2. Insight into the complex genetic architecture of ASD: lessons from rare syndromes with known genetic etiology and high incidence of autism and from genes recently identified to be associated with autism (de la Torre-Ubieta et al., 2016).. ... 3
Figure 1. 3. Effect sizes of rare and common variants associated with ASD (Geschwind, 2011). .. 4
Figure 1. 4. Multiple levels of alteration in ASD (de la Torre-Ubieta et al., 2016). ... 6
Figure 1. 5. Two main gene co-expression modules are associated with ASD (Voineagu et al., 2011). ... 9
Figure 1. 6. Panel reporting DSM-5 diagnostic criteria for ASD (Constantino and Charman, 2016). ... 11
Figure 1. 7. Panel reporting severity specifiers for each DSM-5 diagnostic criterion for ASD (Constantino and Charman, 2016).. ... 12
Figure 2. 1. Visualization of the Central Dogma by F.H.C. Crick (Crick, 1970). ... 16
Figure 2. 2. Percentage of non-coding DNA (A) and amount of protein-coding sequence (B) per haploid genome across species (Taft et al., 2007). ... 17
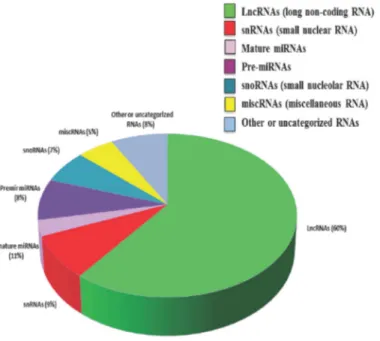
Figure 2. 3. Distribution of non-coding RNA types within the human genome (Malek et al., 2014). ... 18
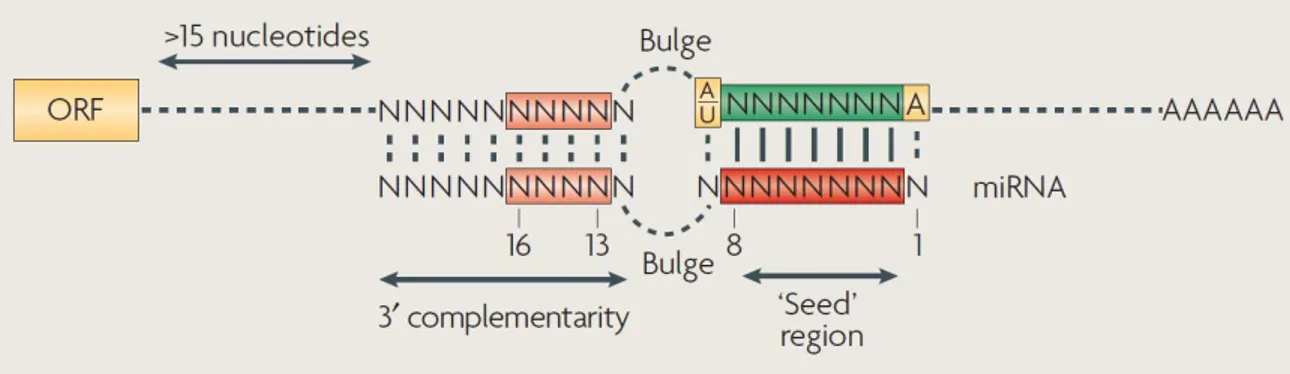
Figure 2. 4. Principles of microRNA–mRNA interactions in Metazoans (Filipowicz et al., 2008). ... 19
Figure 2. 5. A quantitative model of microRNA function (Ameres and Zamore, 2013). ... 19
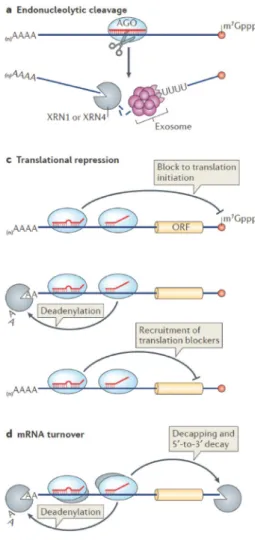
Figure 2. 6. MiRNA function in animals (Ameres and Zamore, 2013). ... 20
Figure 2. 7. MiRNA biogenesis (Ameres and Zamore, 2013). ... 21
Figure 2. 8. MicroRNA local translational control of neuronal plasticity (Kosik, 2006). ... 22
Figure 2. 9. Biological fluids as sources of potential miRNA-based biomarkers (Larrea et al., 2016). ... 24
Figure 2. 10. The two hypotheses on the origin and biogenesis of circulating miRNAs (Kumarswamy and Thum, 2013). ... 25
Figure 3. 1. MiR-140-3p is significantly dysregulated in serum of ASD patients. ... 35
Table 3. 1. Correlation between miR-140-3p expression and neuropsychiatric parameters. ... 35
Figure 3. 2. Correlation between serum levels of miR-140-3p and scores from YGTSS scale. .... 37
Table 3. 2. Over-represented GO Biological Process terms regarding nervous system and development in miR-140-3p-mediated regulatory network. ... 38
V
Table 3. 3. Over-represented GO, DO, and KEGG terms associated with CD38 in
miR-140-3p-mediated regulatory network. ... 41
Table 3. 4. Over-represented GO, DO, and Reactome terms associated with NRIP1 in miR-140-3p-mediated regulatory network... 43
Figure 3. 3. Expression analysis of node genes within miR-140-3p-mediated regulatory network in human ASD high-throughput gene expression datasets retrieved from GEO DataSets and ArrayExpress... 45
Figure 3. 4. Classical univariate ROC curve analyses for the comparisons in which miR-140-3p is dysregulated... 46
Figure 3. 5. The potential use of serum miR-140-3p as a biomarker: criteria for ASD diagnosis. ... 47
Figure 3. 6. Serum miR-140-3p could be used to discriminate ASD patients. ... 49
Table 3. 5. Clinical and neuropsychological features of study participants. ... 59
Figure S3. 1. MiR-140-3p-mediated regulatory network. ... 64
Figure S3. 2. Over-represented GO terms in miR-140-3p-mediated regulatory network compared to the entire genome. ... 65
Figure S3. 3. Over-represented KEGG and Reactome terms in miR-140-3p-mediated regulatory network compared to the entire genome. ... 66
Figure S3. 4. Over-represented DO terms in miR-140-3p-mediated regulatory network compared to the entire genome. ... 67
Figure S3. 5. Over-represented GO Biological Process terms regarding nervous system and development in miR-140-3p-mediated regulatory network. ... 68
Figure S3. 6. Over-represented GO, DO, and KEGG terms associated with CD38 in miR-140-3p-mediated regulatory network. ... 69
Figure S3. 7. Over-represented GO and Reactome terms associated with NRIP1 in miR-140-3p-mediated regulatory network. ... 70
Figure 4. 1. Ten miRNAs are dysregulated in saliva from ASD patients compared to NCs. ... 85
Table 4. 1. Ten miRNAs are dysregulated in ASD saliva. ... 86
Figure 4. 2. MiR-29a-3p and miR-141-3p are significantly upregulated in saliva from ASD patients. ... 87
Figure 4. 3. MiR-16-5p is slightly downregulated in saliva between ASD patients and NCs aged seven or older... 88
Table 4. 2. Correlation between miR-29a-3p expression and neuropsychiatric parameters. ... 88
Table 4. 3. Correlation between miR-141-3p expression and neuropsychiatric parameters. ... 89
Figure 4. 4. Correlation between saliva levels of miR-29a-3p and ADOS, VIQ, and ADI-R scores. ... 92
VI
Figure 4. 5. Correlation between saliva levels of miR-141-3p and both ADOS and ADI-R scores. ... 94 Table 4. 4. Linear regression analyses performed for the eight significant correlations found between saliva levels of dysregulated miRNAs and some neuropsychiatric parameters. ... 95 Table 4. 5. Validated targets of miR-29a-3p and miR-141-3p retrieved by miRTarBase database. ... 95 Table 4. 6. Over-represented GO, DO, and KEGG terms associated with genes controlled by miR-29a-3p. ... 96 Table 4. 7. Over-represented GO and KEGG terms associated with genes regulated by miR-141-3p. ... 98 Figure 4. 6. Classical univariate ROC curve analyses for miR-29a-3p and miR-141-3p. ... 100 Figure 4. 7. The potential use of saliva miR-29a-3p and miR-141-3p as classifiers for ASD. ... 101 Figure 4. 8. Individual miR-29a-3p and miR-141-3p in the discrimination of ASD patients. .... 103 Figure 4. 9. Combined miR-29a-3p and miR-141-3p in the discrimination of ASD patients. .... 105 Table 4. 8. Clinical and neuropsychological features of study participants. ... 114 Figure S4. 1. Over-represented GO terms in the list of target genes controlled by miR-29a-3p compared to the entire genome. ... 120 Figure S4. 2. Over-represented KEGG Pathway terms and Module terms in the list of target genes controlled by miR-29a-3p compared to the entire genome. ... 121 Figure S4. 3. Over-represented DO terms in the list of target genes controlled by miR-29a-3p compared to the entire genome. ... 122 Figure S4. 4. Over-represented GO terms in the list of target genes controlled by miR-141-3p compared to the entire genome. ... 123 Figure S4. 5. Over-represented KEGG Pathway terms and Module terms in the list of target genes controlled by miR-141-3p compared to the entire genome. ... 124 Figure S4. 6. Classical univariate ROC curve analyses for saliva miR-29a-3p and miR-141-3p. ... 125
Chapter 1
1
Chapter 1. Autism Spectrum Disorder
1.1. Autism Spectrum Disorder (ASD): clinical definition and epidemiology
Autism Spectrum Disorder (ASD) is the name for a heterogeneous group of complex neurodevelopmental conditions, which are clinically defined by: (1) defects in social interaction and communication; (2) fixed interests and repetitive behaviors. Typically, ASD symptoms become fully manifest during school age and have a lifelong impact on everyday functions (American Psychiatric Association, 2013).
The broadening of the autism concept and the resulting changes in ASD categorization have increased ASD awareness and improved its diagnostic surveillance in health and educational care. This has led to an alarming rise in the number of milder cases of ASD, without co-occurring intellectual disability, in developed countries around the world. Prevalence estimates under new ASD classification (American Psychiatric Association, 2013) are not available yet.
According to the Centers for Disease Control and Prevention (CDC) surveillance, approximately 1.5% of eight-year-old US children were affected by ASD in 2012: it clearly represents a major public health concern. In addition, 1% of English adults had ASD in 2007 (Lyall et al., 2016). Recently, it has been reported that ASD affects one in sixty-eight US children and that four males suffer from ASD for every female (Christensen et al., 2016).
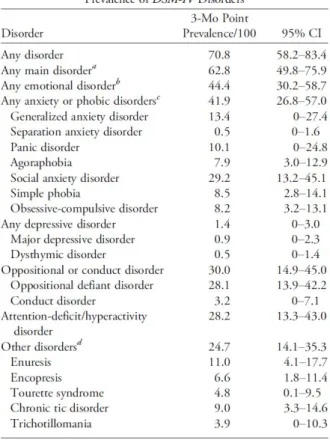
Comorbid neuropsychiatric and neurodevelopmental disorders contribute to ASD impairment, being common (70.8%) and frequently multiple (57%) in ASD children (Simonoff et al., 2008). Such conditions include social anxiety disorder (simultaneously diagnosed in 29.2% of ASD cases), attention-deficit/hyperactivity disorder (ADHD) (in 28.2% of ASD cases), oppositional defiant disorder (ODD) (in 28.1% of ASD cases), chronic tic disorder (in 9% of ASD cases), obsessive-compulsive disorder (OCD) (in 8.2% of ASD cases), and Tourette syndrome (TS) (in 4.8% of ASD cases) (Figure 1.1) (Simonoff et al., 2008).
2
Figure 1. 1. Weighted 3-month prevalence rates for other DSM-IV diagnoses in comorbidity with ASD in a British cohort of 112 ASD patients (Simonoff et al., 2008).
1.2. Heterogeneity of ASD etiology: genetic, epigenetic, and environmental factors
The exact etiology of ASD still remains unknown. Strong evidence suggests that ASD may arise from genetic, epigenetic, and environmental factors (Vorstman et al., 2017; Nardone and Elliott, 2016; Sun et al., 2016; Abdolmaleky et al., 2015).
ASD is genetically highly heterogeneous. Both inherited and de novo ASD-associated variants have been characterized in hundreds of genes (Figure 1.2). Separate transcriptome studies, aiming to identify points of convergence among these heterogeneous ASD-associated loci, show that common biological processes (discussed in Sections 1.3-4) play an essential role in this disorder. Much about ASD genetic origin and modes of inheritance has been understood through the investigation of rare medical genetic syndromes with high penetrance for ASD (Figure 1.2) (de la Torre-Ubieta et al., 2016).
Chapter 1
3
Figure 1. 2. Insight into the complex genetic architecture of ASD: lessons from rare syndromes with known genetic etiology and high incidence of autism and from genes recently identified to be associated with autism (de la Torre-Ubieta et al., 2016). Panel (A) shows inheritance patterns for
syndromes and genes, whereas panel (B) reports all the different types of genetic variation observed for those.
Both inherited and de novo rare genetic variants (Figure 1.2A, left, middle-left, and middle-right panels) can be detected in 10-30% of ASD cases (Vorstman et al., 2017). Single common inherited variants (Figure 1.2A, right panel) can be found in approximately 1.1-1.2% of ASD cases; when considered cumulatively, these can explain 15-50% ASD cases (Vorstman et al., 2017). Therefore, at the two extremes on the allelic spectrum (Geschwind, 2011), syndromic forms of ASD represent rare exceptional cases associated to variants with large effect sizes, whereas common variants with small to moderate effect sizes increase susceptibility to ASD, without being individually sufficient to be causal (Figure 1.3). However, no common risk loci for ASD, that would be appropriate for its molecular diagnosis, have been identified to date (Figure 1.3) (Vorstman et al., 2017).
4
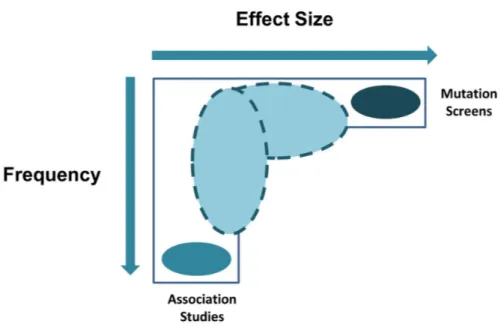
Figure 1. 3. Effect sizes of rare and common variants associated with ASD (Geschwind, 2011).
Association studies have helped the identification of SNPs associated with ASD with small to modest effect sizes; mutation screens and CNV studies, as well as the investigation of syndromic forms of ASD, have aided the discovery of rare variants with large effect sizes. Lower frequency intermediate effect alleles (depicted as ovals with dotted lines) still remain unexplored, and at the moment, there is no evidence supporting the existence of common alleles of large effect for ASD, those that could be efficiently used for its molecular diagnosis.
Several analyses performed in post-mortem brain and blood samples demonstrate the involvement of DNA methylation alterations in the etiology of ASD (Abdolmaleky et al., 2015). Recent histone acetylome analysis has identified widespread and stable histone acetylation changes in syndromic and idiopathic ASD prefrontal and temporal cortical regions, that are both involved in social cognition, proving that this disorder may also arise from histone modifications: it is worth noting that those histone acetylation changes are over-represented near ASD gene candidates (Sun et al., 2016).
Moreover, consistent evidences indicate that ASD-linked epigenetic and immune dysregulation are causally dependent. In fact, both MIA (maternal immune activation) and maternal autoimmune diseases are associated with ASD and can be considered as in utero environmental insults, for the developing fetus, that, similarly to other known determinants like maternal age, diet, stress, depression, smoking, and serum folate levels (Abdolmaleky et al., 2015), have a strong impact on epigenetic mechanisms such as DNA methylation and histone acetylation (Nardone and Elliott, 2016).
Finally, many prenatal and perinatal factors, immune factors, maternal dietary and lifestyle factors, and environmental chemicals have been proposed with some level of converging evidence as candidate risk factors for ASD over the past decade (Lyall et al., 2016).
Chapter 1
5
1.3. Multiple levels of ASD alterations
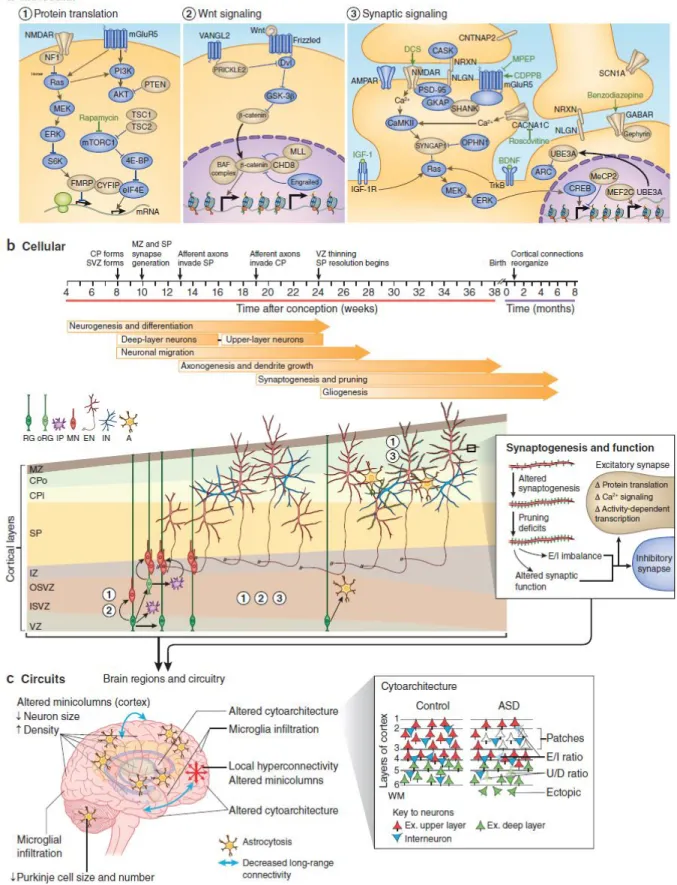
Neurotypical behavioral and cognitive functioning is the result of normal brain development, a complex phenomenon harmonized and finely regulated at multiple levels, requiring the generation, migration, and positioning of the correct number and type of cells, the growth and targeting of neuronal processes, and the formation of the precise number and type of synapses (de la Torre-Ubieta et al., 2016). Several molecular, cellular, and circuital alterations of all of these mechanisms have been identified in ASD (Figure 1.4) (de la Torre-Ubieta et al., 2016).
6
Figure 1. 4. Multiple levels of alteration in ASD (de la Torre-Ubieta et al., 2016). A typical social and
cognitive functioning is the result of normal brain development, a complex phenomenon that is finely regulated at the molecular (A), cellular (B), and circuital (C) levels. Several alterations of mechanisms at all of these levels have been identified in ASD. (A) Genes within these developmental pathways for which there is genetic evidence for a link to ASD are depicted in gold. (B) Cellular events (and
Chapter 1
7
corresponding pathways, see numbers) responsible for altered fetal cortical development and synaptic function observed in ASD. RG, radial glia; oRG, outer radial glia; IP, intermediate progenitor; MN, migrating neuron; EN, excitatory neuron; IN, interneuron; A, astrocyte; VZ, ventricular zone; ISVZ, inner subventricular zone; OSVZ, outer subventricular zone; IZ, intermediate zone; SP, subplate; CPi, inner cortical plate; Cpo, outer cortical plate; MZ, marginal zone. (C) Altered neuroanatomical phenotypes in ASD, regarding brain growth, cortical cytoarchitecture, and brain connectivity, emerge from defective neurogenesis, differentiation, migration, patterning, and synaptogenesis, in combination with reactive microglia infiltration and astrocytosis. E/I, excitatory or inhibitory neuron; U/D, upper-layer or deep-upper-layer neuron; WM, white matter.
All the heterogeneous ASD susceptibility genes converge in a small number of commonly dysregulated biological processes and pathways, like synaptic function (including long-term potentiation and calcium signaling), immune and inflammatory responses, signaling by WNT, NOTCH, and SWI/SNF (switch/sucrose non-fermentable) and NCOR (nuclear receptor corepressor) complexes, and PI3K (phosphatidylinositol-4,5-bisphosphate 3-kinase)/mTOR (mammalian target of rapamycin) signaling (Figure 1.4A) (Levitt and Campbell, 2009; Chen et al., 2014; Voineagu and Eapen, 2013; Gokoolparsadh et al., 2016; Ansel et al., 2017). Resultant micro- and macro-structural and functional abnormalities, which emerge during brain development in ASD, create the dysfunction of neural networks involved in socio-emotional processing (Vissers et al., 2012; Maximo et al., 2014; Kern et al., 2015; Ecker, 2017).
Neuroanatomical studies prove that ASD is accompanied by differences in brain anatomy, functioning and connectivity (Figure 1.4C), highly variable depending on stage of development and biological sex. Between the age of 2–4 years, the brain of children with ASD is enlarged in total volume: this early brain overgrowth may slow down or arrest during early and late childhood, and then, turn into an accelerated decline in whole brain volume by late adolescence and early adulthood. Perturbations in the development of cortical white matter and corpus callosum may be already present in infants with ASD scanned at 6 months of age (Ecker, 2017). Histological studies show differences in neuronal density across cortical layers (Figure 1.4B-C), suggesting abnormalities in the cellular mechanisms of migration and apoptosis driving cortical development in ASD, which may contribute to the observed early brain overgrowth.
Evidence of ASD cortical underconnectivity (typically in adolescence and adulthood) and overconnectivity (in childhood) involving multiple brain networks have been reported (Figure 1.4C). Long-range underconnectivity is a consistent finding in ASD, while results on short-range disrupted connectivity are variable, depending on the areas of the brain examined (Vissers et al., 2012; Maximo et al., 2014). The severity of the disorder is correlated with both kind of disrupted functional brain connectivity, suggesting that overconnectivity, despite being hyperspecialized, is inefficient in any case. Long-range connectivity is responsible for conscious processing, central coherence, and information processing and integration: so, its impairment may contribute to all the cognitive and behavioral difficulties typical of ASD (Vissers et al., 2012; Maximo et al., 2014). This form of neuropathology
8
observed in ASD has also been found in ADHD and TS, which are known to share similar symptomatology with ASD (Kern et al., 2015). Atypical effective connectivity (Maximo et al., 2014) and impaired anatomical connectivity (Vissers et al., 2012; Maximo et al., 2014) in ASD have also been explored.
Many individual components of the nervous system have been independently associated to ASD: fronto-temporal and fronto-parietal regions, limbic brain regions, the fronto-striatal circuitry, and the cerebellum (Figure 1.4C). Atypical neural structures in ASD, such as the amygdala, overlap with regions that are integral parts of the so-called social and emotional brain, involved in social cognition and emotional processing (Ecker, 2017).
1.4. Converging molecular mechanisms in ASD
ASD is a highly hereditable condition characterized by marked genetic heterogeneity. Therefore, much effort has been put in large transcriptomic studies on post-mortem brain samples, aiming to discover, through the WGCNA (weighted gene co-expression network analysis) approach, if this myriad of genetic or environmental risk factors convergingly perturbed common underlying molecular pathways important for brain development (Voineagu et al., 2011; Parikshak et al., 2016; Wu et al., 2016). These studies proved that regional patterns of gene expression that typically distinguish frontal and temporal cortex in normal brain are significantly attenuated in the ASD brain, suggesting alterations in cortical patterning (Voineagu et al., 2011; Parikshak et al., 2016). A genetically defined subtype of ASD, the chromosome 15q11.2-13.1 duplication syndrome (dup15q) endophenotype, shares the core transcriptomic signature observed in idiopathic ASD (Parikshak et al., 2016).
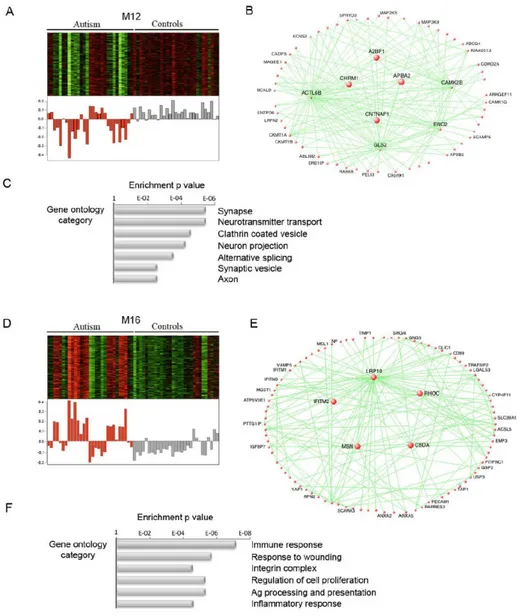
Through WGCNA approach, two main modules of co-expressed genes were found to be associated with ASD (Figure 1.5): (i) a downregulated neuronal module, enriched for known autism susceptibility genes and neuronal genes involved in synaptic function, and (ii) an upregulated module enriched for genes related to inflammatory and immune pathways and glial markers and function (Voineagu et al., 2011; Parikshak et al., 2016; Wu et al., 2016).
Chapter 1
9
Figure 1. 5. Two main gene co-expression modules are associated with ASD (Voineagu et al., 2011).
Panels (A), (B), and (C) refer to the neuronal module, while panels (D), (E), and (F) represent the immune-glial one. For each ASD-associated module, heatmap of genes belonging to the module, corresponding module eigengene values across all samples, visualization of the module, and relevant gene ontology categories enriched in it are reported.
Microglial and synaptic modules exhibit significant anticorrelation (Parikshak et al., 2016). The neuronal module is enriched for genetically associated variants, whereas the immune-glial module shows no enrichment for those, indicating a less pronounced genetic component for this immune upregulation, that is most likely either a secondary phenomenon or caused by environmental factors (Voineagu et al., 2011).
Collectively, these studies confirmed that transcriptional dysregulation is an important underlying mechanism of neuronal dysfunction in ASD and proved that diverse genetic perturbations can lead to phenotypic convergence at multiple biological levels in this complex neurodevelopmental disorder. These findings also provided a first molecular neuropathological basis for ASD. Since immune
10
molecules and cells such as microglia play a role in synaptic development and function, the observed immune up-modulation could be related to abnormal ongoing plasticity in ASD brain, a hypothesis supported by the striking attenuation of transcriptional differences observed between frontal and temporal cortex in ASD (Voineagu et al., 2011).
1.5. ASD behavior-based diagnosis
Since common risk loci for ASD have not been proposed yet (Vorstman et al., 2017), a molecular test for non-syndromic ASD is not available and diagnosis relies on clinical assessment and confirmation. Clinical diagnosis of ASD depends on behavioral observations, according to the Diagnostic and Statistical Manual of Mental Disorders (5th ed.; DSM–5; American Psychiatric Association, 2013)
Chapter 1
11
Figure 1. 6. Panel reporting DSM-5 diagnostic criteria for ASD (Constantino and Charman, 2016).
Accepted gold standard tools for diagnostic assessment of ASD are the Autism Diagnostic Observation Schedule (ADOS) and the Autism Diagnostic Interview-Revised (ADI-R) (Falkmer et al., 2013). Considering the clinical variation and etiological heterogeneity of ASD, a precise diagnosis can be very difficult. Behavior-based ASD gold standard diagnosis is a challenging process because: (i) it depends on the expertise of a multi-disciplinary team and on the quality of reports provided by caregivers and teachers; (ii) it is based on the direct observation of behavioral features and traits that are continuously, not categorically, distributed in the general population; (iii) it can be complicated by the wide range of ASD causes and presentations (Figure 1.7) and by its association with comorbid disorders (Figure 1.1) (Constantino and Charman, 2016); (iv) it depends on the use of different information gathering tools,
12
vulnerable to subjectivity and interpretive bias and often inappropriate to represent age, biological sex, and socio-cultural setting diversity of patients (Falkmer et al., 2013; Constantino and Charman, 2016; Varma and Iskandar, 2014).
Figure 1. 7. Panel reporting severity specifiers for each DSM-5 diagnostic criterion for ASD (Constantino and Charman, 2016). Severity specifiers translate the effect of symptoms in each criterion
domain (social interaction and communication, fixed interests and repetitive behaviors) onto three broad categories of adaptive functioning, reflecting the level of support that an ASD patient would require.
Therefore, there is an urgent need for potential ASD biomarkers that could support clinical discrimination of patients. The identification of ASD biomarkers could provide complementary and supportive means for a simpler, faster, and unbiased diagnosis and insight into ASD heterogeneous molecular basis.
Chapter 1
13
1.6. References
Abdolmaleky HM, Zhou JR, Thiagalingam S. An update on the epigenetics of psychotic diseases and autism. Epigenomics 2015;7(3):427-49.
American Psychiatric Association. Diagnostic and statistical manual of mental disorders. 5th ed. Washington, DC: American Psychiatric Association; 2013.
Ansel A, Rosenzweig JP, Zisman PD, Melamed M, Gesundheit B. Variation in Gene Expression in Autism Spectrum Disorders: An Extensive Review of Transcriptomic Studies. Front Neurosci. 2017;10:601.
Chen J, Alberts I, Li X. Dysregulation of the IGF-I/PI3K/AKT/mTOR signaling pathway in autism spectrum disorders. Int J Dev Neurosci. 2014; 35:35-41. doi: 10.1016/j.ijdevneu.2014.03.006.
Christensen DL, Baio J, Van Naarden Braun K, Bilder D, Charles J, Constantino JN, Daniels J, Durkin MS, Fitzgerald RT, Kurzius-Spencer M, Lee LC, Pettygrove S, Robinson C, Schulz E, Wells C, Wingate MS, Zahorodny W, Yeargin-Allsopp M; Centers for Disease Control and Prevention (CDC). Prevalence and Characteristics of Autism Spectrum Disorder Among Children Aged 8 Years-Autism and Developmental Disabilities Monitoring Network, 11 Sites, United States, 2012. MMWR Surveill Summ. 2016;65(3):1-23. doi: 10.15585/mmwr.ss6503a1.
Constantino JN, Charman T. Diagnosis of autism spectrum disorder: reconciling the syndrome, its diverse origins, and variation in expression. Lancet Neurol. 2016;15(3):279-91.
de la Torre-Ubieta L, Won H, Stein JL, Geschwind DH. Advancing the understanding of autism disease mechanisms through genetics. Nat Med. 2016 Apr;22(4):345-61. doi: 10.1038/nm.4071.
Ecker C. The neuroanatomy of autism spectrum disorder: An overview of structural neuroimaging findings and their translatability to the clinical setting. Autism. 2017;21(1):18-28.
Falkmer T, Anderson K, Falkmer M, Horlin C. Diagnostic procedures in autism spectrum disorders: a systematic literature review. Eur Child Adolesc Psychiatry. 2013;22(6):329-40.
Geschwind DH. Genetics of autism spectrum disorders. Trends Cogn Sci. 2011 Sep;15(9):409-16. doi: 10.1016/j.tics.2011.07.003.
Gokoolparsadh A, Sutton GJ, Charamko A, Green NF, Pardy CJ, Voineagu I. Searching for convergent pathways in autism spectrum disorders: insights from human brain transcriptome studies. Cell Mol Life Sci. 2016;73(23):4517-4530.
14
Kern JK, Geier DA, King PG, Sykes LK, Mehta JA, Geier MR. Shared Brain Connectivity Issues, Symptoms, and Comorbidities in Autism Spectrum Disorder, Attention Deficit/Hyperactivity Disorder, and Tourette Syndrome. Brain Connect. 2015;5(6):321-35.
Levitt P, Campbell DB. The genetic and neurobiologic compass points toward common signaling dysfunctions in autism spectrum disorders. J Clin Invest. 2009; 119(4):747-54. doi: 10.1172/JCI37934. Lyall K, Croen L, Daniels J, Fallin MD, Ladd-Acosta C, Lee BK, Park BY, Snyder NW, Schendel D, Volk H, Windham GC, Newschaffer C. The Changing Epidemiology of Autism Spectrum Disorders. Annu Rev Public Health 2016; 38:9.1-9.22.
Maximo JO, Cadena EJ, Kana RK. The implications of brain connectivity in the neuropsychology of autism. Neuropsychol Rev. 2014;24(1):16-31.
Nardone S, Elliott E. The Interaction between the Immune System and Epigenetics in the Etiology of Autism Spectrum Disorders. Front Neurosci 2016;10:329.
Parikshak NN, Swarup V, Belgard TG, Irimia M, Ramaswami G, Gandal MJ, Hartl C, Leppa V, de la Torre-Ubieta L, Huang J, Lowe JK, Blencowe BJ, Horvath S, Geschwind DH. Genome-wide changes in lncRNA, splicing, and regional gene expression patterns in autism. Nature. 2016;540(7633):423-427. doi: 10.1038/nature20612.
Simonoff E, Pickles A, Charman T, Chandler S, Loucas T, Baird G. Psychiatric disorders in children with autism spectrum disorders: prevalence, comorbidity, and associated factors in a population-derived sample. J Am Acad Child Adolesc Psychiatry 2008;47(8):921-9.
Sun W, Poschmann J, Cruz-Herrera Del Rosario R, Parikshak NN, Hajan HS, Kumar V, Ramasamy R, Belgard TG, Elanggovan B, Wong CCY, Mill J, Geschwind DH, Prabhakar S. Histone Acetylome-wide Association Study of Autism Spectrum Disorder. Cell. 2016;167(5):1385-1397.
Varma A, Iskandar J. Challenges in diagnosis of autism and the struggle of using western screening tools in different cultures. Psychiatrist's perspective. Indian Pediatr. 2014;51(5):356-7.
Vissers ME, Cohen MX, Geurts HM. Brain connectivity and high functioning autism: a promising path of research that needs refined models, methodological convergence, and stronger behavioral links. Neurosci Biobehav Rev. 2012;36(1):604-25.
Voineagu I, Eapen V. Converging Pathways in Autism Spectrum Disorders: Interplay between Synaptic Dysfunction and Immune Responses. Front Hum Neurosci. 2013;7:738.
Chapter 1
15
Voineagu I, Wang X, Johnston P, Lowe JK, Tian Y, Horvath S, Mill J, Cantor RM, Blencowe BJ, Geschwind DH. Transcriptomic analysis of autistic brain reveals convergent molecular pathology. Nature. 2011;474(7351):380-4. doi: 10.1038/nature10110.
Vorstman JAS, Parr JR, Moreno-De-Luca D, Anney RJL, Nurnberger JI Jr, Hallmayer JF. Autism genetics: opportunities and challenges for clinical translation. Nat Rev Genet. 2017; 18(6):362-376. doi: 10.1038/nrg.2017.4.
Wu YE, Parikshak NN, Belgard TG, Geschwind DH. Genome-wide, integrative analysis implicates microRNA dysregulation in autism spectrum disorder. Nat Neurosci. 2016;19(11):1463-1476. doi: 10.1038/nn.4373.
16
Chapter 2. Circulating microRNAs as potential biomarkers for
neurodevelopmental disorders
2.1. MicroRNAs (miRNAs): the best characterized class of non-coding RNAs
A genome is the complete set of DNA of an organism and each genome contains all of the information needed to build and maintain that organism, allowing it to grow and develop. Thanks to new NGS (next-generation sequencing) technologies it is now possible for scientists to easily retrieve these complete sets of genetic instructions, but still the biggest question about their interpretation remains open. How to decipher this unique genetic information, and finally, understand how each organism works?
The first successful attempts to interpret the genome were based on two general principles, stated by F. H. C. Crick in 1958, that have really shaped our proteome-based vision of the genome: the Sequence Hypothesis and the Central Dogma. The former assumes that the specificity of a nucleic acid is expressed solely by its base sequence, and that this sequence represents a simple code to produce a particular protein. The latter simply retraces the flow of sequence information and states that once information has passed into protein it cannot get out again (Figure 2.1) (Crick, 1958).
Figure 2. 1. Visualization of the Central Dogma by F.H.C. Crick (Crick, 1970). “In more detail, the
transfer of information from nucleic acid to nucleic acid, or from nucleic acid to protein may be possible, but transfer from protein to protein, or from protein to nucleic acid is impossible” (Crick, 1958).
As a consequence of the overestimation and misunderstanding of these two useful and inspiring principles, RNA was tacitly consigned to be the template (messenger RNA) and infrastructural platform (ribosomal and transfer RNAs) for protein synthesis.
Chapter 2
17
However, sequencing studies on the whole genome of many organisms of increased developmental complexity (Haemophilus influenzae and Mycoplasma genitalium in 1995, Saccharomyces cerevisiae in 1996, Caenorhabditis elegans in 1998, Drosophila melanogaster in 2000, Homo sapiens in 2001) quickly taught scientists that the number of protein-coding genes does not reflect the complexity of organisms and that the extent of protein-coding sequences remains relatively static over a wide range of developmental complexity (an unexpected finding that formulated the G-value enigma) (Figure 2.2B). On the contrary, the non-coding genome size gets bigger as the structural complexity of organisms increases (Figure 2.2A) (Taft et al., 2007). Surprisingly, what made more sophisticated organisms different from less complex ones was the fact that their genome contained more DNA of unknown function, that was consequently referred to as “junk” DNA.
Figure 2. 2. Percentage of non-coding DNA (A) and amount of protein-coding sequences (B) per haploid genome across species (Taft et al., 2007).
The ENCODE Project (ENCODE Project Consortium, 2007; ENCODE Project Consortium, 2012), aiming to delineate all functional elements encoded in the human genome, marked the ending of the
18
“junk” DNA. The consortium confirmed that the human genome, of which less than 2% encodes for proteins, is pervasively transcribed and identified previously unrecognized transcription start sites responsible for the production of many novel non-coding transcripts. Also, it assigned to the vast majority (80.4%) of the human genome at least one biochemical RNA- and/or chromatin-associated event with a regulatory function.
Our DNA is no longer “junk” but still a “dark matter”: however, regulatory non-coding RNAs may represent keys to the interpretation of our complexity in a new transcriptome-based vision of the genome. Our knowledge about the human non-coding transcriptome is continuously expanding. Figure 2.3 depicts the distribution of non-coding RNA types within the human genome (Malek et al., 2014).
Figure 2. 3. Distribution of non-coding RNA types within the human genome (Malek et al., 2014).
MicroRNAs (miRNAs) represent the best characterized class of non-coding RNAs to date and they were the first one giving researchers some precious hints about the important regulatory role of non-coding RNA molecules and offering them just a glance at all the hidden layers of regulation of gene expression. MiRNAs are 18-25 nucleotides long single-stranded RNAs that act as evolutionary conserved post-transcriptional regulators of gene expression, collectively increasing the precision and robustness of gene-regulatory networks and affecting all cellular pathways, from development to homeostasis, response to external factors, and metabolism (Berezikov, 2011). They negatively modulate the expression of their target mRNAs by binding to miRNA-binding sites present in the 3′-UTR of their
Chapter 2
19
targets mRNAs through a specific sequence, named seed region, that is a string of at least 6 nucleotides starting at position two of the 5′ of the miRNA (Figure 2.4) (Filipowicz et al., 2008).
Figure 2. 4. Principles of microRNA–mRNA interactions in Metazoans (Filipowicz et al., 2008).
There must be a perfect and contiguous base pairing between the miRNA seed region and the specific target mRNA. Bulges or mismatches must be present in the central region of the miRNA–mRNA duplex. Finally, there must be reasonable complementarity of the target mRNA to the miRNA 3′ half to stabilize the interaction. Mismatches and bulges are generally tolerated in this region.
Usually, miRNA-binding sites specific for the same or different miRNAs are present in multiple copies in the mRNA 3′ UTR. Therefore, a single miRNA can control the expression of several mRNAs, and a single mRNA may be targeted by more than one miRNA. Importantly, miRNA-binding sites are generally required in multiple copies for effective repression: when these are present close to each other, they tend to act cooperatively (Figure 2.5) (Filipowicz et al., 2008).
Figure 2. 5. A quantitative model of microRNA function (Ameres and Zamore, 2013). The relative
abundance of miRNAs and their targets inside the cell, together with the cumulative abundance of all target sites in the cell relative to the abundance of the miRNA, dictate the regulatory outcome.
High complementarity of the target mRNA to the miRNA 3′ half leads to the direct cleavage of the mRNA, whereas low complementarity between these sequences causes mRNA translational repression or decay (Figure 2.6) (Ameres and Zamore, 2013). These molecular mechanisms are mediated by the
20
RISC (RNA-induced silencing complex) complex that includes proteins belonging to the AGO (Argonaute) family; specifically, RISC endonuclease activity depends exclusively on AGO2 protein (Figure 2.7) (Filipowicz et al., 2008).
Figure 2. 6. MiRNA function in animals (Ameres and Zamore, 2013). (A) The vast majority of plant
miRNAs and just few animal miRNAs direct endonucleolytic cleavage of their mRNA targets. (C) In animals, miRNAs can mediate translational repression through the block of translational initiation, the mRNA poly(A) tail shortening or the recruitment of protein cofactors that can interfere with translation. (D) In many cells and tissues, miRNA-directed translational repression can be indistinguishable from mRNA turnover induction via decapping and 5ʹ‑to‑3ʹ decay.
Chapter 2
21
Figure 2. 7. MiRNA biogenesis (Ameres and Zamore, 2013). A primary miRNA (pri-miRNA) can be
transcribed by RNA polymerase II from independent genomic transcription units or from the introns of protein-coding genes. It has a stem-loop structure with a m7Gppp (7‑methylguanosine) cap and a 3’ poly(A) tail. The nuclear RNase III Drosha, along with the dsRNA-binding protein DGCR8, generates a precursor miRNA (pre-miRNA) with a ~60 nucleotide stem-loop structure. In the cytoplasm, the cytoplasmic RNase III Dicer, together with the dsRBP TRBP, cleaves the loop of the pre-miRNA producing a miRNA-miRNA* duplex, containing sequences that were at the 5’ and 3’ arms of the pre-miRNA, that will be loaded into an AGO protein as a dsRNA. However, the mature RISC will only load the more thermodynamically stable miRNA strand of the duplex, while the other one will be degraded. Cytoplasmic destinations of miRNAs include both P bodies and polysomes.
Extensive studies have shown that miRNAs control cellular processes, such as cell proliferation, differentiation, migration, cell death, and angiogenesis, which are crucial in the pathogenesis of cancer. Many miRNAs have been mainly identified as potential oncogenes or tumor suppressors in cancer development and progression and have been reported to be causally related to the neoplastic features of the cells (Ragusa et al., 2017).
22
2.2. Role of miRNAs inside the nervous system cells
Other than in neoplastic and degenerative diseases, miRNA dysregulation has also been observed in several neurodevelopmental and neuropsychiatric disorders, such as schizophrenia, major depressive disorder, anxiety, BD (bipolar disorder), and ASD (Geaghan and Cairns, 2015; Omran et al., 2012; Scott et al., 2015). Some miRNAs show differential spatio-temporal and sex-biased expression patterns in the developing human brain and regulate targets that are highly enriched for genes related to transcriptional regulation, neurodevelopmental processes, and common neurodevelopmental disorders, such as ASD, schizophrenia, and BD (Ziats and Rennert, 2014). MiRNAs are main players in the brain, where they control many developmental processes, including patterning, cell specification, local translational control of neuronal plasticity (Figure 2.8), neurogenesis, and neuronal apoptosis (Kosik, 2006).
Figure 2. 8. MicroRNA local translational control of neuronal plasticity (Kosik, 2006). Stimulation
by neurotransmitters or neurotrophic factors can regulate the local translation of mRNAs in polysomes found at the base of dendritic spines, a process that can be further controlled by miRNAs. Silenced mRNAs can be also translocated to dendrites through other silencing structures such as RNA granules and RBP (RNA binding protein) platforms. The image shows a peculiar rat example: Limk1(LIM-domain kinase 1) mRNA controlled by miR-134. miR-134 is expressed in the rat hippocampus, and its expression increases as the brain matures. Limk1 is a kinase that can affect spine structure by regulating actin filament dynamics. When Limk1 mRNA is translationally inhibited by miR-134 the size of spines is negatively regulated. Intriguingly, it has been shown that the miRNA maintains the translational silencing of its target until a synaptic input overrides the silencing.
Chapter 2
23
2.2. Intracellular dysregulation of miRNAs in ASD
Altered expression patterns of miRNAs have been found in many tissues and cells from ASD patients, such as brain cortex regions and cerebellum (Ander et al., 2015; Mor et al., 2015; Wu et al, 2016; Schumann et al., 2017), olfactory mucosal stem cells (Nguyen et al., 2016), peripheral whole blood (Huang, Long et al., 2015; Huang, Zhou et al., 2015), and lymphoblastoid cell lines (Sarachana et al., 2010; Ghahramani Seno et al., 2011).
A large genome-wide miRNA expression profiling study on post-mortem human brain samples, using the WGCNA approach (see Chapter 1, Section 1.4), identified (i) miR-21-3p as upregulated in ASD and targeting neuronal genes downregulated in ASD, and (ii) hsa_can_1002-m, a previously unknown, primate-specific miRNA, as downregulated in ASD and regulating the epidermal growth factor receptor and fibroblast growth factor receptor signaling pathways involved in neural development and immune function (Wu et al, 2016).
2.3. Extracellular miRNAs as non-invasive biomedical tools: the alternative use of
liquid biopsies in neurodevelopmental and psychiatric disorders
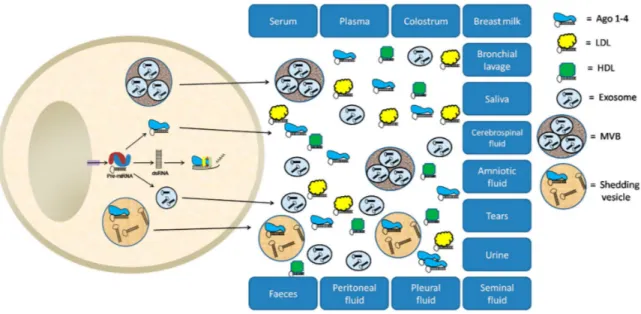
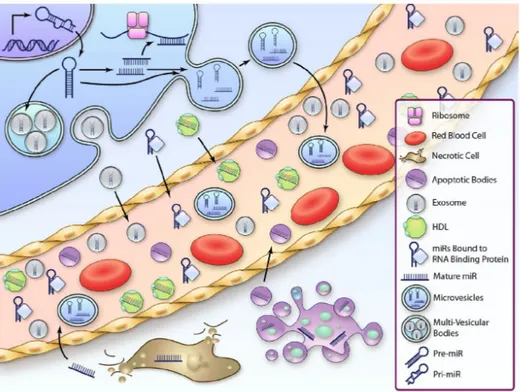
Since their identification and characterization in serum and plasma of humans and other animals (Chen et al., 2008; Chim et al., 2008), extracellular miRNAs have attracted researchers for their potential as new non-invasive tools for diagnosis, prognosis, and treatment evaluation of many human diseases and disorders. Extracellular miRNAs can be detected, associated with extracellular vesicles, like exosomes and macrovesicles, or conjugated to RNA-binding proteins and lipoproteins, in all mammalian body fluids: saliva, tears, urine, amniotic fluid, colostrum, breast milk, bronchial lavage, cerebrospinal fluid, vitreous humor of the eye, peritoneal fluid, pleural fluid, seminal fluid, and also feces, aside from serum and plasma (Figure 2.9) (Larrea et al., 2016).
24
Figure 2. 9. Biological fluids as sources of potential miRNA-based biomarkers (Larrea et al., 2016).
LDL: Low-density lipoprotein; HDL: High-density lipoprotein; MVB: Multivesicular body.
Stability and general consistency of levels among individuals, along with the existence of specific expression signatures in association with both physiological and pathological conditions, make circulating miRNAs appropriate biomarkers; these also suggest the prospective alternative use of liquid biopsies as sources of biomarkers in the clinic (Weiland et al., 2012; Larrea et al., 2016).
Numerous studies have identified either serum or plasma circulating miRNAs as promising biomarkers for neurodevelopmental and neuropsychiatric disorders, as ADHD (Wu et al., 2015), ASD (Mundalil Vasu et al., 2014; Chapters 3 and 4 of this doctoral thesis), TS (Rizzo et al., 2015), depression/anxiety disorder (Wang, Sundquist et al., 2015), posttraumatic stress disorder (Balakathiresan et al., 2014), BD (Rong et al., 2011), schizophrenia (Wei et al., 2015), and epilepsy (Wang, Tan et al., 2015; Wang, Yu et al., 2015; An et al., 2016), and other brain pathological conditions, like traumatic brain injury (Di Pietro et al., 2017) and vascular dementia (Ragusa et al., 2016).
However, when studying circulating miRNAs in pathologies, the biggest challenges are (i) to elucidate the relationship between the diseased tissue and the corresponding expression levels of these molecules observed in liquid biopsies and (ii) to verify if and how accurately these extracellular RNAs would reflect the transcriptomic snapshot of the physiological and pathological status of original cells (Ragusa et al., 2017). MiRNAs in circulation could either be passively released non-specific by-products of cellular activity and cell death or actively secreted cell-cell signaling messengers (Figure 2.10) (Larrea et al., 2016).
Chapter 2
25
Figure 2. 10. The two hypotheses on the origin and biogenesis of circulating miRNAs (Kumarswamy and Thum, 2013).
In many neurodevelopmental and psychiatric disorders, as it is for ASD (see Chapter 1, Section 1.3), these challenges are further complicated by the fact that a specific and unique diseased tissue has not been identified yet. Focusing on the contribution of extracellular vesicles, such as exosomes, to the expression of circulating miRNAs might help clarify potential tissue-body fluid links (Witwer, 2015).
2.4. Project hypotheses and aims: an easy and innovative approach to address
important biomedical questions and needs
My PhD research project consists of two studies, profiling circulating miRNAs in serum and saliva from ASD patients, respectively. To date, these two series of experiments specifically represent the third and fourth high-throughput studies profiling miRNAs in a body fluid from ASD patients, confirming that this research field is still mostly unexplored.
We hypothesized that the expression analysis of circulating miRNAs in serum and saliva could represent an easy and innovative approach to address and solve important biomedical issues related to ASD, such as the need for molecular biomarkers and the necessity to further investigate this disorder through more accessible patient biopsies.
26
In fact, while there are many studies proposing circulating miRNAs as appropriate biomarkers for human pathology, only a few of them exploit this easy liquid biopsy-based investigation approach in order to propose to the scientific community new potentially intriguing pathological mechanisms and central effectors in them. Even though retracing the role of dysregulated circulating miRNAs in a disorder is challenging (see Section 2.3) and making hypotheses about it can be very risky and misleading, using computational analyses to reconstruct their possible intracellular regulatory networks and functions can still be useful to gain further insight into the molecular basis of the disorder.
This is a particularly valuable option when investigating neurodevelopmental disorders, for which preferable tissue biopsies (post-mortem brain samples) are not readily and easily accessible to researchers. Overall, our computational analysis findings confirmed the validity of this alternative research use of liquid biopsies, since we were able to identify, at the same time, already known and completely new processes and molecules with a (potential) role in ASD.
Chapter 2
27
2.5. References
Ameres SL, Zamore PD. Diversifying microRNA sequence and function. Nat Rev Mol Cell Biol. 2013;14(8):475-88. doi: 10.1038/nrm3611.
An N, Zhao W, Liu Y, Yang X, Chen P. Elevated serum miR-106b and miR-146a in patients with focal and generalized epilepsy. Epilepsy Res. 2016;127:311-316.
Ander BP, Barger N, Stamova B, Sharp FR, Schumann CM. Atypical miRNA expression in temporal cortex associated with dysregulation of immune, cell cycle, and other pathways in autism spectrum disorders. Mol Autism. 2015 Jun 19;6:37.
Balakathiresan NS, Chandran R, Bhomia M, Jia M, Li H, Maheshwari RK. Serum and amygdala microRNA signatures of posttraumatic stress: fear correlation and biomarker potential. J Psychiatr Res. 2014;57:65-73.
Berezikov E. Evolution of microRNA diversity and regulation in animals. Nat Rev Genet. 2011;12(12):846-60.
Chen X, Ba Y, Ma L, Cai X, Yin Y, Wang K, Guo J, Zhang Y, Chen J, Guo X, Li Q, Li X, Wang W, Zhang Y, Wang J, Jiang X, Xiang Y, Xu C, Zheng P, Zhang J, Li R, Zhang H, Shang X, Gong T, Ning G, Wang J, Zen K, Zhang J, Zhang CY. Characterization of microRNAs in serum: a novel class of biomarkers for diagnosis of cancer and other diseases. Cell Res. 2008;18(10):997-1006.
Chim SS, Shing TK, Hung EC, Leung TY, Lau TK, Chiu RW, Lo YM. Detection and characterization of placental microRNAs in maternal plasma. Clin Chem. 2008;54(3):482-90.
Crick F. Central dogma of molecular biology. Nature. 1970;227(5258):561-3. Crick FH. On protein synthesis. Symp Soc Exp Biol. 1958;12:138-63.
Di Pietro V, Ragusa M, Davies D, Su Z, Hazeldine J, Lazzarino G, Hill LJ, Crombie N, Foster M, Purrello M, Logan A, Belli A. MicroRNAs as Novel Biomarkers for the Diagnosis and Prognosis of Mild and Severe Traumatic Brain Injury. J Neurotrauma. 2017;34(11):1948-1956. doi: 10.1089/neu.2016.4857.
ENCODE Project Consortium. An integrated encyclopedia of DNA elements in the human genome. Nature. 2012;489(7414):57-74. doi: 10.1038/nature11247.
ENCODE Project Consortium. Identification and analysis of functional elements in 1% of the human genome by the ENCODE pilot project. Nature. 2007;447(7146):799-816.
28
Filipowicz W, Bhattacharyya SN, Sonenberg N. Mechanisms of post-transcriptional regulation by microRNAs: are the answers in sight? Nat Rev Genet. 2008;9(2):102-14. doi: 10.1038/nrg2290.
Geaghan M, Cairns MJ. MicroRNA and Posttranscriptional Dysregulation in Psychiatry. Biol Psychiatry. 2015;78(4):231-9.
Ghahramani Seno MM, Hu P, Gwadry FG, Pinto D, Marshall CR, Casallo G, Scherer SW. Gene and miRNA expression profiles in autism spectrum disorders. Brain Res. 2011 Mar 22;1380:85-97.
Huang F, Long Z, Chen Z, Li J, Hu Z, Qiu R, Zhuang W, Tang B, Xia K, Jiang H. Investigation of Gene Regulatory Networks Associated with Autism Spectrum Disorder Based on MiRNA Expression in China. PLoS One. 2015 Jun 10;10(6):e0129052.
Huang F, Zhou T, Yao X, Yi J, Zhou F, Long Z, Hou X, Wang C, Chen Z, Jiang H. miRNA profiling in autism spectrum disorder in China. Genom Data. 2015 Aug 12;6:108-9.
Kosik KS. The neuronal microRNA system. Nat Rev Neurosci. 2006 Dec;7(12):911-20.
Kumarswamy R, Thum T. Non-coding RNAs in cardiac remodeling and heart failure. Circ Res. 2013;113(6):676-89. doi: 10.1161/CIRCRESAHA.113.300226.
Larrea E, Sole C, Manterola L, Goicoechea I, Armesto M, Arestin M, Caffarel MM, Araujo AM, Araiz M, Fernandez-Mercado M, Lawrie CH. New Concepts in Cancer Biomarkers: Circulating miRNAs in Liquid Biopsies. Int J Mol Sci. 2016;17(5).
Malek E, Jagannathan S, Driscoll JJ. Correlation of long non-coding RNA expression with metastasis, drug resistance and clinical outcome in cancer. Oncotarget. 2014;5(18):8027-38.
Mor M, Nardone S, Sams DS, Elliott E. Hypomethylation of miR-142 promoter and upregulation of microRNAs that target the oxytocin receptor gene in the autism prefrontal cortex. Mol Autism. 2015 Aug 14;6:46.
Mundalil Vasu M, Anitha A, Thanseem I, Suzuki K, Yamada K, Takahashi T, Wakuda T, Iwata K, Tsujii M, Sugiyama T, Mori N. Serum microRNA profiles in children with autism. Mol Autism. 2014;5:40. doi: 10.1186/2040-2392-5-40.
Nguyen LS, Lepleux M, Makhlouf M, Martin C, Fregeac J, Siquier-Pernet K, Philippe A, Feron F, Gepner B, Rougeulle C, Humeau Y, Colleaux L. Profiling olfactory stem cells from living patients identifies miRNAs relevant for autism pathophysiology. Mol Autism. 2016 Jan 8;7:1.
Omran A, Elimam D, Shalaby S, Peng J, Yin F. MicroRNAs: a light into the "black box" of neuropediatric diseases? Neuromolecular Med. 2012 Dec;14(4):244-61.
Chapter 2
29
Ragusa M, Barbagallo C, Brex D, Caponnetto A, Cirnigliaro M, Battaglia R, Barbagallo D, Di Pietro C, Purrello M. Molecular Crosstalking among Noncoding RNAs: A New Network Layer of Genome Regulation in Cancer. Int J Genomics. 2017;2017:4723193. doi: 10.1155/2017/4723193.
Ragusa M, Barbagallo C, Cirnigliaro M, Battaglia R, Brex D, Caponnetto A, Barbagallo D, Di Pietro C, Purrello M. Asymmetric RNA Distribution among Cells and Their Secreted Exosomes: Biomedical Meaning and Considerations on Diagnostic Applications. Front Mol Biosci. 2017;4:66. doi: 10.3389/fmolb.2017.00066.
Ragusa M, Bosco P, Tamburello L, Barbagallo C, Condorelli AG, Tornitore M, Spada RS, Barbagallo D, Scalia M, Elia M, Di Pietro C, Purrello M. miRNAs Plasma Profiles in Vascular Dementia: Biomolecular Data and Biomedical Implications. Front Cell Neurosci. 2016;10:51. doi: 10.3389/fncel.2016.00051.
Rizzo R, Ragusa M, Barbagallo C, Sammito M, Gulisano M, Calì PV, Pappalardo C, Barchitta M, Granata M, Condorelli AG, Barbagallo D, Scalia M, Agodi A, Di Pietro C, Purrello M. Circulating miRNAs profiles in Tourette syndrome: molecular data and clinical implications. Mol Brain. 2015;8:44. Rong H, Liu TB, Yang KJ, Yang HC, Wu DH, Liao CP, Hong F, Yang HZ, Wan F, Ye XY, Xu D, Zhang X, Chao CA, Shen QJ. MicroRNA-134 plasma levels before and after treatment for bipolar mania. J Psychiatr Res. 2011;45(1):92-5.
Sarachana T, Zhou R, Chen G, Manji HK, Hu VW. Investigation of post-transcriptional gene regulatory networks associated with autism spectrum disorders by microRNA expression profiling of lymphoblastoid cell lines. Genome Med. 2010 Apr 7;2(4):23.
Schumann CM, Sharp FR, Ander BP, Stamova B. Possible sexually dimorphic role of miRNA and other sncRNA in ASD brain. Mol Autism. 2017 Feb 7;8:4.
Scott KA, Hoban AE, Clarke G, Moloney GM, Dinan TG, Cryan JF. Thinking small: towards microRNA-based therapeutics for anxiety disorders. Expert Opin Investig Drugs. 2015 Apr;24(4):529-42.
Taft RJ, Pheasant M, Mattick JS. The relationship between non-protein-coding DNA and eukaryotic complexity. Bioessays. 2007;29(3):288-99.
Wang J, Tan L, Tan L, Tian Y, Ma J, Tan CC, Wang HF, Liu Y, Tan MS, Jiang T, Yu JT. Circulating microRNAs are promising novel biomarkers for drug-resistant epilepsy. Sci Rep. 2015;5:10201. Wang J, Yu JT, Tan L, Tian Y, Ma J, Tan CC, Wang HF, Liu Y, Tan MS, Jiang T, Tan L. Genome-wide circulating microRNA expression profiling indicates biomarkers for epilepsy. Sci Rep. 2015;5:9522.
30
Wang X, Sundquist K, Hedelius A, Palmér K, Memon AA, Sundquist J. Circulating microRNA-144-5p is associated with depressive disorders. Clin Epigenetics. 2015;7:69.
Wei H, Yuan Y, Liu S, Wang C, Yang F, Lu Z, Wang C, Deng H, Zhao J, Shen Y, Zhang C, Yu X, Xu Q. Detection of circulating miRNA levels in schizophrenia. Am J Psychiatry. 2015;172(11):1141-7. Weiland M, Gao XH, Zhou L, Mi QS. Small RNAs have a large impact: circulating microRNAs as biomarkers for human diseases. RNA Biol. 2012;9(6):850-9.
Witwer KW. Circulating microRNA biomarker studies: pitfalls and potential solutions. Clin Chem. 2015;61(1):56-63. doi: 10.1373/clinchem.2014.221341.
Wu LH, Peng M, Yu M, Zhao QL, Li C, Jin YT, Jiang Y, Chen ZY, Deng NH, Sun H, Wu XZ. Circulating MicroRNA Let-7d in Attention-Deficit/Hyperactivity Disorder. Neuromolecular Med. 2015;17(2):137-46.
Wu YE, Parikshak NN, Belgard TG, Geschwind DH. Genome-wide, integrative analysis implicates microRNA dysregulation in autism spectrum disorder. Nat Neurosci. 2016 Nov;19(11):1463-1476. Ziats MN, Rennert OM. Identification of differentially expressed microRNAs across the developing human brain. Mol Psychiatry. 2014 Jul;19(7):848-52.
Summary
31
Summary of research
In my PhD research project, I profiled circulating miRNAs in serum and saliva from ASD patients to gain further insight into ASD heterogeneous etiology and pathological mechanisms and to identify potential biomarkers to support its behavior-based diagnosis, using an easy liquid biopsy-based investigation approach.
Chapter 3 describes the serum study and was adapted from the manuscript titled with “Expression and Regulatory Network Analysis of miR-140-3p, a New Potential Serum Biomarker for Autism Spectrum Disorder” published in August 2017 on the scientific journal “Frontiers in Molecular Neuroscience” and co-authored by Cirnigliaro M, Barbagallo C, Gulisano M, Domini CN, Barone R, Barbagallo D, Ragusa M, Di Pietro C, Rizzo R, and Purrello M. Our serum circulating miRNA profiling through TLDA (TaqMan Low Density Array) technology led us to the identification of miR-140-3p as a possible biomarker performing at a high level in the discrimination among ASD and TS+ASD patients and as a potential player in the regulation of altered circadian rhythms in ASD.
Chapter 4 reports the more recent saliva study and represents the first draft of a new manuscript that is about to be submitted. Through a supernatant saliva circulating miRNA profiling by using NanoString nCounter technology, we found miR-29a-3p and miR-141-3p as possible supportive means for the recognition of ASD verbal and social defects that can be efficiently used in combination and we proposed them as intriguing targets for future investigation given their potential central role in neurodevelopment.
Both of these successful initiatives were possible thanks to the inspiring and fertile collaboration between the research group coordinated by Professor Michele Purrello, that I have joined for my PhD program, and the research team from the Section of Child and Adolescent Psychiatry at University of Catania led by Professor Renata Rizzo. Both Professors conceived the two projects with contributions by their group members. Our research group was in charge of designing and performing all the experiments and subsequent analyses. Professor Renata Rizzo and her collaborators were in charge of the recruitment and clinical assessment of study participants, of the sampling process, and of a critical revision of our combined results. I am extremely grateful to my Supervisor for the amazing opportunity that he has been giving me for these three years of playing a central role in both of these scientific adventures.