International Journal of Spatial Data Infrastructures Research, 2015, Vol.10, 1-26
1
Citizens and Institutions as Information Prosumers
The Case Study of Italian Municipalities on Twitter
Cristina Capineri1, Claudio Calvino2, Antonello Romano3
1Dispoc, Università di Siena, [email protected] 2Oxford Internet Institute, [email protected] 3 Ladest Lab., Università di Siena, [email protected]
Abstract
The aim of this paper is to address changes in public communication following the advent of Internet social networking tools and the emerging web 2.0 technologies which are providing new ways of sharing information and knowledge. In particular public administrations are called upon to reinvent the governance of public affairs and to update the means for interacting with their communities. The paper develops an analysis of the distribution, diffusion and performance of the official profiles on Twitter adopted by the Italian municipalities (comuni) up to November 2013. It aims to identify the patterns of spatial distribution and the drivers of the diffusion of Twitter profiles; the performance of the profiles through an aggregated index, called the Twitter performance index (Twiperindex), which evaluates the profiles’ activity with reference to the gravitational areas of the municipalities in order to enable comparisons of the activity of municipalities with different demographic sizes and functional roles. The results show that only a small portion of innovative municipalities have adopted Twitter to enhance e-participation and e-governance and that the drivers of the diffusion seem to be related either to past experiences and existing conditions (i.e. civic networks, digital infrastructures) developed over time or to strong local community awareness. The better performances are achieved mainly
This work is licensed under the Creative Commons Attribution-Non commercial Works 3.0 License.
To view a copy of this license, visit http://creativecommons.org/licenses/by-nc-nd/3.0/ or send a letter to Creative Commons, 543 Howard Street, 5th Floor, San Francisco, California, 94105, USA.
International Journal of Spatial Data Infrastructures Research, 2015, Vol.10, 1-26
2
by small and medium-sized municipalities. Of course, the phenomenon is very new and fluid, therefore this analysis should be considered as a first step in ongoing research which aims to grasp the dynamics of these new means of public communication.
Keywords: Social networks, Italy, comuni, Twitter, public communication, public institutions, Twitter performance index.
1. INTRODUCTION - CABLES AND COMMUNITIES
Cities have always been equipped with public spaces dedicated to the exchange of ideas among their citizens: squares, markets, coffee-bars, parks, libraries, neighbourhood centres and so on have been places where people meet, talk, discuss, aggregate and give shape to opinions, projects and social relationships, although with different roles over time. Such places, called civic nuclei by Mumford L. (1937), have been the theatres of communities where participation and a sense of belonging have flourished.
Recently these public spaces have been enriched by less material places which emerge through digital communication: digital squares, Wi-Fi corners, and all the other sites with free Internet connections through which citizens may have access to information services, commercial news, teleworking facilities, leisure activities, open data and much more.
These technological innovations have also affected the mode of communication on the Internet by creating communities of interest potentially free from the bond of physical proximity and bound together by mutual interests, practices and passions. This community building process has also been described as “communities of crickets” (Buchanan, 2002, p. 49) or “members of a food web” (Buchanan, 2002, p. 17). This process has been reinforced by the emergence of Web 2.0, which is characterized by a high level of interaction between the web and the user; it finds its expression in blogs, forums, chat rooms, the wikis, the platforms of sharing media like Flickr, YouTube, and especially social networks like Facebook, Twitter and Google+. Web 2.0 has changed the relationship between the user and the network into an approach characterized by strong social dimensions based on participation and sharing: if at first people gathered information passively from the Internet, today they can contribute to the creation of content and information that is freely accessible to the online community. The most notable example is Wikipedia, the digital encyclopedia created in 2001 by users who voluntarily compose and modify the entries (Graham and Zook, 2011).
International Journal of Spatial Data Infrastructures Research, 2015, Vol.10, 1-26
3
In this context new social spaces emerge that respond to the need for sociability and the desire for sharing to counteract the fragmented nature of contemporary life. Many sociological studies show that in these spaces proximity is still important (Sandoval-Almazan and Gil-Garcia, 2012
;
Takhteyev et al, 2012) and that knowledge of the locale and the sense of belonging to local networks are the main drivers of communication in the social media (Hecht and Gergle, 2010); the sense of belonging is a prerequisite for social solidarity, participation and collective action. This connective ability has attracted the interest not only of citizens but also of institutions and enterprises. In particular, public institutions, which are the focus of this contribution, are called upon to reinvent the governance of public affairs and to update the means for interacting with their communities; at the same time they become protagonists in a scenario that requires new professional skills and new abilities to accommodate and “exploit” the “collective intelligence” of Web 2.0 (Levy, 1994) in order to take advantage of communication interaction.2. FROM CIVIC NETWORKS TO SOCIAL MEDIA
The first attempts by public institutions to take advantage of the potentialities of digital communication began in the nineties of the last century: many Italian municipalities started creating forms of e-government through web pages and official websites that were intended to make information accessible and useful to a wide audience following a unidirectional model of "one to many". The first tools adopted by Italian municipalities were "civic networks" (reti civiche) or digital information systems, which conveyed information about a limited geographical area (e.g. municipality, metropolitan area, region, comunità montana, etc.); in most cases the civic networks were simple "showcase sites" providing information on public services (public transport timetables, office opening hours, etc.), institutional activities (minutes of council meetings, new regulations), cultural events and so on. Some introduced simple online services (bookings, applications, procurements, etc.) and very few offered more advanced e-governance tools such as blogs and forums. The 9th CENSIS Report on Italian digital cities showed that by 1997, 545 municipalities (out of more than 8,000 Italian municipalities) had developed their civic network, rising to 1275 in 1999 according to the Osservatorio Reti Civiche (www.citinv.it).
More recently, Web 2.0 applications have changed the purpose of such digital tools which are now adopted by institutions to initiate forms of e-governance and to strengthen participation from and dialogue with the general public: since the beginning of this century Facebook pages and Twitter accounts have been created alongside websites. Many public institutions have developed virtual civic
nuclei where citizens and institutions themselves can participate in an active way:
local authorities, ministries, associations, public services and citizens become
International Journal of Spatial Data Infrastructures Research, 2015, Vol.10, 1-26
4
model "many to many". The term prosumer was introduced by Alvin Toffler (1980) to indicate proactive consumers or consumers who could take part in the production process with advice and personal comments to leverage the standardized mass production model; the neologism has been much used since the beginning of the twenty-first century with the rise of the wiki process characterized by collaboration and sharing among the actors taking part.
In this context the increasingly popular social applications (social media, blogs, micro blogging, live streaming etc.) on which this study focuses are particularly relevant because they are the channels towards which “the people of the Web” gravitate: their activity is the footprint of daily routines, movements, ideas and values which reveal new forms of sociability, social activism and engagement. If the communication and dissemination of coded information came into being as one of the tools of the economy of globalization, social applications allow people to create spaces full of information on daily life, which is heterogeneous and shaped by people’s different social and cultural backgrounds. Moreover, daily life is local by its nature: daily issues ranging from health to entertainment, to education, to the supply and security of goods and services relate largely to the local scale; the traditional types of information and data used in the past (census data, on the spot surveys) were not good at managing and dealing with knowledge (Elwood et al, 2012 p.11). Information gathered through social networks shows two particularly important features: real-time recording and the proactive approach of the user. Timeliness in capturing and communicating an event (e.g. floods, fires, etc.), a problem (e.g. a traffic jam), an opinion, a feeling, and so on enable the user to contribute to his/her environment in a participatory and collaborative way; these contributions help decision-making and problem-solving processes to be undertaken more quickly than in the past (Bertot et al, 2012).Moreover, social media are able to provide the information that is needed also for the building of spatial data infrastructures (SDI) (Craglia 2007); the literature defines this new category of SDI as “unconventional”(Elwood et al, 2012; De Longueville et al, 2009).
For institutions the complex challenge that remains is to collect these contributions produced by the community and to filter and validate them with the purpose of improving governance. These tools therefore provide an important opportunity to establish and consolidate good governance based on efficiency, transparency, simplification and on the development of collaborative solutions for critical issues.
2.1. The Fortune of Twitter
Twitter is now a well-established and important ‘micro blogging’ platform for real time public communication. The success of Twitter is recent since it was founded only in 2006 and quickly spread on the back of some global events, such as the
International Journal of Spatial Data Infrastructures Research, 2015, Vol.10, 1-26
5
American presidential elections in 2012 and some natural disasters (for example Hurricane Sandy in 2012, the earthquake in Haiti in 2009). In Italy Twitter users spread the news of the earthquake in L’Aquila in 2009 even before newspapers and television; and we should also remember the experience of the 5 Star Movement in Italy which used Twitter not only to gauge citizens’ opinions but to create the critical mass of the movement itself (Calvino et al. 2013).
The cultural and scientific debate on Twitter is very lively and its potentialities and functionalities are analyzed in various fields ranging from marketing to post-disaster management, from influencing public opinion to appreciation of products and services. The literature on Twitter is burgeoning and includes studies focusing on different issues such as the use of Twitter during natural disasters and their possible applications in the management of the event (Sakaki et al, 2010; Zook et al, 2010); the evolution of illnesses such as swine flu (Polgreen et al, 2008), predictions about the success of a new film production (Asur et al, 2010), the results of political elections (O'Connor et al, 2010; Tumasjan et al, 2010), stock market trends (Bollen et al, 2010), or even measuring the level of happiness felt by the population (Biever, 2010). From a different perspective, other studies have addressed the dynamics that lay behind the creation of social networks via Twitter, their size, the virtual social relationships and the behavioural approaches that characterize them (Java et al. 2007; Krishnamurthy, 2008). Finally others have focused on the demographics of Twitter users (or Tweeple) (Mislov et al, 2011). It is also worth mentioning the analysis which has explored the controversial issue of privacy and the risks associated with identity theft (Humphreys et al, 2010; Correa et al, 2012); in this context other studies focus on the impact that Twitter can have on the theoretical definition of privacy, in the sense of its potential democratization (Elwood et al, 2012), or on the problematic relationship, even in the virtual world, between private and public (Small et al, 2012).
The interest in the potentialities and benefits of social media in public administration is increasing (Di Costanzo, 2012; Formez PA, 2012; Pennisi, 2012; Bertot et al, 2012; Snead, 2013) even though it is widely recognized that social media do not automatically translate into citizen engagement (Bonsòn et al, 2012; Kamal, 2009; Panagiotopoulos et al, 2011). The issue of evaluation of performance is still mainly neglected by the literature.
The remainder of the paper is structured as follows. First, the contribution presents an analysis (updated to November 2013) of the official Twitter profiles of Italian comuni, namely their diffusion in time and space; then the evaluation of the profiles’ activity is carried out through traditional indicators (e.g. followers, tweets); thirdly the performance of the profiles is assessed in relation to the reference context (e.g. population size of the gravitational area , the profile’s activity) through a specially created indicator (Twiperindex); finally a qualitative
International Journal of Spatial Data Infrastructures Research, 2015, Vol.10, 1-26
6
analysis of the most used hashtags is carried out in order to show the applications and the communication strategies. The overall questions that the paper tries to answer are: what are the drivers that push municipalities to create their own profile? Which are the best-performing municipalities? Are they the large urban centres or perhaps the small ones? Are profile rankings based on the number of tweets and followers satisfactory, or is there a need to place profiles in their functional context in order to enable comparisons and evaluate their ability to reach their potential community?
3. ITALIAN MUNICIPALITIES ON TWITTER
The use of Twitter by public administrations is a sign of a change in communication methods in the public sphere: the feature that is most relevant in this area is Twitter’s double nature, which is both public and personal: unlike other social networks, such as Facebook, the relationship between the user who sends the message and the one who reads it is not reciprocal nor obvious. In the case of Twitter, the tweet, expressed in 140 characters, does not require a direct response; the follower does not necessarily come into contact with the one who sends the message, but just wants to be informed of the messages sent. Nevertheless the viral aspect is strong: in fact much of the consumption and use of information is made possible and amplified by existing contacts on the Internet. 3.1. Data and Methodology
In order to analyze the adoption and use of Twitter by Italian municipalities, the survey has looked at the official profiles of Italian municipalities on the platform. The municipal level has been selected as the most relevant to highlight the functional relationship between communities and public institutions and innovations in means of communication. In Italy there are 8057 municipalities (comuni) which differ greatly in population size and area: only Rome and Milan have a population larger than 1 million inhabitants, and only another 4 have a population of > 500,000 inhabitants (Istat, 2011); all the rest have quite small populations.
The official Twitter accounts of Italian municipalities were collected by means of a direct search on the official web pages of each municipality up to November 2013. Then data about each profile were gathered including:
the date of activation: this indicates whether the municipality was an early or late adopter of the Twitter profile;
the degree of activity and engagement expressed by the number of tweets posted: tweets are a simple indicator of activity and a proxy of the profile’s interactivity;
International Journal of Spatial Data Infrastructures Research, 2015, Vol.10, 1-26
7
the profile penetration through the number of followers: followers represent the critical mass the profile has been able to attract and it is generally correlated to the population size of the municipality;
the "following" dimension indicates the interests of the profile itself in other subjects or topics, and it will be considered in the Twiperindex; retweets and mentions were not taken into account, despite their influencing value (Bakshy et al. 2011) since the focus is mainly on the profile’s outgoing activity rather than the information diffusion patterns:
the "strategic activity" through the most used hashtags (#), collected on twitonomy.com, which allows us to grasp, even if only in general terms, the main topics dealt with in the messages (tourism, culture, public services, etc.) and the aims or communication strategy pursued by the institution.
3.2. The Geography of Twitter Profiles
At the time of the survey (November 2013) there were 461 official profiles of Italian municipalities on Twitter (approximately 6% of Italian municipalities): it is still a “niche” phenomenon which shows the existence of pioneering institutions. The data presented here should be considered as a time-dependent picture of a fluid and changing phenomenon: in fact, an earlier survey carried out in June 2013 revealed 368 profiles of Italian municipalities, a figure which increased by approximately 25% in just a few months.
The distribution of the accounts is interesting: the whole country of Italy is covered, though with different intensities at regional scale. The pervasiveness of the phenomenon is confirmed since all 20 regions have on average more than 20 municipalities with a Twitter profile, even though there is a considerable variability ranging from 7 to over 50 profiles per region. The graph below shows the ranking of the Italian regions with the largest number of municipal accounts in relation to the total number of municipalities in the region itself. In particular, there are some regions mainly situated in the North and central Italy with a high presence of profiles, such as Tuscany and Emilia Romagna, which were also the early and successful developers of civic networks in the nineties of the last century (Capineri and Romei, 1998).
International Journal of Spatial Data Infrastructures Research, 2015, Vol.10, 1-26
8
Fig. 1 Twitter Profile Density at Regional Level in Italy (Total Twitter Municipal Profiles / Total Municipalities per Region) (November 2013)
Source: Ladest data, 2013.
3.3. The Diffusion over Time of the Profiles
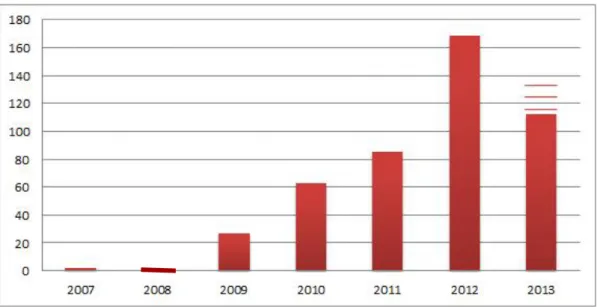
The history of Italian municipalities on Twitter is a recent one since it began less than ten years ago. Indeed, the first Twitter profiles appeared in 2007, just a year after the first tweet ("just setting my twittr") was sent by Jack Dorsey. The first account was that of the town of Rimini (@comunerimini) on the Adriatic coast; followed by Castellabate (Salerno) and Turin in 2008. The phenomenon has been growing since then: in 2009, 33 municipalities appeared on Twitter, mostly concentrated in the Northern and Central regions of the country (Perugia in Umbria, Bologna, Modena, Cesena, and Correggio in Emilia-Romagna, Naples in Campania, Genoa in Liguria, L’Aquila and Giulianova in Abruzzi). In 2010, the profiles grew from 33 to 51, again in the same areas of the peninsula with the
International Journal of Spatial Data Infrastructures Research, 2015, Vol.10, 1-26
9
exception of the first accounts in Calabria and Sardinia. In 2011, 127 new profiles joined the Twitter community in the regions of Tuscany, Veneto and Basilicata. The spread of Twitter profiles, like any other innovation, started slowly in some pioneering administrations, but the pace gathered speed in 2012 when a real explosion took place, with an increase of 120% in the number of profiles. In 2013 (up to the time of the survey) yet more profiles were created in provincial capitals such as Siena, Parma, Lecce.
Fig. 2 Diffusion over Time of Twitter Profile in Italian Comuni (2007 – November 2013)
Source: Ladest data, 2013.
3.4. The Urban Localization of Twitter Profiles
Undoubtedly Twitter, like many other social applications, is most at home in large urban areas, where the use of such applications is generally proportional to the population size and the availability of good Internet connections (Hecht and Stephens 2014; Neis et al. 2013). The geography of Italian municipal profiles seems to reflect the urban structure of the country, which is mostly made up of many small and medium-sized cities. At the time of the survey, 1% of the 461 profiles had been activated by large municipalities (> 500.000 inhabitants), 4% by medium-sized municipalities (between 100.000 and 500.000 inhabitants), 45% by small to medium sized comuni (between 10.000 and 100.000 inhabitants), while 50% are municipalities with less than 10.000 inhabitants. The interesting aspect of this phenomenon lies in the long tail of small and medium-sized municipalities that have activated their Twitter profiles, demonstrating that small population size is not a barrier to the spread of the social platform. In one way this trend shows
International Journal of Spatial Data Infrastructures Research, 2015, Vol.10, 1-26
10
that small communities where social ties among citizens and administrators are stronger due to friendship and family ties are more aware of the potentialities and eager to participate in community life.
The distribution pattern is represented in Figure 3, which shows three main distribution patterns of the profiles:
dense clouds in the large and medium-sized metropolitan areas such as Turin, Milan, Rome, Naples, Florence, Bologna, Venice, Cagliari and Catania;
Twitter ribbons along the coasts (in particular the Adriatic coast, the Tuscan Maremma, and western Sardinia) characterized by significant tourism;
minor constellations of small peripheral municipalities often without a well defined socio-economic profile which benefit from engaging political leaders, dynamic associations, local participation and adopt the paradox of globalization, "think globally, act locally" .
Fig. 3 The Geographical Distribution of Twitter Profiles of Italian Municipalities (November 2013)
International Journal of Spatial Data Infrastructures Research, 2015, Vol.10, 1-26
11
Other qualitative factors must be considered in order to understand the distribution of Twitter profiles: in some cases the existence of a digital culture (or network proximity) which developed at the end of the last century with the creation of civic networks; in others the need to promote the area and to keep pace with market demands (in this case tourist activities) which need to reach the audience in the shortest time possible in order to inform them about activities, events, weather or traffic conditions, and more. Finally, the nature of relationships in smaller communities is more cohesive, with lively local social relations and closer relationships with the institutions and their own territory. This is the case of profiles created by very small towns on the periphery of large metropolitan areas or in less accessible areas.
3.5. The Profiles’ Activity on Twitter
In order to highlight the level of activity of the profiles, the analysis takes into account some raw measures such as the number of tweets and followers. The assumption is that the numbers of tweets and followers give only a very general picture of the activity levels because they do not take into account other relevant dimensions such as the demographic size and the catchment area of the municipalities which are then considered in the Twiperindex explained in the following section. When the tweets and followers are taken into account, a ranking of the profiles is obtained. In particular the results show a clear long tail distribution: in fact, the top five municipalities in the ranking comprise 34% of the total tweets sent while the remaining 66% is produced by all the other profiles. The most active municipalities, occupying the top twenty position,s are not only large municipalities (Bologna, Rome, Venice, Florence, Turin, Genoa, Milan, Naples) but also small towns like Cesate (in the province of Milan), Potenza, Capoliveri (Livorno), Desio (Bergamo) and Monterotondo (Rome). In particular in the top five group there are three small comuni (Vinci, Cesate, Capraia e Limite) with less than 15,000 inhabitants: this demonstrates that the activity expressed by tweets is not dependent on the demographic of the comune, as the low correlation (r=0,31) confirms. The case of the profile of Vinci/Empoli - Val d'Elsa (@EmpoliValdelsa) is an interesting one because it brings together 11 small municipalities in a common profile, thus creating a sort of "Twitter district" that benefits from the sharing and management of the profile.
The next measure is the number of followers, which represents the penetration of the social platform. The results show that the largest ‘tweeple’ communities (> 10,000 followers) are those of the six regional capitals: Turin, Naples, Rome, Milan, Florence, Bologna: this is due to the fact that the number of followers may be related to the large population size. This group is followed by a group of 44 municipalities (9% of the total profiles) with a number of followers between 1,000 and 10,000. Once again a long tail distribution is revealed, although less skewed that the one for the number of tweets: 43% of the followers belong to the six top
International Journal of Spatial Data Infrastructures Research, 2015, Vol.10, 1-26
12
profiles; 27% of the followers correspond to the second group of profiles; and the remaining 30% to all the other profiles (with < 1,000 followers). Another interesting aspect is that some profiles (23) behave like ‘ghosts’ since they have never sent a tweet, which shows that having a profile is not a sufficient condition for being active on the social platform.
Table 1. Average and Maximum Values of Tweets and Followers per Municipality
Tweets Followers
Average 765 761
Max 35429 69838
The comparison between the two distributions, followers and tweets, highlights the asymmetry of the two dimensions: high numbers of followers do not always correspond to high numbers of tweets and vice versa. This is the case, for example, of municipalities in the metropolitan area of Naples and in the region of Veneto. This asymmetry is typical of Twitter as the profiles choose their own communication strategies which may affect the number of tweets and followers.
Fig. 4 A Comparison between the Distribution of Tweets and Followers (November 2013)
International Journal of Spatial Data Infrastructures Research, 2015, Vol.10, 1-26
13
4. THE PROFILE PERFORMANCE ASSESSMENT
We are now accustomed to seeing Twitter as a fierce competition: who is the most followed, who is more important and influential in the social media society, who should be regarded as a late-comer and who is a guru to be followed at any cost. These dynamics are simply the reproduction of the competitive social patterns that we experience in our daily lives and perhaps unconsciously transpose into the universe of the Internet.
If a private individual can legitimately strive to reach the highest number of followers, a municipality will aim primarily to reach its own population, or more broadly those who benefit from the municipality’s services. At the same time the purpose of the social activity is mainly oriented to offering more services to the population of the municipality rather than gaining popularity. Public institutions have different functional roles, they are extremely heterogeneous and they behave like nodes which relate to a catchment area that can reach either a few
hundred or millions of people.
In this context a new measure that will take into account the functional role is needed both to assess the performance of Italian municipalities on Twitter and to obtain a more precise ranking of the profiles.
The Twiperindex (Twitter Performance Index) considers six variables in order to create a new measure of the performance of the 461 Italian municipalities on Twitter during the period covered by the analysis. The novelty of the index is to weigh the activity on Twitter (tweets, followers and following) in relation to the
functional role of each municipality profile.
The measure created allows us to obtain a more accurate picture of the dynamic nature of these profiles and their ability to reach their catchment area. This index, which can certainly be improved, is by its nature limited to the qualitative dimension of the municipalities’ activity on Twitter. Moreover, it must be noted that the phenomenon under analysis is still unfolding; thus this analysis provides a methodology and measures which may change in time.
The Twiperindex ranges from 0 to 1, where the minimum value corresponds to an absence of "activity" on Twitter, and 1 the maximum value, which is the expression of the best performance.
The variables taken into account by the Twiperindex are:
Followers: number of followers of the institutional profile from the profile starting date to November 2013;
Tweets: number of tweets the institutional profile has put out from the profile starting date to November 2013;
International Journal of Spatial Data Infrastructures Research, 2015, Vol.10, 1-26
14
Resident population at the 2011 Census;
Days of activity of the profile from its activation date;
Gravitation index: this is a measure to identify the municipality’s influence considered on the basis of its functional role within the area in which the municipality operates. This variable enables us to weigh tweets, followers and followings according to the hierarchical role of the comune. The identification of gravitational areas has been developed with reference to the Large Urban Zone (LUZ) defined at European Community level. In this way 32 main central nodes have been highlighted. From those main central nodes, a new value has been calculated that takes into account both the distance to every other municipality active on Twitter and the population density. In other words, the higher the distance between the central location and the observed municipality, the lower the risk for the latter to be attracted by the gravitational force exerted by the first; moreover the higher the weight of the population in terms of density per square kilometre, the higher the possibility of a profile acting as central location.
In practice, when a municipality is placed at a greater distance from a central location it will more likely develop its own independent communication strategy; in addition, a high population density corresponds in this analysis to high communication potential in terms of new social media employment. Previous analysis has shown that participation in social media networks depends on the size of the critical mass, and/or on population concentration as well as on the position of the profile in a space which is a complex system of networks (Calvino et al., 2013).
The gravitation index is calculated following the formula:
(1) GI = Population Density per square kilometre * Distance Value
where the Distance Value is given by the attribution of a value, from 0.1 to 1, associated to the position, in terms or percentiles, of each profile in a rank created by computing the linear distance between each single comune, and the centroid of the closest Central Node, as highlighted by the Large Urban Zone (LUZ) classification.
The Twiperindex has been calculated by aggregating the six variables in four principal metrics. For each metric a value has been assigned to each municipality: the assigned value is derived from the position of each profile’s performance in one of the 10 percentiles which have been calculated on the basis of the distribution of the metrics’ values in the analysed sample. Those who belong to the first percentile (1%) have a value of the single metric equal to 0.1; those who belong to the tenth percentile (100%) have been assigned a maximum value, equal to 1, for the single metric.
International Journal of Spatial Data Infrastructures Research, 2015, Vol.10, 1-26
15
This first metric (2) is a measure of the potential diffusion of each tweet within the boundaries of the theoretical space considered and is calculated following the formula:
(2) Metric 1 = (Number of Followers * Number of Tweets) / Population
In practice, the best performance is that in which the product of Followers and Tweets is greater than the municipality’s population. The product of Follower and Tweet is a measure of the potential dissemination of the information generated through the single tweet. This measure would be sufficient if individuals were the core of the analysis: in fact their objective could rationally be to achieve the highest number of people, so the higher the value, the better the performance. Of course a municipality could aim at the same objective, but generally institutions aim to reach a portion of the world social audience that is simply those people that could be directly or indirectly interested in the institution’s activity on Twitter. The metric has the aim of weighing the original diffusion potential relative to the population, in order to be able to compare different profiles which would be otherwise difficult to analyse.
If this first metric fails to scale down the weight of the large cities (Bologna and Venice are, for example, the first and second in this metric), it highlights small urban areas, in terms of population, which are able to mobilize considerable flows of information on Twitter (for example Cesate, Levate and Castelnuovo di Garfagnana). Moreover this metric reveals those municipalities which are active on Twitter but fail to achieve a widespread diffusion in social media, such as some municipalities with more than 100,000 inhabitants like Catania or Ravenna. The second metric (3) of the Twiperindex takes into account the number of tweets sent from the institutional profile since its activation date. In this way the
latecomers’ profiles are not penalized.
The greater the number of tweets sent during the period of activity of the profile, the greater, in theory, the activity level and the better the performance recorded on the basis of this metric.
The second metric is computed following the formula: (3) Number of Tweets / Number of Activity Days
where the Number of Activity Days is calculated considering the registration date of the account.
The geographical and functional distribution of the values measured by this metric cannot be explained by the functional rank nor by population size: next to Rome and Bologna which are again among the first, there are small and very
International Journal of Spatial Data Infrastructures Research, 2015, Vol.10, 1-26
16
small municipalities like Capraia e Limite on the island of Elba, or Cesate in the province of Milan whose performances are very high.
The third metric (4) is the measure of the profile’s position in its territorial context in relation to its demographic potential.
This simple metric is based on the belief that the main objective of an institution is to offer services to its population. Available data take into account only resident population instead of the city users (Martinotti 1983) which would be more relevant especially when large urban centres or tourist resorts are considered.
(4) Number of Followers / Population
In addition to population, the other variable considered is represented by the followers. This metric allows us to "reward" those municipalities, very often small ones, that have been able to involve large parts of the population, while penalizing those great centres which, despite relying on a high number of followers in absolute terms, have not succeeded in involving significant portions of their resident populations. From the results obtained it can be observed that a large number of profiles are not able to reach significant values of this metric. Most of the institutional profiles are not well-positioned with respect to their diffusion potential, or have not reached the critical mass of followers needed to make the profile’s communication strategy sufficiently viral.
Finally, there is the measure of the functional role of the municipalities on Twitter. The focus of this metric is the gravitation index described above, which is used here as a weight by which the tweets, followers and following are measured in relation to extremely heterogeneous territorial and functional contexts and in three different sub-metrics that make up metric number four of the Twiperindex. The fourth metric ensues from:
(5) Metric 4a = (Number of Tweets * GI)/ Population (6) Metric 4b = (Number of Followers * GI) / Population (7) Metric 4c = (Number of Following * GI) / Population And as a consequence:
(8) Metric 4 = (Metric 4a + Metric 4b + Metric 4c) / 3
In other words the Metric 4 is the mean of the values obtained by computing the three sub-metrics described above. By creating three single sub-metrics we are able to investigate and describe dimensions that a single aggregated metric is not able to identify.
International Journal of Spatial Data Infrastructures Research, 2015, Vol.10, 1-26
17
The fourth metric shows how small or quite small municipalities are able to perform better. Among the first five profiles, only Udine maybe considered as a medium-sized municipality with its roughly 100.000 inhabitants; while Cesate, Lignano Sabbiadoro, Capraia e Limite, as well as Vinci, next in the rank, are all very small municipalities with less than 10.000 inhabitants.
Finally the Twiperindex is derived from the very straightforward formula: Twiperindex = Total Metrics / Max (Total Metrics)
where the Total Metrics value is given by the sum of the 4 single Metrics computed above, and the denominator of the formula by its hypothetical maximum value.
The results of the Twiperindex (Figure 6) highlight that the best performing municipalities are mainly in Tuscany and Emilia Romagna, two regions which have been pioneers in the digital revolution. In the top 15 positions there are small and medium sized towns (see table 2): this confirms that a well-performing profile does not depend on large and well established administrations but rather on the local community which has perceived Twitter as a valuable means to inform people and improve community building and public communication. This is the case of tourist resorts such as Capoliveri, Monterotondo, Rio nell’Elba or the municipalities situated in the metropolitan areas of Milan such as Cesate and Desio and finally the municipalities of central Sardinia. Among big towns Turin, Bologna, Florence and Venice outperform larger urban areas such as Rome and Milan.
Table 2. Twiperindex: 15 Top and Bottom Municipalities.
Municipality Population Metric1 Metric2 Metric3 Metric4 TPI
Capraia e Limite 7162 1 1 0.9 1 0.975 Vinci 14523 1 1 0.7 0.9 0.9 Bologna 377220 1 1 0.6 1 0.9 Turin 909538 0.9 0.9 0.7 1 0.875 Capoliveri 3840 1 0.9 0.9 0.7 0.875 Cesate 13652 0.9 1 0.6 1 0.875 Lignano Sabbiadoro 6796 1 0.9 0.8 0.8 0.875 Florence 368901 0.9 0.9 0.6 1 0.85 Modena 183114 0.9 0.9 0.6 0.9 0.825 Venice 270801 0.9 0.9 0.6 0.9 0.825
International Journal of Spatial Data Infrastructures Research, 2015, Vol.10, 1-26 18 Montesegale 325 0.9 0.7 0.9 0.7 0.8 Desio 40312 0.9 0.9 0.6 0.8 0.8 Milan 2743796 0.8 0.9 0.5 1 0.8 Rome 1307495 0.8 1 0.5 0.9 0.8 Bibbiano 9888 0.2 0.3 0.4 0.4 0.325 Brindisi 89735 0.3 0.4 0.2 0.4 0.325 Neviano 5568 0.1 0.1 0.6 0.5 0.325 Lecce 94949 0.3 0.4 0.2 0.4 0.325 Riolo Terme 5782 0.2 0.3 0.4 0.3 0.3 Gabiano 1244 0.1 0.1 0.6 0.4 0.3 Mandela 938 0.1 0.1 0.5 0.4 0.275 Augusta 34393 0.3 0.5 0 0.3 0.275 Rosarno 14745 0.2 0.3 0.2 0.4 0.275 Gualdo Tadino 15846 0.2 0.3 0.3 0.3 0.275 San Chirico Nuovo 1524 0.1 0.1 0.3 0.4 0.225 Tizzano Val Parma 2151 0.1 0.1 0.4 0.2 0.2 Osio Sopra 5060 0.1 0.1 0.2 0.4 0.2 Cinisello Balsamo 73659 0.1 0.1 0 0.6 0.2 Tortorici 6872 0.2 0.2 0.2 0.2 0.2
The following map (Figure 5) represents a classification of the profiles according to the results of the Twiperindex.
International Journal of Spatial Data Infrastructures Research, 2015, Vol.10, 1-26
19
Fig.5 The Geography of Profiles’ Performance
1) Cluster of profiles concentrated in metropolitan areas (mainly in northern and central Italy) characterized by dynamic and active municipalities which achieve the best performances. In these contexts, profiles benefit from commuting, trade and cultural exchanges and relationships, (shown in red);
2) Cluster of profiles situated in coastal areas and islands which are characterized by dynamic municipalities engaged in tourist and cultural promotion of the territory, (red);
3) Cluster of profiles in smaller urban areas that include both profiles with good performances and profiles that, despite having the demographic potential, are less active in terms of the number of tweets and followers. In this case the social media tool has been activated but the potentialities are not fully exploited
International Journal of Spatial Data Infrastructures Research, 2015, Vol.10, 1-26
20
4) Scattered constellations of profiles which consist of core municipalities (usually provincial capitals) acting as local magnets and satellite profiles but still characterized by low performance (orange-yellow).
5. INSTITUTIONAL COMMUNICATION: HASHTAG ANALYSIS
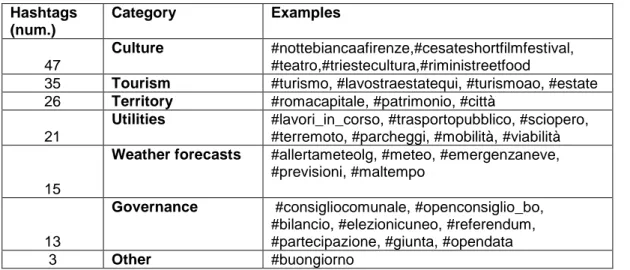
Social platforms are considered to be an important tool for improving policy making and service delivery by enriching government interactions with external stakeholders and enhancing internal knowledge management (European Commission, 2009). In order to evaluate in quite a simple way how the institutions make use of their profile, the analysis has taken into consideration the most frequently used hashtags by the first 15 municipalities in the Twiperindex ranking collected on www.twitonomy.com. Hashtags are central to organizing information on Twitter around specific topics or events. Designated by a ‘hash' symbol (#), a hashtag is the keyword assigned by the user to information that describes a tweet and aids in searching but also in analysing the topic of the message.
A classification of the 160 most used hashtags has been carried out by classifying them in several categories including information relating to: the geographical context (news and historical geography, folklore, accessibility, etc.), culture (events, museums, etc.), public services (transport, health, etc.), tourism, governance (municipal budgets, operations planning, open data, etc.) and weather forecasts.
Below are some examples of hashtags used in the various categories:
Table 3. A Classification of Most Used Hashtags Hashtags (num.) Category Examples 47 Culture #nottebiancaafirenze,#cesateshortfilmfestival, #teatro,#triestecultura,#riministreetfood
35 Tourism #turismo, #lavostraestatequi, #turismoao, #estate
26 Territory #romacapitale, #patrimonio, #città
21
Utilities #lavori_in_corso, #trasportopubblico, #sciopero,
#terremoto, #parcheggi, #mobilità, #viabilità
15
Weather forecasts #allertameteolg, #meteo, #emergenzaneve, #previsioni, #maltempo
13
Governance #consigliocomunale, #openconsiglio_bo,
#bilancio, #elezionicuneo, #referendum, #partecipazione, #giunta, #opendata
International Journal of Spatial Data Infrastructures Research, 2015, Vol.10, 1-26
21
From the analysis it can be noted that the most widely used information categories are those of culture and tourism, followed by territory, utilities and forecasts. The category of governance is still quite limited except for a few cases (such as Florence and Bologna), indicating that Twitter’s potential as a collector and distributor of information on complex issues around which to initiate debates and discussions is not yet very well developed. In most cases the profile is used to spread information which is already published on institutional websites.
Nevertheless, there are cases where the profile has been used for specific events, such as public safety and emergency management during and after natural disasters (for example the 2013 earthquake in Castelnuovo Garfagnana, or the floods in Genoa) or road accidents. Moreover a few municipalities have started using specific hashtags to publicize council meetings and even to give information about open data (for example Florence, Perugia, Bari).
When we look at some of the most popular hashtags, some communication strategies emerge: most of the # are used to "locate" their message (e.g. #firenze) or to relate to a particular event (#nottebianca) while in other cases they are limited to a general tagging of the message subject, which makes the topic of the message too general and ineffective (e.g. #comune, #lavoro).
6. CONCLUSIONS
It is rather difficult to draw any final conclusions on something as recent and as fluid as the phenomenon examined in this analysis. However, some relevant features have emerged which can be summarized as follows. The transition to a new vision of public communication and of the management of public services is undoubtedly taking place in Italy, although it is still embryonic from the point of view both of the social platform's exploitation and the skills of users (both individuals and institutions). It is an innovative phenomenon that is destined to grow and spread if the services offered by social platforms, like Twitter, increase in order to develop both the awareness of the advantages and the trust in them. The many forms of city-networking, to which Twitter also belongs, have in common the desire to create new community information systems which are suitable for large and small urban contexts.
Like any other innovation, the diffusion and adoption of Twitter profiles are not homogeneous either in time or in space, but as we have seen it is extremely pervasive: tracing the geography of Italian municipalities on Twitter is like travelling across the country’s varied landscapes, from the metropolitan areas of the North to the smaller lively towns with cohesive communities of central regions, to the depletion of the southern regions and the creativity of the coastal towns and tourist resorts.
The case-study shows some relevant issues which can be summarized as follows. Despite the clear digital divide between the Northern-Central and Southern regions, the analysis highlights: the path-dependent pioneer profiles,
International Journal of Spatial Data Infrastructures Research, 2015, Vol.10, 1-26
22
such as Turin, Bologna, Firenze which perform well thanks to their ability to develop an entire digital atmosphere, from infrastructure supply to social media culture; the emergence of many small municipalities which manage the social platform relatively well thanks to the proximity between institutions and users; these settingss also employ the platform as a means for both territorial marketing (as the most popular hashtags reveal) and the mitigation of marginality.
The results of the Twiperindex also suggest some lessons about the employment of the social platform: municipalities which have reached a small critical mass despite their large potential catchment area are missing the engagement opportunities offered by social media; profiles that are not yet able to show the value of the means to their citizens (i.e. not very appealing or useful tweets); municipalities which have built a large tweeting activity thanks to their small external economies based on social proximity or on a stronger sense of place compared to the highly fragmented metropolitan areas.
Finally the Twiperindex has revealed that it is necessary to approach the assessment not only in terms of number of tweets and followers but also with reference to the functional properties of the profiles (activity days, catchment potential) to avoid the trap of the too superficial rankings which do not permit any comparison among contexts of different size. In this context it can be noted that the majority of better performing profiles are small and medium sized municipalities which seem to reach their potential audience best; thus if Twitter is considered to be an innovation in the world of communications, this tool is dimension-free and does not follow the hierarchical localization process as was the case for advanced tertiary or quaternary services in the past.
Government 2.0 is a new approach and still in its infancy: changes in leadership, policy making, service delivery and governance are needed in order to make government information more accessible and usable, and also to build a culture of online innovation within the public sector; furthermore a great deal needs to be done in terms of making users aware of the benefits they can obtain. It seems clear that the benefits of these tools, despite all the critical questions related to complex issues such as privacy and surveillance, which have not been dealt with here, are not achieved spontaneously or accidentally, but only through a concerted and organized effort that should primarily be developed by public administrations.
7. REFERENCES
Asur, S. and B. A. Huberman, (2010). “Predicting the future with social media”, in Web Intelligence and Intelligent Agent Technology (WI-IAT), 2010 IEEE/WIC/ACM International Conference, 1: 492-499. IEEE.
International Journal of Spatial Data Infrastructures Research, 2015, Vol.10, 1-26
23
Bakshy, E., Hofman, J. M., Mason, W. A. and D.J. Watts (2011). “Everyone's an influencer: quantifying influence on twitter”, Proceedings 4th ACM
international conference on Web search and data mining, pp. 65-74:
ACM.
Bertot, J.C., Jaeger, P.T. and D. Hansen (2012). The impact of polices on government social media usage: Issues, challenges, and recommendations, Government Information Quarterly, 29: 30-40.
Biever, C. (2010). Twitter mood maps reveal emotional states of America, The
New Scientist, 207: 14.
Bollen, J., Mao, H. and X. Zeng (2011). Twitter mood predicts the stock market,
Journal of Computational Science, 2(1): 1-8.
Bonsón, E., Torres, L., Royo, S. and F. Flores (2012). Local e-government 2.0: Social media and corporate transparency in municipalities, Government
Information Quarterly 29. 2: 123-132.
Buchanan, M. (2002). Nexus: Small Worlds and the Groundbreaking Science of
Networks, Perseus Publishing, Cambridge, MA.
Calvino, C., Romano, A., and M. Teobaldi (2013). Tweeting politicians: il peso della prossimità nella formazione e diffusione dell’opinione politica, Memorie Geografiche, 11:362-372.
Capineri, C. and P. Romei (1999) “Telecommunication and territorial innovation: the experience of the the High Technology Network in Tuscany”, in Reggiani A. and Fabbri D., (Ed), Networks developments in economic
spatial systems: new perspectives: Ashgate Aldershot, pp.193-214.
Correa, D., Sureka, A. and R. Sethi (2012). “WhACKY!-What anyone could know about you from Twitter”, in Privacy, Security and Trust (PST), 10th Annual
International Conference on IEEE, pp. 43-50.
Craglia, M. (2007). “Volunteered Geographic Information and Spatial Data Infrastructures: when do parallel lines converge”, Position paper for the
Specialist Meeting on Volunteered Geographic Information, December 13-14, 2007, Santa Barbara, CA.
De Longueville, B., Smith, R.S., and G. Luraschi (2009). "OMG, from here, I can see the flames!: a use case of mining location based social networks to
International Journal of Spatial Data Infrastructures Research, 2015, Vol.10, 1-26
24
acquire spatio-temporal data on forest fires”, Proceedings of the 2009
International Workshop on Location Based Social Networks (LBSN
'09)New York,pp. 73-80: ACM.
Di Costanzo, F. (2012). Cittadini di twitter. La nuova comunicazione nei servizi
pubblici locali, Ed.Indiscreto, Firenze.
Elwood S., Goodchild M. F. and D. Z. Sui (2012). Researching volunteered geographic information: Spatial data, geographic research, and new social practice. Annals of the Association of American Geographers, 102(3): 571-590.
European Commission (2009). Commission Working Document. Consultation on the Future “EU2020” Strategy. COM(2009)647 final, 24/11/2009 at http://ec.europa.eu/dgs/secretariat_general/eu2020/docs/com_2009_647_ en.pdf [accessed June 2015].
Formez, PA. (2012). Vademecum: Pubblica Amministrazione e social media. Linee guida per i siti web della PA. Rome at http://www.funzionepubblica.gov.it/media/982042/vademecum_pubblica_ amministrazione_e_social_media.pdf [accessed October 2014].
Graham, M. and M. Zook (2011). Visualizing global cyberscapes: Mapping user-generated placemarks. Journal of Urban Technology, 18(1): 115-132. Hecht, B. J. and D. Gergle (2010). “On the localness of user-generated content”,
Proceedings of the 2010 ACM conference on Computer supported cooperative work, pp.229-232. ACM.
Hecht, B. and M. Stephens (2014).” A tale of cities: Urban biases in volunteered geographic information”, Proceedings of the International Workshop on
Web and Social Media:ICWSM.
Humphreys, L., Phillipa, G. and K. Balachander (2010). “How much is too much? Privacy issues on Twitter”,Proceedings Conference of International
Communication Association, Singapore.
Java, A., Song, X., Finin, T. and B. Tseng (2007). ”Why we twitter: understanding microblogging usage and communities”, Proceedings of the 9th WebKDD
and 1st SNA-KDD 2007 workshop on Web mining and social network analysis. New York, pp. 56–65: ACM.
International Journal of Spatial Data Infrastructures Research, 2015, Vol.10, 1-26
25
Kamal, M. M. (2009). An analysis of eParticipation research: moving from theoretical to pragmatical viewpoint. Transforming Government: People,
Process and Policy, 3(4): 340-354.
Krishnamurthy, B., Gill, P. and M. Arlitt (2008). “A few chirps about twitter”,
WOSP ’08: Proceedings 1st workshop on Online social networks. New
York, pp. 19–24: ACM.
Istat (2011). 15° Censimento della popolazione e delle abitazioni, Roma.
Levy, P. (1994). L’Intelligence collective. Pour une anthropologie du
cyberespace, La Découverte, Paris.
Martinotti, G. (1993). Metropoli. La nuova morfologia sociale della città. Il Mulino, Bologna.
Mislov, A., Lehmann, S., Ahn Y.Y., Onnela, J.P. and J.N. Rosenquist (2011). “Understanding the Demographics of Twitter Users”, in ICWSM
Proceedings.
Mumford, L. (1937). What is a city, Architectural record, 82:59-62.
Neis, P., Zielstra, D. and A. Zipf (2013), Comparison of Volunteered Geographic Information Data Contributions and Community Development for Selected World Regions, Future Internet, 5, 282-300.
O'Connor, B., Balasubramanyan, R., Routledge, B. R. and N. A. Smith (2010). “From Tweets to Polls: Linking Text Sentiment to Public Opinion Time Series”, Proceedings ICWSM, 11, pp. 122-129.
Panagiotopoulos, P., Sams, S., Elliman, T. and G. Fitzgerald (2011). Do social networking groups support online petitions? Transforming Government:
People, Process and Policy, 5: 20-31.
Pennisi, M. (2012). “La pubblica amministrazione su Twitter: c’è ancora molto da fare”, Wired at http://daily.wired.it/news/internet/2012/11/28/enti-locali-twitter-emergenze-351678.html, [accessed October 2014].
Polgreen, P.M., Chen, Y., Pennock, D.M. and F.D. Nelson (2008). Using internet searches for influenza surveillance”, Clin Infect Dis, 47(11):1443–8.
International Journal of Spatial Data Infrastructures Research, 2015, Vol.10, 1-26
26
Sandoval-Almazan, R. and J.R. Gil-Garcia (2012). Are government internet portals evolving towards more interaction, participation, and collaboration? Revisiting the rhetoric of e-government among municipalities. Government Information Quarterly, 29: 72-81.
Sakaki, T., Okazaki M. and Y. Matsuo (2010) “Earthquake shakes Twitter users: Real- time event detection by social sensors”, at http://ymatsuo.com/papers/ www2010.pdf , [accessed September 2014]. Small, H., Kasianovitz, K., Blanford, R. and I. Celaya (2012), What your tweets
tell us about you: identity, ownership and privacy of Twitter data,
International Journal of Digital Curation, 7(1), pp.174-197.
Snead, J.T. (2013). Social media use in the U.S. Executive branch. Government
Information Quarterly, 30: 56-63.
Takhteyev, Y., Gruzd A. and B. Wellman (2012). Geography of Twitter networks."
Social networks 34.1: 73-81.
Toffler, A. (1980). The third wave: The classic study of tomorrow, Bantam, New York.
Tumasjan, A., Sprenger, T. O., Sandner, P. G. and I.M. Welpe (2010).” Predicting Elections with Twitter: What 140 Characters Reveal about Political Sentiment”. ICWSM, 10, 178-185.
Zook, M., Graham, M., Shelton, T. and S. Gorman (2010). Volunteered geographic information and crowdsourcing disaster relief: a case study of the Haitian earthquake. World Medical & Health Policy, 2(2): 7-33.