THE JOURNAL OF BIOLOGICAL CHEMISTRY
Q 1986 by The American Society for Biochemistry and Molecular Biology, Inc. Vol. 263, No. 7, Issue of March 5, pp. Printed 3466-3473, 1988 in U.S.A.
MgATP-dependent Glucose 6-Phosphate-stimulated
Ca2'
Accumulation
in Liver Microsomal Fractions
EFFECTS OF INOSITOL 1,4,5-TRISPHOSPHATE
AND GTP*
(Received for publication, July 27, 1987)
Angelo BenedettiS, Rosella Fulceri, Andrea Romani, and Mario Comporti
From the Zstituto di Patologia Generale, Uniuersita di Sienu, 53100 Sienu, Italy
Ca2+ release triggered
by inositol 1,4,5-trisphos-
phate
(IPS)
and/or GTP has been studied with rough
and smooth microsomes isolated from
rat
liver. Micro-
somes were loaded with Caa+ in the
presence of MgATP
and in the presence or in the absence
of
glucose 6-
phosphate (glucose-6-P) which markedly stimulated
the MgATP-dependent Ca2+ accumulation in rough and
smooth microsomes (5- and 10-fold,
respectively).
Upon addition of
IPS (5
PM),rough and smooth micro-
somes rapidly release
a
part (not exceeding
20%)of
the
Ca2+
previously accumulated both in the absence
and in the presence
of
glucose-6-P. Under the same
experimental conditions, inositol 1,3,4,5-tetrakisphos-
phate was ineffective in triggering any Ca2+ release.
Upon addition of GTP (10
PM)both the microsomal
fractions progressively release the
Ca2+
previously ac-
cumulated in the presence of glucose-6-P, when
3%
polyethylene glycol was also present. In the absence of
polyethylene glycol, GTP released Ca2+ from rough
microsomes only, and GTP plus
IPS
caused
a
Ca2+ re-
lease which was the sum of the Ca2+ releases caused by
GTP and
IPS
independently. Both
IPS
and GTP, added
to microsomes
at
the beginning of the glucose-6-P-
stimulated
Ca2+
uptake, reduced the
Caz+
accumulation
into rough and smooth microsomes without modifying
the initial rate
(3
min) of Ca2+ uptake. Also in these
conditions, the effects of GTP and
IPS
were merely
additive. These results indicate that both rough and
smooth liver microsomes are responsive to
IPS
and GTP
with respect to Caz+ release and that
IPS
and GTP
likely act independently.
It
is widely accepted that a variety of cellular processes is
regulated by rapid changes in the cytosolic free Ca2+ concen-
tration, and this in turn has prompted intensified interest in
the mechanisms that control the cytosolic free Ca2+ levels.
With regard to the liver cell, many authors have suggested
that the endoplasmic reticulum plays a relevant role in the
regulation of cytosolic free Ca2+ concentration in resting
conditions (1-3) as well as under physiological stimuli (4-9).
This organelle, in fact, possesses a Ca2+ transport activity
from cytosol to lumen (10-16) and very likely releases Ca2+
*
This work was supported by Grant 86.00370.44 from Consiglio Nazionale delle Richerche (Italy), Special Project "Oncology." Addi- tional funds were derived from Consiglio Nazionale delle Ricerche, Group of Gastroenterology, and from the Association for Interna- tional Cancer Research (Great Britain). The costs of publication of this article were defrayed in part by the payment of page charges. This article must therefore be hereby marked ''advertisement" in accordance with 18U.S.C.
Section 1734 solely to indicate this fact.$ To whom correspondence should be addressed Istituto di Pato-
logia Generale, Via del Laterino 8, 53100 Siena, Italy.
into the
cytosol under stimulating conditions
((7,17) see Refs.
18 and 19 for reviews).
Previous studies from our laboratory demonstrated that
glucose-6-P' markedly stimulates the MgATP-dependent
Ca2+ uptake by both isolated liver microsomes (16) and en-
doplasmic reticulum of permeabilized hepatocytes (20). Thus,
it was suggested that, in the liver cell, the important metab-
olite glucose-6-P would regulate the cytosolic Ca2+ level by
supporting active Ca2+ translocation from cytosol to endo-
plasmic reticulum interstices (21). Recently it has
been shown
that glucose-6-P also stimulates the Ca2+ uptake by endo-
plasmic reticulum of permeabilized pancreatic islets (22),
which suggests a regulatory role for glucose-6-P in the calcium
homeostasis of islet cells (22).
IP3
has been proposed as a second messenger for various
extracellular stimuli because of its ability to mobilize Ca2+
from intracellular stores (likely endoplasmic reticulum) into
the soluble cytoplasm in many cell types, including the he-
patocyte ((23) see Ref. 24 for
a
review). In fact, it has been
demonstrated that IP, mobilizes Ca2+ from a nonmitochon-
drial pool in permeabilized hepatocytes (8, 18,20, 25), and an
IP3-induced Ca2+ release has also been observed
in some
isolated microsomal preparations from rat liver (26,27). How-
ever, attempts to
prepare purified vesicles by subcellular
fractionation of rat liver capable of releasing Ca2+ on addition
of
IP,
have been only partially successful.
The original studies by Dawson and Irvine (26) indicated
that IP, is effective on endoplasmic reticulum vesicles which
contaminate crude mitochondrial fractions. In purified micro-
somal preparations a
small effect of IP, was reported by
Dawson and Irvine (26), although no effect was observed by
Joseph
et al. (17). On the other hand, a rapid and transient
Ca2+-mobilizing effect of IP3 in a microsomal preparation
derived from rough endoplasmic reticulum has been shown
by Muallem
et al. (27). It was subsequently reported (28) that
microsomal preparations which were almost insensitive to
IPS, with respect to Ca2+ release, became responsive in the
presence of GTP. However, Heme and Soling (29) have
recently shown that GTP promotes Ca2+ release from hepatic
(as well as from parotid gland) microsomes in an IPa-inde-
pendent manner. In addition, Chueh and Gill (30) recently
reported an Ips-independent GTP-induced Ca2+ release from
endoplasmic reticulum in nonhepatic cells.
In view of the present interest in the role of IP3 in Ca2+
mobilization from endoplasmic reticulum, we further investi-
gated the effect of IP, and/or GTP on microsomal vesicles
isolated from rat liver.
'
The abbreviations used are: glucose-6-P, glucose 6-phosphate; IP,, inositol 1,4,5-trisphosphate; MOPS, 3-(N-morpholino)pro- panesulfonic acid; PEG, polyethylene glycol; IP,, inositol 1,3,4,5- tetrakisphosphate.3466
IPS, GTP,
and Glucose-6-P-stimulated Microsomal
Ca2’ Uptake
3467
We used microsomal fractions corresponding to rough as
well as to smooth liver endoplasmic reticulum, both of which
actively accumulate Ca2+ under glucose-6-P stimulation. This
experimental condition
(i.e. MgATP-dependent Ca2+ accu-
mulation in the presence of glucose-6-P) might better reflect
the situation in the intact liver, in which glucose-6-P may act
in affecting the reticular Ca2+ levels.
It
is known, that glucose-
6-P is actually available in the liver cell both in resting (31,
32)
and under stimulated conditions (31, 33, 34).
The results presented here show that Ca2+ accumulated
into microsomal vesicles under glucose-6-P stimulation can
be released by both IP3 and
GTP independently. This suggests
that the glucose-6-P stimulation might play a physiological
role by allowing for accumulation of high concentrations of
Ca2+ in the endoplasmic reticulum, which can subsequently
be released by Ca2+-releasing mediators such as
IP3
and GTP.
EXPERIMENTAL PROCEDURES
Preparation of Liver Microsomnl Fractions-Microsomal fractions were isolated from the livers of male 12-h fasted Sprague-Dawley rats weighing 180-220 g. Two microsomal fractions, one mainly corre- sponding to rough endoplasmic reticulum (“rough microsomes”) and the other to smooth endoplasmic reticulum (“smooth microsomes”), were prepared essentially as described by Dallner (35, 36).
Briefly, the livers were perfused in situ with 0.25 M sucrose and quickly removed. Fifty percent (w/v) liver homogenates were prepared by four passes in a glass homogenizer (Thomas, size C) tightly fitted with a motor-driven (600 rpm) Teflon pestle. In all experiments samples from the livers of three animals were used to prepare each homogenate. The homogenates were diluted 1:l (v/v) with 0.25 M sucrose and then centrifuged at 10,000 X g for 20 min. Five ml of the 10,000 X g supernatant were layered over 0.6 M sucrose (0.7 ml) and 1.3 .M sucrose (3 ml), both containing 15 mM CsC1, in 10-ml polycar- bonate (Nalgene) tubes, which were then centrifuged in a type 40 Beckman-Spinco rotor at 80,000 X g for 120 min. Smooth microsomes (at the 0.6/1.3 M sucrose interface) and rough microsomes (pellet) were separately recovered, diluted, or resuspended (10 ml, final vol- ume) with 100 mM KC1, 20 mM NaCl, 5 mM MgC12, 1 mM KHZPO,, and 10 mM MOPS, pH 7.2, and centrifuged at 80,000 X g for 45 min. The resulting pellets were resuspended in the KCl-MOPS buffer as above to have about 5 mg of microsomal protein/ml. The microsomal suspensions were maintained at 0-4 “C and used within 18 h.
Morphologic and Biochemical Characteristics of the Microsomnl Fractions-For electron microscopy examination, the suspensions of rough and smooth microsomes were fixed and stained as reported by other authors (6). Examination by electron microscopy showed that the rough microsomal fraction consists almost entirely of vesicles of various sizes surrounded by ribosomal particles (Fig. LA). The smooth microsomal fraction (Fig. 1B) consists of smaller vesicles than the rough ones; the vesicles are rather uniform in size; a few ribosomes are present. Intact or large fragments of mitochondria are absent in both instances.
The amounts of protein, RNA, and phospholipids (determined as reported in Refs. 37, 38, and 39, respectively) present in the two fractions were measured. The enrichment in RNA of rough with respect to smooth microsomes (3.6-fold) as well as the enrichment in phospholipids of smooth with respect to rough microsomes (1.4-fold) as very similar to those reported in the original method for the preparation of the microsomal fractions (35). In order to assess the relative purity of the two microsomal fractions, the activities of glucose-6-phosphatase (40), cytochrome c oxidase (6), and 5”nucle- otidase (6) as markers for endoplasmic reticulum, mitochondria, and plasma membrane, respectively, were determined. The results are shown in Table I. The extents of contamination with mitochondria and plasma membrane are lower (mitochondria) or similar (plasma membrane) to those usually reported for purified total microsomes
(6, 14, 16). However, in order to minimize the possible contribution of mitochondria to the energy-dependent Ca2+ uptake by microsomal fractions, the mitochondrial inhibitors, 5 mM NaN3 (10) or 2 p~ ruthenium red (6,12), were added to all the incubation systems.
In addition to electron microscopy examination, the integrity of the membrane of rough and smooth vesicles was also ascertained by measuring the latency of mannose-6-phosphatase activity, as de- scribed by Nilsson et al.. (41). The mannose-6-phosphatase activities
I
,
FIG. 1. Electron micrographs of rough ( A ) and smooth ( B ) microsomal fractions. The fractions were isolated by sucrose dis- continuous gradient centrifugation and prepared for electron micros- copy as described under “Experimental Procedures.” Magnification X 35,000.
of rough and smooth microsomes were 10.6 f 1.9 and 10.1
*
1.5% (means*
S.E. of four typical preparations), respectively, with respect to the activities of fully disrupted microsomal vesicles.Measurement of Calcium Uptake and Release-The microsomal fractions were incubated at 37 “C in a medium which had the following composition (mM): KCl, 100; NaC1, 20.0; MgC12, 5.0; KHzP04, 1.0; MOPS, 10.0, pH 7.2, in the presence of 1 mM ATP plus an ATP- regenerating system (5 mM creatine phosphate and creatine phospho- kinase (5 p M units/ml)), 20 p M CaC12, and 0.1 pCi/ml 45CaC12. When indicated in the individual experiments, 1 mM glucose-6-P was also present. Either 5 mM NaN3 or 2 pM ruthenium red was added to the medium as mitochondrial inhibitor. The incubation was started by the addition of a small volume (1/50 of the volume of the incubation mixture) of the microsomal suspensions to the prewarmed (5 min at 37 “C) complete medium in order to have 0.08-0.1 mg of microsomal protein/ml. The volume of the incubation mixture was 2-5 ml ac- cording to different experiments.
In the experiments for testing IP3 or GTP Ca2+-releasing activity, two aliquots of the same incubation mixture were quickly transferred (using an automatic prewarmed (37 “C) pipette) into prewarmed (37 “C) tubes which contained either IPS and/or GTP in a small volume (less than 2% of the total volume of the sample) of 0.15 M KC1 or an equal volume of 0.15 M KC1. The samples were further incubated at 37 “C for the indicated periods of time.
Calcium accumulated by microsomes was measured by using a rapid filtration technique (10) as follows. At definite time intervals, 100 pl of the incubation mixture were drawn and placed on 25-mm cellulose nitrate filters (0.2-pm pore diameter, Sartorius). The filters were quickly washed with cold 0.25 M sucrose (5 ml, three times), and the “Caz+ retained on the filters was determined by liquid scintillation spectrophotometry (16). The specific radioactivity of the radioisotope in each incubation was determined by counting the radioactivity of an unfiltered 100-pl sample (16). Each Ca2+ uptake assay was cor-
3468
IP3,
GTP, and
Glucose-6-P-stimulated Microsomal Caz+ Uptake
TABLE IDistribution and specific activity of marker enzymes
Liver homogenate, 10,000 X g pellet, and microsomal fractions were prepared as described under “Experimental Procedures.” Rough and smooth microsomes were resuspended in the KCI-MOPS buffer but without inorganic phosphorus in order to measure inorganic phosphorus released by 5’-nucleotidase and glucose-6-phosphatase. 5’- Nucleotidase and cytochrome c oxidase activities were measured as reported by Reinhart and Bygrave (6). Glucose- 6-phosphatase activity was measured as previously described (40). One unit of 5’-nucleotidase as well as of glucose- 6-phosphatase activity is defined as 1 nmol of inorganic phosphorus formed/min/mg of protein. One unit of cytochrome c oxidase is defined as 1 nmol of cytochrome c oxidized/min/mg of protein. Data are means f S.E. of four experiments. In the case of the 10,000 X g pellet means of two experiments are reported.
Fraction Enzyme activity
B’-Nucleotidase Cytochrome c oxidase Glucose-6-phosphatase
unitslmg % recovery unitslmg % recovery unitslmg % recovery
Liver homogenate 63 f 2 (100) 70 f 3 (100) 52 f 2
94 70.6 (100)
10,000 X g pellet 122 82.6 51 46.3
Rough microsomes 81 f 9 6.2 f 0.4 14 f 2
Smooth microsomes 114 f 9 6.5 f 1.1 12 f 1 0.6 1.0 f f 0.1 0.1 196 232 f 10 f 8 13.2 21.9 k f 1.8 1.6
rected for nonspecifically bound Ca2+ by subtracting any radioactivity remaining on the filters in the absence of ATP from the assay medium (16). Ca2+ accumulation by microsomes was calculated by assuming the total Ca2+ concentration of the medium to be 20 p~ on the basis of added Ca2+, without taking into consideration the amount of Ca2+ present as contaminant of routine solutions. The concentration of contaminating ca2+ present in the complete medium (including 1 mM glucose-6-P) was 11.0 f 2.0 ~ L M (mean f S.E. of five different preparations), as measured by atomic absorption spectroscopy as previously reported (16).
In some experiments the microsomal Ca2+ uptake was measured by monitoring the free Ca2+ concentration of the incubation mixture with a Ca2+ electrode, rather than by measuring the GCa2+ uptake by microsomes. In the conditions employed, a good correlation was observed between the two methods, as assessed by the concomitant measurement of the uptake of %a2+, added in trace amounts to the incubate.
Ca2+ electrodes were constructed as described by Affolter and Sigel (42). Measurements were made with a remote calomel reference electrode (K4040, Radiometer). The Caz+ electrode was calibrated as described by other authors (43).
Other Analytical Procedures-Glucose-6-phosphatase activity was assayed by measuring the amount of glucose released from glucose-6-
P. Glucose was determined by the glucose-oxidase method as previ- ously reported (16). Protein were determined according to Lowry et
al. (37) using bovine serum albumin as standard.
Materials-ATP, GTP, glucose-6-P, mannose 6-phosphate, phos- phocreatine, creatine phosphokinase (Sigma Type III), and PEG (M. 8000) were from Sigma.
IPS
(inositol 1,4,5-trisphosphate) was from Amersham Corp. or from Sigma. The latter contained approximately 20% inositol 2,4,54risphosphate. Purified IP4 (inositol 1,3,4,5-tetra- kisphosphate) was generously’provided by Dr. Robin Irvine, Cam- bridge, Great Britain. “CaC1, (1650 Ci/mol) was from Du Pont-New England Nuclear. Na,VO, was from Fisher. Ruthenium red (BDH Chemicals) was purified by the method of Fletcher et al. (44), and its concentration was determined by measurement of ASa2 by using an Am of 61.5 (44). All the other chemicals were of analytical grade.RESULTS
Stimulatory Effect
ofGlucose-6-P
on MgATP-dependent
Calcium Accumulation by Rough and Smooth Microsomes-
The time course of the glucose-6-P-stimulated MgATP-de-
pendent Ca2+ uptake
byboth rough and smooth microsomes
is presented in Fig. 2. Glucose-6-P markedly stimulates the
energy-dependent Caz+ uptake in rough as well as in smooth
microsomes although the effect is more pronounced in smooth
microsomes (Fig. 2 B ) . Such results essentially confirm
ourprevious ones, both in total microsomes from rat liver (16)
and in isolated hepatocytes permeabilized with digitonin
(20).The stimulatory effects of glucose-6-P on Ca2+ accumula-
tion by rough and smooth microsomes at different concentra-
tions of glucose-6-P are reported in Fig.
3.
A
progressive
increase in the stimulation of Ca2+ accumulation can be
observed up to glucose-6-P concentrations of 2 mM in both
30 20
-
I ; 10 c P MGATP.
O Y 100 1 50-
0 10 20 30 40 INCUBATION TIME (MIN)FIG.
2. Time course of the glucose/glucoee-6-P-stimulated MgATP-dependent Ca2+ uptake by rough ( A ) and smooth( B )
microsomes. The microsomal fractions (0.08-0.1 mg of protein/ml) were incubated at 37 “C in a medium which had the following com- position (mM): KCl, 100; NaCl, 20.0; MgCl,, 5.0; KH,P04, 1.0; MOPS, 10.0, pH 7.2, containing 1 mM ATP plus an ATP-regenerating system (creatine phosphate, 5 mM and creatine phosphokinase, 5 p~ units/ ml), 20 p M CaCl,, and 0.1 pCi/ml “CaCI, in the presence (0) or in the absence (0) of 1 mM glucose-6-P. Ruthenium red (3 PM) was also present as mitochondrial inhibitor. At the indicated times, aliquots of the incubation mixture were drawn to measure *Can+ taken up by microsomes, and Ca2+ uptake was calculated as reported under “Ex- perimental Procedures.” The amount of Ca2+ nonspecifically bound to microsomes (Le. in the absence of ATP in the incubation mixture) was in all experimental conditions (rough and smooth microsomes, in the presence and in the absence of glucose-6-P) lower than 0.9 pmol of Caz+/mg of protein at any incubation time. Data shown represent means f S.E. of five experiments.fractions. Higher concentrations of glucose-6-P (up to 10 mM,
data not shown) do not result in a further stimulation. With
all the different glucose-6-P concentrations used, the extent
of stimulation by glucose-6-P is higher in smooth (Fig. 3 B )
than in rough microsomes (Fig.
3A). This difference is the
subject of a separate study. What can be observed here is that
glucose-6-P is effective in stimulating active Ca2+ accumula-
IPS, GTP,
and
Glucose-6-P-stimulated Microsomal
Ca2+
Uptake
3469
120 l q 0 l 60 120 l q 0 lL
L
40 20 0 GLUCOSE6P .I .2 CONCENTRATION .5 1(MM) h 2 GLUCOSE6P CONCENTRATION (MM) tJFIG. 3. Glucose-6-P stimulation of MgATP-dependent Ca2+ uptake by rough (A) and smooth ( B ) microsomes as a function
of glucose-6-P concentration. The two microsomal fractions were incubated for glucose-6-P-stimulated MgATP-dependent Caz+ uptake as reported in legend to Fig. 2. Glucose-6-P was present in the incubation mixture at the indicated concentrations. Net glucose-6-P- stimulated Ca2+ uptake values were obtained by subtracting the values determined in the absence of glucose-6-P (in the presence of MgATP only) from those determined in presence of the different concentra- tions of glucose-6-P. Ca2+ uptake values at 30 min of incubation in the absence of glucose-6-P were 5.2 -C 0.71 and 8.03 f 0.61 nmol of CaZC/mg of protein for rough and smooth microsomes, respectively. Data shown represent means f S.E. of three experiments.
tion in rough and in smooth microsomes at concentrations
(0.1-0.5 mM) which have been reported to occur in resting as
well as in stimulated hepatocytes (31-34).
IP,-induced Release of
Ca2+
from Rough
andSmooth Micro-
somes-The Ca2+-releasing effect of
IP,
on microsomal frac-
tions, which had been previously loaded with Ca2+ in the
presence of MgATP and glucose-6-P, is shown in Fig. 4. Upon
addition of 5
p~IP, the Ca2+ contents of both rough (Fig.
4A) and smooth microsomes (Fig. 4B) rapidly
(1min) de-
crease as compared to their controls
(i.e. samples to which
IP, has not been added), indicating a rapid Ca2+ release from
microsomal vesicles. Higher concentrations of IP, do not
result in higher Ca2+ releases (data not shown).
Since it has been shown that stimulated cells (45-47) in-
cluding the hepatocyte (48), besides IP3, also accumulate IP,,
it was investigated whether
IP,
releases Ca2+ from liver mi-
crosomal vesicles. As can be seen in Fig. 4, IP, (5
PM)does
not release Caz+ from either rough (Fig.
4A)
or smooth micro-
somes (Fig. 48). Lack of Ca2+ mobilization by IP, from a
nonmitochondrial pool (likely endoplasmic reticulum) in per-
meabilized hepatocytes (48) as well as in nonhepatic
cells (49)
also has been reported. Thus, effects other than Caz+ mobili-
zation from endoplasmic reticulum might be elicited by IP,
in the liver cell. An activity of IP, in controlling Ca2+ flux at
the plasma membrane level has been recently suggested in
the sea urchin egg
(50).As
can be seen in Fig.
5,in both the microsomal fractions
which previously accumulated Ca2+ in the presence of MgATP
only
(i.e. in the absence of glucose-6-P), a Ca2+
release elicited
-2 i e I -
V
,
0 2 4 6 8 1 0 INCUBATION TIE (8IN)
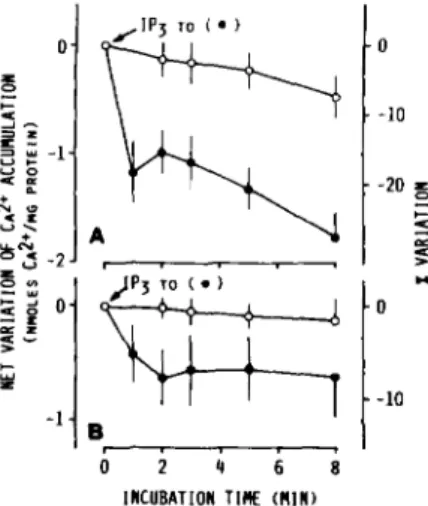
FIG. 4. Ca2+-releasing effect of IPS and lack of such an effect of IP, in rough (A) and smooth ( B ) microsomes which had
previously accumulated Ca" in the presence of MgATP and glucose-6-P. The two microsomal fractions were incubated for glu- cose-6-P-stimulated MgATP-dependent Ca2+ uptake at 37 'C as re- ported in legend to Fig. 2, except that 5 mM NaN8 was employed as mitochondrial inhibitor instead of ruthenium red. At 30 min of incubation aliquots of the incubation mixture were transferred into tubes containing either IP,
(a)
or IP,(A)
in a small volume of 0.15M KC1 (5 PM, final concentration) or 0.15 M KC1 alone (0) and further incubated at 37 "C. The mean values for accumulated CaZ+ at 30 min of incubation (referred to as zero time in the figure) were 25.70 and
83.22 nmol of Ca2+/mg of protein in rough and smooth microsomes,
respectively. Values shown (mean of two different experiments) rep- resent the differences in Ca" accumulation (expressed as nmol of Ca"/mg of protein) at each indicated time with respect to Ca2+ accumulated by microsomes by the time of IP, or IP, additions. Percent variations of Ca2+ accumulation, calculated assuming as 100% the zero time mean value of Caz+ accumulation by microsomes (see above), are also indicated on the right scale of the figure.
by IP3 is also present, although such a release is minimal in
smooth microsomes.
IP,
releases variable portions (about 7-20%) of the Ca2+
accumulated, depending on the experimental system (Figs. 4
and 5). Ca2+ loading of smooth vesicles under glucose-6-P
stimulation results in an increase of net Ca2+ release (6-9
uersus 0.5 nmol of Ca2+/mg of protein, compare Fig. 4B with
Fig.
5B), while the percentage of Ca2+ released is similar (7-
10%
uersus 7%). Similarly, Ca2+ loading of rough microsomes
in the present of glucose-6-P results in an increase of net Ca2+
release (3-4
uersus 1-1.5 nmol of Ca2'/mg of protein, compare
Fig.
4A
with Fig. 4B), even if the percentage of released Ca2+
is somewhat decreased (15%
uersw 20%). Previous results
obtained with permeabilized hepatocytes (17, 25, 51) also
showed that
IP3
can release a part not exceeding 20-25% of
the accumulated Ca2+.
The Ips-induced release of Ca2+ from liver microsomes was
further studied by adding IP, to the microsomal preparations
at the beginning of the glucose-6-P-stimulated Ca2+ uptake.
As can be seen in Fig. 6, in the presence of 5
PMIP, rough
(Fig. 6A) and smooth microsomes (Fig. 6B) actively accu-
mulate Ca2+ under glucose-6-P stimulation, although at a
lower rate as compared to their controls
(i.e. samples not
containing IP,). At the latest time of incubation (30 min), the
decreases in Ca2+ accumulation (18 and
11%in rough and
smooth microsomes, respectively; Fig. 4) essentially corre-
spond to the decreases in Ca2+ content observed when IP, was
added to microsomes previously loaded with Ca2+ (see Fig. 3).
3470
IP3, GTP, and Glucose-6-P-stimulated Microsomal ea2+ Uptake
- 0.
-10-
-20 L 0 C I I- LT"
0t
-10 INCUBATION TlK (RIA)FIG. 5. CaP+-releasing effect of IPS in rough ( A ) and smooth ( B ) microsomes which had previously accumulated Ca" in
the presence of MgATP. The two microsomal fractions were in- cubated for MgATP-dependent Ca2+ uptake (in the absence of glu- cose-6-P) at 37 'C as reported in the legend to Fig. 2, except that 5 mM NaN3 was employed as a mitochondrial inhibitor instead of ruthenium red. At 8 min of incubation, aliquots of the incubation mixture were transferred into tubes containing IPS (0) in a small volume of 0.15 M KC1 (5 p M , final concentration) or 0.15 M KC1 alone
(0) and further incubated at 37 'C. The mean f
S.E.
values for accumulated Ca2+ at 8 min of incubation (referred to as zero time in the figure) were 6.10 f 0.22 and 8.20 f 0.65 nmol of Ca2+/mg of protein in rough and smooth microsomes, respectively. Values shown (means -CS.E.
of six or five different experiments for rough or smooth microsomes, respectively) represent the differences in Ca2+ accumu- lation (expressed in nmol of Ca"/mg of protein) at each indicated time with respect to Ca2+ accumulated by microsomes by the time of IP3 addition. Percent variations of Ca2+ accumulation calculated assuming as 100% the zero time mean value of Ca2+ accumulation by microsomes (see above) are also indicated on the right scale of the figure.INCUBATION TIME (MIN)
FIG. 6. Inhibitory effect of IPS on the glucose-6-P-stimu- lated MgATP-dependent Caz+ uptake by rough ( A ) and smooth
( B )
microsomes. The two microsomal fractions were incubated for glucose-6-P-stimulated MgATP-dependent Ca" uptake at 37 "C as reported in the legend to Fig. 2 except that 5 mM NaN3 was employed as mitochondrial inhibitor instead of ruthenium red in the presence (0) or in the absence (0) of 5 p~IP,.
At the indicated times, aliquotsof the incubation mixture were drawn to measure the '%a2+ taken up by microsomes, and Ca2+ uptake was calculated as reported under "Experimental Procedures." The amount of Ca2+ nonspecifically bound to microsomes (Le. in the absence of ATP in the incubation mixture) was in all experimental conditions (rough and smooth microsomes, in the presence and in the absence of IP,) lower than 0.9 nmol of Ca2+/mg of protein. Data shown represent means f S.E. of four experiments.
Interestingly,
IP, does not reduce the initial rate
ofCa2+
uptake (see Fig.
6, A and B;
3min
of incubation: rough
miarosomes,
6.3 f 0.7and
6.4-+
0.6nmol
of Ca2+/mg of
protein in the absence and in the presence of IPS, respectively;
smooth microsomes,
13.9 k1 and
14.3 f 1.3nmol
ofCa2+/mg
0 6 12 18
INCUBATION TIME (#IN)
FIG. 7. Ca'+-releasing effect of GTP in rough ( A ) and
smooth ( B ) microsomes which had previously accumulated
Cas+
in the presence of MgATP and glucose-6-P. The two microsomal fractions were incubated for glucose-6-P-stimulated MgATP-dependent Ca2+ uptake at 37 "C as reported in the legend to Fig. 2, except that 5 mM NaN3 was employed as mitochondrial inhibitor instead of ruthenium red; 3% (w/v) PEG was also present in the incubation mixture. At 30 min of incubation aliquots of the incubation mixture were transferred into tubes containing GTP (0) in a small volume of 0.15 M KC1 (10 p M , final concentration) or 0.15M KC1 alone (0) and further incubated at 37 "C. The mean f S.E. values for accumulated Ca2+ at 30 min of incubation (referred to as zero time in the figure) were 32.2 f 2.6 and 90.0 f 3.1 nmol of Ca2+/ mg of protein in rough and smooth microsomes, respectively. Values shown (means f S.E. of three different experiments) represent the differences in Ca2+ accumulation (expressed in nmol of Ca2+/mg of protein) at each indicated time with respect to Ca2+ accumulated by microsomes by the time of GTP addition.
+2 1 0 - -2
-
-4-
-6--a
-
PTP AND/OR 1P3 I 0 2 4 6 8 1 0 1 2INCUBATION TIME (MINI
FIG. 8. Ca'+-releasing effects of GTP and/or IPS in rough microsomes which had previously accumulated Caz+ in the presence of MgATP and glucose-6-P. The rough microsomal fraction was incubated for glucose-6-P-stimulated MgATP-depend- ent CaZ+ uptake at 37 "C as reported in the legend to Fig. 2 except that 5 mM NaN3 was employed as mitochondrial inhibitor instead of ruthenium red. At 30 min of incubation aliquots of the incubation mixture were transferred into tubes containing either GTP
(A)
or IP3 (0) or both GTP and IP3 (D) in a small volume of 0.15 M KC1 or 0.15M KC1 alone (0) and further incubated at 37 ' C . The final concentra- tions of GTP and IP3 were 10 and 5 p ~ , respectively. The value for accumulated Ca2+ by microsomes at 30 min of incubation (referred to as zero time in the figure) was 29.81 nmol of Ca2+/mg of protein. Values shown (means of two different experiments) represent the differences in Ca2+ accumulation (expressed as nmol of Caz+/mg of protein) at each indicated time with respect to Ca2+ accumulated by microsomes by the time of GTP and/or IP, additions.
IP3, GTP, and Glucose-6-P-stimulated Microsomal Ca2’ Uptake
3471
304 A P
INCUBATION TINE ( N l N )
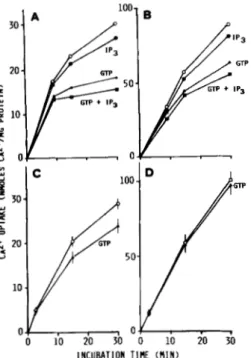
FIG. 9. Inhibitory effect of GTP and/or IPS on glucose-6-P- stimulated MgATP-dependent Caa’ uptake by rough and smooth microsomes in the presence or in the absence of PEG.
A,
C
rough microsomes, with or without 3% (w/v) PEG, respectively. E , D: smooth microsomes, with or without 3% (w/v) PEG, respec- tively. The two microsomal fractions were incubated for glucose-6-P- stimulated MgATP-dependent Ca2+ uptake at 37 ‘C as reported in legend to Fig. 2, except that 5 mM NaN, was employed as mitochon- drial inhibitor instead of ruthenium red. Either 10 p~ GTP(A)
or 5 pM IP, (0) or 10 pM GTP plus 5 p~ IP, (M) were present in theincubation mixtures; 0, Ca2+ uptake in the absence of GTP and/or IPI. At the indicated times, aliquots of the incubation mixture were drawn to measure the “Ca2+ taken up by microsomes, and Caz+ uptake was calculated as reported under “Experimental Procedures.” The amount of Ca2+ nonspecifically bound to microsomes (i.e. in the
absence of ATP in the incubation mixture) was in all experimental conditions lower than 0.9 pmol of Ca*’/mg of protein. A, E: a typical experiment out of three is shown. C, D: data are the means & S.E. of three experiments.
of protein, in the absence and in the presence of IP3, respec- tively). This indicates that
IP,
does not modify the active Ca2+ transport into microsomal vesicles, which in turn sug- gests thatIPS
acts by increasing theCa2+
efflux from liver endoplasmic reticulum,as
also suggested by other authors in different experimental conditions (( 18) see Ref. 24 for a review).Since glucose-6-P hydrolysis by glucose-6-phosphatase is likely essential for the stimulatory effect of glucose-6-P on microsomal
Ca2+
uptake (16, 20, 22), the effect of IPS on glucose-6-phosphatase activity was evaluated in rough and smooth microsomes.It
was found that IP3 (up to 20 PM) does not modify glucose-6-P hydrolysis in either fraction (data not shown).GTP-induced Release of
Ca2+
from Rough and Smooth Mi- crosomes-As mentioned above, previous data have shown that GTP elicits Ca2+ release in liver microsomes (29) as wellas
in nonhepatic cells (30, 52-54). According t o different reports, G T P would enhance IP3-mediated Ca2+ release from liver microsomal fractions (28,55) or might act independently fromIP,
(29,30,
53, 54). In addition, it has been reported that the effectiveness of GTP in releasing Ca2+ depends on the presence of agents which increase the viscosity of the medium, suchas
PEG
(2&30), polyvinylpyrrolidone (29),or
bovine serum albumin (29)..
GTPI
;
0 10 20 lo dl
FIG. 10. Effects of subsequent additions of GTP, glucose-6- P, and IPS on Caa+ uptake by rough microsomes. Ca2+ uptake by rough microsomes was measured by monitoring the free Ca2+ concentration in the incubation system for MgATP-dependent Ca2+ uptake with a Ca2+ electrode (see “Experimental Procedures” for details). Rough microsomes were incubated in a thermostated (37 “C) Plexiglas vessel in which a Ca2+ electrode and a reference electrode (Radiometer K4040) were immersed as described by Affolter and Sigel (42). The incubation system was composed as follows: 1 mg/ml
of microsomal protein, 100 mM KC1, 20 mM NaC1, 5 mM MgCl,, 1
mM KH,PO,, 10 mM MOPS, pH 7.2,5 mM NaN3 3% (w/v) PEG, and
2 mM ATP plus an ATP-regenerating system (creatine phosphate, 10 mM and creatine phosphokinase, 10 mM units/ml). The volume of the incubation mixture was 1 ml. The incubation was started by the
addition of the microsomal suspension (50 pl). Where indicated in the figure, additions of GTP (final concentration 10 p ~ ) , glucose-6-
P (final concentration 0.5 mM), or IP, (final concentration 5 p ~in )
a small volume of 0.15 M KC1 (2-5 pl) were made. At the end of the incubation, two subsequent additions of standard CaCI2 (2 nmol each) were also made. The Ca” electrode was calibrated before and after the incubation with Ca2’ buffers as reported by others (43). The amount of total Ca2’ present in the incubation medium before the addition of the microsomal fraction was 13.3 nmol/ml, as measured by atomic absorption spectroscopy (16). A typical experiment out of
three is shown in the figure.
INCUMTION TIE tnln)
In the present study, the activity
of
GTP
in eliciting Ca2+ release was also investigated in liver microsomal systems for MgATP-dependent glucose-6-P-stimulated Ca2+ uptake.The addition of 10 p~ GTP to microsomes, which had been previously loaded with
Ca2+
in the presence of MgATP and glucose-6-P, results ina
progressive decrease of the accumu- latedCa2+
both in rough (Fig.7 A )
and smooth microsomes (Fig.7 B ) ,
provided that PEG is present in the incubation system. In the absence of PEG, no effect was observed in smooth microsomes (data not shown). On the other hand, G T P releases Ca2+ from rough microsomes even in the ab- sence of PEG (Fig. 8) although the extentof
such release is lower than in its presence. The concomitant addition ofIP3
results in a higher Ca2+ release, which appears to be the sum of the Ca2+ releases caused by IP3 and GTP independently (Fig.8).
The GTP-induced Ca2+ release from liver microsomes was further studied by adding GTP to the microsomal prepara- tions
at
the beginning of the glucose-6-P-stimulatedCa2+
uptake. As can be seen in Fig. 9,
A
andB,
the active glucose- 6-P-stimulatedCa2+
uptake by both rough and smooth micro- somesis
strongly decreased in the presence of 10 PM GTP, when PEGis
present in the incubation system. In these experimental conditions too, the effects of IP3 and GTP are likely t o be independent from each other. In fact (Fig. 9,A
andB ) ,
in the presence of IP, and GTP, Ca*+ accumulation by both microsomal fractionsis
decreased to an extent which is the sum of the decreases caused byIPS
and GTP separately. It should also be mentioned that the presence of PEG in the incubation system essentially does not modify the inhibitory effect of IPS on Ca2+ accumulation (see Fig. 6 for comparison). In the absence ofPEG, GTP
is moderately effective on rough3472
IP,, GTP,
andGlucose-6-P-stimulated
Microsomal ea2+
Uptake
microsomes only (Fig. 9C).
As shown above for IP3, GTP does
not influence the initial rate of Ca2+ uptake, which suggests
that GTP acts by increasing the Ca2+ efflux from vesicles,
rather than inhibiting active Ca2+ pumping. This had been
already suggested by the results obtained by other authors in
different experimental systems for microsomal Ca2+ uptake
(29, 30). As reported above for IP,, GTP (up to 50
PM)did
not modify the glucose-6-P hydrolysis by both rough and
smooth microsomes (data not shown).
Additional experiments suggest that
IPS
and GTP may act
on different Ca2+ channels and/or on different portions of
microsomal membrane.
As can be seen in Fig. 10, GTP
releases most of Ca2+ previously accumulated by rough micro-
somes in the presence of MgATP only (i.e. in the absence of
glucose-6-P).
A
subsequent addition of glucose-6-P results in
a substantial reuptake
of the released Ca".
A
further addition
of GTP is ineffective, thus indicating that the maximal Ca2+-
releasing effect of GTP has already been achieved. On the
other hand, the subsequent addition of
IP3
still elicits a rapid
Caz+ release, whose extent (10-15%) is comparable to that
observed when
IF',
is added to Ca2+-loaded microsomes not
previously challenged by GTP and glucose-6-P (data not
shown; see also Fig. 5).
DISCUSSION
The results presented here indicate that IP3 mobilizes Ca2+
from purified microsomal fractions isolated from rat liver.
This provides further and direct evidence that liver endo-
plasmic reticulum is the target for IP3 when it causes Ca2+
mobilization from intracellular stores.
As mentioned above,
previous attempts to demonstrate the Ca2+-releasing effect of
IP, with isolated subcellular preparations of rat liver were
only partially successful (17,18,26,27). This can
be explained
by the possible influence of several factors such as for in-
stance: (i) loss of IP,-responsive endoplasmic reticulum por-
tions along with heavier organelles during the preparation of
microsomal fractions (17); (ii)
IPS
degradation by
IP,
phos-
phatase present in
the plasma membrane (56), which can
contaminate at various extents the microsomal preparations;
(iii) influence of Ca2+ concentration in the test systems on
the Ca2+-releasing activity of
IPS
(52, 53).
In the experimental conditions used
( i e .Ca" loading of
microsomes under glucose-6-P stimulation)
IPS
activates Ca2+
release in rough as well as in smooth microsomes, thus indi-
cating that the
whole liver endoplasmic reticulum can respond
to IPS, and, therefore, a loss of selected parts of endoplasmic
reticulum responsive to IP3 seems to be unlikely. Also it has
been shown that the distribution of binding sites for
IPS
parallels the distribution of the endoplasmic reticulum mark-
ers in subcellular fractions from rat liver (57), which indicates
that IP, receptors are distributed on the whole endoplasmic
reticulum of liver cell. However, since smooth microsomes
release a lower percentages of the accumulated Ca" than
rough microsomes (see Figs. 4 and 5), a
different sensitiveness
of different parts of the endoplasmic reticulum to IP3 can be
envisaged.
According to various estimates (31,33) glucose-6-P is avail-
able for a continuous hydrolysis by glycose-6-phosphatase in
the liver cell even in resting conditions, since a basal level of
glucose-6-P is continuously maintained by the glucose/glu-
cose-6-P "futile" cycle (31-34,
58). Thus, high CaZ+ levels
could be continuously maintained in endoplasmic reticulum
by the concomitant activities of Ca2+ pumps and glucose-6-
phosphatase. Direct measurements of Ca2+ content in rough
cysternae, by electron probe x-ray microanalysis, have shown
(59)
that endoplasmic reticulum is indeed a major intracellular
store of Ca2+ containing higher Caz+ amounts than the other
intracellular compartments including mitochondria. It can,
therefore, be envisaged that the glucose-6-P enhancement of
Ca2+ accumulation into endoplasmic reticulum results in an
amplification of the effect of intracellular Ca2+-mobilizing
mediators like IP,. However, more complex interactions be-
tween
IP3
and glucose-6-P probably occur in stimulated hep-
atocytes,
i.e. when hormones are evoking intracellular in-
creases of IP3 levels ((60) see Refs. 18 and 61 for reviews).
This would in fact result soon after in a cytosolic Ca2+
increase, which in turn causes (62) or is accompanied by an
increase in glucose-6-P via glycogenolysis (4, 63, 64). The
increased availability of glucose-6-P could favor Ca2+ uptake
by the endoplasmic reticulum. This might result either in a
lowering cytosolic free Ca" to resting values or in a further
higher release of reticular Ca2+ if IP3 is still, or again, avail-
able. Since rough appear to be more responsive to
IP,
than
smooth microsomes, but the latter are much more sensitive
to glucose-6-P stimulation of Ca2+ accumulation, the possi-
bility exists that different parts of the endoplasmic reticulum
play different roles in the regulation of cytosolic Ca2+. On the
other hand, it also should be considered that, in the stimulated
hepatocyte, the elevation of cytosolic Ca" is likely due only
in part (and in the
initial phase) to intracellular mobilization
(e.g. by IPS), being also due to Ca2+ entry into the cell (see
Ref. 18 for a review). However, work is still needed in order
to clarify the interactions between IPS and glucose-6-P with
respect to Ca2+ homeostasis in the stimulated hepatocyte.
As far as the effect of GTP on Ca2+ accumulation by liver
microsomes, GTP itself appears to be able to activate Ca2+
release from both rough and smooth microsomes which had
previously accumulated Ca2+ under glucose-6-P stimulation.
The Ca2+ release mediated by GTP is less rapid than that
mediated by IP, but progressively increases with time up to
levels higher than in the case of IP3. Also, in the present
experimental conditions the Ca2+-releasing activity of
IP3
is
not modified by GTP and vice versa. Therefore, the two
agents, although producing the same effect
(i.e.increase in
passive efflux of Ca2+ ions), appear to act independently from
each other. This confirms previous data obtained in different
experimental conditions (30,52-54).
Unlike IP3, the Ca2+-releasing activity of GTP on rough
and smooth microsomes is highly magnified in the presence
of 3% PEG, as previously reported in different experimental
conditions (28-30). It has been shown recently (65) that PEG
stimulates a high-affinity GTPase in liver microsomes. This
strengthens the previous suggestion (55) that the mechanism
of GTP in eliciting Ca2+ release might consist of a phospho-
rylation of microsomal proteins as a consequence of GTP
hydrolysis. Yet, in our experimental system, rough micro-
somes appeared to be responsive to GTP action even in the
absence of PEG, their Ca2+ accumulation being significantly
lowered in the presence of GTP alone (Fig. 10). Saponine-
permeabilized neuroblastoma cells have been shown to release
Ca2+ from endoplasmic reticulum upon GTP stimulation in
the absence of PEG (52). However, at present it is difficult to
give an explanation for a role of GTP in mediating Ca2+
release in the liver. According to several estimates (66,67), in
fact, GTP is present in the cytosolic compartment of the
hepatocyte at high concentrations, which would continuously
stimulate Ca2+ efflux from endoplasmic reticulum. Theoreti-
cally, in the intact hepatocyte, mechanisms should be opera-
tive which counteract and/or modulate the action of GTP
(fully expressed
in.
uitro
in the presence of PEG). One of these
mechanisms might well rely on the action of glucose-6-P in
favoring Caz+ accumulation into liver endoplasmic reticulum.
IP,, GTP, and Glucose-6-P-stim
Work is in progress in our laboratory in order to further
elucidate the possible interactions between
GTP
and glucose-
6-P at the endoplasmic reticulum membrane
of
the hepato-
cyte.
Acknowledgments-We wish to thank Dr. E. Carafoli for his kind and fruitful help in the discussion of this manuscript. Dr. A. Pompella provided valuable help in the preparation of the manuscript. Dr. R. F. Irvine is also acknowledged for the gift of IP,.
REFERENCES
1. Becker, G. L., Fiskum, G., and Lehninger, A. L. (1980) J. Biol. Chem. 255,9009-9012
2. Murphy, E., Coll, K., Rich, T. L., and Williamson, J. R. (1980) J . Biol. Chem. 255,6600-6608
3. Burgess, G. M., McKinney, J. S., Fabiato, A., Leslie, B. A., and Putney, J. W., Jr. (1983) J. Bwl. Chem. 258,15336-15345 4. Althaus-Salzmann, M., Carafoli, E., and Jakob, A. (1980) Eur. J.
Bwchem. 106,241-248
5. Andia-Waltenbaugh, A. M., Lam, A., Hummel, L., and Fried- mann, N. (1980) Biochim. Biophys. Acta 630,165-175 6. Reinhart, P. H., andBygrave, F. L. (1981) Biochem. J. 194,541-
549
7. Blackmore, P. F., Hughes, B. P., Shuman, E. A., and Exton, J.
H. (1982) J. Biol. Chem. 257,190-197
8. Burgess, G. M., Godfrey, P. P., McKinney, J. S., Berridge, M. J., Irvine, R. F., and Putney, J. W., Jr. (1984) Nature 309,63-66 9. Mauger, J. P., and Claret, M. (1986) FEBS Lett. 1 9 5 , 106-110 10. Moore, L., Chen, T., Knapp, H. R., Jr., and Landon, E. J. (1975)
J. Biol. Chem. 250,4562-4568
11. Farber, J. L., El-Mofty, S. K., Schanne, F. A. X., Aleo, J. J., Jr., and Serroni, A. (1977) Arch. Biochem. Biophys. 1 7 8 , 617-624 12. Bygrave, F. L. (1978) Bwchem. J. 170.87-91
13. Dawson, A. P. (1982) Biochern. J. 206,73-79
14. Brattin, W. J., Jr., Waller, R. L., and Rechnagel, R. 0. (1982) J.
15. Famulski, K. S., and Carafoli, E. (1984) Eur. J . Biochem. 1 4 1 , 16. Benedetti, A., Fulceri, R., and Comporti, M. (1985) Biochim.
17. Joseph, S. K., Thomas, A. P., Williams, R. J., Irvine, R. F., and Williamson, J. R. (1984) J. Bwl. Chem. 2 5 9 , 3077-3081 18. Williamson, J. R., Cooper, R. H., Joseph, S. K., and Thomas, A.
P. (1985) Am. J. Physiol. 2 4 8 , C203-C216 19. Carafoli, E. (1987) Annu. Reu. Biochem. 56, 395-433
20. Benedetti, A., Fulceri, R., Romani, A., and Comporti, M. (1987)
21. Benedetti, A., Fulceri, R., Ferro, M., and Comporti, M. (1986)
22. Wolf, B. A., Colca, J. R., Comens, P. G., Turk, J., and McDaniel,
23. Streb, H., Irvine, R. F., Berridge, M. J., and Schultz, I. (1983)
24. Berridge, M. J. (1986) J . Exp. Biol. 1 2 4 , 323-335
25. Burgess, G. M., Irvine, R. F., Berridge, M. J., McKinney, J. S.,
and Putney, J. W., Jr. (1984) Bwchem. J. 2 2 4 , 741-746 26. Dawson, A. P., and Irvine, R. F. (1984) Binchem. Biophys. Res.
Commun. 120,858-864
27. Muallem, S., Schoeffield, M., Pandol, S., and Sachs, G. (1985) Proc. Natl. Acad. Sci. U. S. A . 8 2 , 4433-4437
28. Dawson, A. P. (1985) FEBS Lett. 1 8 5 , 147-150
29. Henne, V., and Soling, H.-D. (1986) FEBS Lett. 202,267-273
Biol. Chem. 2 5 7 , 10044-10051 15-20
Biophys. Acta 816,267-277
Biochim. Biophys. Acta 9 2 8 , 282-286
Trends Bwchem. Sci. 11,284-285
M. L. (1986) J. Biol. Chem. 261,162&1-16287
Nature 306,67-69
dated
Microsomal Ca2+ Uptake
3473
30. Chueh, S.-H., and Gill, D. L. (1986) J. Biol. Chem. 2 6 1 , 13883- 31. Hers,
H.
G. (1976) Annu. Rev. Biochem. 45,167-18932. De Wulf, H., and Hers, H. G. (1967) Eur. J. Biochem. 2,50-56 33. Hue, L., and Hers, H. G . (1974) Biochem. Biophys. Res. Commun.
34. Christ, B., Probst, I., and Jungermann, K. (1986) Biochem. J.
35. Dallner, G. (1974) Methods Enzymol. 3 1 , 191-201 36. Dallner, G. (1978) Methods Enzymol. 5 2 , 71-83
37. Lowry, 0. H., Rosebrough, N. J., Farr, A. L., and Randall, R. J.
38. Ragnotti, G. (1971) Bwchem. J. 125, 1057-1058
39. Shin, Y. A. (1962) Anal. Chem. 3 4 , 1164-1166
40. Harper, A. E. (1965) in Methods of Enzymatic Analysis (Berg-
41. Nilsson, 0. S., Arion, W. J., Depierre, J. W., Dallner, G., and
42. Affolter, H., and Siegel, E. (1979) Anal. Biochem. 9 7 , 315-319 43. Tsien, R. Y., and Rink,
T.
J. (1981) J. Neurosci. Methods 4 , 73-86
44. Fletcher, J. M., Greenfield, B. F., Hardy, C. J., Scargill, D., and Woodhead, J. L. (1961) J. Chem. SOC. 1961,2000-2006 45. Batty, I. R., Nahorski, S. R., and Irvine, R. F. (1985) Biochem. J.
46. Heslop, J. P., Irvine, R. F., Tashjian, A. H., and Berridge, M. J.
47. Trimble, E. R., Bruzzone, R., Meehan, C. J., and Biden, T. J.
48. Hansen, C. A., Mah, S., and Williamson, J. R. (1986) J. Biol.
49. Irvine, R. F., Letcher, A. J., Lander, D. J., and Berridge, M. J.
50. Irvine, R. F., and Moore, R. M. (1986) Biochem. J. 240,917-920 51. Taylor, C. W., and Putney, J. W., Jr. (1985) Biochem. J. 2 3 2 ,
52. Ueda,
T.,
Chueh, S.-H., Noel, M. W., and Gill, D. L. (1986) J.53. Jean, T., and Klee, C. B. (1986) J. Biol. Chem. 261,16414-16420 54. Wolf, B. A., Florholmen, J., Colca, J. R., and McDaniel, M. L.
55. Dawson, A. P., Comerford, J. G., and Fulton, D. V. (1986)
56. Seyfred, M. A., Farrell, L. E., and Wells, W. W. (1984) J. Biol.
57. Spat, A. Fabiato, A., and Rubin, R. P. (1986) Biochem.
J.
2 3 3 , 58. Hue, L., and Hers, H.-G. (1974) Biochem. Biophys. Res. Commun.59. Somlyo, A. P., Bond, M., and Somlyo, A.
V.
(1985) Nature 3 1 4 , 60. Poggioli,J.,
Mauger, J.-P., and Claret, M. (1986) Biochem. J.61. Kirk, C. J., Bone, E. A., Palmer,
S.,
and Michell, R. H. (1984) J.62. Charest, R., Blackmore, P. F., Berthon, B., and Exton, J. H.
63. Reinhart, P. H., Taylor, W. M., and Bygrave, F. L. (1982) 64. Charest, R., Hughes, B. P., Exton, J. H., and Blackmore, P. F.
65. Nicchita, C.
V.,
Joseph, S. K., and Williamson, J. R. (1986) FEBS66. Akerboom, T. P. M., Krietsch, W. K. G., Kuntz, G., and Sies, H.
67. Soling, H.-D. (1982) in Metabolic Compartmentation (Sies, H.,
13886
58,540-548 2 3 8 , 185-191
(1951) J. Biol. Chem. 193, 265-275
meyer, H. U., ed) pp. 788-792, Academic Press, Orlando, F1 Ernster, L. (1978) Eur. J. Bwchem. 82,627-634
232,211-215 (1985) J. EXP. Biol. 119,395-401 (1987) Bwchem. J. 2 4 2 , 289-292 Chem. 261,8100-8103 (1986) Biochem. J. 240,301-304 435-438 Bbl. Chem. 261,3184-3192 (1987) Biochem. J. 2 4 2 , 137-141 Biochem. J. 234,311-315 Chem. 269,13204-13208 929-932 58,532-539 622-625 235,663-669 Recept. Res. 4,489-504 (1983) J. Bwl. Chem. 258,8769-8773 Bwchem. J. 208,619-630 (1983) Fed. Proc. 4 2 , 1874 Lett. 209,243-248 (1979) FEBS Lett. 105,90-94