UNIVERSITY OF CATANIA
__________________________________________________
PhD
in
Translational Biomedicine
XXX cycle
GENOME INSTABILITY AND GENE EXPRESSION PROFILE
IN COLORECTAL CANCER
Giacomo Cinnirella
Coordinator of PhD:
Tutor:
1
INDEX
1. ABSTRACT
32. INTRODUCTION
52.1 GENOME INSTABILITY IN CRC AND CLASSIFICATION SYSTEMS
52.1.1 MICROSATELLITE INSTABILITY 5
2.1.2 MISMATCH REPAIR (MMR) SYSTEM 6
2.1.3 LYNCH SYNDROME (LS) 7
2.1.4 CHROMOSOMAL INSTABILITY (CIN) 8
2.1.5 CLASSIC CLASSIFICATION OF CRC 8
2.1.6 CpG ISLAND METHYLATOR PHENOTYPE (CIMP) 9
2.1.7 DNA POLYMERASES AND ULTRAMUTATION 10
2.1.8 TCGA CLASSIFICATION OF CRC (2012) 11
2.1.9 CONSENSUS MOLECULAR SUBTYPES (CMS) OF CRC 12
2.2 INTESTINAL EPITHELIUM: DIFFERENTIATION PATHWAYS AND MUCUS BARRIER
132.2.1 INTESTINAL CRYPTS AND STEM CELLS 13
2.2.2 INTESTINAL MUCUS BARRIER AND MUCINS 15
2.3 CRC PATHOLOGY
173. AIM OF THE WORK
184. MATERIALS AND METHODS
194.1 SAMPLES
194.2 GENOMIC DNA EXTRACTION AND RNA EXTRACTION
214.3 NEXT-GENERATION SEQUENCING (NGS) ON THE ION TORRENT PGM
TMPLATFORM
214.3.1 TARGETED SEQUENCING 21
4.3.2 ANALYSIS OF SEQUENCING DATA 23
2
4.5 WHOLE-TRANSCRIPT EXPRESSION ANALYSIS
245. RESULTS
255.1 PATHOLOGY AND MOLECULAR FEATURES OF THE PATIENTS’ COHORT
255.2 RESULTS FROM SEQUENCING
265.2.1 GERMLINE VARIANTS FROM THE MMR/POLYMERASES PANEL 26
5.2.2 SOMATIC VARIANTS FROM THE MMR/POLYMERASES PANEL 27
5.2.3 SOMATIC MUTATIONS FROM THE CANCER HOTSPOT PANEL 28
5.2.4 DESCRIPTION OF GERMLINE AND SOMATIC SEQUENCE VARIANTS IN MMR/POLYMERASES AND CHS PANEL IN INDIVIDUAL PATIENTS
30
5.2.4.1 TUMORS FROM LYNCH SYNDROME PATIENTS 30
5.2.4.2 NON-LYNCH SYNDROME MSI TUMORS 32
5.2.4.3 MSS TUMORS 34
5.3 GENOME INSTABILITY CLASSIFICATION OF CRC
375.4 GENE EXPRESSION PROFILE
425.4.1 EXPRESSION OF MLH1 IN MSI SAMPLES 42
5.4.2 DIFFERENTIALLY EXPRESSED GENES IN CRC GROUPS COMPARED TO NORMAL TISSUES
43
5.4.3 DIFFERENTIALLY EXPRESSED GENES ACROSS CRC GROUPS 50
5.4.3.1 GENES DIFFERENTIALLY EXPRESSED IN HB COMPARED TO LB AND MSI 53
5.4.3.2 GENES DIFFERENTIALLY EXPRESSED IN LB COMPARED TO HB AND MSI 54
5.4.3.3 GENES DIFFERENTIALLY EXPRESSED IN MSI COMPARED TO HB AND LB 54
5.4.3.4 GENES DIFFERENTIALLY EXPRESSED IN HB AND LB COMPARED TO MSI 57
5.4.3.5 GENES DIFFERENTIALLY EXPRESSED IN HB AND MSI COMPARED TO LB 58
5.4.3.6 GENES DIFFERENTIALLY EXPRESSED IN LB AND MSI COMPARED TO HB 59
5.4.4 HISTOPATHOLOGY AND GENOME-INSTABILITY CLASSIFICATION OF CRC TUMORS 60
6. DISCUSSION
616.1 TARGETED SEQUENCING
616.2 GENE EXPRESSION PROFILE
627. REFERENCES
653
1. ABSTRACT
Four main forms of genomic instability have been described in colorectal cancer (CRC): microsatellite instability (MSI), chromosomal instability (CIN), epigenome abnormalities (CIMP), and hypermutation-ultramutation.
The present thesis was focused on the two better characterized forms of genome instability: MSI and CIN. The aim of the present work was to set up a new classification based on MSI and CIN and to analyze gene expression profiles of the newly defined groups.
Microsatellite testing classifies tumor samples in two fundamental types: microsatellite-instable (MSI) and microsatellite-stable (MSS) tumors. This classification is well-established according to routine methodology and widely accepted guidelines (Boland et al., 1998). In the present thesis a detailed mutational profile analysis was performed for DNA mismatch repair (MMR) genes, the catalytic subunit of proofreading polymerases (POLE and POLD1) and a selected group of 50 among oncogenes and tumor suppressors, for a more accurate molecular description of MSI tumors.
Classification based on chromosomal instability is much less standardized and affected by some technical difficulties. In the present thesis, the recent proposal about the use of somatic broad copy number abnormalities (BCNAs) (Barresi et al., 2017) was adopted in order to identify and sub-classify CRC tumors. According to the proposed methodology and to new criteria established in the present work, MSS tumors were subdivided into high-BCNA (HB) and low-BCNA (LB) tumors. A mutational profile analysis - with the same methodology used for MSI tumors – was also applied to the LB group.
A further step of the present work was to correlate the classification based on microsatellite status and on the number of BCNAs with gene expression profiles from cancer samples.
HB tumors showed upregulation of intestinal epithelial genes, such as NOX1, AREG, EREG.
LB tumors and MSI tumors shared a pattern of upregulation of REG4, AGR2, SPP1, CD55, MUC5B, although expression of such genes was higher for MSI samples. Upregulation of these genes had previously been described for mucinous tumors. Indeed, LB and MSI groups were enriched for mucin-producing tumors.
In conclusion, taking into account the number of BCNAs, along with MSI status and with the mutational profile, two groups of MSS samples can be distinguished: HB tumors, characterized by the expression of a subset of epithelial genes, some of them involved in EGF signaling; and LB tumors, enriched for
mucin-4
producing tumors, which resemble MSI tumors for what concerns upregulation of a subset of genes involved in the colon mucus barrier and other cell-precursor markers.
5
2. INTRODUCTION
By the name of olo e tal a e CRC e efe to a hete oge eous disease, whose complex genetic bases still need further investigation. CRC tumors can show different forms of genome and epigenome instability, which can coexist or predominate over one another. Over the years, many attempts to classify CRC into molecular subtypes have been made, taking into account some or all of the main features of CRC tumors: chromosomal instability (CIN), microsatellite status, CpG island methylator phenotype (CIMP) and single nucleotide mutation rates (hypermutation-ultramutation).
2.1 GENOME INSTABILITY IN CRC AND CLASSIFICATION SYSTEMS
The different forms of genome and epigenome instability in CRC and the main classifications systems will be described in this section.
2.1.1 MICROSATELLITE INSTABILITY
Colorectal tumors, but also other tumor types, can be classified according to their microsatellite status. Microsatellites are repetitive sequences made up of one up to six nucleotides, scattered along the genome, with a number of tandem repetitions ranging from a few units up to several thousands. (Heinimann, 2013). Microsatellites represent approximately 3% of the human genome. Repetitive sequences are challenging templates for DNA polymerases (Kunkel, 2004), and phenomena of strand misalignments can give rise to insertion/deletion loops (IDLs), which can lead to insertions or deletions (Jiricny, 2013). Normally, the so-called mismatch repair (MMR) system ensures surveillance and correction of IDLs as well as base-base mismatches which can escape DNA polymerase proofreading activity. The Bethesda Panel (Boland et al., 1998), made up of 5 microsatellite markers (two mononucleotide repeats - BAT25 and BAT26 - and three dinucleotide repeats - D5S346, D2S123 and D17S250), or larger panels, allow for a classification of CRC based on the number (or percentage) of unstable markers (Vilar and Gruber, 2010): microsatellite instability-high (MSI-H), if instability is present at 2 loci (or >30% of tested loci for larger panels); microsatellite instability-low (MSI-L), if instability is restricted to one locus (or to 10-30% of tested loci for larger panels); microsatellite-stable (MSS), if there are no unstable loci among those tested (or <10% unstable loci for larger panels).
6
2.1.2 MISMATCH REPAIR (MMR) SYSTEM
MMR system, which is devoted to correction of base-base mismatches and IDLs (Figure 1), is made up of the following components: MutSα heterodimer (MSH2-MSH6), MutSβ heterodimer (MSH2–MSH3), MutLα heterodimer (MLH1-PMS2), Exonuclease 1 (EXO1), the single-strand DNA binding protein Replication Protein A (RPA), the sliding clamp Proliferating Cell Nuclear Antigen (PCNA), the clamp loader Replication Factor C (RFC) and DNA Polymerase (Pol ). MutSα recognizes base-base mismatches and IDLs of 1-3 extrahelical nucleotides, whereas MutSβ recognizes IDLs of 2-10 extrahelical nucleotides (Modrich, 2016; Sharma et al., 2014). EXO is a ’- ’ e o u lease hi h e o es a fragment of single stranded DNA containing the mismatch. Because of its directionality, EXO1 needs accessible ’ te i i, hi h a e a aila le o the laggi g st a d ’ e ds of Okazaki f ag e ts , ut (usually) not on the leading strand. Therefore, once the mismatch is detected, MutLα is e uited to create ultiple i ks o the eos thesized DNA st a d o tai i g the is at h oth ’ a d ’ ith respect to the mismatch), thanks to the endonuclease activity of the PMS2 subunit. The strand specificity of MutLα, e su i g i ks to e pla ed o the eos thesized st a d, depe ds o its directional interaction with PCNA. Indeed, PCNA is loaded onto the DNA by RFC at available ’ termini with a unique orientation (Modrich, 2016). DNA ’ te i i a e fou d ot o l o the laggi g st a d ’ e ds of Okazaki f ag e ts ut also o the leadi g st a d ’ te i us of the g o i g neosynthesized strand) (Jiricny, 2013; Peña-Diaz and Jiricny, 2012). RFC can also load PCNA on DNA without any preexisting nick or gap, but the efficiency of this process is low (Peña-Diaz and Jiricny, 2012). EXO1 then removes a DNA fragment of ∼200 nucleotides containing the mismatch from the nicked strand (Modrich, 2016). RPA binds to the single-stranded DNA generated during the excision process and limits the extent of the excision (Genschel and Modrich, 2009). Finally, the gap is filled in by DNA Polymerase a d ligated DNA ligase I (Zhang et al., 2005).
8
rarely – constitutional epimutation) might cause haploinsufficiency and lead to formation of one or a few polyps, whereas a second hit affecting the MMR system (loss of the wild type allele, MLH1 promoter hypermethylation) would be necessary for developing MSI (Lynch et al., 2015; Peltomäki, 2014).
2.1.4 CHROMOSOMAL INSTABILITY (CIN)
CIN refers to the rate at which cells gain or lose whole chromosomes or fractions of chromosomes along cell divisions (Geigl et al., 2008). Thereby, cancer cells show CIN if they are unable to keep their karyotype stable during cell proliferation, acquiring chromosomal abnormalities at a rate higher than normal. Measuring CIN is possible for cell cultures, or for blood tumors, but hardly achievable for solid tumors from surgery or biopsies (Geigl et al., 2008). Despite the term CIN being extensively used in the literature, what is often measured is not the rate of chromosomal changes but rather the amount of segmental aneuploidies. Thus, in recent papers, the measurement of copy number aberrations (CNAs) is being used for CRC molecular classification purposes instead of CIN. Since CIN leads to karyotype abnormalities, CNAs might be used as a surrogate – although imprecise – marker of CIN. A convenient approach when studying tumor CNAs could be focusing on broad copy number abnormalities (BCNAs), affecting a large percentage of a chromosomal arm or whole chromosomes (Barresi et al., 2017; Beroukhim et al., 2007). Identification of BCNAs is a more reliable approach compared to the study of smaller size CNAs – which can be termed focal copy number abnormalities (FCNAs) – the latter suffering from segmentation artefacts due to tumor heterogeneity and admixture of tumor and normal cells (Barresi et al., 2017).
2.1.5 CLASSIC CLASSIFICATION OF CRC
A simple classification of CRC takes into account the classic forms of genomic instability mentioned above (Figure 2):
• Tumors with chromosome instability (∼85% of all CRCs): most of these tumors are of sporadic origin, and arise from the conventional adenoma-carcinoma sequence (Vogelstein et al., 1988). A small subset of CIN tumors (1% of all CRCs) arises in the context of the familiar adenomatous polyposis (FAP) syndrome, a cancer predisposition syndrome due to germline mutation in the
APC gene (Groden et al., 1991; Kinzler and Vogelstein, 1996).
• Tumors with microsatellite instability (∼15% of all CRCs): this class includes both Lynch syndrome tumors (2-4% of all CRCs), arising in the context of a cancer predisposition syndrome
11
al., 2011) have been found in a wide spectrum of tumors, encompassing CRC, brain tumors, cutaneous melanoma, breast cancer, pancreatic cancer, ovarian cancer, tumors of the small intestine. These mutations are peculiar in that they cause very high rates of single nucleotide mutations (> 100 per 106) (Shinbrot et al 2014), such phenomenon being termed ult a utation in order to be distinguished from h pe utatio si gle u leotide utatio ate et ee a d pe 106), the latter being typical of MSI samples. Germline exonuclease domain variants can be responsible for the so-called pol e ase proofreading-asso iated pol posis PPAP , defined as a dominant inherited susceptibility to multiple or large (>2 cm in diameter) colorectal adenomas and multiple or early-onset (usually <50 years of age) colorectal carcinomas (Briggs and Tomlinson, 2013; Palles et al., 2013). CRCs carrying POLE exonuclease domain mutations are usually MSS, although sometimes they might show microsatellite instability (Cancer Genome Atlas Network et al., 2012; Elsayed et al., 2015; Kim et al., 2013).
2.1.8 TCGA CLASSIFICATION OF CRC (2012)
In 2012, the Cancer Genome Atlas Network (TCGA) classified CRCs as follows:
• non-hypermutated CRCs (∼84%), which were MSS and showed many somatic copy-number alterations (SCNAs), as well as mutations in well-known tumor suppressor genes (APC, TP53,
SMAD4) and oncogenes (KRAS, PIK3CA) of the classic adenoma-carcinoma sequence (Vogelstein
et al., 1988), along with mutations in FBXW7, NRAS and other genes.
• hypermutated cancers (∼16%), here defined as having single nucleotide mutation rates >12 per 106. The majority of hypermutated cancers (∼13% of the total cohort of this study) were MSI (most of them with MLH1 methylation and CIMP) due to defective mismatch repair. The remaining hypermutated samples (∼3% of the total cohort) were MSS, CIMP-negative and lacked MLH1 methylation but generally had somatic mutations in one or more of the MMR genes and harbored mutations in POLE exonuclease domain. POLE-mutated tumors showed the highest point mutation rates of the whole study cohort.
As previously shown by others (Flohr et al., 1999; Jansen et al., 2016; Yoshida et al., 2011) and confirmed by TCGA data, mutations in MMR genes and POLE/POLD1 genes tend to coexist in CRCs with high mutational rates.
12
2.1.9 CONSENSUS MOLECULAR SUBTYPES (CMS) OF CRC
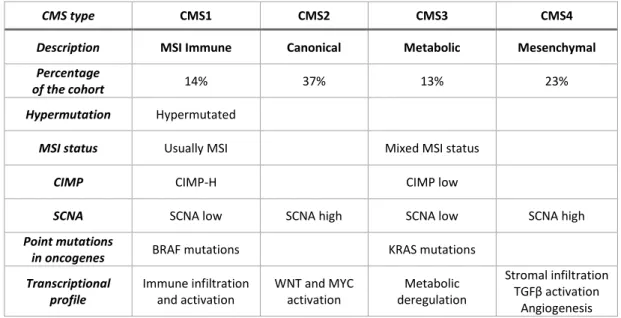
In 2015, the Consensus Molecular Subtype (CMS) Consortium (Dienstmann et al., 2017; Guinney et al., 2015) described four CMS groups of CRC based on transcriptomic data from six studies (Table 1).
Table 1: Consensus molecular subtypes. Redrawn and modified from Guinney et al. (2015), figure 5.
CMS type CMS1 CMS2 CMS3 CMS4
Description MSI Immune Canonical Metabolic Mesenchymal
Percentage
of the cohort 14% 37% 13% 23%
Hypermutation Hypermutated
MSI status Usually MSI Mixed MSI status
CIMP CIMP-H CIMP low
SCNA SCNA low SCNA high SCNA low SCNA high
Point mutations
in oncogenes BRAF mutations KRAS mutations
Transcriptional profile Immune infiltration and activation WNT and MYC activation Metabolic deregulation Stromal infiltration TGFβ a ti atio Angiogenesis
Of such groups, the CMS1 MSI-Immune subtype (14% of the total cohort) encompassed hypermutated, CIMP-H, usually MSI (76% of the CMS1 tumors) samples, with frequent BRAFV600E mutations (known to associate with MSI tumors and low prevalence of somatic copy number alterations (SCNAs). In line with deficient mismatch repair system, DNA repair proteins were overexpressed. Also, transcriptional immune activation and diffuse tumor immune infiltration were observed. On the other hand, CMS2, CMS3 and CMS4 subtypes showed higher numbers of SCNAs (the authors used SCNAs as a measure of CIN) with the CMS2 Canonical subtype (accounting 37% of the total cohort) harboring the highest frequency of SCNAs in oncogenes and tumor suppressor genes. CMS2 CRCs showed epithelial differentiation and marked activation of WNT and MYC downstream targets, along with upregulation of
EGFR, HER2, IGF2, IRS2 and amplification of the transcription factor HNF4A. CMS3 Metabolic subtype
(13% of the total cohort) showed consistently lower number of SCNAs in comparison to the other CIN tumors. Moreover, 28% of CMS3 samples were hypermutated, 16% were MSI (with MSI samples falling among hypermutated tumors) and there was a high prevalence of the CIMP-L cluster (intermediate levels of gene hypermethylation). CMS3 tumors were also enriched for KRAS mutations and for several metabolic signatures (such as glutaminolysis and lipidogenesis), consistent with KRAS activation
13
remodeling of cell metabolism (Brunelli et al., 2014; Ying et al., 2012). CMS4 Mesenchymal subtype (23% of the total cohort) showed activation of genes involved in epithelial mesenchymal transition (EMT), t a sfo i g g o th fa to β TGF β sig ali g, e t a ellula at i e odeli g, o ple e t inflammatory signaling, angiogenesis, and cancer stem cells signature. CMS4 Mesenchymal tumors transcriptional profile is thought to be strongly influenced by the remarkable stromal (mainly fibroblast) infiltration. Indeed, CMS4 samples showed reduced tumor purity compared to the other subtypes, that is higher admixture with non-cancer cells. Finally, samples with mixed features (13% of the total cohort) were observed: they might be due to intra-tumoral heterogeneity (potential mixtures of different CMS subtypes) or represent transition phenotypes among CMS subtypes.
2.2 INTESTINAL EPITHELIUM: DIFFERENTIATION PATHWAYS AND
MUCUS BARRIER
In order to understand abnormalities in differentiation of CRC cells, it is necessary to provide up-to-date information on normal cell differentiation pathways in human colon and some insights into colon mucus barrier composition and functions.
2.2.1 INTESTINAL CRYPTS AND STEM CELLS
The inner layer of the small intestine presents with projections into the intestinal lumen known as villi, which extend the mucosal surface for optimizing the uptake of nutrients. Around each villus, there are invaginations known as crypts of Lieberkühn. New intestinal cells, which are needed to replace exfoliated ones, are formed at the crypt base and then climb up along the side of the crypt-villus axis, to substitute exfoliated cells. As reviewed by Clevers (2013), both villi and crypts of Lieberkühn contain absorptive enterocytes along with goblet cells secreting mucus, enteroendocrine cells secreting hormones, and tuft cells, which may act as sensors of luminal content. At the crypt base, two cell types are found: crypt base columnar (CBC) stem cells - which express the Leucine Rich Repeat Containing G Protein-Coupled Receptor 5 (LGR5) - and Paneth cells. LGR5+ CBC stem cells can give rise to rapidly proliferating transit-amplifying (TA) cells, which in turn differentiate into enterocytes, goblet cells, enteroendocrine cells, tuft cells (Barker, 2014). CD24+ Paneth cells not only secrete lysozyme and defensins, which help defending against bacteria, but are also essential to the intestinal stem cell niche, providing the LGR5+ CBS stem cells with Wnt Family Member 3 (WNT3), epidermal growth factor (EGF), Transforming Growth Factor, Alpha TGFα (Sasaki et al., 2016; Sato et al., 2011). LGR5+ CBC stem cells
15
2.2.2 INTESTINAL MUCUS BARRIER AND MUCINS
As reviewed by Birchenough et al. (2015), gastrointestinal epithelium is covered with mucus, which avoids direct contact between the luminal content, including bacteria, and the epithelial lining. A loosely attached single mucus layer is found in the small intestine, with large pores being penetrable to bacteria, but protection is provided by antimicrobial peptides l soz e, α-defensins) secreted by Paneth cells. In contrast, mucus in the colon is organized in two layers, an inner one tightly attached to the epithelium and impenetrable to bacteria, and an outer one hosting commensal bacteria, which have glycan-degrading enzymes and can use mucin glycans as a source of energy (Johansson et al., 2011). The main component of intestinal mucus are mucins, which are glycoproteins, with O-glycans accounting for more than 50% of their total mass (Johansson and Hansson, 2016). Mucins can be distinguished into transmembrane mucins and gel-forming mucins (secreted mucins).
Some transmembrane mucins are constitutively expressed (MUC3, MUC4, MUC12, MUC13, MUC17, MUC20) whereas others (MUC1 and MUC16) are inducible in infection or cancer (Johansson and Hansson, 2016). Transmembrane mucins on the apical membrane of enterocytes contribute - with their oligosaccharide side chains - to the ∼10 nm-thick hydrophylic glycocalyx, also encompassing glycolipids of the cell membrane (Kufe, 2009). Members of the carcinoembryonic antigen cell adhesion molecules (CEACAM) family, such as the carcinoembryonic antigen CEA, CEACAM1, CEACAM6, CEACAM7, also contribute to the glycocalyx (Frängsmyr et al., 1999; Ou et al., 2009). The glycocalyx, together with the tight junctions among neighboring epithelial cells, behave as a diffusion barrier (Pelaseyed et al., 2014). The major glycocalyx transmembrane mucins are MUC3, MUC12, and MUC17 (Pelaseyed et al., 2014). MUC17 is preferentially expressed in the small intestine, although it is also present in the transverse colon (Johansson and Hansson, 2016).
The major gel-forming mucin in the intestine is MUC2, whose monomers multimerize to form a net-like structure (Nilsson et al., 2014). Other gel-forming mucins are MUC5AC and MUC6 (preferentially secreted by gastric surface epithelium and gastric glands, respectively) (Nordman et al., 2002), as well as MUC5B, which is expressed by a subset of colonic goblet cells at the crypt base (colocalizing with MUC2-containing goblet cells), but its expression decreases (until disappearing) when moving towards the upper part of the crypt (van Klinken et al., 1998; Larsson et al., 2011). Genes encoding the secreted mucins MUC2, MUC5AC, MUC5B and MUC6 are found in cluster on chromosome 11 (Kufe, 2009).
16
It has been demonstrated by Schutte et al. (2014) in the small intestine of mice that detachment of mucus from the epithelium requires cleavage of MUC2 N-terminus by ep i β, a membrane-bound zinc-dependent metalloendopeptidase which is released from the enterocyte apical membrane after microbial challenge and detaches MUC2 from its goblet cell anchor. The same authors showed that MUC2 release also requires its unfolding, in order to uncover ep i β cleavage sites. Once MUC2 is secreted by goblet cells, it undergoes expansion and organizes in stratified sheets (Ambort et al., 2012); both MUC2 unfolding and expansion require a pH increase and a Ca2+ decrease, which - in the small intestine - is accomplished through bicarbonate secretion by the Cystic Fibrosis Transmembrane Conductance Regulator (CFTR), expressed on the apical membrane of adjacent enterocytes, allowing for the exit of Cl- and HCO
3- (Ambort et al., 2012; Frizzell and Hanrahan, 2012; Gustafsson et al., 2012; Schutte et al., 2014). CFTR expression in colon is lower than that in small intestine, urging further studies to better elucidate colonic mechanisms of mucus secretion (Crawford et al., 1991; Gustafsson et al., 2012; Strong et al., 1994). SLC26A3 is an electroneutral Cl-/HCO
3- exchanger mainly expressed in colon, especially in differentiated surface colonic epithelial cells (Höglund et al., 1996; Melvin et al., 1999), and is considered to be a marker of mature enterocytes (Dalerba et al., 2011). Coupled activity of SLC26A3 and the Na+/H+ exchanger SLC9A3 (NHE3) on apical membranes of epithelial cells results in electroneutral NaCl absorption (Alper et al., 2011) and apical HCO3- secretion (Jacob et al., 2002). SCL26A3 shows an activating interaction with CFTR, increasing CFTR channel overall open probability (Ko et al., 2004).
Goblet cells are the main cell type responsible for mucus production, and secrete not only MUC2 but also other proteins such as AGR2, FCGBP, TFF3, CLCA1, ZG16 (Faderl et al., 2015; Pelaseyed et al., 2014). Anterior gradient protein 2 homologue (AGR2) is a disulfide isomerase located in the endoplasmic reticulum (ER), where it helps protein folding by formation of disulfide bonds (Park et al., 2009). AGR2 is essential for MUC2 production by goblet cells, as well as for the biosynthesis of MUC5AC and MUC5B (Schroeder et al., 2012). AGR2 can also be secreted into the gastrointestinal mucus (Bergstrom et al., 2014). FCGBP (Fc globulin-binding protein), after an autocatalyzed cleavage reaction forming a reactive C-terminal end, can covalently attach to MUC2 and might be involved in mucus cross-linking (Johansson et al., 2009, 2011). Moreover, FCGBP covalently binds to Trefoil Factor 3 (TFF3) (Albert et al., 2010). Intestinal mucus also contains proteins secreted by Paneth cells: lysozyme, α-defensins, Deleted In Malignant Brain Tumors 1 (DMBT1), as well as MUC2 (Pelaseyed et al., 2014). DMBT1 is a secreted glycoprotein belonging to the superfamily of scavenger receptor cysteine-rich (SRCR) proteins
17
(Mollenhauer et al., 1997). It is involved in mucosal immunity, since it can bind to secretory IgA (Ligtenberg et al., 2004) and act as a putative receptor for pathogens opsonized by the collectins SP-D and SP-A (Mollenhauer et al., 2000). It might also bind directly to bacteria regardless of opsonization (Mollenhauer et al., 2007). DMBT1 is expressed by epithelial cells of the crypt base and of the midcrypts throughout normal small intestine and colon (Renner et al., 2007), and has been implicated in epithelial differentiation (Kang and Reid, 2003). Interaction between DMBT1 and dimeric TFF3 has been described (Madsen et al., 2013), and both proteins might associate with gel-forming mucins to form a net which concentrates protective factors (Madsen et al., 2013). DMBT1 expression is up-regulated during inflammatory bowel diseases (Madsen et al., 2013; Renner et al., 2007).
Trefoil factors are peptides secreted by mucus-producing cells throughout the gastrointestinal tract: TFF1 and TFF2 are expressed in the stomach and in duodenal glands, whereas TFF3 is expressed by goblet cells of the small intestine and colon (Aihara et al., 2017; Playford, 1997). Trefoil factors are able to dimerize and exert some of their functions in the dimeric form (Muskett et al., 2003). As reviewed by Aihara et al. (2017), TFF peptides show protective effects on gastrointestinal mucosa: they contribute to mucus stabilization and stimulate cell migration to cover areas of damaged mucosa.
2.3 CRC PATHOLOGY
The great majority of CRCs (>90%) are adenocarcinomas, originating from epithelial cells of the intestinal mucosa. Histological tumor grading is given according to the entity of gland formation, which decreases from well-differentiated to poorly differentiated tumors (Fleming et al., 2012). About 10% of CRCs are instead mucinous adenocarcinomas, while ∼1% are signet ring cell adenocarcinomas (Nitsche et al., 2013). Mucinous adenocarcinomas are characterized by large glandular structures and extracellular mucin accounting for >50% of tumor volume (for lower percentages of extracellular mucin – as long as >10% - the te ade o a i o a ith mucinous differentiation o with u i ous featu es is used), whereas signet-ring cells adenocarcinomas show intracytoplasmic mucin pushing the nucleus to the cell periphery (Fleming et al., 2012). Sometimes, intracellular mucin can be present in mucinous adenocarcinomas as well, resulting in a signet-ring cell morphology; on the other hand, signet-ring adenocarcinomas can also produce some extracellular mucin (Sung et al., 2008). Prognosis is better for mucinous adenocarcinomas than for signet-ring cell adenocarcinomas (Sung et al., 2008). Among mucinous CRC tumors, those showing MSI have better prognosis than MSS ones (Nitsche et al., 2013).
18
3. AIM OF THE WORK
The present thesis was focused on the two better characterized forms of genome instability: MSI and CIN. The aim of the present work was to set up a new classification based on MSI and CIN and to analyze gene expression profile of the newly defined groups.
A first step of this thesis was to define criteria for classifying a cohort of CRC patients according to genome instability.
MSI classifies tumor samples in two fundamental types: instable (MSI) and microsatellite-stable (MSS) tumors. This classification is well-established according to routine methodology and widely accepted guidelines (Boland et al., 1998). Moreover, in the present thesis a detailed mutational profile analysis was performed for DNA mismatch repair (MMR) genes, the catalytic subunit of proofreading polymerases (POLE and POLD1) and a selected group of 50 among oncogenes and tumor suppressors, for a more accurate molecular description of MSI tumors.
On the contrary, classification based on chromosomal instability is much less standardized and affected by some technical difficulties. In the present thesis, the recent proposal about the use of somatic broad copy number abnormalities (BCNAs) (Barresi et al., 2017) was adopted in order to identify and sub-classify CRC tumors.
A second step of the present work was to correlate the classification based on microsatellite status and on the number of BCNAs with gene expression profiles from cancer samples.
19
4. MATERIALS AND METHODS
4.1 SAMPLES
The 48 samples analyzed in this thesis belonged to a cohort of 35 patients who underwent surgery for ese tio of p i a i asi e CRC at Ce t o Cli i o Diag osti o “. .l. G.B. Mo gag i i Cata ia Italy). All patients gave informed consent for this study, which was approved by the Ethics Committee of ASL3 of Catania (Italy). All specimens were frozen and stored at -80°C until DNA extraction. Samples had been previously tested for microsatellite instability with five markers belonging to the Bethesda panel (D2S123, D5S346, D17S250, BAT25 and BAT26) and one additional marker (BAT40)(Barresi et al., 2017). The sample cohort consisted of 7 MSI and 41 MSS tumor samples. If two biopsies were taken from the same tumor mass (at a distance of at least 1 cm from each other), the two samples were termed T1 and T2 (double-sampling pair). If a synchronous tumor was present and biopsied, this sample was termed T3. A biopsy of adjacent phenotypically normal colonic tissue (at a distance of 3-6 cm from the tumor) was taken for 31 patients (tumor/normal pairs). Copy number analysis by Affymetrix SNP 6.0 arrays was performed for all the tumor samples, and for their normal pair if available. Whole-Transcript Expression analysis was performed for 45 of the 48 CRC samples, and 25 normal tissue samples were also included. Targeted NGS sequencing was performed for 15 samples from 14 patients, including all the 7 MSI samples and 8 MSS samples. Details on the sample cohort can be found in Table 2.
20 Table 2: CRC sample cohort and normal controls.
Tumor samples Normal colonic tissue
S am pl e na m e M icr os at e ll it e s tat us H TA M M R /P ol y m e rase s P ane l S e qu e nci ng C H S P ane l S e qu e nci ng S am pl e na m e M M R /P ol y m e rase s and C H S P an e l S e qu e nci ng HT A
PAA1_T1 MSS Yes - - PAA1_N - Yes
PAA3_T2 MSI - Yes Yes PAA3_N Yes -
P3_T1 MSI - Yes Yes P3_N Yes -
P11_T1 MSS Yes - - - - -
P13_T1 MSI Yes Yes Yes P13_N Yes Yes
P15_T1 MSS Yes - - - - -
P17_T1 MSS Yes - - - - -
P19_T1 MSS Yes Yes Yes P19_N Yes Yes
P23_T1 MSS Yes - - - - -
P29_T1 MSI Yes Yes Yes P29_N Yes -
P31_T1 MSS Yes - - P31_N - Yes
P37_T1 MSS Yes - -
P37_N - Yes
P37_T2 MSS Yes - -
P37_T3 MSS Yes - -
P41_T1 MSI Yes Yes Yes P41_N Yes -
P43_T1 MSS Yes - - P43_N - Yes
P47_T1 MSS Yes Yes Yes P47_N Yes Yes
P49_T1 MSS Yes - - P49_N - Yes
P59_T2 MSI Yes Yes Yes P59_N Yes Yes
P63_T1 MSS Yes - - P63_N - Yes
P65_T1 MSS Yes Yes Yes
P65_N Yes Yes P65_T2 MSS Yes - - P67_T1 MSS Yes - - P67_N - Yes P67_T2 MSS Yes - - P69_T1 MSS Yes - - P69_N - Yes P69_T2 MSS Yes - - P71_T1 MSS Yes - - P71_N - Yes P71_T2 MSS Yes - -
P73_T1 MSS Yes Yes Yes P73_N Yes Yes
P75_T1 MSI Yes Yes Yes P75_N Yes Yes
P77_T1 MSS Yes - - P77_N - Yes P77_T2 MSS Yes - - P79_T1 MSS Yes - - P79_N - Yes P79_T2 MSS Yes - -
21
P83_T1 MSS Yes - -
P83_N - Yes
P83_T2 MSS Yes - -
P85_T1 MSS Yes Yes Yes
P85_N Yes -
P85_T2 MSS Yes Yes Yes
P87_T1 MSS Yes - - P87_N - Yes P89_T2 MSS Yes - - P89_N - Yes P91_T1 MSS Yes - - P91_N - Yes P93_T1 MSS Yes - - P93_N - Yes P93_T2 MSS Yes - - P95_T1 MSS Yes - - P95_N - Yes P95_T2 MSS Yes - - P97_T1 MSS Yes - - P97_N Yes Yes
P97_T2 MSS Yes Yes Yes
PCC3_T1 MSS - Yes Yes PCC3_N Yes -
4.2 GENOMIC DNA EXTRACTION AND RNA EXTRACTION
Genomic DNA was extracted from specimens by using the QIAamp DNA Mini Kit (QIAGEN, Venlo, Netherlands). Total RNA was extracted from specimens by using the RNeasy Mini (QIAGEN, Venlo, Netherlands). Extracted DNA and RNA were quantified on a NanoDrop ND-1000 spectrophotometer (Thermo Scientific, Waltham, MA, USA).
4.3 NEXT-GENERATION SEQUENCING (NGS) ON THE ION TORRENT
PGM
TMPLATFORM
4.3.1 TARGETED SEQUENCING
We used two panels of primer pairs for NGS targeted sequencing. The first panel, called MMR/Polymerases Panel, was custom-designed by using the Io A pli“e ™ Desig e tool, and targeted the coding regions and the exon-intron boundaries (up to 50 bases from each exon en) of MMR genes and POLE/POLD1 (Table 3, Table 4). Further details on this custom panels designed by our laboratory are reported in Supplementary Table 1.
22 Table 3: Features of the MMR/Polymerases panel.
Primer pairs Number of pools
Average amplicon length
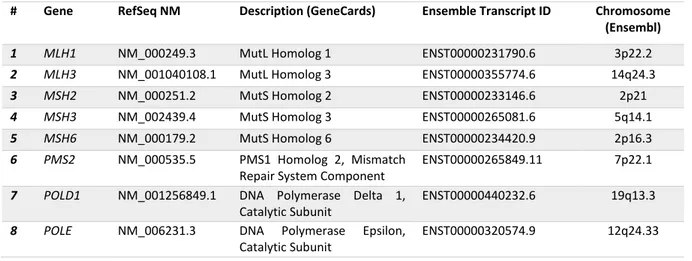
Panel Size Input DNA 525 pairs 2 pools 157 bp 42870 bp 20 ng (10 ng DNA x 2 pools) Table 4: Genes targeted by the MMR/Polymerases Panel.
# Gene RefSeq NM Description (GeneCards) Ensemble Transcript ID Chromosome (Ensembl)
1 MLH1 NM_000249.3 MutL Homolog 1 ENST00000231790.6 3p22.2 2 MLH3 NM_001040108.1 MutL Homolog 3 ENST00000355774.6 14q24.3 3 MSH2 NM_000251.2 MutS Homolog 2 ENST00000233146.6 2p21 4 MSH3 NM_002439.4 MutS Homolog 3 ENST00000265081.6 5q14.1 5 MSH6 NM_000179.2 MutS Homolog 6 ENST00000234420.9 2p16.3 6 PMS2 NM_000535.5 PMS1 Homolog 2, Mismatch
Repair System Component
ENST00000265849.11 7p22.1
7 POLD1 NM_001256849.1 DNA Polymerase Delta 1, Catalytic Subunit
ENST00000440232.6 19q13.3
8 POLE NM_006231.3 DNA Polymerase Epsilon, Catalytic Subunit
ENST00000320574.9 12q24.33
Hotspot sites covering approximately 2,800 COSMIC mutations in 50 well-known tumor oncogenes and tumor suppressor genes were sequenced by using the commercially available Io A pli“e ™ Cancer Hotspot Panel v2. From here onwards, this panel will be referred to as the CHS Panel. Details on the CHS Panel genes can be found in Table 5 and Supplementary Table 2.
Table 5: Featu es of the Io A pliSe ™ Ca e Hotspot Pa el v2.
Primer pairs Number of pools Average amplicon length
Panel Size Input DNA 207 pairs 1 pool 154 bp 31727 bp 10 ng
The whole coding region of MLH1 was targeted by the MMR/Polymerases Panel, while only MLH1 COSM26085 (c.1151T>A, p.Val384Asp) hotspot was targeted by the CHS panel.
Ba oded li a ies e e p epa ed a o di g to the Io A pli“e ™ DNA a d RNA Li a P epa atio User Guide (Pub. No. MAN0006735) instructions. The Io A pli“e ™ Li a Kit . Cat. No.
as used. Li a ies e e ua tified usi g Qu it™ Fluo o ete Te oFishe “ ie tifi , Waltha , MA, USA) and diluted to obtain a concentration of ∼100 pM per primer pool. At this point, the two pools of the MMR/Polymerases were mixed with one another and then processed in a single tube (this step was unnecessary for the CHS Panel, which was made up of a single pool). An emulsion PCR was performed on the Ion PGMTM OneTouch 2 instrument in order to obtain a clonal amplification of amplicons on
non-23
ag eti eads alled Io PGM™ Te plate OT Io “phe e™ Pa ti les I“Ps . Enrichment of the template-positive ISPs was performed on the Io O eTou h™ E“ instrument in order to eliminate empty beads. Non-optical DNA sequencing was performed on the Ion PGMTM system using Io ™ Chips (1,3 million wells chips) or Io ™ Chips (6.3 million wells).
4.3.2 ANALYSIS OF SEQUENCING DATA
Variant prioritization was performed applying two filters:1. Sequencing quality filter: co e age eads; mutated allele o e age eads; pe e tage of uta t allele eads % (or compatible with homozygous or heterozygous state for germline variants); individual evaluation of variants in homopolymer tracts.
2. Functional filter: location in coding sequences or splice sites (within ±2 nucleotides from exon-intron boundaries); non-synonymous variants; highest population allele frequency <0.01.
All filtered variants in the sequenced targets (MMR genes, POLE and POLD1 genes, CHS genes), whether missense, nonsense, frameshift or splice site variants, were searched for functional information in the following databases:
• COSMIC database at http://cancer.sanger.ac.uk/cosmic (Forbes et al., 2017). COSMIC variants are reported in the database with a prediction of their functional consequence by the Functional Analysis through Hidden Markov Models (FATHMM) algorithm. Such prediction has been considered when analyzing data of the present work.
• ClinVar database at https://www.ncbi.nlm.nih.gov/clinvar/ (Landrum et al., 2016)
Moreover, filtered variants in MMR genes were searched for their clinical significance in the database of the International Society for Gastrointestinal Hereditary Tumours (InSiGHT), Variant Interpretation Committee (VIC), at www.insight-database.org/classifications (Thompson et al., 2013).
4.4 GENOME-WIDE DNA COPY NUMBER AND SNP GENOTYPING
ANALYSIS
High-resolution genome-wide DNA copy number and SNP genotyping analysis was performed on Affymetrix SNP 6.0 array using 500 ng of DNA according to manufacturer’s i st u tio s (Affymetrix, Inc.,
24
Santa Clara, CA, USA). Array scanning and data analysis were performed by using the Affymetrix® Ge eChip Co a d Co sole AGCC a d the Ge ot pi g Co sole™ GTC e sio . . soft a e (Barresi et al., 2017). Broad copy number abnormalities (BCNAs), defined as gains or losses involving more than 25% of a chromosomal arm or numerical aberrations of whole chromosomes, were identified by using the BroCyA bioinformatics tool (Barresi et al., 2017). Along with copy number (gains and losses), SNP arrays also detected broad copy-neutral loss-of-heterozygosity (CN-LOH) regions, that is genomic segments >3Mb with unvaried copy number but lacking heterozygosity for the assayed polymorphic markers.
4.5 WHOLE-TRANSCRIPT EXPRESSION ANALYSIS
Whole-Transcript Expression Analysis was performed from 100 ng of total RNA by amplification and target hybridization to the Gene-Chip Human Transcriptome Array 2.0, following the Manufactu e ’s instructions (Cat. No. 902310, Cat. No. 900720; Affymetrix, Inc., Santa Clara, CA, USA). Array scanning and data analysis had been performed by using Affymetrix® Expression ConsoleTM software version 1.4 (Affymetrix, Inc., Santa Clara, CA, USA) and the Affymetrix® Transcriptome Analysis Console (TAC) Software (Affymetrix, Inc., Santa Clara, CA, USA).
Analysis of genes with no gene symbol assigned by Affymetrix, genes described by Affymetrix as u ha a te ized LOC , genes encoding small nucleolar RNAs (snoRNAs), small Cajal body-specific RNAs (scaRNAs), snRNAs (small nuclear RNAs), RNA 5S ribosomal genes and pseudogenes, and histone cluster genes was out of the purposes of the present thesis, as well as the analysis of transcripts on chr1_gl000191_random, chr4_ctg9_hap1, chr4_gl000193_random, chr6_apd_hap1, chr6_cox_hap2,
chr6_dbb_hap3, chr6_mann_hap4, chr6_mcf_hap5, chr6_qbl_hap6, chr6_ssto_hap7,
chr7_gl000195_random, chr17_ctg5_hap1, chr17_gl000204_random, chr19_gl000209_random, chrUn_gl000211, chrUn_gl000212, chrUn_gl000218, chrUn_gl000219, chrUn_gl000220, chrUn_gl000222, chrUn_gl000223, chrUn_gl000228. Thereby, such entries were ruled out from the analysis.
25
5. RESULTS
5.1 PATHOLOGY AND MOLECULAR FEATURES OF THE
PATIENTS’
COHORT
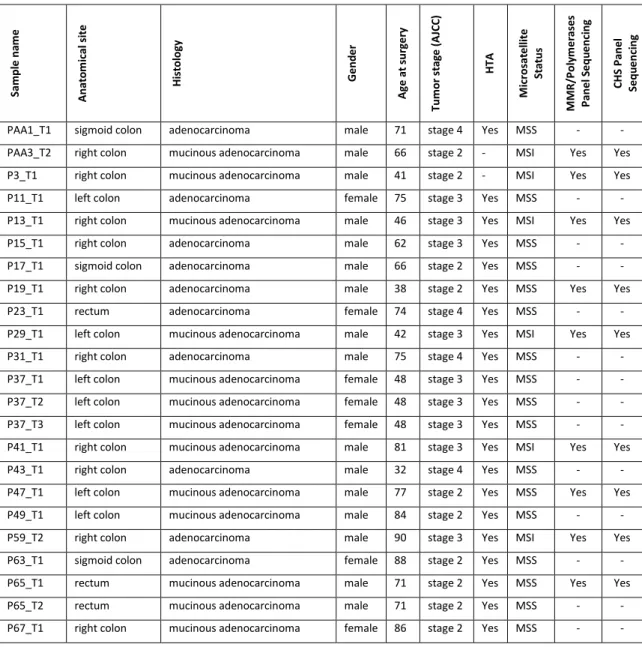
Pathology features, microsatellite status and information on HTA and targeted sequencing for each sa ple of the patie t’s oho t a e fou d i Table 6.
Table 6: Pathology, microsatellite instability status and information on HTA and Targeted Sequencing Availability. AJCC, American Joint Committee on Cancer.
S am pl e na m e A nat o m ical si te H is tol ogy G e nd e r A g e a t sur g e ry Tum or st ag e (A JC C ) H TA M icr os at e ll it e S tat us M M R /P ol y m e rase s P ane l S e qu e nci ng C H S P ane l S e qu e nci ng
PAA1_T1 sigmoid colon adenocarcinoma male 71 stage 4 Yes MSS - -
PAA3_T2 right colon mucinous adenocarcinoma male 66 stage 2 - MSI Yes Yes
P3_T1 right colon mucinous adenocarcinoma male 41 stage 2 - MSI Yes Yes
P11_T1 left colon adenocarcinoma female 75 stage 3 Yes MSS - -
P13_T1 right colon mucinous adenocarcinoma male 46 stage 3 Yes MSI Yes Yes
P15_T1 right colon adenocarcinoma male 62 stage 3 Yes MSS - -
P17_T1 sigmoid colon adenocarcinoma male 66 stage 2 Yes MSS - -
P19_T1 right colon adenocarcinoma male 38 stage 2 Yes MSS Yes Yes
P23_T1 rectum adenocarcinoma female 74 stage 4 Yes MSS - -
P29_T1 left colon mucinous adenocarcinoma male 42 stage 3 Yes MSI Yes Yes
P31_T1 right colon adenocarcinoma male 75 stage 4 Yes MSS - -
P37_T1 left colon mucinous adenocarcinoma female 48 stage 3 Yes MSS - -
P37_T2 left colon mucinous adenocarcinoma female 48 stage 3 Yes MSS - -
P37_T3 left colon mucinous adenocarcinoma female 48 stage 3 Yes MSS - -
P41_T1 right colon mucinous adenocarcinoma male 81 stage 3 Yes MSI Yes Yes
P43_T1 right colon adenocarcinoma male 32 stage 4 Yes MSS - -
P47_T1 left colon mucinous adenocarcinoma male 77 stage 2 Yes MSS Yes Yes
P49_T1 left colon mucinous adenocarcinoma male 84 stage 2 Yes MSS - -
P59_T2 right colon adenocarcinoma male 90 stage 3 Yes MSI Yes Yes
P63_T1 sigmoid colon adenocarcinoma female 88 stage 2 Yes MSS - -
P65_T1 rectum mucinous adenocarcinoma male 71 stage 2 Yes MSS Yes Yes
P65_T2 rectum mucinous adenocarcinoma male 71 stage 2 Yes MSS - -
26
P67_T2 right colon mucinous adenocarcinoma female 86 stage 2 Yes MSS - -
P69_T1 left colon adenocarcinoma female 50 stage 2 Yes MSS - -
P69_T2 left colon adenocarcinoma female 50 stage 2 Yes MSS - -
P71_T1 right colon adenocarcinoma male 71 stage 2 Yes MSS - -
P71_T2 right colon adenocarcinoma male 71 stage 2 Yes MSS - -
P73_T1 right colon signet-ring cell adenocarcinoma male 69 stage 3 Yes MSS Yes Yes
P75_T1 right colon adenocarcinoma female 68 stage 2 Yes MSI Yes Yes
P77_T1 right colon mucinous adenocarcinoma male 79 stage 3 Yes MSS - -
P77_T2 right colon mucinous adenocarcinoma male 79 stage 3 Yes MSS - -
P79_T1 right colon adenocarcinoma female 84 stage 3 Yes MSS - -
P79_T2 right colon adenocarcinoma female 84 stage 3 Yes MSS - -
P83_T1 right colon mucinous adenocarcinoma female 76 stage 3 Yes MSS - -
P83_T2 right colon mucinous adenocarcinoma female 76 stage 3 Yes MSS - -
P85_T1 right colon mucinous adenocarcinoma female 81 stage 3 Yes MSS Yes Yes
P85_T2 right colon mucinous adenocarcinoma female 81 stage 3 Yes MSS Yes Yes
P87_T1 rectum mucinous adenocarcinoma female 79 stage 2 Yes MSS - -
P89_T2 right colon adenocarcinoma female 69 stage 2 Yes MSS - -
P91_T1 right colon signet-ring cell adenocarcinoma male 73 stage 3 Yes MSS - -
P93_T1 rectum adenocarcinoma female 50 stage 3 Yes MSS - -
P93_T2 rectum adenocarcinoma female 50 stage 3 Yes MSS - -
P95_T1 sigmoid colon adenocarcinoma male 73 stage 3 Yes MSS - -
P95_T2 sigmoid colon adenocarcinoma male 73 stage 3 Yes MSS - -
P97_T1 sigmoid colon adenocarcinoma male 73 stage 2 Yes MSS - -
P97_T2 sigmoid colon adenocarcinoma male 73 stage 2 Yes MSS Yes Yes
PCC3_T1 sigmoid colon adenocarcinoma male 76 stage 4 - MSS Yes Yes
5.2 RESULTS FROM SEQUENCING
5.2.1 GERMLINE VARIANTS FROM THE MMR/POLYMERASES PANEL
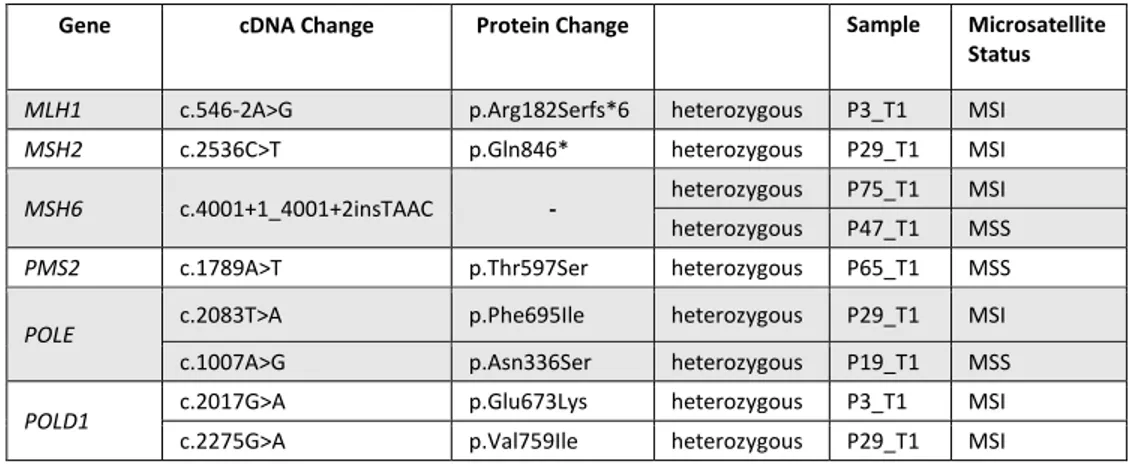
The germline variants found with the MMR/Polymerases Panel are reported in Table 7 and Supplementary Table 3.
27
Table 7: Germline mutations of MMR/Polymerase Panel genes in CRC samples.
Gene cDNA Change Protein Change Sample Microsatellite Status
MLH1 c.546-2A>G p.Arg182Serfs*6 heterozygous P3_T1 MSI
MSH2 c.2536C>T p.Gln846* heterozygous P29_T1 MSI
MSH6 c.4001+1_4001+2insTAAC - heterozygous P75_T1 MSI
heterozygous P47_T1 MSS
PMS2 c.1789A>T p.Thr597Ser heterozygous P65_T1 MSS POLE c.2083T>A p.Phe695Ile heterozygous P29_T1 MSI
c.1007A>G p.Asn336Ser heterozygous P19_T1 MSS
POLD1 c.2017G>A p.Glu673Lys heterozygous P3_T1 MSI
c.2275G>A p.Val759Ile heterozygous P29_T1 MSI
No germline variants with a population allele frequency < 1% were identified in the CHS panel genes.
5.2.2 SOMATIC VARIANTS FROM THE MMR/POLYMERASES PANEL
The following somatic variants were found in MSI samples (Table 8).Table 8: Somatic mutations of MMR/Polymerase Panel genes in CRC samples.
Gene cDNA Change Protein Change Sample
MLH1 c.1276C>T p.Gln426* PAA3_T2 c.1459C>T p.Arg487* P13_T1 MLH3 c.4011G>T p.Glu1337Asp P41_T1 MSH2 c.2327_2328insT p.Cys778Leufs*9 P59_T2 MSH3 c.554A>T p.Asp185Val P13_T1 MSH6 c.1082G>A p.Arg361His P29_T1 P13_T1 c.3163G>A p.Ala1055Thr P3_T1 POLE c.1630G>A p.Val544Met P3_T1 c.2132C>T p.Ser711Phe P41_T1 c.2780A>G p.Asn927Ser P3_T1 c.3455A>G p.Gln1152Arg P41_T1 c.4570C>T p.Pro1524Ser P3_T1 c.4603G>A p.Gly1535Ser P59_T2
POLD1 c.1732G>A p.Gly578Ser P13_T1
Among MSS sample, only one patient (PCC3_T1) showed two variants: MLH3 c.55A>C (p.Ile19Leu) and
POLE c.4652A>C (p.His1551Pro). In the remaining MSS samples (P65_T1, P73_T1, P85_T1, P85_T2,
29 Table 9: Somatic mutations of CHS Panel genes in CRC samples.
Gene cDNA Change Protein Change Sample Microsatellite
Status
KRAS
c.35G>A p.Gly12Asp P29_T1 MSI
PAA3_T2 MSI
c.35G>T p.Gly12Val P75_T1 MSI
P19_T1 MSS
c.40G>A p.Val14Ile P41_T1 MSI
c.175G>A p.Ala59Thr P29_T1 MSI
TP53
c.473G>A p.Arg158His P97_T2 MSS
c.524G>A p.Arg175His P13_T1 MSI
c.631_632delAC p.Thr211Phefs*4 P75_T1 MSI
c.746G>T p.Arg249Met P75_T1 MSI
APC c.2626C>T p.Arg876* P97_T2 MSS
c.4104_4105insG p.Pro1369Alafs*6 P47_T1 MSS
BRAF c.1790T>A p.Leu597Gln P47_T1 MSS
c.1798_1799insAGA p.Val600delinsGluMet P41_T1 MSI
PIK3CA c.1633G>A p.Glu545Lys P29_T1 MSI
c.3073A>G p.Thr1025Ala P59_T2 MSI
ALK c.3599C>T p.Ala1200Val P47_T1 MSS
CDH1 c.1115C>A p.Pro372His P3_T1 MSI
FBXW7 c.1177C>T p.Arg393* P59_T2 MSI
SMAD4 c.1009G>A p.Glu337Lys P47_T2 MSS
HNF1A c.833G>A p.Arg278Gln P85_T1 MSS
P85_T2 MSS PTEN c.343G>T p.Asp115Tyr P85_T1 MSS P85_T2 MSS STK11 c.1069G>A p.Glu357Lys P85_T1 MSS P85_T2 MSS RET c.2767C>T p.Leu923Phe P85_T1 MSS
31
al., 2000; Planck et al., 1999). The other germline heterozygous mutation, MSH2 c.2536C>T, causing p.Gln846* premature stop codon, was found in P29_T1 sample. Indeed, the two diagnosed Lynch syndrome patients (P3_T1 and P29_T1) underwent surgery at a young age (41 years and 42 years, respectively), and their CRCs presented with mucinous aspect, consistent with Lynch syndrome typical features.
P3_T1 Lynch syndrome CRC, in addition to the above-mentioned germline mutation affecting MLH1, showed a somatic variant of uncertain significance (InSiGHT Class 3) in MSH6 (c.3163G>A, p.Ala1055Thr, detected in 9 of the reads). Such variant is not recorded in COSMIC database, whereas a different change at the same codon, namely MSH6 c.3164C>T (p.Ala1055Val), is reported as COSM3186029 (FATHMM prediction: none, score 0.00). Moreover, P3_T1 sample presented with variants in DNA replicative polymerases. At the germline level, heterozygous POLD1 p.Glu673Lys was found. This variant lies in the Pfam DNA_pol_B conserved domain (PF00136) but has uncertain functional significance according to ClinVar. At the somatic level POLE p.Val544Met, POLE p.Asn927Ser and POLE p.Pro1524Ser were detected. POLE somatic variants all map outside the exonuclease domain and are not recorded in any of the consulted databases. Both somatic MSH6 and POLE variants were detected in approximately 9-11% of the sequencing reads. Considering the CHS panel, only a missense change (p.Pro327His) in Cadherin 1 (CDH1) gene was detected, this variant being absent from the consulted databases.
The other Lynch syndrome sample, P29_T1, apart from its pathogenic germline MSH2 mutation, also harbored two additional germline heterozygous variants. One, POLD1 p.Val759Ile, has been classified as likely benign by most (but not all) of ClinVar submitters and has been previously described as a somatic variant in one colon adenocarcinoma sample (COSM3692994). The other one, POLE p.Phe695Ile, despite an overall population allele frequency of T = 0.01097 in Exac and of T = 0.008 in the 1000 Genomes Project Phase 3 (data not shown in Supplementary Table 3), was above the polymorphism threshold in several populations, including the ethnic group closest to our Sicilian population (Toscani in Italy, T = 0.023). Somatic MSH6 p.Arg361His, classified as InSiGHT Class 3 variant of uncertain significance, was found in 45% of the reads. In the same patient, a terminal copy-neutral loss of heterozygosity (CN-LOH) at 2p has been observed (see Table 10 for a list of chromosomal aberrations); however, neither MSH2 nor MSH6 were included in this region of LOH. From the CHS panel, two mutations in KRAS were identified, p.Gly12Asp (51% of the reads) and p.Ala59Thr (43% of the reads).
KRAS codon 12 is a classic mutational hotspot. Mutations in KRAS p.Ala59Thr have also been previously
reported in gastrointestinal tumors (see COSM546; Lee et al., 2003; Yuen et al., 2002) and this codon is included among the hotspots for KRAS mutation tests (Weyn et al., 2017). PIK3CA p.Glu545Lys, detected
32
in 46% of the reads, is one of the most common PIK3CA hotspot activating mutations (Zhao and Vogt, 2008), with changes at codon 545 encompassing ∼10% of PIK3CA mutations in CRC (Bader et al., 2005).
5.2.4.2 NON-LYNCH SYNDROME MSI TUMORS
P75_T1 carried germline heterozygous MSH6 c.4001+1_4001+2insTAAC, which introduces an additional TAAC tetranucleotide within a pre-existing sequence of (TAAC)3 located at the junction between exon 9 and intron 9-10. This variant, in the equivalent form of MSH6 c.4001+12_4001+15dupACTA, is reported in ClinVar as Benign/Likely benign (Variation ID: 182672). No somatic mutations in the MMR/Polymerases Panel were found for sample P75_T1. The CHS Panel detected KRAS p.Gly12Val (46% of the reads). Since there is CN-LOH at 12p including KRAS gene, both KRAS alleles should be mutated. Moreover, two TP53 mutations were found: p.Thr211Phefs*4 (27%), due to a deletion of a GT
dinucleotide within a (GT)2 tandem repetition at the genomic level; and p.Arg249Met (29%).
P13_T1 sample showed somatic MLH1 p.Arg487* premature stop codon mutation (45% of the reads). Actually, a CN-LOH involving a region of the short arm of chromosome 3 including MLH1 gene was identified in this sample, accounting for a double somatic hit in MLH1. The specific nucleotide change c.1459C>T detected in MLH1, causing p.Arg487* premature stop codon, is not reported in COSMIC but a different nucleotide change with the same effect, that is MLH1 c.1458_1459delCCinsTT (p.Arg487*) is recorded with COSM4515964 (FATHMM: none, score 0.00). Moreover, P13_T1 sample harbored an InSiGHT Class 3 MSH6 p.Arg361His variant (19% of reads) not found in any of the consulted databases; a
MSH3 p.Asp185Val variant (18% of the reads) for which no information is available from the consulted
databases, whereas Exac and the 1000 Genomes Project Phase 3 both report two other changes at the same codon, MSH3 c.553G>C (p.Asp185His, C = 0.000008509) and MSH3 c.554A>G (p.Asp185Gly, G = 0.00004255, rs144012714). The last variant detected in P13_T1 sample was POLD1 p.Gly578Ser (25% of the reads), located outside the exonuclease domain, with a very low population allele frequency in Exac database (A = 0.00002826) but for which no functional information is available. The percentage of sequencing reads for MSH6 p.Arg361His, MSH3 p.Asp185Val and POLD1 p.Gly578Ser (18-25%) might be compatible with a single dominant clone, with the MLH1 p.Arg487* mutation being present at the double of the frequency (45%) because of the CN-LOH event. Admixture with other tumor clones or with non-tumor tissue might explain why, despite the CN-LOH event, MLH1 p.Arg487* mutation is limited to 45% of the reads. The CHS panel only detected the frequent hotspot mutation TP53 p.Arg175His
33
(35.5%). Since there is a broad loss of a region of 17p including TP53 gene, such mutation became hemizygous in the tumor (deletion-LOH).
P41_T1 sample showed somatic variants MLH3 p.Glu1337Asp (10%), POLE p.Ser711Phe (9%) and POLE p.Gln1152Arg (9%). All these variants were identified in a percentage of approximately 9-10% of the sequencing reads. However, none of these variants has been found in the consulted databases. All the above-mentioned variants of POLE lie outside the exonuclease domain. Sample P41_T1 showed loss of 19w, where POLD1 is located, but loss of POLD1 seems to be restricted to a small percentage of tumor tissue cells (as estimated by log2-ratio intensity signal in SNP6 array analysis). As regards the CHS panel, three mutations were found. The first one was a missense change in ATM, p.Arg337His (17% of the reads; COSM21301). The second one was BRAF c.1798_1799insAGA, which consists in an in-frame insertion of three nucleotides at the genomic level, changing valine at codon 600 into glutamate and inserting a methionine residue between codon 600 and codon 601, leading to p.Val600delinsGluMet insertion/deletion (18% of the reads), not found in any of the consulted databases. COSMIC database reports instead c.1798delGinsTACA (p.Val600delinsTyrMet), COSM1159850 (FATHMM: none, score 0.00). The last mutation identified with the CHS panel was KRAS p.Val14Ile (14% of the reads), which is known to reduce KRAS GTPase activity, both intrinsic and GTPase activating protein (GAP)-stimulated, compared to the wild type protein, although not as much impaired as in the case of KRAS p.Gly12Asp (Schubbert et al., 2006). KRAS p.Val14Ile has been previously found in tumors of the large intestine, as well as in other tumor types (COSM12722, Y.-J. Lee et al., 2016).
P59_T2 showed somatic MSH2 frameshift variant p.Cys778Leufs*9 (40% of the reads), due to insertion of a single base (c.2327_2328insT) in a (T)5 homopolymer tract, which would therefore convert into a (T)6 homopolymer with a shift in the reading frame; this variant has not been found in any of the consulted database and has not been assigned any InSiGHT class. Classification is given instead for MSH2 c.2334C>A (p.Cys778*), which has been attributed InSiGHT Class 5, being also considered to be pathogenic by ClinVar (Variation ID: 90956). Moreover, POLE p.Gly1535Ser variant, located outside the exonuclease domain, was detected in 35% of the reads. The CHS panel allowed detection of FBXW7 p.Arg393* (33% of the reads), and PIK3CA p.Thr2015Ala (40% of the reads).
PAA3_T2 sample showed InSiGHT Class 5 MLH1 p.Gln426* premature stop codon (15% of the total reads)., and KRAS p.Gly12Asp (15% of the reads).
34 5.2.4.3 MSS TUMORS
PCC3_T1 showed a somatic MLH3 p.Ile19Leu in 62% of the reads. This variant is not present in any of the consulted databases. Moreover, POLE p.His1551Pro (8%) was identified, not recorded in any of the databases as well. Exac database reports a different POLE variant at the same codon, namely POLE c.4651C>T (p.His1551Tyr) with an allele frequency of A = 0.000008274, also present in COSMIC database, COSM1605832 (FATHMM prediction: Pathogenic, score 0.93). No mutations were found with the CHS panel.
P65_T1 carried a germline heterozygous PMS2 p.Thr597Ser, which is classified as an InSiGHT Class 1 (benign) variant. No somatic variants were detected.
P73_T1 carried no germline variants and no somatic variants in any of the sequenced genes.
MSS tumor samples P85_T1 and P85_T2 represent two biopsies taken at different sites of the same patie t’s su gi al spe i e . I te esti gl , P _T sho ed BCNAs a d CN-LOH events, while P85_T2 showed 2 BCNAs and 0 CN-LOH events. No mutations were detected at the germline level in any of the two samples, as well as no mutations were found with the MMR/Polymerases panel. Considering results from the CHS panel, P85_T1 and P85_T2 shared the majority of sequence variants, although at different percentages of the sequenced reads: HNF1A p.Arg278Gln (22% vs 32%), PTEN p.Asp115Tyr (18% vs 25%), STK11 p.Glu357Lys (23% vs 28%). As can be seen, percentage of mutated reads was higher for P85_T2. Morevover, P85_T2 also showed RET p.Leu923Phe (9%), not detected in P85_T1. Mutations of
HNF1A have been described in a subset of hepatocellular adenomas with remarkable steatosis but
neither significant inflammation nor cytologic abnormalities (Zucman-Rossi et al., 2006). Of note, HNF1A p.Arg278Gln has been found mutated at the germline level in a monoallelic fashion in at least one case of hepatocellular adenoma (Jeannot et al, 2010) and at the somatic level in one carcinoma of the small intestine (COSM1359416). No functional information is available for PTEN p.Asp115Tyr. Interestingly, COSMIC database reports a different change at PTEN codon 115, namely PTEN c.343G>A (p.Asp115Asn), COSM1166807 (FATHMM prediction: Pathogenic, score 0.94), while ClinVar classifies one more variant at the same codon, PTEN c.344A>G (p.Asp115Gly), as likely pathogenic (Variation ID: 224542). STK11 p.Glu357Lys is classified by ClinVar as a variant of uncertain significance. RET p.Leu923Phe has been previously identified in colorectal cancer (Dallol et al., 2016) but no functional information is available, whereas three different variants at the same codon are reported in COSMIC: RET c.2767C>A (p.Leu923Ile; COSM6006463, FATHMM prediction: none, score 0.00), RET c.2767C>G (p.Leu923Val;
35
COSM48745, FATHMM prediction: Pathogenic, score 0.96) and RET c.2768T>A (p.Leu923His; COSM6006464, FATHMM prediction: none, score 0.00).
P47_T1 carried germline heterozygous MSH6 c.4001+1_4001+2insTAAC (reported in ClinVar as Benign/Likely benign, Variation ID: 182672). No mutations were found with the MMR/Polymerases panel. As regards the CHS panel, four mutations were found. The first one, ALK p.Ala1200Val (19% of the reads), COSM317003 (FATHMM prediction: Pathogenic, score 0.98), not reported before for CRC. The second one, APC c.4104_4105insG (p.Pro1369Alafs*6), due to an insertion of a guanosine within a non-homopolymer sequence context, was found in 37% of the reads and is not recorded in any of the consulted databases. Third, BRAF p.Leu597Gln (21%), COSM1125 (FATHMM prediction: Pathogenic, score 0.99) previously found in metastatic melanoma (Amanuel et al., 2012) as well as in other tissues and, finally, SMAD4 p.Glu337Lys (23%, COSM417827, FATHMM prediction: Pathogenic, score 0.99). P97_T2 did not carry any germline variant, and no somatic variants were detected with the MMR/Polymerases panel. The CHS panel allowed detection of APC p.Arg876* (65%, COSM18852, frequently found in tumors of the large intestine) and TP53 p.Arg158His (70%, COSM10690, present in a wide spectrum of malignancies). P97_T2 showed a broad loss on chromosome 5q including APC, (Figure 7) configuring a deletion LOH for APC, with the only copy left being mutated.
36
Figure 7: Broad loss on chromosome 5q, involving APC gene, in sample P97_T2.
P19_T1 showed the highest number of chromosomal abnormalities in our cohort. P19_T1 carried a germline heterozygous POLE p.Asn336Ser variant which, although located within the exonuclease domain, has been considered to be benign/likely benign in ClinVar database. No somatic variants have been detected with the MMR/Polymerases panel, whereas only KRAS p.Gly12Val (27.5%) has been detected with the CHS panel.
Table 10: List of BCNAs and CN-LOH for sequenced samples.
Sample Total BCNAs
Gain Loss Total
CN-LOH CN-LOH P3_T1 0 - - 0 - P29_T1 1 13q - 2 2p, 9q P75_T1 1 8w - 3 11q, 12p, 22q P13_T1 3 11q, 23p 17p 1 3p P41_T1 3 8w, 13q 19w 1 2p,18q P59_T2 5 7w, 8w, 9w, 13q, 20w 0 - PAA3_T2 6 7w, 8w, 9w, 20w 22q, 24w 0 - P65_T1 0 - - 0 -
37 P73_T1 0 - - 0 - PCC3_T1 0 - - 0 - P85_T1 0 - - 0 - P85_T2 2 7w, 13q - 0 - P47_T1 5 8q, 13q, 23w 4q, 18w 2 5q, 10q P97_T2 10 7w, 13q, 20q, 23w 4w, 5q, 8p, 12p, 18w, 20p 2 9 P19_T1 16 3q, 7w, 8q, 9w, 10p, 17q, 20q, 23p 1w, 4q, 6w, 8p, 17w, 18w, 19p, 20p 6 5w, , 10q, 11q, 14q,
X chromosome is numbered as chromosome 23; Y chromosome is numbered as chromosome 24.
5.3 GENOME INSTABILITY CLASSIFICATION OF CRC
MSS CRC samples were divided in two groups, according to their level of genome instability: high-BCNA (HB) and low-BCNA (LB) groups. To divide MSS samples into HB and LB, we used as a threshold the average value of BCNAs (2.71) found among MSI samples – which are usually regarded as near-diploid (Curtis et al., 2000; Hugen et al., 2015; Lengauer et al., 1998; Nakao et al., 2004) – plus one standard deviation (SD = 2.21), the sum being rounded up to 5 BCNAs. Samples in the MSI group and LB group had 5 BCNAs (Table 11 and Table 12), whereas sample in the HB group had >5 BCNAs (Table 13). The average BCNA number for LB samples was 1.73 (SD = 1.90); for the HB group, the average BCNA number was of 12.76 (SD = 4.36). The MSI group consisted of 5 tumors from 5 patients. The LB group included 11 tumors from 8 patients; the HB group included 29 tumors from 20 patients.
In one case, two samples from the same tumor presented with different BCNAs, and were assigned to different groups: P83_T1 (9 BCNAs) to the HB group, P83_T2 (0 BCNAs) to the LB group.
A comparison of the distribution of BCNAs in different chromosomes between HB and LB tumors is reported in Figure 8. Apart from 16p, whose gains have been found only in the LB group, all gains found in LB CRCs are also found in HB ones. This is also valid for losses: chromosomes affected in the LB group were the same chromosomes commonly affected in the HB group.
The same comparison regarding distribution of BCNAs per chromosome was made between HB and MSI tumors, as reported in Figure 9. Gains of chromosome 8w were more common among MSI samples.