DIPARTIMENTO DI INGEGNERIA E SCIENZA DELL’INFORMAZIONE 38100 Povo — Trento (Italy), Via Sommarive 14
http://disi.unitn.it/
AUTOMATIC PREDICTION OF FUNCTIONAL RESIDUES FROM
SE-QUENCE AND STRUCTURAL INFORMATION
Elisa Cilia and Andrea Passerini and Mauro Brunato
July 2008
Automatic Prediction of Functional Residues
from Sequence and Structural Information
Elisa Cilia and Andrea Passerini and Mauro Brunato
University of Trento - via Sommarive 14 - I38100 - Trento, Italy {cilia,passerini,brunato}@disi.unitn.it
July 2008
Abstract
One of the aims of modern bioinformatics is to discover the molecular mechanisms which rule the protein operation. This is a fundamental step in understanding the complex pro-cesses involved in living systems and would possibly allow us to correct dysfunctions. A protein may have different functions. Such functions are determined by the protein primary structure, i.e. the sequence of amino acids that constitute it, and by their spatial disposition (tertiary structure). Protein function identification is a challenging problem as it involves the combination of a large number of variables, most of which still unknown. Therefore approaches for the automatic detection of protein functional sites are needed. In this work we concentrate on the prediction of functional residues, i.e. residues which directly inter-act with the substrate. In its simpler formulation, the problem can be cast into a binary classification task at the residue level. Preliminary experiments showed that evolutionary enriched sequence-based information alone achieve performance which are statistically indis-tinguishable from carefully crafted features extracted from 3D coordinates. While allowing to apply functional residue prediction to the much wider range of sequenced proteins with possibly unknown 3D structure, such results indicate that using structural information in the automatic prediction of protein functional aspects is a non-trivial task. We show that by modeling physico-chemical properties of the residue structural neighbourhood we ob-tain significant improvements, but further research is needed in order to fully exploit the information provided by the protein 3D structure.
1
Introduction
One of the aims of modern bioinformatics is to discover the molecular mechanisms which rule the protein operation. This is a fundamental step in understanding the complex processes involved in living systems and would possibly allow us to correct dysfunctions.
A protein may have different functions. Such functions are determined by the protein primary structure, i.e. the sequence of amino acids that constitute it, and by their spatial disposition (tertiary structure) in the protein folding. Protein function identification is a challenging problem as it involves the combination of a large number of variables, most of which still unknown.
Genomics projects have produced a huge amount of protein sequences and structural genomics projects at a slower but increasing rate are solving the three-dimensional structure of these synthesized proteins by means of X-ray crystallography and Nuclear Magnetic Resonance (NMR). A large portion of both these synthesized and crystallized proteins have their function still undetermined, as it is often not straightforward to determine the details of protein function
even when its 3D structure is known. Gaining detailed experimental knowledge about a protein function from scratch is a time-consuming task, which is particularly important in drug design when different enzyme inhibitors need to be tested. It requires the effort of researchers and biologists in the study of a single target protein and performing experiments of site-directed mutagenesis [1]. Considered the rate at which protein structures are solved, the gap with respect to functionally characterized proteins is destined to increase over time.
Automatic approaches for the detection of protein functional sites can be very useful in narrowing this gap, by fully determining functional residues or reducing the number of can-didates to be experimentally verified. Traditional approaches to functional site identification use homology-based strategies. Novel protein function is inferred by aligning the sequences or by superimposing the structures with already annotated proteins. In [2], active sites of non annotated proteins in the Pfam database [3], which contains about 8,200 protein families, are predicted by using a rule-based technique which exploits the homology and sequence similarity with other annotated proteins. The methodology is based on the transfer of experimentally determined active site residue data to other sequences within the same Pfam family. The au-thors show that it is possible to gain functional annotation of a large number of sequences in the Pfam database (enzymatic families) for which the residues responsible for catalysis have not been determined. These homology-based techniques, still useful for the annotation of a number of structures with functional residues, are well-known to fail in specific situations. First of all, an annotated homologue of the target protein needs to be available, preventing their applicability to novel folds. Furthermore, proteins with similar overall tertiary structure can have different active sites, i.e. different functions [4], and proteins with different overall tertiary structure can show the same function and similar active sites (an example on proteases can be found in [5]). Finally, this increasing lack of functional annotations makes transferring them by homology still less effective.
A number of researchers have recently tackled the problem or functional residues prediction. In [6] the authors generated three-dimensional templates of active sites of proteins with rigid prosthetic groups. Their approach is based on the simultaneous alignment of several protein structures, and relies on local atomic-level similarities based on multiple comparisons. The gen-erated patterns include 3D atomic coordinates, position of chemical groups and cavity locations. However the approach remains limited to the subset of proteins having rigid prosthetic groups. In its simpler formulation, functional residue prediction can be cast into a binary classification task at the residue level. Petrova and Wu [7] have addressed it with a Support Vector Machine (SVM) fed with both protein sequence and structural properties. Capra and Singh [8] relied on an information-theoretic approach for estimating sequence conservation. The authors show that conservation of sequentially close residues improves predictive performance, especially when cat-alytic residues are involved. Carefully crafted conservation scores were shown [9] to play a major role in predictive performance. A recently published review on approaches and applications for structure-based protein function prediction can be found in [10].
In this work, we further investigate the role of sequence and structure information in func-tional residue prediction by SVM, building on the work by Petrova and Wu [7]. We employed their same dataset of 79 enzymes in order to allow for direct comparisons. Our experimental evaluation shows that evolutionary enriched sequence-based information alone achieve perfor-mance which are statistically indistinguishable from carefully crafted features extracted from 3D coordinates [7]. By modeling physico-chemical properties of the residue structural neighbour-hood we obtain significant improvements. However these results are still quite preliminary, and further research is needed in order to fully exploit the information provided by the protein 3D structure.
func-tional site detection; Section 3 describes the proposed methodology and feature generation; Section 4 describes our experimental evaluation and reports the results of the cross-validation experiments; finally in Section 5 we summarize our results, drawing some conclusions and propos-ing future lines of research.
2
Background
A protein function is determined by a topological region of the protein called functional site, that is a functional domain in the protein three-dimensional (3D) structure. Functional domains can have a multiplicity of roles within a protein. In this study the attention is concentrated on enzymes. Enzymes are particular type of proteins able to accelerate chemical processes inside a cell. In the catalysis the enzyme works by forming complexes with the substrates, usually small molecules, and in doing that it lowers the activation energy of the reactions thus increasing their rate. Enzymatic functional domains are also called active or catalytic sites. According to their function enzymes are classified in six functional classes in the so called Enzyme Classification (EC) Nomenclature [11].
An enzyme has usually the structure of a globular protein, the chain of amino acid residues is folded in the space in a nearly spherical way. The 3D disposition of the amino acid chain is somewhat specific, the amino acid residues take up well-defined positions which are essential for the recognition and binding of specific substrates, in other words, for the biological activity of the enzyme.
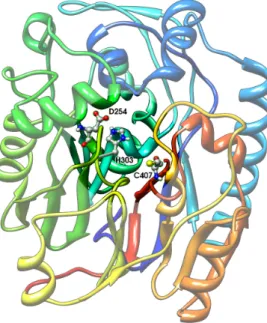
Figure 1: Active site of L-arginine:glycine amidinotransferase (1jdw).
The residues that are directly involved in the catalytic process (e.g. nucleophiles, proton-donors) constitute the active site, while residues in the surrounding space play the role of at-tracting and orienting the molecule to bind and constitute the binding domain. The first kind of residues are of interest in our study. From now on we refer to them as functional residues or catalytic residues. As an example in figure 1 we show the crystal structure of L-arginine glycine
amidinotransferase (PDB code 1jdw), a mitochondrial enzyme involved in the creatine biosyn-thesis. The catalytic pocket is highlighted and the catalytic triad of residues is shown: ASP254, CYS407, HIS303 [1]. The cysteine is the nucleophile, it binds the carbon on the substrate (argi-nine) side chain, the histidine activates the substrate to deprotonate C407 and deprotonates glycine and the aspartic acid primes the histidine by activating water, a cofactor or a residue.
3
Methods
In this section we describe the learning task, provide a brief introduction to SVM, and give a detail explanation of the sequential and structural features we employed.
3.1
The Learning Task
Functional residue prediction can be cast into a binary classification task at the residue level, namely predict for each residue of a given protein, whether it is directly involved in the catalysis or not. We addressed such a task with an SVM, a state-of-the-art binary classification algorithm which aims at separating positive and negative examples with a large margin, possibly accounting for margin errors. Details on SVM can be found in several textbooks [12].
3.2
Features Extracted from the Sequence
Scalar features extracted from the protein sequence refer simply to the characteristics of the amino acid to be considered (table 1):
The first attribute (A1) encodes the amino acid name of the residue.
The second attribute (A2) encodes the amino acid type of the residue based on its physico-chemical properties: H, R, K, E, D as charged; Q, T, S, N, C, Y, W as polar residues and G, F, L, M, A, I, P, V as hydrophobic [13].
The third set of attributes (A3) encodes a window of conservation profiles as described in section 3.2.1.
A1 and A2 are categorical (or nominal) attributes while A3 is a set of 22 × (2 × w + 1) numerical attributes, where w is the window length. We use the one-hot encoding for all the categorical attributes.
Features Description
A1 Central Amino acid Name A2 Central Amino acid Type A3 Conservation Profiles (windows)
Table 1: Representation: features extracted from the protein sequence. 3.2.1 Profile Generation
We computed conservation profiles associated to each residue in a target sequence by using the blastpgp tool performing a gapped blastp search on a database of non-redundant protein sequences (nr)1. In our setting blastpgp is used for performing a two iteration Position-Specific Iterative Blast Search (PSI-Blast) [14]. Given our set of protein sequences in fasta format from Uniprot [15], PSI-Blast returns a position specific scoring matrix (PSSM) obtained starting from
a multiple alignment of the highest scoring hits in an initial Blast search and then refines the profile with a subsequent iteration.
We used an expectation value threshold for the initial iteration of 5e-3 and a threshold for extending hits fixed to 5e-3.
We extracted the matrix of conservation profiles computed by PSI-Blast, which has one row for each position of the target sequence and one column for each one of the twenty natural amino acids. A matrix entry indicates to the fraction of times a particular amino acid appears in the corresponding position in the multiple alignment, combined with pseudocounts accounting for the prior knowledge of amino acid relationships. We enriched the profile with two values indicating its informativeness and reliability, namely profile entropy and weight of conservation profile with respect to pseudocounts. See [14] for details on the profile generation procedure.
3.3
Features Extracted from the Structure
In the following we describe the features extracted from the three-dimensional neighbourhood of a residue.
3.3.1 Residue Structural Neighbourhood
We define the structural neighbourhood of a residue x in the three-dimensional space as the set of residues and molecules contained in the volume of a sphere centred on x.
We can consider spherical regions of different radius. In this work we fix the radius of the sphere to a maximum of 8 ˚A which is the maximum interaction distance between a residue and a water molecule. The rationale behind this choice is that the interaction with a water molecule is very important for the catalysis in enzymes like the hydrolases.
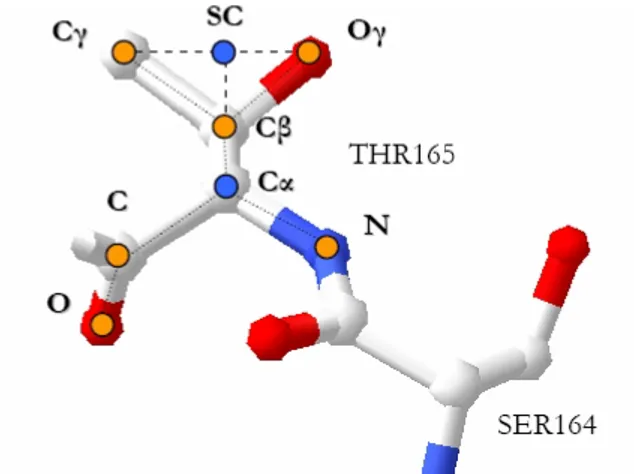
We represent an amino acid with a single representative point in the three-dimensional space, the centroid of its side-chain atoms (point SC in figure 2).
Figure 2: A residue representative points.
Only the side-chain representative point has been used in this work to calculate the distances between the amino acids. This because the side-chain atoms are the atoms which can be involved in the catalysis.
3.3.2 Structural Features
Table 2 summarizes the structural features we extracted from the residue three dimensional neighbourhood.
The first set of structural attributes (A4) encodes chemical and physical properties of the residue neighbourhood. This set of attributes represents properties such as hydrophobicity, po-larity, polarizability and Van der Waals volume of the neighbouring residues. They are encoded in a three bin distribution (normalized number of residues with low, medium, high hydropho-bicity, polarity, polarizability and Van der Waals volume) according to the indices reported in the Amino Acid Index Database [16]. The same encoding was used in [17] for protein function classification.
Charge or neutrality of the 3D sphere is represented by the set of attributes (A5), and is encoded into three values: the number of positively charged residues, the number of negatively charged residues and their sum.
The third set of attributes (A6) encodes the quantity of water in the sphere, measured as the number of water molecules within the sphere radius. We discretized this quantity into six uniform bins of width 5. This group of features is motivated by the fact that biologists observed that an active site is usually located in a hydrophobic core of the protein, while on the surface the quantity of water is higher and the residues exposed to the solvent are not hydrophobic.
Another group of attributes (A7) measures the atomic density of the sphere, calculated as the total number of atoms it contains. We discretized such density into eight bins ([0,25], [25,50], [50,60], [60,70], [70,80], [80,90], [90,100], [100, ∞)).
The set of attributes (A8) encodes the amino acid composition of the sphere, represented as the relative frequency of occurrence of each of the twenty amino acids.
Finally, we extracted from the PDB structure an attribute (A9) representing the residue B-factor, a measure of the residue flexibility, calculated as the sum of all atomic B-factors of atoms composing it.
Features Description
A4 Physical and chemical properties (amino acid attributes) A5 Charge/Neutrality
A6 Water molecule quantity
A7 Atomic density
A8 Amino acidic Composition A9 Flexibility B-factor
Table 2: Representation: features extracted from the residue structural neighbourhood.
3.4
Missing Value Treatment
In this kind of application some of the feature values may be missing for some of the proteins in the dataset. We preprocessed the dataset computing modes for categorical attributes and means for numerical attributes, and replacing missing values by the corresponding modes or means.
3.5
Dataset Normalization
We normalized attribute values in the [-1,+1] range applying the following linear transformation: value0 = 2 · value−minmax−min − 1. While this implies a lower data sparsity with respect to a [0,1] normalization, preliminary experiments showed that it achieved better overall results.
4
Experimental Results and Discussion
In the following we report and discuss the results of our classification experiments.
4.1
Experimental Setting
We built our predictor of functional residues, on the representation model described in the previous section, by using the well-known Support Vector Machine (SVM) binary classification algorithm, limiting ourselves to linear kernels.
Our experimental evaluation is based on a 10-fold cross-validation procedure on a dataset of 79 enzymes (selected in [7] for their structural and functional heterogeneity with respect to their SCOP fold classification, EC numbers and BLAST sequence similarity) belonging to all the six classes of enzymes in the Enzyme Classification (EC) Nomenclature. From these 79 enzymes retrieved from the Protein Data Bank (PDB) [18] we extract 23635 residues2; only 254 of them are labeled as functional residues in the Catalytic Residue Dataset (CATRES) [13]. Thus the dataset is strongly imbalanced with a ratio between positive and negative examples of about 931. All experiments were carried out using the SV MLight [19] software3. We fixed the regularization parameter (parameter c in the SV MLight implementation) to 1, and tuned the cost factor (parameter j in the SV MLight implementation), which outweighs the error on the
positive examples with respect to the negatives, on the first fold of the 10-fold cross validation by an inner cross validation procedure inside its training set, and kept it fixed across the outer 10-fold. Tuning the cost factor is particularly important for this application due to the strong imbalance between the number of positive and negative examples we are facing.
4.1.1 Performance Measures
The following measures have been used to evaluate our approach: • Precision = t+
t++f+ (P)
• sensitivity or Recall or TP rate = t+ t++f− (R)
• FP rate (1-specificity) = f+
t−+f+ (FPR)
• F1 measure, F1= 2×P recision×RecallP recision+Recall (F1)
• Matthews Correlation Coefficient = √ t+t−−f+f−
(t++f+)(t++f−)(t−+f−)(t−+f+) (MCC)
where t+, t−, f+, f−are the true positives, the true negatives, the false positives and the false
negatives, respectively.
4.2
Results
Our baseline for performance comparisons are the results obtained in [7]. We run a 10-fold cross-validation procedure stratified at the protein level, that is assuring that all residues of a certain protein always appear together in the same fold.
229 residues were removed with respect to the 23664 extracted in [7] due to uncertain correspondence in the
mapping between the two datasets or due to conflicts between the residues reported in the PDB structure file and in the fasta sequence from Uniprot
Table 3 reports a legend of the abbreviations we employed for the different sets of attributes that we tried.
Abbreviation Description
SV M Ww the attributes from A1 to A3 with profile window of length equal to w
SV M P 5seq the attributes extracted from the protein sequence among the 24 in [7]
SV M P 24 the whole set of 24 attributes proposed in [7]
SV M P 7 the optimal set of 7 attributes selected among the 24 in [7]
SV M P 193D the attributes extracted from the protein structure among the 24 in [7]
SV M A1-2,4-9 the attributes A1, A2 and from A4 to A9 as described in section 3.3
Table 3: Legend of abbreviations for the different sets of attributes tried in the experiments.
CV Exp Performance % ±s.d. SV M Ww j P R FPR F1 M CC SV M W0 10 23 ± 8 29 ± 9 1.1 ± 0.4 25 ± 6 24 ± 7 SV M W1 7 29 ± 17 22 ± 9 0.7 ± 0.3 25 ± 10 24 ± 11 SV M W2 7 19 ± 7 30 ± 9 1.5 ± 0.6 23 ± 6 22 ± 7 SV M W3 5 23 ± 11 25 ± 8 1.1 ± 0.5 23 ± 6 22 ± 7 SV M W4 6 20 ± 7 35 ± 10 1.7 ± 0.6 25 ± 7 25 ± 7 SV M W5 5 19 ± 7 30 ± 9 1.5 ± 0.5 23 ± 6 23 ± 7 SV M W6 7 18 ± 5 42 ± 8 2.2 ± 0.6 25 ± 5 26 ± 5 SV M W7 6 18 ± 5 38 ± 12 1.9 ± 0.4 24 ± 7 25 ± 7 SV M W8 6 15 ± 4 34 ± 9 20 ± 0.3 21 ± 5 21 ± 5 SV M W9 3 19 ± 8 23 ± 7 1.2 ± 0.3 20 ± 7 20 ± 7 SV M W10 5 15 ± 5 30 ± 9 1.9 ± 0.4 20 ± 6 20 ± 6
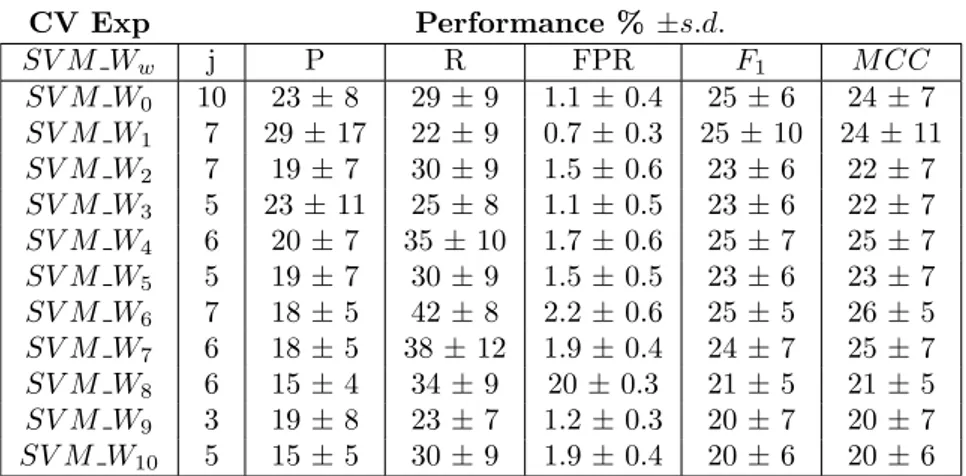
Table 4: Results of the cross-validation for different sizes of the window of multiple alignment profiles.
Table 4 reports experimental results obtained using windows of multiple alignment profiles of size varying between 0 and 10. Recall that size w implies a window of w residues on each side of the target residue, in addition to the target residue itself. The best performing set of features in this case appears to be the one with a window of profiles of size equal to 6 , and we can observe that further enlargement of the profile window is not beneficial. However the use of polynomial kernels of degree greater than one could improve the performance by considering the conjunctive contribution of groups of features, and will be a subject of further experiments.
The performance with a window of profiles of size 6 and the ones with only the conserva-tion profile for the target residue are however comparable and our experiments combining large profile windows, for example of size 6, with other features has shown they do not improve the performance when using the linear kernel. Thus in the following experiments we show, we use conservation profiles of window size equal to 0. This also implies a gain in the speed of the classifier evaluations due to the reduced size of the feature vectors, only 22 values with respect to 154.
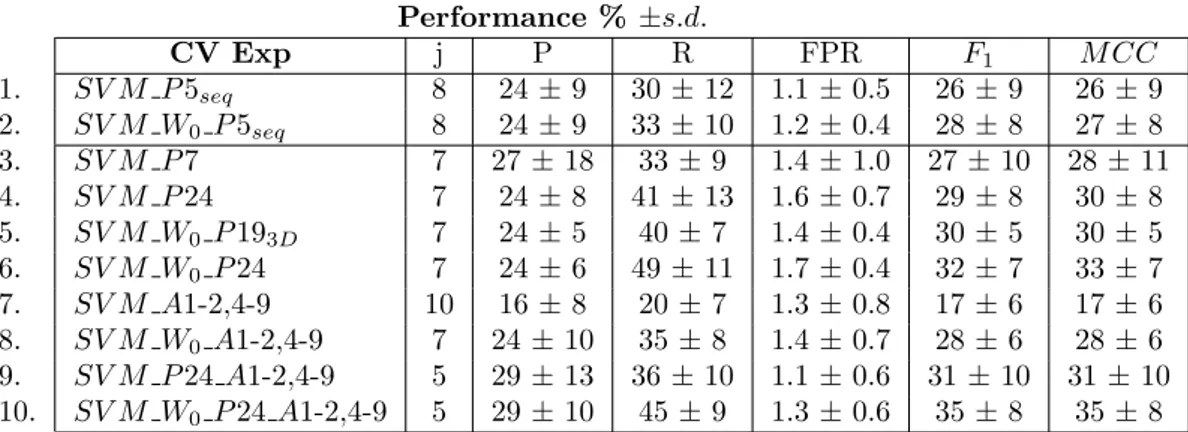
Table 5 reports a summary of experimental comparisons for different sets of features, both sequence and structure based. The first two rows (SV M P 5seq, SV M W0 P 5seq) report results
Performance % ±s.d. CV Exp j P R FPR F1 M CC 1. SV M P 5seq 8 24 ± 9 30 ± 12 1.1 ± 0.5 26 ± 9 26 ± 9 2. SV M W0 P 5seq 8 24 ± 9 33 ± 10 1.2 ± 0.4 28 ± 8 27 ± 8 3. SV M P 7 7 27 ± 18 33 ± 9 1.4 ± 1.0 27 ± 10 28 ± 11 4. SV M P 24 7 24 ± 8 41 ± 13 1.6 ± 0.7 29 ± 8 30 ± 8 5. SV M W0 P 193D 7 24 ± 5 40 ± 7 1.4 ± 0.4 30 ± 5 30 ± 5 6. SV M W0 P 24 7 24 ± 6 49 ± 11 1.7 ± 0.4 32 ± 7 33 ± 7 7. SV M A1-2,4-9 10 16 ± 8 20 ± 7 1.3 ± 0.8 17 ± 6 17 ± 6 8. SV M W0 A1-2,4-9 7 24 ± 10 35 ± 8 1.4 ± 0.7 28 ± 6 28 ± 6 9. SV M P 24 A1-2,4-9 5 29 ± 13 36 ± 10 1.1 ± 0.6 31 ± 10 31 ± 10 10. SV M W0 P 24 A1-2,4-9 5 29 ± 10 45 ± 9 1.3 ± 0.6 35 ± 8 35 ± 8
Table 5: Summary of the results of the cross-validation on different selected attributes.
five attributes from [7] which includes the A1 and A2 attributes and, rather than a conservation profile as described in the previous section, a conservation score from the Scorecons server [20] plus its entropy and relative entropy values. The results are comparable with our results obtained with conservation profiles reported in table 4. With the second set of attributes (SV M W0 P 5seq)
we explored the combination of all the available features extracted from the protein sequence. The improvement is small and not really appreciable.
Results in the following rows include additional information provided by structural features. In rows 3 and 4 we employed the same sets of attributes proposed in [7], both the subset of the 7 optimal ones (SV M P 7) and the entire set of 24 attributes. Note that performance improvements obtained with respect to the results reported in [7] are due to the tuning of the cost factor for false positives versus false negatives, as compared to a random sampling of negative examples.
In row 5 we experimented on all the structural properties used in [7] in conjunction with our set of attributes A1, A2 and A3 (window of size equal to 0) extracted from the sequence. By substituting the Petrova-Wu conservation information with our conservation profiles, the per-formance improvement is not really appreciable. Perper-formance are comparable with the previous case (SV M P 24) but a bit more stable across the ten folds (low standard deviation).
In row 6 we combined our conservation profiles A3 (with window length equal to 0) with all the sequence and structural attributes in [7], obtaining considerable improvements.
Row 7 reports the result over the set of structural attributes we defined in section 3.3, which seems to perform quite poorly when used alone. This can be due to a wrong selection of the cost factor j or it simply means that with structural features alone, without considering the conservation of amino acids in a protein sequence, we are not yet able to obtain results better than by using only sequential information. However such attributes contribute in improving performance when combined to other sets of attributes, such as conservation profiles in row 8 and Petrova-Wu attributes in row 9. The last row of the table reports the performance of the whole set of available attributes, both sequence and structure based.
We evaluated the statistical significance of the most evident differences between the various settings performing paired statistical tests, both parametric (Paired t-test) and non-parametric (Wilcoxon), on the F1 measures reported for each fold. The two types of tests give always the
same answer with slight changes in the p-value, thus it seems that we can assume a normal distribution of the data. Table 6 reports results of the statistical tests comparing the set of features from[7] (SV M P 24) and the combination of all sequence-based and structural features with all other settings. Significance is assumed with a p-value smaller or equal to 0.05.
Con-cerning the choice of conservation encoding, the tests show that there is no significant difference in using Scorecons conservation score, entropy and relative entropy values with respect to con-servation profile (A3). More importantly, there is no statistically significant difference in the performance obtained by using only attributes extracted from the primary sequence, that take into account evolutionary information, with respect to the performance obtained by adding the manually curated structural attributes of [7]. This means that selecting the appropriate and discriminant structural attributes for functional residue prediction is not a trivial task. Thanks to those results we can currently obtain comparable classifier performance by only using features extracted from the primary sequence of a protein, including the evolutionary information given by the conservation profiles. This has the strong advantage of a larger applicability, because it can be potentially used for predicting functional residues in any synthesized protein. On the other hand, as we already discussed in the introduction and also stated in the review of [10], the availability of the structural information can be crucial in solving the task. For this reason we investigated the addition of structural information extracted from the 3D neighbourhood of a residue. Indeed, by modeling the residue structure neighbourhood in conjunction to the available sequence-based and structural features, we are able to significantly improve over any sequence-based set of features, as well as over results in [7].
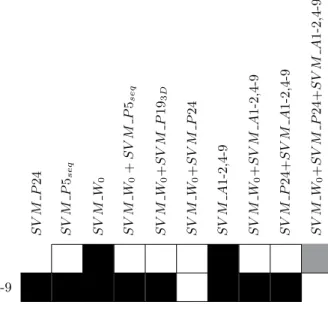
S V M P 24 S V M P 5seq S V M W 0 S V M W 0 + S V M P 5seq S V M W 0 + S V M P 19 3 D S V M W 0 + S V M P 24 S V M A 1-2,4-9 S V M W 0 + S V M A 1-2,4-9 S V M P 24+ S V M A 1-2,4-9 S V M W 0 + S V M P 24+ S V M A 1-2,4-9 SV M P 24 SV M W0+SV M P 24+SV M A1-2,4-9
Table 6: Results of the paired t-test and Wilcoxon statistical tests. A black (resp. grey) box indicates that the classifier on the row in statistically better (resp. worse) than that on the column, with a p-value smaller that 0.05. A white box indicates no statistical difference in performance.
5
Conclusion and Future Work
In this work we investigated the use of specific protein sequence and structural information in the functional residue prediction task addressed using a linear SVM classifier. We compared our results with similar approaches on a common dataset. Our experiments showed that evo-lutionary enriched sequence-based information alone achieve performance which are statistically
indistinguishable from carefully crafted features extracted from the protein 3D structure. While allowing to apply functional residue prediction to the much wider range of sequenced proteins with possibly unknown 3D structure, such results claim that we are still far away from obtaining large improvements in the classifiers performance with the use of structural information and further work can be done in this direction.
By looking at the results of the cross-validation experiments we observed some peculiar pat-tern of behaviour of the classifier on specific proteins in some of the folds. We found that for these proteins the PSI Blast search does not give a good multiple alignment thus in these cases the features extracted from the sequence are poorly performing while structural features help achieving results comparable with the results obtained on other folds. This is one of the findings that we want to further investigate in the future.
We showed that by adding structural information extracted from the three-dimensional neigh-bourhood of a residue we can obtain statistically significant improvements with respect to pre-vious results. In future we want to further exploit the potential of the 3D neighbourhood of a residue x by better modeling the characteristics of neighbouring residues as well as the overall 3D geometry.
Acknowledgments
Many thanks to Natalia Petrova and Cathy Wu for making their dataset available for our exper-iments.
References
[1] Humm, A., Fritsche, E., Mann, K., Gohl, M., Huber, R.: Recombinant expression and isolation of human L-arginine: glycine amidinotransferase and identification of its active-site cysteine residue. Biochem J 322(Pt 3) (1997) 771–776
[2] Mistry, J., Bateman, A., Finn, R.: Predicting active site residue annotations in the pfam database. BMC Bioinformatics 8(1) (2007) 298
[3] Finn, R.D., Mistry, J., Schuster-B¨ockler, B., Griffiths-Jones, S., Hollich, V., Lassmann, T., Moxon, S., Marshall, M., Khanna, A., Durbin, R., Eddy, S.R., Sonnhammer, E.L., Bateman, A.: Pfam: clans, web tools and services. Nucleic Acids Res 34(Database issue) (2006) [4] Todd, A.E., Orengo, C.A., Thornton, J.M.: Evolution of function in protein superfamilies,
from a structural perspective. Journal of Molecular Biology 307(4) (2001) 1113–1143 [5] Wallace, A.C., Laskowski, R.A., Thornton, J.M.: Derivation of 3d coordinate templates
for searching structural databases: application to serhis-asp catalytic triads in the serine proteinases and lipases. Protein Science 5(6) (1996) 1001–1013
[6] Nebel, J.C.: Generation of 3d templates of active sites of proteins with rigid prosthetic groups. Bioinformatics 22(10) (2006) 1183–1189
[7] Petrova, N.V., Wu, C.H.: Prediction of catalytic residues using support vector machine with selected protein sequence and structural properties. BMC Bionformatics 2006 (7) (2006) 312–324
[8] Capra, J.A., Singh, M.: Predicting functionally important residues from sequence conser-vation. Bioinformatics (2007) btm270+
[9] Fischer, J.D., Mayer, C.E., S¨oding, J.: Prediction of protein functional residues from sequence by probability density estimation. Bioinformatics 24(5) (2008) 613–620
[10] Gherardini, P., Helmer-Citterich, M.: Structure-based function prediction: approaches and applications. Briefings in Functional Genomics and Proteomics (2008)
[11] Boyce, S., Bugrim, A., McDonald, A., Fabrizio, F., Slomczynski, J., Wise, W.B., Richardson, M., Sachs, N., Feng, B., Tipton, K., Kazic, T.: END: the enzyme nomenclature database (2000)
[12] Cristianini, N., Shawe-Taylor, J.: An Introduction to Support Vector Machines and Other Kernel-based Learning Methods. Cambridge University Press (2000)
[13] Bartlett, G., Porter, C., Borkakoti, N., Thornton, J.: Analysis of catalytic residues in enzyme active sites. J Mol Bio 2002 324(1) (2002) 105–121
[14] Altschul, S.F., Madden, T.L., Sch¨affer, A.A., Zhang, J., Zhang, Z., Miller, W., Lipman, D.J.: Gapped blast and psi-blast: a new generation of protein database search programs. Nucleic Acids Res 25(17) (1997) 3389–3402
[15] : The universal protein resource (uniprot). Nucleic Acids Res 35(Database issue) (2007) [16] Kawashima, S., Ogata, H., Kanehisa, M.: AAindex: Amino Acid Index Database. Nucleic
Acids Research 27(1) (1999) 368–369
[17] Borgwardt, K.M., Ong, C.S., Schnauer, S., Vishwanathan, S.V.N., Smola, A.J., Kriegel, H.P.: Protein function prediction via graph kernels. Bioinformatics 21 (2005) i47–i56 [18] Berman, H.M., Westbrook, J., Feng, Z., Gilliland, G., Bhat, T.N., Weissig, H., Shindyalov,
I.N., Bourne, P.E.: The protein data bank. Nucleic Acids Research 28(1) (2000) 235–242 [19] Joachims, T.: Making large-scale svm learning practical. In: Advances in Kernel Methods
- Support Vector Learning, B. Sch¨olkopf, C. Burges and A. Smola editors (1999) [20] Valdar, W.S.: Scoring residue conservation. Proteins 48(2) (2002) 227–241