3,4-METHYLENEDIOXYMETHAMPHETAMINE ENHANCES KAINIC ACID CONVULSIVE SUSCEPTIBILITY
Sónia Abad1, Fèlix Junyent1, Carme Auladell2, David Pubill1, Mercè Pallàs1, Jorge Camarasa1, Elena Escubedo1*&, Antonio Camins1&
1 Department of Pharmacology and Therapeutic Chemistry (Pharmacology Section) and 2 Department of Cellular Biology. Institute of Biomedicine (IBUB). University
of Barcelona, Barcelona, Spain
&E.E. and A.C. contributed equally to this work.
Running title: MDMA enhances kainate convulsive susceptibility
Corresponding author: Elena Escubedo
Department of Pharmacology and Therapeutic Chemistry, Faculty of Pharmacy, University of Barcelona. Avda. Joan XXIII s/n. Barcelona 08028, Spain.
Tel: +34-934024531 Fax: +34-934035982 E-mail: [email protected]
The number of text pages: The number of tables: 1
The number of figures: 7 plus 4 supplementary The number of references: 50
The number of words in the Abstract: 241 The number of words in the Introduction: 732 The number of words in the Discussion: 1419
List of nonstandard abbreviations used in the paper:
3,4-methylenedioxymethamphetamine (MDMA); Kainic acid (KA); calcium binding proteins (CaBP), parvalbumin (PV), calbindin (CB) and calretinin (CR).
Recommended section assignment: Neuropharmacology
Abstract
Kainic acid (KA) causes seizures and neuronal loss in the hippocampus. The present study investigated whether a recreational schedule of 3,4-methylenedioxymethamphetamine (MDMA) favours the development of a seizure state in a model of KA-induced epilepsy and potentiates the toxicity profile of KA (20 or 30 mg/kg). Adolescent male C57BL/6 mice received saline or MDMA t.i.d. (s.c. every 3 h), on 1 day a week, for 4 consecutive weeks. Twenty-four hours after the last MDMA exposure, animals were injected with saline or KA (20 or 30 mg/kg). After this injection, we evaluated seizures, hippocampal neuronal cell death, microgliosis, astrogliosis, and calcium binding proteins. MDMA pretreatment, by itself, does not induce neuronal damage but increases seizure susceptibility in all KA treatments and potentiates the presence of Fluoro-Jade-positive cells in CA1. Furthermore, MDMA, like KA, significantly decreased parvalbumin levels in CA1 and dentate gyrus, where it potentiated the effects of KA. The amphetamine also promoted a transient decrease in calbindin and calretinin levels, indicative of an abnormal neuronal discharge. In addition, treatment of cortical neurons with MDMA (10-50 µM) for 6 or 48 h significantly increased basal Ca2+ levels and potentiated Ca2+ influx after NMDA challenge. In parallel, basal Na+ levels were reduced and kainate response were increased after pre-incubation with MDMA. These results indicate that MDMA potentiates KA-induced neurodegeneration and also increases KA seizure susceptibility. The mechanism proposed includes changes in Calcium Binding Proteins expression, probably due to the disruption of intracellular (calcium) ionic homeostasis, or/and an indirect effect through glutamate release.
Introduction
A substantial number of studies have been performed on the neuropharmacological mechanisms involved in the adverse effects of 3,4-methylenedioxymethamphetamine (MDMA, “Ecstasy”) in laboratory animals, in which it has been shown to be neurotoxic to dopamine (DA) and serotonin (5-HT) terminals. It is well known that these neurotoxic effects are species-dependent (Logan et al., 1988). In mice, it is generally agreed that MDMA, at high doses, induces a dopaminergic terminal injury in the striatum (Chipana et al., 2006) and disrupts 5-HT neurochemistry in the hippocampus, depending on schedule dose used. In contrast, administration of a neurotoxic regimen of this amphetamine derivative to rats results in a selective reduction in cerebral tissue concentrations of 5-HT and also in 5-HT uptake sites in cortex and hippocampus, pointing to a selective injury of serotonergic terminals (Green et al., 2003; Pubill et al., 2003).
Likewise recent reports documented the finding that repeated exposure of rats to MDMA increases glutamate release in the hippocampus (Anneken and Gudelsky, 2012). Sustained increases in extracellular glutamate have the potential to promote excitotoxicity and could be involved in the neurotoxic effects of MDMA in the brain (Capela et al., 2006).
Collectively all these data provide support to the suggestion that the consequences of chronic exposure to MDMA are not only limited to specific terminal neurons, but that other elements are also susceptible to damage. In this sense, changes in the EEG records have been described in long-term MDMA users and epileptic seizures associated with
(Zagnoni and Albano, 2002). Giorgi et al. (Giorgi et al., 2005) reported, for the first time, that MDMA lowered the threshold for kainate-induced seizures. These data are important because MDMA might predispose to seizures due to alterations in brain excitability (Zagnoni and Albano, 2002; Brown et al., 2011) or increasing basal calcium levels (Garcia-Ratés et al., 2010). However there have been few studies evaluating the proconvulsant effect of MDMA in experimental models of epilepsy (Giorgi et al., 2005) and they use a different schedule of MDMA administration than that of the present study.
Kainic acid (KA) has been widely used for its ability to replicate many of the phenomenological features of human temporal lobe epilepsy (Ben-Ari and Cossart, 2000; Leite et al., 2002). Seizures cause extensive brain damage concomitant with an increase in reactivity of the glia, as well as failure of the cellular homeostasis (Niquet et al., 1994; Represa et al., 1995; Cavazos et al., 2004; Kondratyev and Gale, 2004; Junyent et al., 2011). KA has direct excitatory effects on neurons but its potent neurotoxic action involves also the activation of presynaptic receptors on glutamatergic terminals, thereby releasing Asp and Glu. Endogenous glutamate, by activating NMDA, AMPA or mGluR1 receptors, may contribute to the brain damage occurring acutely after status epilepticus (Meldrum, 2000).
The aim of the present study was to evaluate whether the MDMA favours the development of a seizure state in adolescent mice treated with the neurotoxin KA. We used a regimen of MDMA that differed from the classic neurotoxic exposure, trying to simulate classical adolescent weekend binge use of this substance. We observed a decrease in time to first seizure and an increase in seizure activity induced by KA. We
also investigated whether hippocampal neurotoxicity after two different doses of KA is potentiated by MDMA.
Calcium binding proteins (CaBP) are expressed by distinct subsets of GABAergic interneurons in the hippocampus and they are crucial for calcium homeostasis in neurons. These include parvalbumin (PV), calbindin-D28k (CB) and calretinin (CR). These proteins afford neuroprotection by preventing the sustained increase of intracellular calcium. In the present study, using immunohistochemistry for PV, CB and CR, we compared the KA-associated changes in hippocampal regions with those induced by MDMA or their combination. Analysis of these markers could provide data to indicate whether one, two, or all of the GABAergic interneuron subtypes might be abnormal in the hippocampus of animals exposed to the above-mentioned substances. Based on the MDMA effects described by Anneken and Gudelsky (Anneken and Gudelsky, 2012), we have limited the study to the hippocampus. Because the entry of calcium into neurons is strongly associated with seizures (Meyer, 1989; McNamara, 1992), we also carried out in vitro experiments in cortical neuron cultures to corroborate the effects of MDMA on calcium homeostasis. Our data indicate that MDMA potentiates KA-induced neurodegeneration and also increases KA seizure susceptibility.
Experimental Procedures
Animals
Adolescent male C57/BL6 mice (4-5 weeks old) (Charles River Laboratories, France) were kept under controlled temperature, humidity and light conditions with food and water provided ad libitum. They were treated according to European Community Council Directive 86/609EEC and the procedure registered at the Department d’Agricultura, Ramaderia i Pesca of the Generalitat de Catalunya. Efforts were made to minimize animal suffering and to reduce the number of animals used.
Drug treatments and sample preparation
To model recreational MDMA use, we used adolescent mice. It could also be considered appropriate to simulate the widespread practice of “stacking” (taking multiple doses at once in order to increase the desired effect and/or overcome tolerance from prior use) and “boosting” (taking supplemental doses over time in order to maintain the drug’s effect) (Hammersley et al., 1999; Meyer et al., 2008). To select the appropriate MDMA dose we took into account that the dose regimen used in neurotoxic experiments with mice is 25 mg/kg three times per day (tid) every 3h (Colado et al., 2001) or 20 mg/kg every 2h for a total of four injections (O’Callaghan and Miller, 1994). Consequently, a maximal dose of 10 mg/kg tid was choosen. Treatment schedule started with a standard psychostimulant dose of MDMA (5 mg/kg) (Spanos and Yamamoto, 1989) that increased over the treatment, imitating the classic consumption of a reinforcing compound. In order to simulate its recreational use, MDMA was administered once a week during all the adolescent period (from week 4 to week 8 of age) (Smith, 2003). Drug administration was carried out at high environmental
temperature, thus simulating the hot environments in which this substance tends to be consumed (clubs, raves).
Initially, animals were randomly assigned to the following treatment groups: saline+saline, MDMA+saline (M), saline+Kainate 20 mg/kg (KA20), MDMA+Kainate 20 mg/kg (M+KA20), saline+Kainate 30 mg/kg (KA30), MDMA+Kainate 30 mg/kg (M+KA30).
The animals (n=7-10) for every treatment group in each experiment received a chronic dosage regimen of saline (5 ml/kg) or MDMA t.i.d. (s.c, every 3 h) on 1 day a week (the same day every week), for 4 consecutive weeks. MDMA and KA doses and the treatment schedule were as illustrated in Figure 1. On the day of treatment, the environmental temperature was maintained at 26 ± 1°C until 2 h after the last dose. Thereafter, the animals were returned to normal housing conditions (22 ± 1°C). One hour after the second daily dose of saline or MDMA, rectal temperature was measured using a lubricated, flexible rectal probe inserted into the rectum and attached to a digital thermometer (0331 Panlab SL, Barcelona, Spain). The dose of MDMA increased every week. Accordingly the doses were: 5 mg/kg, 7.5 mg/kg (for 2 consecutive weeks) and 10 mg/kg. Twenty-four hours after the last dose of MDMA or saline, animals were exposed to low/moderate (20 mg/kg) or high (30 mg/kg) epileptogenic KA i.p. doses (Santos and Schauwecker, 2003; Sonn et al., 2010).
After the KA injection, the animals were put in individual plexiglas cages and observed for a period of 4 h to evaluate the occurrence and intensity of seizures. Seizures were assessed according to an adaptation of the Racine’s scale (Racine, 1972) consisting of seven stages (0–6), which correspond to the successive developmental stages of motor
seizures: (0) normal non-epileptic activity; (1) Still and crouched in a corner, staring; (2) Stretches body out, tail becomes straight and rigid, ears laid back, bulging eyes; (3) Repetitive head bobbing, rears into a sitting position with forepaws resting on belly (4) Rearing and falling tonic clonic seizures broken by periods of total stillness, jumping clonus, running clonus; (5) Continuous Level 4 seizures and (6) Body in clonus, no longer using limbs to maintain posture, usually precursor to death.
The animals were killed 24 h or 72 h later. All mice were anaesthetized by i.p. injection of ketamine (100 mg/kg) and xylazine (10 mg/kg) and were perfused with paraformaldehyde 4% in phosphate buffer 0.1 M, after which the brains were removed. These were subsequently rinsed in paraformaldehyde 4% with 30% sucrose for 24 h and then frozen. Coronal sections of 30 μm were obtained. Brains from mice killed after 24 h of KA treatment were used for microgliosis immunohistochemistry, and brains from mice killed after 3 days of KA treatment were used for GFAP immunohistochemistry. Fluoro-Jade B staining, calbindin-D28k, calretinin and parvalbumin immunohistochemistry were performed either at 24 or 72 h.
Fluoro-Jade B staining
Slides were defatted by dehydration in ethanol before being rehydrated, rinsed in phosphate-buffered saline (PBS), and incubated with 5 nmol/l of Hoechst 33342 for 10 min in the dark. After two washes in distilled water, the slides were immersed in 0.06 g/l of potassium permanganate (KmnO4) for 15 min in the dark. After two washes, the slides were transferred to the staining solution containing 0.1 ml/l of acetic acid and 4 µl/l Fluoro-Jade B for 30 min, in the dark. Slides were rinsed in distilled water, dried, and then submerged directly in xylene and mounted in DPX medium. Slides were analysed with an epifluorescence microscope (Olympus BX61).
Immunohistochemistry
Free-floating coronal sections were rinsed in 0.1 mol/l PB, pH 7.2, and then treated with 5 ml/l H2O2 and 100 ml/l methanol in PBS for 15 minutes. After that, they were preincubated in a blocking solution (10% fetal bovine serum (FBS), 0.2 mol/l of glycine, Triton X-100 0.2% in 0.2% PBS-gelatin). Then, sections were incubated overnight at 4°C with different primary antibodies: rabbit anticalbindin-D28k, rabbit anticalretinin and rabbit antiparvalbumin (1:1,000; Swant, Belinzona, Switzerland), rabbit antiIba-1 (Wako Chemicals, Japan 1:1000) and rabbit antiglial fibrillary acidic protein (GFAP; 1:1,000; Dako, Denmark). After that, sections were incubated with biotinylated secondary antibodies (1:200; Sigma-Aldrich) for 2 h at room temperature and then incubated with the avidin-biotin-peroxidase complex (ABC; 1:200; Vector, Burlingame, CA). The peroxidase reaction was developed with 0.5 g/l diaminobenzidine in 0.1 mol/l PB and 0.1 ml/l H2O2, and immunoreacted sections were mounted on gelatinized slides. Stained sections were examined under a light microscope (Olympus BX61).
Since the shape and marking profile of PV-positive cells was well defined and they were not very numerous, they were counted manually by and experimenter blinded to the experimental conditions. Cell counts were carried out with Photoshop 5.0 software after acquiring digitized images with the microscope (Olympus BX61, 25×objective) equipped with a digital camera. GFAP, calbindin and calretinin immunostaining density in brain sections were determined using the ImageJ software (National Institute of Health), via which the regions of interest were defined and the corresponding intensity calculated.
Quantification of dopaminergic and serotonergic terminals
Tissue sample preparation
For dopamine and serotonin transporter quantification, the fresh brains of animals killed 96 h post MDMA administration were used. Crude membrane preparations from the hippocampus and striatum were prepared as described elsewhere (Escubedo et al., 2005). Samples were homogenized at 4°C in 20 volumes of buffer consisting of 5 mM Tris-HCl, 320 mM sucrose, and protease inhibitors (aprotinin 4.5 µg/µl, 0.1 mM phenylmethylsulfonyl fluoride, and 1 mM sodium orthovanadate), pH 7.4. The homogenates were centrifuged at 15,000 x g for 30 min at 4°C. The pellets were resuspended and centrifuged at 15,000 x g for 30 min at 4°C two more times. The final pellets (crude membrane preparation) were resuspended in the appropriate buffer and stored at -80°C until use in radioligand binding experiments. Protein content was determined using the Bio-Rad Protein Reagent, according to the manufacturer’s instructions.
DA and 5-HT transporter density
The density of DA transporter in mice striatal membranes was measured using [3H]WIN35428 binding assays. Membranes were resuspended in phosphate-buffered 0.32 M sucrose, pH 7.9 at 4°C to a concentration of 1 µg/µl. Striatal membrane assays were performed in glass tubes containing 250 µl of [3H]WIN 35428 (final radioligand concentration, 5 nM) and 50 µg of membranes. The tubes were incubated for 2 h at 4°C and non-specific binding was determined in the presence of 30 µM bupropion.
The density of 5-HT transporter in the hippocampal membranes was quantified by measuring the specific binding of 0.05 nM [3H]paroxetine after incubation with 150 µg
of protein at 25ºC for 2 h in a Tris-HCl buffer (50 mM, pH 7.4), containing 120 mM NaCl and 5 mM KCl to a final volume of 1.6 ml. Clomipramine (100 µM) was used to determine non-specific binding.
All incubations were finished by rapid filtration under vacuum though GF-51 glass fibre filters (Schleicher and Schuell, Dassel, Germany). The radioactivity in the filters was measured by liquid scintillation spectrometry.
Neuronal cell cultures
Primary neuronal cultures of cerebral cortex were obtained from mice embryos (E-16-18) as described by Crespo-Biel et al. [24] with minor modifications adapted to cortical cells. Cell viability was assessed using two different methods, calcein and MTT, because these two assays use a different endpoint to assess cell viability (intracellular esterase activity and mitochondrial dehydrogenase, respectively).
Calcium and sodium fluorimetry
Increases in intracellular Ca2+ and Na+ levels were monitored as described by García-Ratés et al. (Garcia-García-Ratés et al., 2010) using Ca2+-sensitive dye Fluo-4 AM (3 μM) and Na+-sensitive dye Corona-Green (3 μM). The fluorescence measurements were continued for a further 60 s or 300 s. To normalize Fluo-4 or Corona-Green signals, the responses from each well were calibrated by determining the maximum and minimum fluorescence values. This was done by adding 2 μM ionomicyn (Fmax) followed by 10 mM EGTA (Fmin) in calcium experiments, and 1 mM gramicidin (Fmax) or tyrode without sodium (Fmin). Peak fluorescence responses in each well were calculated as a percentage of (Fmax−Fmin). The measure times were decided to determine the
short-time effect of this substance on the cells' homeostasis (6h) and to mimic the schedule of in vivo treatment because kainate was administered 48h after the last dose of MDMA.
Data analysis
The results of the assays were compared by one-way ANOVA with Bonferroni post-hoc test. All data are presented as mean ± SEM, and differences are considered significant at *p<0.05, **p<0.01, and ***p<0.001. The incidence of convulsions was evaluated by the Fisher’s exact test. To facilitate the understanding of the results, some F’s has been moved to the figures’legends.
RESULTS
All weekly MDMA doses induced a significant increase in body temperature. Mild hyperthermia was apparent after MDMA 5 mg/kg (36.58 ± 0.35ºC MDMA; saline: 36.02 ± 0.44ºC; p<0.05), MDMA 7.5 mg/kg (37.56 ± 0.39ºC MDMA; saline: 36.44 ± 0.51ºC; p<0.001 second week; 37.91 ± 0.13ºC MDMA; saline: 36.70 ± 0.44ºC; p<0.0.001 third week) and 10 mg/kg (37.83 ± 0.69ºC MDMA; saline: 36.39 ± 0.52ºC; p<0.001).
We investigated whether this recreational exposure could provoke a neurotoxic effect on neuronal terminals. In the hippocampus of animals killed 4 days post-treatment, we detected a non-significant decrease in the density of [3H]paroxetine binding sites, corresponding to serotonergic terminals (100 ± 4.8% saline, 84.33 ± 5.35% MDMA, p=0.10). Similarly, when assessing the dopaminergic terminal injury in striatum by labeling the dopamine transporter with [3H]WIN35428, we found no significant change in density (100 ± 8.69% saline, 99.85 ± 8.63% MDMA, p=0.99).
MDMA decreases seizure threshold and increased kainic acid neurotoxicity in mouse hippocampus
The administration of MDMA plus KA sensitized mice to a seizure state (Table 1). We treated mice with saline plus KA 20 mg/kg and found that this dose convulsed only 6.25% of the animals (1/16) with a time lag of 58 minutes and seizure intensity of 1.8 However, previous treatment with MDMA favoured the seizure state; 64.3% mice that had undergone pre-treatment showed seizures (4th stage) when KA was administered
(9/14), the latency time was reduced by half, while seizure intensity was potentiated (3.6).
As shown in Table 1, mice treated with saline plus KA 30 mg/kg showed a more severe convulsive state (7/8, 87.5%) with a latency of 1 hour and seizure intensity of 4.6. Interestingly, those mice that had previously been treated with MDMA all convulsed, with a latency reduced by half. However, although the mean value of intensity obtained was higher (5.2) it did not reach statistical significance. Only this group (M+KA30) experienced fatalities after KA administration (25%).
To evaluate neurodegeneration, Fluoro-Jade B staining was performed at 24 h or 72 h after KA administration. No labeled cells were seen in hippocampus of saline or M group. In Figure 2 we show that pretreatment with MDMA significantly enhanced the presence of degenerating neurons due to KA 30 mg/kg in the hippocampal area CA1 at 24 h. However, KA neurotoxicity was not modified in other hippocampal areas such as CA3 and the dentate gyrus (DG). Similar results were obtained 72 h post KA dosage. The administration of KA 20 mg/kg did not give rise to Fluoro-Jade B-positive staining, and MDMA pretreatment did not modify staining (data not shown). Thus, the combined data demonstrate that this MDMA treatment specifically potentiates KA 30 mg/kg neuronal toxicity, which implies the involvement of the CA1 hippocampal area.
Glial and microglial activation in mouse hippocampus
First we evaluated microglial activation using a specific marker of these non-neuronal cells, namely IBA-1. Our data demonstrated that there was mild hippocampal microglial activation in groups M, K20 or M+K20, which did not reach significance. In contrast,
mice treated with KA 30 mg/kg showed activation, which was not enhanced by the recreational MDMA pretreatment (F3,12= 5.809, p<0.05, see Figure 3).
It is well known that KA favours hippocampal glial activation in rodents after an excitotoxic treatment. Recreational MDMA pretreatment enhances astrogliosis (measured using a specific antibody GFAP) in mice treated with 30 mg/kg KA (CA1: F3,33= 9.540, p<0.0001, DG: F3,33= 21.971 p<0.001, see Figure 4). However, given the lack of degenerative neurons in the hippocampus of mice treated with KA 20 mg/kg, no astroglial activation was observed at this dose, in either saline- or MDMA-pretreated animals.
Evaluation of the calcium binding proteins: parvalbumin, calbindin and calretinin CaBP afford neuroprotection by preventing the sustained increase of intracellular calcium. The effects of treatments on the expression of these proteins in the hippocampus were determined using parvalbumin, calbindin and calretinin immunostaining. It is known that the immunoreactivity to these CaBP was reduced as a consequence of KA treatment (Junyent et al., 2011).
In our experiments, exposure to MDMA plus saline resulted in a significant reduction in PV-positive GABA neurons that became more apparent 72 after saline administration in the DG (Figures 5 and 6 and supplementary information A and B). The percentage final reduction by MDMA compared to control animals in this neuron type was about 68% in the DG and 48% in CA1. Mice treated with KA 20 mg/kg and 30 mg/kg also exhibited a more significant reduction in DG immunostaining than in CA1. Moreover, immunohistochemistry data show a decrease in this protein in the DG of mice treated
with the combination M+KA20 (24 h: 63.99 ± 6.47% KA20, 38.61 ± 8.76% M+KA20,p=0.0802; 72 h: 57.77 ± 2.48% KA20, 39.53 ± 14.26% M+KA20,p<0.05).
With regard the protein calbindin (CB), the immunohistochemistry data at 24 h showed a significant decrease in this protein in the CA1 area (75.3%) and also in the DG granular zone (37.3%) after treatment with MDMA plus saline. This decline was also apparent in animals treated with KA 30 mg/kg (70.4% CA1; 70% DG)(;) Animals exposed to MDMA plus KA 20 mg/kg or KA 30 mg/kg did not show any enhancing effect versus kainate alone (Figures 5 and 6, supplementary information C). The parallelism between the two substances, MDMA and KA 30 mg/kg, was also evident in the results obtained at later times. Thus in all groups, after 72 h, calbindin levels exceeded and immunostaining values returned to control values
It is well known that CR is expressed in the population of GABAergic neurons known as interneuron-specific cells (Gulyás et al., 1999). In our study, the density of CR-immunostaining was significantly reduced 24 h after exposure to KA30 or MDMA, and this decrease was more apparent in CA1 (98.4% MDMA, 72.2% KA30) than in the DG (25.6% MDMA, 18.9% KA30)(Figures 5 and 6, supplementary information D) After 72h post kainate administration all values did not differ from saline. Animals exposed to MDMA plus KA 20 mg/kg or KA 30 mg/kg did not show any enhancing effect.However, there are also a small number of CR immunoreactive granule cells, mainly in the infragranular zone of the granular layer of the DG (see a supplementary information D). It has been reported that kainate causes the proliferation of these cells (Domínguez et al., 2003). Our data indicate that when animals were exposed to MDMA, concomitantly with the loss of CR-immunostaining in the hippocampus molecular layer, there was a substantial increase of it in small cells in the infragranular
zone (Saline: 100±4.61%; MDMA 48 h: 134.65±10.08%; MDMA 96 h: 133.45±8.71%, F=7.295, p<0.01), as also occurred in response to kainate.
Evaluation of intracellular calcium in cortical neuronal cultures
The entry of calcium into neurons is strongly associated with seizures (Meyer, 1989; McNamara, 1992) and the sustained entry induces excitotoxicity, leading to alterations of mitochondria and subsequent cell death (Cano-Abad et al., 2001). CaBP are crucial for calcium homeostasis in neurons (Baimbridge et al., 1992). When changes in CaBP levels are detected, this preludes fluctuations in intracellular calcium levels
Since in vivo results demonstrate that MDMA induces changes in CaBP, the next series of experiments were carried out to determine whether MDMA increases cytosolic calcium in cultures of cortical cells or potentiates the calcium influx induced by the glutamatergic agonist. As KA induced a very low entry of calcium in these cultures, we used NMDA (N-methyl-D-aspartate), the agonist of NMDA receptors. Endogenous glutamate (released by activation of kainate presynaptic receptor) activates those highly Ca2+ permeable ionotropic receptors.
Prior to the experiments about calcium levels, we confirmed that the MDMA concentrations used (10–100 µM) have no effect on cortical cell viability (calcein assay 48 h: saline 100.00 ± 2.61%, MDMA 100 µM 107.98 ± 3.79%, n.s.; MTT assay 48 h: saline 100.00 ± 1.75%, MDMA 100 µM 102.92 ± 2.21%, n.s.)
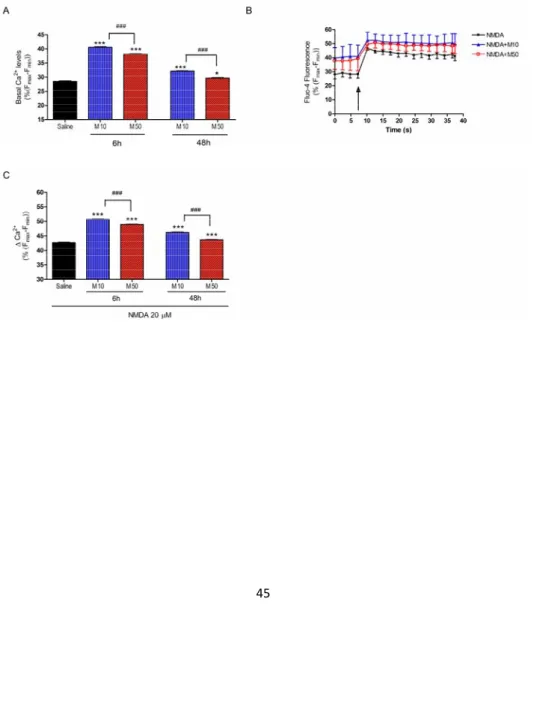
Figure 7A shows that pre-treatment of cortical neurons (6 h and 48 h) with different concentrations of MDMA (10–50 μM) significantly increased basal cytosolic free
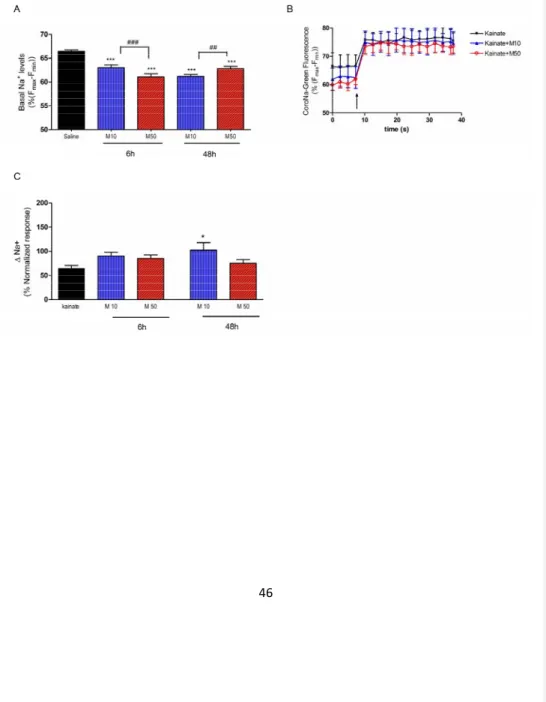
Ca2+(F4,49=1258.7, p<0.001)). MDMA exhibited an inverse concentration- and time-dependent effect (MDMA 10 or 50 µM higher increases at 6 h than 48 h). According to these results, MDMA sensitizes cortical neurons to maintain elevated intracellular levels of calcium and this effect is more apparent at low doses and shorter times after MDMA exposure. Likewise, after this pre-incubation we treated cortical neurons with 20 μM NMDA. This glutamatergic agonist induced a rapid increase in fluorescence that was maintained for more than 5 min (results not shown). When values of calcium concentration were averaged out between 20–30 s after MDMA addition, we found a higher calcium increase when preincubation with the amphetamine derivative was carried out (F4,64=650.60, p<0.001) This potentiation was more apparent when using a short period of preincubation and low MDMA concentrations (see Figures 7B and 7C). In parallel with these changes in calcium homeostasis, basal levels of intracellular sodium were decreased (F4,64=650.60, p<0.001)48h)(Figure 8A). When a challenge of Kainate 500 μM were administered to the cells, the Na+ entry was higher in the cells pre-treated with 10 μM MDMA of both times, reaching the value of kainate alone even starting from lower levels (F4,45=3.281 p<0.05) (Figure 8B,C).
DISCUSSION
The recreational consumption of amphetamines may be responsible for a significant proportion of drug-induced seizures. Thus it has been reported that MDMA induces seizures as a consequence of its brain neurotoxicity (Holmes et al., 1999), but other hypotheses have been proposed in order to explain the proconvulsant mechanism of MDMA. Seizures could be attributed to the metabolic effects of MDMA, mainly acute hyponatraemia combined with the hyperthermia that usually affects MDMA users. Clinical studies also suggest that the effects of MDMA modulation of the brain monoamine systems, specifically serotonin and norepinephine, could be responsible for lowering the seizure threshold. Other authors (Giorgi et al., 2006) reported the lack of mossy fiber sprouting at short time intervals following MDMA (2 weeks) as a possible explanation to this adverse effect, and recent data (Anneken and Gudelsky, 2012) lead to the conclusion that glutamate release could be involved in the development of seizures.
Few experimental studies have analysed the last hypothesis. In the present study we investigated the effect of a recreational schedule of MDMA on neurotoxicity and seizures induced by KA. Systemic KA is a potent means of inducing limbic seizures with a primary action in the hippocampus between other areas (Lothman et al., 1981). When administered at high doses (30 mg/kg), KA can also induce neurotoxic injuries in the “resistant” strain C57BL/6 (Benkovic et al., 2006).
One of the most important results of the present study is that MDMA potentiated KA neurotoxicity in the hippocampus and altered calcium homeostasis. These alterations
combined with a depletion of CaBP, markers of specific GABAergic subpopulations, can explain the increased susceptibility to KA-induced seizures. Our results are consistent with a role of MDMA in altering mouse brain excitability and unveiling proconvulsant activity in the presence of glutamate release. Giorgi and colleagues (Giorgi et al., 2005) also found evidence of this phenomenon, although they used different MDMA exposure. In our study, the increased susceptibility to seizures was specifically observed in response to low doses of KA (20 mg/kg), such that MDMA decreased the latency and increased the seizure intensity and the number of mice with seizures with respect to KA alone.
As mentioned above, one of the most interesting results of the present study is the increased neuronal cell death in hippocampal neurons in area CA1 in the treatment group M+K30. Other hippocampal areas (the CA3 and the DG) were not affected by MDMA pretreatment. We also analysed microgliosis and astrogliosis as characteristics of KA-induced neurodegeneration. Interestingly, MDMA pretreatment, by itself, was not able to trigger hippocampal astro- or microgliosis. However, 30 mg/kg but not 20 mg/kg KA induced hippocampal injury, astrogliosis and microglial activation, which is generally believed to contribute to neuroinflammation and neurodegeneration (Penkowa et al., 2001; Ravizza et al., 2005). The absence of these glial responses in MDMA group was reasonable, since the recreational regimen applied was not sufficient to produce a great degree of neuronal damage (non Fluoro-Jade B immunoreactive neurons, non-significant loss of serotonergic and dopaminergic terminals)(Colado et al., 2001; O’Callaghan and Miller, 1994).
not show a significant effect of the applied treatment, this does not completely exclude minor disruptions or other consequences of MDMA exposure (Frenzilli et al., 2007). Such consequences probably exist as this treatment with MDMA is able to potentiate the astrogliosis and neurotoxic effects of KA 30 mg/kg. Anneken et al. (2013) concluded that, within the hippocampus, MDMA produces neuroinflammatory mediators and a subsequent increase in glutamate release. This assumption could explain the enhancement of KA-induced neurodegeneration obtained in our experiments.
A large proportion of the GABAergic neurons in the hippocampal formation have been shown to express CaBP, thus these proteins are useful markers of specific interneuron subpopulations. CaBP act as intracellular facilitators of calcium diffusion or as intracellular calcium buffering systems. Since an increase in intracellular calcium levels triggers molecular events related to neuronal degeneration, it has been suggested that CaBP protect against calcium overload, rendering neurons more resistant to various toxic insults and neurodegenerative diseases (Lukas and Jones, 1994; Figueredo-Cardenas et al., 1998; Tsuboi et al., 2000). However, the efficacy of reduced CaBPs as markers of neuronal death in the epileptic hippocampus has been challenged. In a study by Kim et al. (Kim et al., 2006) the expression of CaBPs was reduced in the hippocampus in a stimulus-dependent manner following electroconvulsive shock, and recovered to the control level later. It was concluded that the reduced expression of CaBPs induced by seizure activity may be indicative of the hyperactivity of CaBP-positive neurons, which is a practical consequence of the abnormal discharge, and that they may play an important role in regulating seizure activity.
Our results demonstrated an early decrease in the expression of these different molecular markers when animals were exposed to high epileptogenic doses of KA, and we have also shown that exposure of adolescent mice to recreational doses of MDMA produces a similar profile of CaBPs.
MDMA greatly reduced CB levels in CA1 hippocampus 48 h post-administration. This robust reduction can be attributed also to the fact that serotonergic afferents from the median raphe nucleus, which are affected by MDMA (Sharkey et al., 1991), were shown to heavily innervate CB-containing GABAergic interneurons in the hippocampus (Freund et al., 1990). As expected, in general, this MDMA- and KA-induced decrease was reversed later. Similar results were obtained in the dentate gyrus, but surprisingly, CB levels in groups M and M+K30 (not shown) did not return to basal values and even exhibited a recovery response that could be due to a rebound neuronal response leading to a possible process of neuroprotection (Monje et al., 2001; Yenari et al., 2001). CR immunoreactivity showed a similar profile to that of CB, with comparable effects in the K30 and MDMA groups 24 h after completing treatment.
Additionally, both treatments increased CR immunoreactivity of granule cells in the infragranular zone of DG, which are considered to be recently generated neurons (Liu et al., 1996). It is known that after KA-induced hippocampal damage, the number of CR immunoreactive cells present in the subgranular layer increases significantly (Domínguez et al., 2003). These cells could represent a reservoir of pre-existing not completely differentiated granule cells. Surprisingly, MDMA exposure induced a similar intensification of this marker. This adds to the evidence of parallel effects of KA and the psychostimulant, which should not be surprising when one considers that this amphetamine derivative triggers glutamate release (Anneken and Gudelsky, 2012).
In the present study we also found that MDMA reduces the number of PV-positive neurons and that this effect is more evident at 96 h post MDMA administration. Moreover, KA 20 mg/kg decreases PV expression in DG, as does the combination MDMA+KA20. The reduction in PV interneuron activity has been reported to be associated with an increase in the risk of epileptogenic processes, thus increasing the susceptibility to seizures (Sloviter et al., 2001).
Finally, another interesting outcome of our study is the evidence that in cultures of cortical neurons low concentrations of MDMA (10–50 μM) increase basal intracellular calcium concentrations. Our data thus suggest that previous exposure to MDMA sensitizes neurons to maintain high intracellular levels of calcium and potentiates the glutamate agonist response to an acute challenge of NMDA. These in vitro results could contribute to explain the observed in vivo changes in CaBP density. The reduction in basal intracellular sodium concentrations could also add to destabilize neuronal ionic homeostasis, accomplishing that Na+ entry increases, when cells are expose to kainate administration..
In conclusion, the results of the present study provide evidence that the schedule of MDMA used, by itself, does not induce neuronal damage but potentiates the presence of degenerating neurons in CA1 due to KA 30 mg/kg exposure and increases seizure susceptibility in all KA treatments. The MDMA-induced decrease in CaBP immunoreactivity, especially in the PV-positive neurons, may affect the excitability of hippocampal networks. The proconvulsant effect of MDMA correlates with modifications in these hippocampal interneurons markers and, interestingly, run in
parallel with the changes induced by KA. It can be speculated that these CaBP modifications could be the consequence of either a direct mechanism involving changes in calcium homeostasis or/and an indirect effect through glutamate release. Recently, it has been described that MDMA increases glutamate release in the dorsal hippocampus of rats (Anneken and Gudelsky, 2012), but our in vitro results point to changes in calcium homeostasis as an additional molecular event that can contribute also to these GABAergic modifications. The variation of the ionic balance observed in the cortical cells after the incubation with MDMA could explain that the responses to the depolarizing stimuli have been altered.. Probably other mechanisms such as free radical production or the modification on mossy fiber sprouting could also promote this convulsive susceptibility.
Acknowledgements
The authors acknowledge the Language Advisory Service of the University of Barcelona for editing the language of the manuscript.
Authorship Contributions
CA and EE were responsible for the study concept and design. AS carried out the experimental work. CJ, EE and PD assisted with data analysis and AC with immunoassays methodology. EE drafted the manuscript, CA and JF assisted with interpretation of findings. AC, PD and PM provided critical revision of the manuscript for important intellectual content. All authors critically reviewed content and approved final version for publication.
Conflict of Interest Statement
The authors disclose any potential conflict of interest including financial, personal or other relationships with other people or organizations that could inappropriately influence the present work.
REFERENCES:
Anneken JH, and Gudelsky GA (2012) MDMA produces a delayed and sustained increase in the extracellular concentration of glutamate in the rat hippocampus. Neuropharmacology 63:1022–1027.
Baimbridge KG, Celio MR, and Rogers JH (1992) Calcium-binding proteins in the nervous system. Trends Neurosci 15:303–308.
Ben-Ari Y, and Cossart R (2000) Kainate, a double agent that generates seizures: two decades of progress. Trends Neurosci 23:580–587.
Benkovic SA, O’Callaghan JP, and Miller DB (2006) Regional neuropathology following kainic acid intoxication in adult and aged C57BL/6J mice. Brain Res 1070:215–231.
Brown JWL, Dunne JW, Fatovich DM, Fatovic DM, Lee J, and Lawn ND (2011) Amphetamine-associated seizures: clinical features and prognosis. Epilepsia 52:401–404.
Cano-Abad MF, Villarroya M, García AG, Gabilan NH, and López MG (2001) Calcium entry through L-type calcium channels causes mitochondrial disruption and chromaffin cell death. J Biol Chem 276:39695–39704.
Capela JP, Ruscher K, Lautenschlager M, Freyer D, Dirnagl U, Gaio AR, Bastos ML, Meisel A, and Carvalho F (2006) Ecstasy-induced cell death in cortical neuronal cultures is serotonin 2A-receptor-dependent and potentiated under hyperthermia.
Cavazos JE, Jones SM, and Cross DJ (2004) Sprouting and synaptic reorganization in the subiculum and CA1 region of the hippocampus in acute and chronic models of partial-onset epilepsy. Neuroscience 126:677–688.
Chipana C, Camarasa J, Pubill D, and Escubedo E (2006) Protection against MDMA-induced dopaminergic neurotoxicity in mice by methyllycaconitine: involvement of nicotinic receptors. Neuropharmacology 51:885–895.
Domínguez MI, Blasco-Ibáñez JM, Crespo C, Marqués-Marí AI, and Martínez-Guijarro FJ (2003) Calretinin/PSA-NCAM immunoreactive granule cells after hippocampal damage produced by kainic acid and DEDTC treatment in mouse. Brain Res 966:206–217.
Escubedo E, Chipana C, Pérez-Sánchez M, Camarasa J, and Pubill D (2005) Methyllycaconitine prevents methamphetamine-induced effects in mouse striatum: involvement of alpha7 nicotinic receptors. J Pharmacol Exp Ther 315:658–667.
Figueredo-Cardenas G, Harris CL, Anderson KD, and Reiner A (1998) Relative resistance of striatal neurons containing calbindin or parvalbumin to quinolinic acid-mediated excitotoxicity compared to other striatal neuron types. Exp Neurol 149:356–372.
Frenzilli G, Ferrucci M, Giorgi FS, Blandini F, Nigro M, Ruggieri S, Murri L, Paparelli A, and Fornai F (2007) DNA fragmentation and oxidative stress in the hippocampal formation: a bridge between 3,4-methylenedioxymethamphetamine
(ecstasy) intake and long-lasting behavioral alterations. Behav Pharmacol 18:471–481.
Freund TF, Gulyás AI, Acsády L, Görcs T, and Tóth K (1990) Serotonergic control of the hippocampus via local inhibitory interneurons. Proc Natl Acad Sci U S A 87:8501–8505.
Garcia-Ratés S, Camarasa J, Sánchez-García AI, Gandía L, Escubedo E, and Pubill D (2010) The effects of 3,4-methylenedioxymethamphetamine (MDMA) on nicotinic receptors: intracellular calcium increase, calpain/caspase 3 activation, and functional upregulation. Toxicol Appl Pharmacol 244:344–353.
Giorgi FS, Lazzeri G, Natale G, Iudice A, Ruggieri S, Paparelli A, Murri L, and Fornai F (2006) MDMA and seizures: a dangerous liaison? Ann N Y Acad Sci 1074:357–364.
Giorgi FS, Pizzanelli C, Ferrucci M, Lazzeri G, Faetti M, Giusiani M, Pontarelli F, Busceti CL, Murri L, and Fornai F (2005) Previous exposure to (+/-) 3,4-methylenedioxymethamphetamine produces long-lasting alteration in limbic brain excitability measured by electroencephalogram spectrum analysis, brain metabolism and seizure susceptibility. Neuroscience 136:43–53.
Green AR, Mechan AO, Elliott JM, O’Shea E, and Colado MI (2003) The pharmacology and clinical pharmacology of 3,4-methylenedioxymethamphetamine (MDMA, “ecstasy”). Pharmacol Rev 55:463–508.
Hammersley R, Ditton J, Smith I, and Short E (1999) Patterns of ecstasy use by drug users. Br J Criminol 39:625–647.
Holmes SB, Banerjee AK, and Alexander WD (1999) Hyponatraemia and seizures after ecstasy use. Postgrad Med J 75:32–33.
Junyent F, De Lemos L, Utrera J, Paco S, Aguado F, Camins A, Pallàs M, Romero R, and Auladell C (2011) Content and traffic of taurine in hippocampal reactive astrocytes. Hippocampus 21:185–197.
Junyent F, Porquet D, de Lemos L, Romero R, Utrera J, Camins A, Pallàs M, and Auladell C (2011) Decrease of calbindin-d28k, calretinin, and parvalbumin by taurine treatment does not induce a major susceptibility to kainic acid. J Neurosci Res 89:1043–1051.
Kim J-E, Kwak S-E, Kim D-S, Won MH, Kwon O-S, Choi S-Y, and Kang T-C (2006) Reduced calcium binding protein immunoreactivity induced by electroconvulsive shock indicates neuronal hyperactivity, not neuronal death or deactivation. Neuroscience 137:317–326.
Kondratyev A, and Gale K (2004) Latency to onset of status epilepticus determines molecular mechanisms of seizure-induced cell death. Brain Res Mol Brain Res 121:86–94.
Leite JP, Garcia-Cairasco N, and Cavalheiro EA (2002) New insights from the use of pilocarpine and kainate models. Epilepsy Res 50:93–103.
Liu Y, Fujise N, and Kosaka T (1996) Distribution of calretinin immunoreactivity in the mouse dentate gyrus. I. General description. Exp Brain Res 108:389–403.
Logan BJ, Laverty R, Sanderson WD, and Yee YB (1988) Differences between rats and mice in MDMA (methylenedioxymethylamphetamine) neurotoxicity. Eur J Pharmacol 152:227–234.
Lothman EW, Collins RC, and Ferrendelli JA (1981) Kainic acid-induced limbic seizures: electrophysiologic studies. Neurology 31:806–812.
Lukas W, and Jones KA (1994) Cortical neurons containing calretinin are selectively resistant to calcium overload and excitotoxicity in vitro. Neuroscience 61:307– 316.
McNamara JO (1992) The neurobiological basis of epilepsy. Trends Neurosci 15:357– 359.
Meldrum BS (2000) Glutamate as a Neurotransmitter in the Brain: Review of Physiology and Pathology. J Nutr 130:1007S–1015S.
Meyer FB (1989) Calcium, neuronal hyperexcitability and ischemic injury. Brain Res Rev 14:227–243.
Meyer JS, Piper BJ, and Vancollie VE (2008) Development and characterization of a novel animal model of intermittent MDMA (“Ecstasy”) exposure during adolescence. Ann N Y Acad Sci 1139:151–163.
Monje ML, Phillips R, and Sapolsky R (2001) Calbindin overexpression buffers hippocampal cultures from the energetic impairments caused by glutamate. Brain Res 911:37–42.
Niquet J, Ben-Ari Y, and Represa A (1994) Glial reaction after seizure induced hippocampal lesion: immunohistochemical characterization of proliferating glial cells. J Neurocytol 23:641–656.
O’Callaghan JP, and Miller DB (1994) Neurotoxicity profiles of substituted amphetamines in the C57BL/6J mouse. J Pharmacol Exp Ther 270:741–751.
Penkowa M, Molinero A, Carrasco J, and Hidalgo J (2001) Interleukin-6 deficiency reduces the brain inflammatory response and increases oxidative stress and neurodegeneration after kainic acid-induced seizures. Neuroscience 102:805– 818.
Pubill D, Canudas AM, Pallàs M, Camins A, Camarasa J, and Escubedo E (2003) Different glial response to methamphetamine- and methylenedioxymethamphetamine-induced neurotoxicity. Naunyn Schmiedebergs Arch Pharmacol 367:490–499.
Racine RJ (1972) Modification of seizure activity by electrical stimulation. II. Motor seizure. Electroencephalogr Clin Neurophysiol 32:281–294.
Ravizza T, Rizzi M, Perego C, Richichi C, Velísková J, Moshé SL, De Simoni MG, and Vezzani A (2005) Inflammatory response and glia activation in developing rat hippocampus after status epilepticus. Epilepsia 46 (Suppl 5):113–117.
Represa A, Niquet J, Pollard H, and Ben-Ari Y (1995) Cell death, gliosis, and synaptic remodeling in the hippocampus of epileptic rats. J Neurobiol 26:413–425.
Santos JB, and Schauwecker PE (2003) Protection provided by cyclosporin A against excitotoxic neuronal death is genotype dependent. Epilepsia 44:995–1002.
Sharkey J, McBean DE, and Kelly PA (1991) Alterations in hippocampal function following repeated exposure to the amphetamine derivative methylenedioxymethamphetamine (“Ecstasy”). Psychopharmacology 105:113– 118.
Sloviter RS, Ali-Akbarian L, Horvath KD, and Menkens KA (2001) Substance P receptor expression by inhibitory interneurons of the rat hippocampus: enhanced detection using improved immunocytochemical methods for the preservation and colocalization of GABA and other neuronal markers. J Comp Neurol 430:283–305.
Smith RF (2003) Animal models of periadolescent substance abuse. Neurotoxicol Teratol 25:291–301.
Sonn K, Pankratova S, Korshunova I, Zharkovsky A, Bock E, Berezin V, and Kiryushko D (2010) A metallothionein mimetic peptide protects neurons against kainic acid-induced excitotoxicity. J Neurosci Res 88:1074–1082.
Spanos LJ, and Yamamoto BK (1989) Acute and subchronic effects of methylenedioxymethamphetamine [(+/-)MDMA] on locomotion and serotonin syndrome behavior in the rat. Pharmacol Biochem Behav 32:835–840.
Tsuboi K, Kimber TA, and Shults CW (2000) Calretinin-containing axons and neurons are resistant to an intrastriatal 6-hydroxydopamine lesion. Brain Res 866:55–64.
Yenari MA, Minami M, Sun GH, Meier TJ, Kunis DM, McLaughlin JR, Ho DY, Sapolsky RM, and Steinberg GK (2001) Calbindin d28k overexpression protects striatal neurons from transient focal cerebral ischemia. Stroke 32:1028–1035.
Zagnoni PG, and Albano C (2002) Psychostimulants and epilepsy. Epilepsia 43 (Suppl 2):28–31.
Financial support
Sonia Abad received a fellowship from the Institut de Biomedicina (IBUB, University of Barcelona). Funding for this study was provided by the Spanish Ministerio de Ciencia e Innovación (SAF2010-15948; SAF2011-23631 and SAF2012-39852-C02-01) and by the Generalitat de Catalunya.
Legends for figures:
FIGURE 1: Treatment schedule. Animals were randomly assigned to the following treatment groups: saline+saline, MDMA+saline (M), saline+kainate 20 mg/kg (KA20), MDMA+kainate 20 mg/kg (M+KA20), saline+kainate 30 mg/kg (KA30), MDMA+kainate 30 mg/kg (M+KA30). The animals (n=7–10 for each treatment group in each experiment) received a chronic dosage regimen of saline (5 ml/kg) or MDMA t.i.d. (s.c, every 3 h) on 1 day a week, for 4 consecutive weeks. On the day of treatment, the environmental temperature was 26±1 °C and this was maintained until 2 h after the last dose. Twenty-four hours after the last dose of MDMA or saline, animals were exposed to KA i.p. 20 or 30 mg/kg. Latency and presence of seizures were recorded immediately after KA administration and the animals were killed 24 h or 72 h later.
FIGURE 2: Pretreatment with MDMA significantly enhanced the presence of degenerating neurons due to KA 30 mg/kg in hippocampal area CA1. Panel A and B show the number of Fluoro-Jade-positive neurons, in different hippocampal areas (CA1, CA3 and DG), 24 h and 72 h post KA30 mg/kg administration, respectively. C: Representative horizontal sections of hippocampal subfield CA1 (C1–C2 24 h and C3– C4 72 h post KA administration). *p<0.05 versus KA30 in the same area.
FIGURE 3: 24 h post KA administration mice were killed for histological analysis of microgliosis using Iba-1. Representative immunohistochemistry for Iba-1 expression in horizontal sections of hippocampus from animals treated with saline+saline (A,B) MDMA+saline (C,D), saline+KA 30 mg/kg (E,F) or MDMA+KA 30 mg/kg (G,H). Scale bars: 200 μm in the upper panels, 20 μm in the lower panels. Recreational MDMA
FIGURE 4: 3 days post KA administration mice were killed for histological analysis of astrogliosis using GFAP. Upper panel shows the quantification of GFAP immunostaining density in CA1 and DG areas of hippocampus. *p<0.05 and *** p<0.001 versus saline; ## p<0.01 versus K30 in the same area. Lower panels show representative immunohistochemistry for GFAP expression in horizontal sections of hippocampus from animals treated with saline+saline (A,B) MDMA+saline (C,D), saline+KA 30 mg/kg (E,F) or MDMA+KA 30 mg/kg (G,H). Scale bars: 200 μm in the upper panels, 20 μm in the lower panels. Recreational MDMA pretreatment enhanced KA-induced astrogliosis.
FIGURE 5: Effect of treatment on hippocampal parvalbumin (A,B), calbindin (C,D) and calretinin (E,F) immunoreactivity in CA1 of mouse groups: saline+KA 20 mg/kg (K20), saline+KA 30 mg/kg (K30) and MDMA+saline (MDMA), Left panel:
kainate effects; (F4,16=3.259 p<0.05 PV; F4,30=15.906 p<0.0010.001 CB; F4,41=24.584 p<0.001 CR) right panel: MDMA effects (F2,17=3.964 p<0.05 PV; F2,18=17.608 p<0.001 CB; F2,24=43.982 p<0.001). Temporal bars under figures display the
time elapsed between the last kainate or saline administration and sacrifice ; . *p<0.05; **p<0.01and ***p<0.001 versus. saline.
FIGURE 6: Effect of treatment on hippocampal parvalbumin (A,B), calbindin (C,D) and calretinin (E,F) immunoreactivity in dentate gyrus of mouse groups: saline+KA 20 mg/kg (K20), saline+KA 30 mg/kg (K30), MDMA+saline (MDMA).Left panel: kainate effects (F4,16=6.588 p<0.05 PV; F4,32=21.077 p<0.001 CB; F4,48=5.418 p<0.01 CR); right panel: MDMA effects (F2,17=13.91 p<0.001 PV; F2.17=13.475 p<0.001 CB; F2.29=13.158 p<0.001 CR). Temporal bars under figures display the
time elapsed between the last kainate or saline administration and sacrifice . *p<0.05; **p<0.01 and ***p<0.001 versus. saline.
FIGURE 7: Assays in cultured cortical cells. Effect of 6 h or 48 h preincubation with MDMA 10 (M10) or 50 µM (M50) on intracellular calcium levels. Panel A: basal intracellular calcium levels.. Panel B:time-course of the increases in Fluo-4 fluorescence after the addition of NDMA 20 µM (at the arrow), in cells pre-treated for 6 h with saline or MDMA 10 or 50 µM. Panel C: increase in cytosolic calcium induced by NDMA 20 µM (values of Fluo-4 were averaged between 20–30 s after MDMA addition).. *** p<0.001 versus saline; ### p<0.001 versus time-matched MDMA 50 µM.
FIGURE 8: Assays in cultured cortical cells. Effect of 6 h or 48 h preincubation with MDMA 10 (M10) or 50 µM (M50) on intracellular sodium levels. Panel A: basal intracellular sodium levels Panel B: time-course of the increases in Corona-Green fluorescence after the addition of Kainate 500µM (at the arrow), in cells pre-treated for 6 h with saline or MDMA 10 or 50 µM. Panel C: sodium entry values/entry after kainate administration. *p<0.05; *** p<0.001 versus saline; ## p<0.01 and ### p<0.001 versus time-matched MDMA 50 µM.
Table 1. Effects of treatment on motor seizures measured as number of animals with tonic–clonic convulsions, time delay to show them immediately after KA administration and seizure intensity (according to scale of severity explained in materials and methods
$
n/N: Number of animals that showed seizure episodes (4th stage)/number of animals per group. ***p<0.001 versus the corresponding kainate group.
Treatment group
Animals with seizures n/N$
Latency (min) Seizure intensity Mortality
MDMA+saline (M) 0/8 0 0 0/8
Saline+Kainate 20 mg/kg (KA20) 1/16 58.00 1.8 ± 0.2 0/16
MDMA+Kainate 20 mg/kg (M+KA20) 9/14*** 30.00 ± 4.87*** 3.6 ± 0.2*** 0/14
Saline+Kainate 30 mg/kg (KA30) 7/8 51.14 ± 6.36 4.6 ± 0.3 0/8