cocoa consumption
Running head: FFQ to assess cocoa consumption
Filipa Vicente, MSc1,2, Sandra Saldaña-Ruíz, PhD1, Manel Rabanal, PhD1, María J Rodríguez-Lagunas, PhD1,3, Paula Pereira,PhD2, Francisco J. Pérez-Cano, PhD1,3* and Margarida Castell, PhD1,3
1
Departament de Fisiologia, Facultat de Farmàcia, Universitat de Barcelona, Barcelona, Spain. E-Mails: [email protected] (F.V.), [email protected] (S.S.), [email protected]
(M.R.), [email protected] (M.J.), [email protected] (F.P.), [email protected] (M.C.).
2
Instituto Superior de Ciências da Saúde Egas Moniz, Egas Moniz Cooperativa de Ensino Superior, Monte da Caparica, Portugal; E-mail: [email protected]
3 Institut de Recerca en Nutrició i Seguretat Alimentària, Universitat de Barcelona (INSA-UB).
Author Contributions
F.V., S.S., M.R., P.P., F.P. and M.C. conceived and designed the questionnaire and global study design; F.V. and S.S. processed the initial data and conducted initial results analysis; F.V., S.S., M.J., F.P. and M.C. were involved in the interpretation of the data; all authors contributed to the critical revision of the manuscript; F.P. and M.C. had primary responsibility for the final content.
Word count: 4943 Number of Figures: 2 Number of Tables: 3 Corresponding author: Francisco J. Pérez-Cano Dept. Fisiologia Facultat de Farmàcia Universitat de Barcelona Av. Joan XXIII s/n
08028 Barcelona (Spain)
2 Abstract:
Objective: Cocoa has been highlighted as a food with potential benefits to human health because its content in polyphenols. However, few studies show the contribution of cocoa and chocolate products in polyphenol intake. The aim of this work was to develop a food frequency questionnaire (FFQ) for evaluating the intake of food products containing cocoa (C-FFQ).
Methods: A sample of 50 university students was recruited to complete the 90-item questionnaire, a validated questionnaire about chocolate and energy drink intake (EFSA-Q) as well as a 24-hour dietary recall (24HDR). Spearman’s correlation test, Bland-Altman plots and quintile classification analysis were conducted together with the Wilcoxon test and descriptive statistics.
Results: Significant correlations between the C-FFQ and the EFSA-Q for most common cocoa/chocolate products have been observed (p<0.05) as well between data from the C-FFQ and 24HDR (p<0.05). A variety of cocoa/chocolate products frequently consumed by the participants, were detected by the C-FFQ and 24HDR whereas they were not included in the EFSA-Q. According the C-FFQ, chocolate bars were the main source of cocoa in university students, but dairy products also provided an important amount of cocoa.
Conclusion: The developed C-FFQ questionnaire can be considered as a valid option for assessing the consumption frequency of cocoa/chocolate-derived products, thereby allowing the evaluation of cocoa polyphenol intake in further studies.
3 Introduction
Chocolate products are commonly consumed in the human diet and, depending on their cocoa content, can represent an important source of polyphenols, mainly flavonoids [1]. In fact, cocoa contains more phenolic antioxidant compounds than tea or red wine [2]. This antioxidant effects have made cocoa being extensively investigated for its potential benefits to human health [3].
Clinical studies have associated cocoa consumption with a decrease of several cardiovascular risk factors, because it improves vascular functions [4], shows anti-hypertensive effects [5], decreases insulin resistance [6], and reduced body weight/body fat [7]. Overall, a positive scientific opinion has existed on the substantiation of a health claim related to cocoa flavanols and vasodilatation [8]. The cocoa consumption has also beneficial effects on cancer prevention [9] and inflammatory diseases [10]. In light of all these data, cocoa consumption has gained importance in human dietary habits, and a growing interest is emerging in studying its further benefits to human health.
Polyphenols, present in cocoa and also in fruits, vegetables and beverages as tea, seem to be the main elements in cocoa protective actions. However, and in spite of being a great source of polyphenols – and chocolate, as a natural source of cocoa, is a widely consumed food – cocoa has not often been found among the top polyphenol sources consumed [11,12]. In fact, some data reveal that cocoa accounts for less than 10% of polyphenol intake [13]. This could be due to the different methodologies and the focus of the food frequency questionnaires (FFQs) used in these consumption studies. Most of the validated FFQs use an extensive food list for fruits and vegetables but poorly distinguishes the several chocolate and cocoa sources other than chocolate bars and snacks [14]. In general, FFQs poorly identify the important contribution from other product sources such as dairy, pastries, desserts, cereals and spreads [15]. Moreover, the cocoa percentage in chocolate bars is not always inquired about, though the presence of polyphenols is totally different among white, milk or the different types of dark chocolates [16,17]. These facts support the need for an assessment of cocoa product consumption in order to evaluate the actual cocoa intake, especially in the young population, who frequently consume chocolate without being aware of its benefits.
Thus, the aim of the present study was to develop an FFQ designed to assess the consumption of cocoa in the diet of a young and healthy population (i.e. university students). This would constitute a first phase of a bigger study focused on associating cocoa/chocolate consumption with healthy habits and lifestyle in Health Sciences university students.
4 Methods
Participants
The study population was recruited among students from several Health Science graduation and post-graduation programmes in the Faculty of Pharmacy at the University of Barcelona.
Procedure
The present study was conducted according to the guidelines laid down in the Declaration of Helsinki and the study protocol was approved by the Ethical Committee of the University of Barcelona (IRB 00003099). Written informed consent was obtained from all participants when aim and procedure of the study were described.
The participants were required to respond to a 24-hour dietary recall (24HDR), the developed C-FFQ and an EFSA questionnaire (EFSA-Q) (Gathering consumption data on specific consumer groups of energy drinks – Adults 18-65) [18], that was used as gold standard. Taking into account the weekend effect in 24HDR, the questionnaires were conducted between Thursday and Friday. The questionnaire was answered during the period from May to October in 2014.
Food Frequency Questionnaire to assess cocoa consumption (C-FFQ)
The C-FFQ was developed based on the ENCAT-2003 [19]. It was written in Spanish and included 90 food items that potentially contain polyphenols. A full version of the C-FFQ can be downloaded (http://diposit.ub.edu/dspace/handle/2445/60475).
The FFQ inquired for the average intake in the last year about the consumption of fruits, vegetables, and cereals, dairy products and confectionery (pastries and snacks) that can include chocolate. In addition, there were items devoted to asking which kind of chocolate bars the participant consumes and items related to cocoa/chocolate beverages and spreads. Finally, information relating to the intake of coffee, tea, and other beverages was requested.
The frequency of consumption of the 90 food items was assessed using 12 categories ranging from 1 (‘never’) to 12 (‘3 or more times per day’). The quantity of food items was specified as one portion or a piece.
Estimation of cocoa intake
To estimate the cocoa intake of each participant, the amount of cocoa per portion within each inquired item in the C-FFQ was calculated. For that, established portions were considered [20].
5
Moreover, due to the lack of information for some sources, food labels were analyzed in 5-7 products in each food category. The amount of each one was converted in cocoa amount per portion (Table A1).
Statistical Analysis
Data from cocoa/chocolate-derived products, tea and coffee consumption were converted into the number of portions ingested per day. To study agreement between the new FFQ and the EFSA-Q and the 24HDR, the correlation between data was calculated by both Spearman’s test and Bland-Altman plots. In addition, the consumption frequency data were compared using the non-parametric paired Wilcoxon test. Study participants were classified into quintile categories of either cocoa, tea or coffee consumers based on the distribution of data obtained from these assessments. Proportions of subjects misclassified were derived. Results were considered statistically significant at a two-tailed level of 0.05. Statistical analysis was performed using software package SPSS 22.0 (SPSS, Inc.).
6 Results
Sociodemographic and anthropometric characteristics
A total of 50 individuals completed the three questionnaires. The participants comprised 8 males and 42 females, 56% were undergraduate students and 42% were enrolled in one of the master’s or PhD studies within the several University of Barcelona programmes. Mean age was 24.10 years (SD= 3.29), mean BMI was 21.42 kg/m2 (SD = 2.27).
Consumption frequency
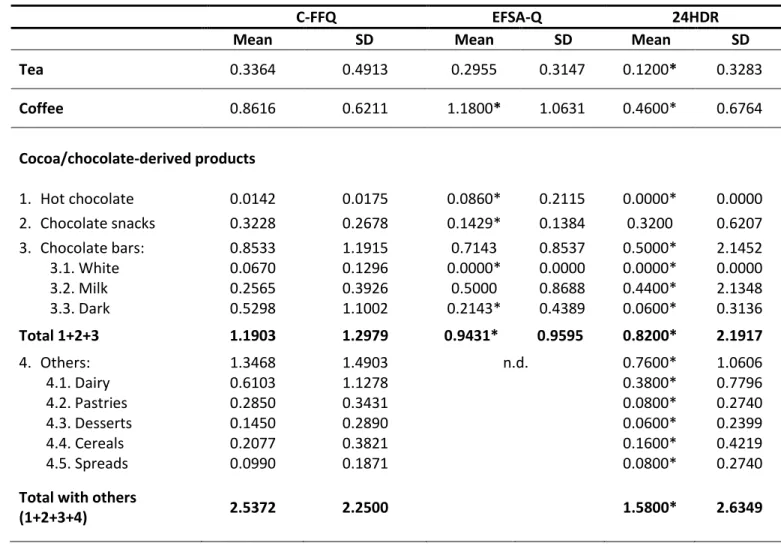
The consumption frequency of tea, coffee, hot chocolate, chocolate snacks and chocolate bars was assessed by the three questionnaires (Table 1). No differences were found between the C-FFQ and the EFSA-Q for tea consumption, but the 24HDR revealed a lower intake (p<0.05). With regard to coffee, the C-FFQ provided lower consumption frequency than the EFSA-Q (p<0.05), but higher than the 24HDR (p<0.05).
Focusing on cocoa/chocolate-derived products, the C-FFQ detected a lower consumption frequency of hot chocolate than the EFSA-Q but higher than 24HDR (p<0.05). The intake frequency of chocolate snacks according C-FFQ was higher than that in the EFSA-Q (p<0.05) and similar to 24HDR. When considering chocolate bars, similar consumption frequency between C-FFQ and EFSA-Q was found, although EFSA-Q showed a lower intake of white and dark chocolate bars (p<0.05). The C-FFQ also revealed a higher chocolate bar consumption frequency than 24HDR (p<0.05) that was mainly due to the intake of dark chocolate bars.
Unlike the EFSA-Q, the C-FFQ evaluated the particular consumption frequency of chocolate/cocoa in dairy, pastry, dessert, cereal and spread products, which could be compared to the 24HDR. The C-FFQ showed a significantly higher consumption of these products than the 24HDR (p<0.05).
After calculating the total consumption of cocoa/chocolate-derived products (Table 1), the consumption frequency from the C-FFQ was higher than that of the EFSA-Q and 24HDR (p<0.05).
Correlation between the C-FFQ and the EFSA-Q and 24HDR results
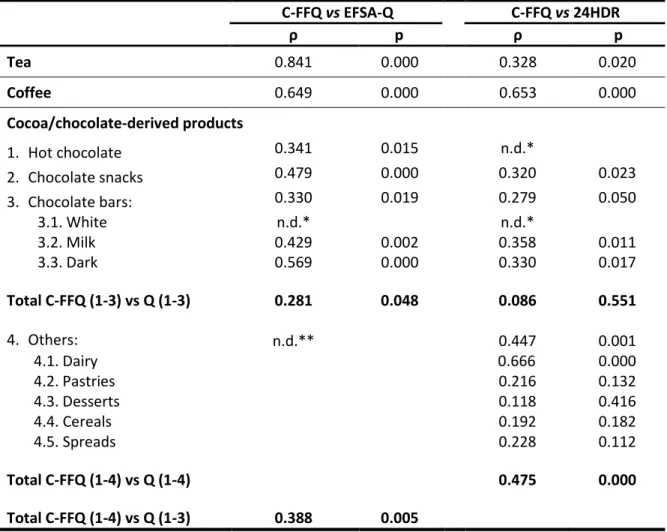
Results from the Spearman’s correlation analysis (Table 2) show positive correlations between the C-FFQ and the EFSA-Q for tea, coffee and particular and total cocoa/chocolate-derived products (p<0.05). Similarly, values from the C-FFQ and the 24HDR show positive correlations for tea, coffee, chocolate snacks and bars (Table 2). In addition, the consumption frequencies in both assessments correlated significantly (p<0.05) when considering dairy and total other products.
7
The Bland-Altman plots showed a similar pattern between the C-FFQ and the EFSA-Q and 24HDR methods for main items studied (Figure 1). The values of the difference in the daily intake frequency were almost zero. The mean difference of consumption frequency of total cocoa/chocolate products between C-FFQ vs EFSA-Q (0.247) was similar to that found in the C-FFQ vs 24HDR Bland-Altman plot (0.624).
Subject-categorized consumption
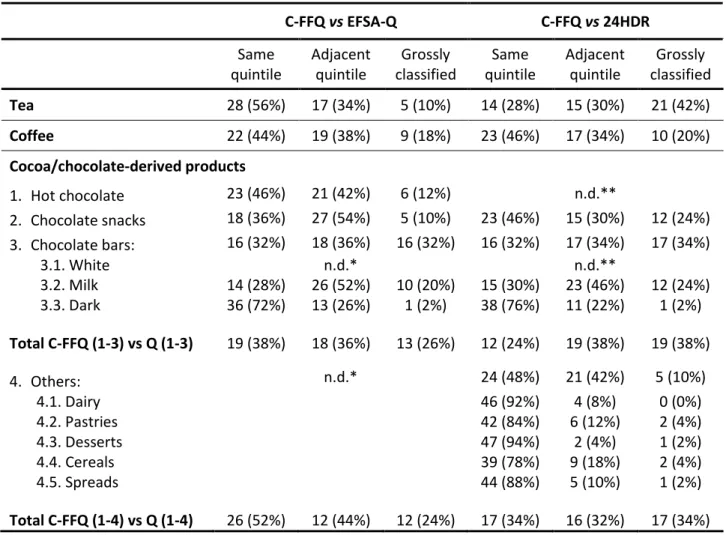
The degree of potential misclassification associated with categorized intakes assessed by the three questionnaires was examined as the proportion of participants classified in the same or adjacent quintile or grossly classified (Table 3). Overall, for the C-FFQ and the EFSA-Q, the majority of the individuals (60-98%) were classified in the same/adjacent quintile. Similarly, the percentage of individuals in the same/adjacent quintile by C-FFQ and 24HDR ranged between 58 and 100%.
Cocoa intake by the C-FFQ
We estimated the cocoa intake per day of each participant considering the amount of cocoa per portion within each inquired item in the C-FFQ (Figure 2). The cocoa consumption average per day in the student population was about 12 g, about 60% became from chocolate bars and 20% became from dairy products.
8 Discussion
In the present study, we have developed and evaluated a FFQ designed for the assessment of cocoa/chocolate products consumption through comparison to an EFSA-validated FFQ and to a 24-hours dietary recall. The results obtained show that C-FFQ is able to provide precise data of frequency consumption for total and particular common cocoa products.
Although, the 24HDR allows any cocoa form of the diet to be considered, it is very common to perform an FFQ instead of a dietary recall as it allows a broad food list to be included and regular and occasional intake to be assessed more easily. Therefore FFQ becomes an important tool for evaluating the consumption frequency of foods within a considerable population [21]. Some FFQs have been used for evaluating general or particular food consumption and among the products inquired about they included also those containing cocoa [20,22–24]. However, questions about cocoa/chocolate consumption do not include all possible products and do not deep enough into the type of chocolate, its cocoa percentage and, consequently, its polyphenol content. That is the reason we have developed a 90-item FFQ designed for the precise evaluation of cocoa/chocolate product intake (C-FFQ).
To evaluate the C-FFQ, recommendations [21] and other similar studies were considered, and the C-FFQ was compared with the validated EFSA-Q, which contains several common elements, and with a 24HDR [12,21,25–27]. Both approximations have been widely used as reference methods for developing new FFQ. To evaluate the C-FFQ, a small but sufficient number of participants were recruited [15].
Regardless of significant differences in the consumption frequency of particular products, the C-FFQ and the EFSA-Q displayed a similar pattern of consumption, a moderate correlation and good quintile classification and, in addition, Bland-Altman analyses agreement. C-FFQ includes a quite considerable number of foods with cocoa, that are absent in the EFSA-Q and also in other questionnaires with more items [20,22,27]. For this reason, the total frequency of cocoa product consumption was much higher in the C-FFQ than in the EFSA-Q. This is a considerable strength of the present work in terms of further assessment, by the C-FFQ, of the contribution of cocoa and chocolate products to the polyphenol intake within this population. However, it is worthy to note that most cocoa intake (60%) became from chocolate bars, also inquired in the EFSA-Q, although the second source was dairy products (20%), which were not considered in this questionnaire.
On the other hand, data in the C-FFQ and 24HDR also showed a moderate correlation, including that of dairy and other cocoa products, and confirming and reinforcing C-FFQ. The 24HDR refers to the reporting of food intake in a single period of time, while the FFQ depends on the individual’s memory. Perhaps this is why the consumption frequency of other product sources (dairy, pastries, etc.) was lower in the 24HDR than in the C-FFQ. Although this fact, Bland-Altman analyses of total cocoa/chocolate products consumption frequency showed a relatively good agreement between methods. However, we cannot dismiss an overestimation of cocoa products found in the C-FFQ due
9
to a misjudgement in averaging the intake over one year. On the other hand, 24HDR data could also underestimate chocolate consumption because sometimes chocolate is a special food for celebrations, including Sundays, which were avoided in the current 24HDR. Overall our results show that the developed C-FFQ can be considered a valid assessment tool because, firstly, the correlation coefficients found between the C-FFQ and EFSA-Q or 24HDR are comparable with other similar validation studies [15]; and secondly, because the classification ability using the extreme misclassification method is similar to or even better than that in other similar approaches [20,22,28,29].
If we focus on the results regarding cocoa consumption from the C-FFQ and we compare them with published data, we can see some disagreements. The FFQs usually applied in those studies do not have so many items related to cocoa, they are conducted in a global or older population, and most of them collect data from different countries. This last fact is of great importance because the FLAVIOLA study has shown that the Spanish population is the highest consumer of flavanols derived from cocoa products in comparison with other European countries [31]. In this context, the Lothian birth cohort 1936 study reported that 84% of the population are chocolate consumers at a frequency of 2-3 times per week [31], whereas in our pilot population, the mean consumption frequency was 2.5 pieces per day. From the consumption frequency by the C-FFQ, the cocoa intake per day has been calculated, and the results revealed that a high proportion of cocoa consumption came from chocolate bars, although dairy products contribution was also significant. The amount of cocoa intake in the considered students is much higher than in other studies reporting, for example, a 1.5 g/day in 50-year-old Polish men [24]. However, data from a similar population in Spain indicate chocolate consumption of 42.6 g/day in the higher tertile [17], whereas when we calculated the consumption in the same tertile of our population, was of about 22 g/day.
Conclusions
In conclusion, we have developed a 90-item FFQ designed for the precise evaluation of cocoa and chocolate products, which as far as we know is the most extensive questionnaire developed in relation to the several products containing chocolate. After applying this FFQ in a small cohort of students, it can be concluded that results from this FFQ correlate with those obtained with two validated questionnaires. In addition, the FFQ highlights the important contribution of other cocoa sources than bars, as dairy products. The use of this FFQ will allow us and others to evaluate the impact of such intake on health and lifestyle in further studies.
Acknowledgements
We would like to thank Eulalia Roure and Jaume Serra from the “Servei Educació Sanitària i Programes de Salut” in the “Generalitat de Catalunya” for their help in the construction of the FFQ. The study was supported by AGL2011-24279.
10 Conflicts of Interest
The authors declare no conflict of interest. None of the funders had a role in the design or analysis of the study or in the writing of this article.
References
1. Robbins, R. J.; Leonczak, J.; Li, J.; Johnson, J. C.; Collins, T.; Kwik-Uribe, C.; Schmitz, H. H. Determination of flavanol and procyanidin (by degree of polymerization 1-10) content of chocolate, cocoa liquors, powder(s), and cocoa flavanol extracts by normal phase high-performance liquid chromatography: collaborative study. J. AOAC Int. 2012, 95, 1153–60.
2. Lee, K. W.; Kim, Y. J.; Lee, H. J.; Lee, C. Y. Cocoa has more phenolic phytochemicals and a higher antioxidant capacity than teas and red wine. J. Agric. Food Chem. 2003, 51, 7292–5.
3. Castell, M.; Pérez-Cano, F. J.; Bisson, J.-F. Clinical benefits of cocoa: an overview. In Chocolate in Health and Nutrition; Watson, R. R.; Preedy, V. R.; Zibadi, S., Eds.; Humana Press: Totowa, NJ, 2013; pp. 265–75.
4. Lilamand, M.; Kelaiditi, E.; Guyonnet, S.; Antonelli Incalzi, R.; Raynaud-Simon, A.; Vellas, B.; Cesari, M. Flavonoids and arterial stiffness: promising perspectives. Nutr. Metab. Cardiovasc. Dis. 2014, 24, 698–704.
5. Ried, K.; Sullivan, T.; Fakler, P.; Frank, O.; Stocks, N. Effect of cocoa on blood pressure. Cochrane database Syst. Rev. 2012, 8, CD008893.
6. Shrime, M. G.; Bauer, S. R.; McDonald, A. C.; Chowdhury, N. H.; Coltart, C. E. M.; Ding, E. L. Flavonoid-rich cocoa consumption affects multiple cardiovascular risk factors in a meta-analysis of short-term studies. J. Nutr. 2011, 141, 1982–8.
7. Farhat, G.; Drummond, S.; Fyfe, L.; Al-Dujaili, E. A. S. Dark chocolate: an obesity paradox or a culprit for weight gain? Phyther. Res. 2014, 797, 791–7.
8. EFSA Panel on Dietetic Products Nutrition and Allergies Scientific Opinion on the substantiation of a health claim related to cocoa flavanols and maintenance of normal endothelium-dependent vasodilation pursuant to Article 13 (5) of Regulation (EC) No 1924 / 2006 1. EFSA J. 2012, 10, 1–21. 9. Martin, M. A.; Goya, L.; Ramos, S. Potential for preventive effects of cocoa and cocoa polyphenols in cancer. Food Chem. Toxicol. 2013, 56, 336–51.
10. Pérez-Cano, F. J.; Massot-Cladera, M.; Franch, A.; Castellote, C.; Castell, M. The effects of cocoa on the immune system. Front. Pharmacol. 2013, 4, 71.
11. Ovaskainen, M.-L.; Törrönen, R.; Koponen, J. M.; Sinkko, H.; Hellström, J.; Reinivuo, H.; Mattila, P. Dietary intake and major food sources of polyphenols in Finnish adults. J. Nutr. 2008, 138, 562–6. 12. Zamora-Ros, R.; Knaze, V.; Luján-Barroso, L.; Slimani, N.; Romieu, I.; Touillaud, M.; Kaaks, R.; Teucher, B.; Mattiello, A.; Grioni, S.; Crowe, F.; Boeing, H.; Förster, J.; Quirós, J. R.; Molina, E.; Huerta,
11
J. M.; Engeset, D.; Skeie, G.; Trichopoulou, A.; Dilis, V.; Tsiotas, K.; Peeters, P. H. M.; Khaw, K.-T.; Wareham, N.; Bueno-de-Mesquita, B.; Ocké, M. C.; Olsen, A.; Tjønneland, A.; Tumino, R.; Johansson, G.; Johansson, I.; Ardanaz, E.; Sacerdote, C.; Sonestedt, E.; Ericson, U.; Clavel-Chapelon, F.; Boutron-Ruault, M.-C.; Fagherazzi, G.; Salvini, S.; Amiano, P.; Riboli, E.; González, C. a Estimation of the intake of anthocyanidins and their food sources in the European Prospective Investigation into Cancer and Nutrition (EPIC) study. Br. J. Nutr. 2011, 106, 1090–9.
13. Tresserra-Rimbau, A.; Medina-Remón, A.; Pérez-Jiménez, J.; Martínez-González, M.; Covas, M.; Corella, D.; Salas-Salvadó, J.; Gómez-Gracia, E.; Lapetra, J.; Arós, F.; Fiol, M.; Ros, E.; Serra-Majem, L.; Pintó, X.; Muñoz, M.; Saez, G. T.; Ruiz-Gutiérrez, V.; Warnberg, J.; Estruch, R.; Lamuela-Raventós, R. Dietary intake and major food sources of polyphenols in a Spanish population at high cardiovascular risk: the PREDIMED study. Nutr. Metab. Cardiovasc. Dis. 2013, 23, 953–9.
14. Spanos, D.; Hankey, C. R. The habitual meal and snacking patterns of university students in two countries and their use of vending machines. J. Hum. Nutr. Diet. 2010, 23, 102–7.
15. Rodríguez, I. T.; Ballart, J. F.; Pastor, G. C.; Jordà, E. B.; Val, V. A. Validation of a short questionnaire on frequency of dietary intake: reproducibility and validity. Nutr. Hosp. 2008, 23, 242– 52.
16. Pei, Z.; Fuertes, E. Food intake and overweight in school-aged children in Germany: results of the GINIplus and LISAplus Studies. Ann Nutr Metab 2014, 64, 60–70.
17. Cuenca-García, M.; Ruiz, J. R.; Ortega, F. B.; Castillo, M. J. Association between chocolate consumption and fatness in European adolescents. Nutrition 2014, 30, 236–9.
18. Zucconi, S.; Volpato, C.; Adinolfi, F.; Gandini, E.; Gentile, E.; Loi, A.; Fioriti, L. Gathering consumption data on specific consumer groups of energy drinks. Eur. Food Saf. Authority. Support. Publ. 2013, EN-394, 1–190.
19. Serra Majem, L.; Ribas Barba, L.; Salvador Castell, G.; Román Viñas, B.; Castell Abat, C.; Cabezas Peña, C.; Pastor Ferrer, M. C.; Raidó Quintana, B.; Ngo de la Cruz, J.; García Álvarez, A.; Serra Farró, J.; Salleras Sanmartí, L.; Plasencia Taradach, A. Trends in the nutritional status of the Spanish population: Results from the Catalan nutrition monitoring system (1992-2003). Rev Esp Salud Publica 2007, 81, 559–70.
20. Macedo-Ojeda, G.; Vizmanos-Lamotte, B.; Márquez-Sandoval, Y. F.; Rodríguez-Rocha, N. P.; López-Uriarte, P. J.; Fernández-Ballart, J. D. Validation of a Semi-quantitative Food Frequency Questionnaire to Assess Food Groups and Nutrient Intake. Nutr. Hosp. 2013, 28, 2212–20.
21. Cade, J.; Burley, V.; Warm., D. Food-frequency questionnaires: a review of their design, validation and utilisation. Nutr. Res. Rev. 2004, 17, 5–22.
22. Fernández-Ballart, J. D.; Piñol, J. L.; Zazpe, I.; Corella, D.; Carrasco, P.; Toledo, E.; Perez-Bauer, M.; Martínez-González, M. A.; Salas-Salvadó, J.; Martín-Moreno, J. M. Relative validity of a semi-quantitative food-frequency questionnaire in an elderly Mediterranean population of Spain. Br. J. Nutr. 2010, 103, 1808–16.
12
23. Tiainen, A. M. K.; Männistö, S.; Lahti, M.; Blomstedt, P. a.; Lahti, J.; Perälä, M. M.; Räikkönen, K.; Kajantie, E.; Eriksson, J. G. Personality and Dietary Intake - Findings in the Helsinki Birth Cohort Study. PLoS One 2013, 8.
24. Ilow, R.; Regulska-Ilow, B.; Rózańska, D.; Misiewicz, D.; Grajeta, H.; Kowalisko, A.; Biernat, J. Assessment of dietary flavonoid intake among 50-year-old inhabitants of Wroclaw in 2008. Adv. Clin. Exp. Med. 2012, 21, 353–62.
25. Haftenberger, M.; Heuer, T.; Heidemann, C.; Kube, F.; Krems, C.; Mensink, G. B. M. Relative validation of a food frequency questionnaire for national health and nutrition monitoring. Nutr. J 2010, 1–9.
26. Geelen, A.; Souverein, O. W.; Busstra, M. C.; de Vries, J. H.; van’t Veer, P. Comparison of approaches to correct intake-health associations for FFQ measurement error using a duplicate recovery biomarker and a duplicate 24 h dietary recall as reference method. Public Health Nutr. 2014, 18, 226–33.
27. Cook, A.; Roberts, K.; O’Leary, F.; Allman-Farinelli, M. A. Comparison of single questions and brief questionnaire with longer validated food frequency questionnaire to assess adequate fruit and vegetable intake. Nutrition 2015, 31, 941–7.
28. Zamora-Ros, R.; Knaze, V.; Luján-Barroso, L.; Slimani, N.; Romieu, I.; Touillaud, M.; Kaaks, R.; Teucher, B.; Mattiello, A.; Grioni, S.; Crowe, F.; Boeing, H.; Förster, J.; Quirós, J. R.; Molina, E.; Huerta, J. M.; Engeset, D.; Skeie, G.; Trichopoulou, A.; Dilis, V.; Tsiotas, K.; Peeters, P. H. M.; Khaw, K.-T.; Wareham, N.; Bueno-de-Mesquita, B.; Ocké, M. C.; Olsen, A.; Tjønneland, A.; Tumino, R.; Johansson, G.; Johansson, I.; Ardanaz, E.; Sacerdote, C.; Sonestedt, E.; Ericson, U.; Clavel-Chapelon, F.; Boutron-Ruault, M.-C.; Fagherazzi, G.; Salvini, S.; Amiano, P.; Riboli, E.; González, C. Estimation of the intake of anthocyanidins and their food sources in the European Prospective Investigation into Cancer and Nutrition (EPIC) study. Br. J. Nutr. 2011, 106, 1090–9.
29. Slater, B.; Philippi, S. T.; Fisberg, R. M.; Latorre, M. R. D. O. Validation of a semi-quantitative adolescent food frequency questionnaire applied at a public school in São Paulo, Brazil. Eur. J. Clin. Nutr. 2003, 57, 629–35.
30. Lai, J. S.; Attia, J.; Mcevoy, M.; Hure, A. J. Biochemical Validation of the Older Australian’s Food Frequency Questionnaire Using Carotenoids and Vitamin E. Nutrients 2014, 6, 4906–17.
31. Vogiatzoglou, A.; Mulligan, A.; Luben, R. N.; Lentjes, M. A.; Heiss, C.; Kelm, M.; Merx, M. W.; Spencer, J. P.; Schroeter, H.; Kuhnle, G. G. Assessment of the dietary intake of total flavan-3-ols, monomeric flavan-3-ols, proanthocyanidins and theaflavins in the European Union. Br. J. Nutr. 2014, 111, 1463–73.
32. Butchart, C.; Kyle, J.; McNeill, G.; Corley, J.; Gow, A. J.; Starr, J. M.; Deary, I. J. Flavonoid intake in relation to cognitive function in later life in the Lothian Birth Cohort 1936. Br. J. Nutr. 2011, 106, 141– 8.
13
Table 1: Consumption frequency of a portion (times/day) of foods of interest estimated by the C-FFQ, EFSA-Q and 24HDR (mean values and standard deviations).
* Significant differences (p<0.05) when compared to C-FFQ data of the product in the same row by using the Wilcoxon paired test.
n.d.: not possible to determine because there were no questions regarding other cocoa/chocolate-derived products.
C-FFQ EFSA-Q 24HDR
Mean SD Mean SD Mean SD
Tea 0.3364 0.4913 0.2955 0.3147 0.1200* 0.3283 Coffee 0.8616 0.6211 1.1800* 1.0631 0.4600* 0.6764 Cocoa/chocolate-derived products 1. Hot chocolate 0.0142 0.0175 0.0860* 0.2115 0.0000* 0.0000 2. Chocolate snacks 0.3228 0.2678 0.1429* 0.1384 0.3200 0.6207 3. Chocolate bars: 0.8533 1.1915 0.7143 0.8537 0.5000* 2.1452 3.1. White 0.0670 0.1296 0.0000* 0.0000 0.0000* 0.0000 3.2. Milk 0.2565 0.3926 0.5000 0.8688 0.4400* 2.1348 3.3. Dark 0.5298 1.1002 0.2143* 0.4389 0.0600* 0.3136 Total 1+2+3 1.1903 1.2979 0.9431* 0.9595 0.8200* 2.1917 4. Others: 1.3468 1.4903 n.d. 0.7600* 1.0606 4.1. Dairy 0.6103 1.1278 0.3800* 0.7796 4.2. Pastries 0.2850 0.3431 0.0800* 0.2740 4.3. Desserts 0.1450 0.2890 0.0600* 0.2399 4.4. Cereals 0.2077 0.3821 0.1600* 0.4219 4.5. Spreads 0.0990 0.1871 0.0800* 0.2740
Total with others
14
Table 2: Correlations (Spearman’s coefficient, ρ) between the food consumption frequency obtained from the C-FFQ and from the EFSA-Q and 24HDR.
C-FFQ vs EFSA-Q C-FFQ vs 24HDR ρ p ρ p Tea 0.841 0.000 0.328 0.020 Coffee 0.649 0.000 0.653 0.000 Cocoa/chocolate-derived products 1. Hot chocolate 0.341 0.015 n.d.* 2. Chocolate snacks 0.479 0.000 0.320 0.023 3. Chocolate bars: 0.330 0.019 0.279 0.050 3.1. White n.d.* n.d.* 3.2. Milk 0.429 0.002 0.358 0.011 3.3. Dark 0.569 0.000 0.330 0.017 Total C-FFQ (1-3) vs Q (1-3) 0.281 0.048 0.086 0.551 4. Others: n.d.** 0.447 0.001 4.1. Dairy 0.666 0.000 4.2. Pastries 0.216 0.132 4.3. Desserts 0.118 0.416 4.4. Cereals 0.192 0.182 4.5. Spreads 0.228 0.112 Total C-FFQ (1-4) vs Q (1-4) 0.475 0.000 Total C-FFQ (1-4) vs Q (1-3) 0.388 0.005
*n.d.: not possible to determine because values are equal to zero
**n.d.: not possible to determine because no questions regarding other cocoa/chocolate-derived products were included.
15
Table 3: Classification of individuals in same or adjacent quintile, and grossly classified for each of the foods considered of interest.
C-FFQ vs EFSA-Q C-FFQ vs 24HDR Same quintile Adjacent quintile Grossly classified Same quintile Adjacent quintile Grossly classified Tea 28 (56%) 17 (34%) 5 (10%) 14 (28%) 15 (30%) 21 (42%) Coffee 22 (44%) 19 (38%) 9 (18%) 23 (46%) 17 (34%) 10 (20%) Cocoa/chocolate-derived products 1. Hot chocolate 23 (46%) 21 (42%) 6 (12%) n.d.** 2. Chocolate snacks 18 (36%) 27 (54%) 5 (10%) 23 (46%) 15 (30%) 12 (24%) 3. Chocolate bars: 16 (32%) 18 (36%) 16 (32%) 16 (32%) 17 (34%) 17 (34%) 3.1. White n.d.* n.d.** 3.2. Milk 14 (28%) 26 (52%) 10 (20%) 15 (30%) 23 (46%) 12 (24%) 3.3. Dark 36 (72%) 13 (26%) 1 (2%) 38 (76%) 11 (22%) 1 (2%) Total C-FFQ (1-3) vs Q (1-3) 19 (38%) 18 (36%) 13 (26%) 12 (24%) 19 (38%) 19 (38%) 4. Others: n.d.* 24 (48%) 21 (42%) 5 (10%) 4.1. Dairy 46 (92%) 4 (8%) 0 (0%) 4.2. Pastries 42 (84%) 6 (12%) 2 (4%) 4.3. Desserts 47 (94%) 2 (4%) 1 (2%) 4.4. Cereals 39 (78%) 9 (18%) 2 (4%) 4.5. Spreads 44 (88%) 5 (10%) 1 (2%) Total C-FFQ (1-4) vs Q (1-4) 26 (52%) 12 (44%) 12 (24%) 17 (34%) 16 (32%) 17 (34%)
*n.d. not possible to determine because in the EFSA-Q no questions regarding other cocoa/chocolate-derived products were included
16
Figure 1: Bland-Altman plots showing the relationship between difference in the daily intake frequency of the issue at the top, and the corresponding mean of the daily intake frequency estimated by either C-FFQ and EFSA-Q or C-FFQ and 24HDR. Solid lines are the mean difference and
dashed lines are lower and upper 95% limits of agreement. Tea (C-FFQ vs EFSA-Q) Mean 0 1 2 Dif fe re n ce -2 -1 0 1 2 Tea (C-FFQ vs 24HDR) Mean 0 1 2 -2 -1 0 1 2 Coffee (C-FFQ vs EFSA-Q) Mean 0 1 2 3 4 -3 -2 -1 0 1 2 3 Coffee (C-FFQ vs 24HDR) Mean 0 1 2 3 4 -3 -2 -1 0 1 2 3 Chocolate snacks (C-FFQ vs EFSA-Q) Mean 0 1 2 Dif fe re n ce -3 -2 -1 0 1 2 3 Chocolate snacks (C-FFQ vs 24HDR) Mean 0 1 2 -3 -2 -1 0 1 2 3 Chocolate bars (C-FFQ vs EFSA-Q) Mean 0 1 2 3 4 5 6 -10 -5 0 5 10 Chocolate bars (C-FFQ vs 24HDR) Mean 0 1 2 3 4 5 6 -10 -5 0 5 10
Total cocoa products (1 + 2 + 3) (C-FFQ vs EFSA-Q) Mean 0 1 2 3 4 5 6 7 Dif fe re n ce -8 -4 0 4 8
Total cocoa products (1 + 2 + 3) (C-FFQ vs 24HDR) Mean 0 1 2 3 4 5 6 7 -8 -4 0 4 8
17
Figure 2: Estimation of cocoa intake (g/day) according to the sources included in C-FFQ. Results are expressed as average ± error deviation.
hot ch ocol ate choc olate bars choc olate snac ks dairy prod ucts pastry dess erts cerea ls sprea ds TOTA L CO CO A c ocoa int ak e (g/ da y ) 0 2 4 6 8 10 12 14
18
Table A1 – Cocoa content in cocoa and chocolate products inquired in C-FFQ
Product Cocoa (g) content
in 100 g Portion
Cocoa (g) per portion
Breakfast cereaks with chocolate 5.55 g 35 g 1.94 g Muesli cereals with chocolate 4.88 g 35 g 1.71 g Chocolate/cocoa powder (to add to milk) 22.77 g 20 g 4.55 g Chocolate soy drink 1.45 g 220 g 3.19 g Chocolate pudding 1.70 g 100 g 1.70 g Creamy dessert with chocolate 1.83 g 100 g 1.83 g Chocolate yogurt 1.17 g 125g 1.46 g Chocolate ice cream 5.88 g 100 g 5.88 g Ice cream with chocolate parts 2.80 g 100 g 2.80 g Chocolate covered pastry (e.g. Palmier) 4.26 g 35 g 1.49 g Chocolate filled pastry (e.g. Croissants) 5.03 g 35 g 1.76 g Filled chocolate cookies 5.51 g 21 g 1.16 g Covered chocolate cookies 12.03 g 21 g 2.53 g Chocolate cookies 4.66 g 21 g 0.98 g Chocolate chips cookies 5.52 g 21 g 1.16 g Chocolate cake 7.17 g 100 g 7.17 g Cake with chocolate parts 3.20 g 100 g 3.20 g Chocolate nougat 23.80 g 20 g 4.76 g Bombons 33.79 g 20 g 6.76 g Milk chocolate 29.64 g 20 g 5.93 g Dark chocolate (<60% cocoa) 50.00 g 20 g 10.00 g Dark chocolate bars (60 - 70% cocoa) 69.00 g 20 g 13.80 g Dark chocolate bars (70-85% cocoa) 72.13 g 20 g 14.43 g Dark chocolate bars (>85% cocoa) 89.75 g 20 g 17.95 g Chocolate milkshake 1.23 g 220 g 2.71 g
Hot chocolate 25.30 g 38 g 9.61 g Chocolate spreads (e.g. Nutella) 7.18 g 20 g 1.44 g