Author: Jack Ellis
Supervisor: Aurèlia Estrada Mañé
A Future of Decentralised Energy?
An Investigation into the Impact of Battery Storage Technology
T
ABLE OF CONTENTSList of Figures ... 4 List of Tables ... 4 Introduction ... 5 Objective ... 11 Methodology ... 13 Trends in Energy Finance ... 14 Chapter 1: Technical Aspects of Battery Storage Technologies ... 22 Battery Storage Technologies ... 22 Lead-acid ... 22 Lithium-ion ... 24 Flow Batteries ... 25 Sodium/Molten Salt ... 25 Summary table of key factors ... 26 Applications of battery storage technology ... 26 Battery Storage – Islands and off-grid applications ... 27 Household solar PV ... 28 Variable renewable energy smoothing and supply shift ... 30 Fast regulation in grids with high variable renewable energy shares. ... 32 Summary ... 33 Chapter 2: The economic viability of battery storage technology ... 35 Residential Solar PV ... 35 Optimal Solar PV System Size ... 37 Optimal Storage Size ... 39 Storage Profitability ... 40 Summary ... 42 Price development of lithium-ion technology ... 43 Market development for battery storage technology ... 46 Utility, residential and non-residential market segments ... 47 International markets ... 52 U.S.A. ... 53 Japan ... 54 Germany ... 56 China ... 57 Summary ... 59 Chapter 3: The impact of battery storage technology in perspectives ... 61 Environmental perspective ... 61 Production ... 61 Use ... 63 Disposal ... 64 Internationalization perspective ... 67 Public/Utility perspective ... 69 Implications for energy-system market participants and other stakeholders ... 72 Future trajectories ... 73 Democratisation of energy ... 77 Conclusion ... 80 Bibliography ... 83
List of Figures
Figure 1: CO2 Concentration in atmosphere ... 6 Figure 2: The Duck curve ... 8 Figure 3: Evolution of polysilicon prices ... 15 Figure 4: Silicon photovoltaic value chain ... 16 Figure 5: Global average module price ... 17 Figure 6: Evolution PV price ($/Watt) ... 18 Figure 7: Global Annual PV Production ... 19 Figure 8: Electricity Output (GWh) from Solar PV Installations in Major Economies ... 20 Figure 9: Electricity Output (GWh) from Solar PV installations in OECD countries ... 20 Figure 10: Services provided by energy storage ... 26 Figure 11 (left): no energy storage ... 27 Figure 12 (right): with lead-acid battery storage. ... 27 Figure 13: Solar PV and battery storage ... 29 Figure 14: Smoothing from battery power storage ... 31 Figure 15: Energy supply shift ... 32 Figure 16: 100MW Battery storage (left) versus 100MW gas turbine (right) ... 33 Figure 17: Average end consumer price for installed rooftop systems. ... 35 Figure 18: Optimal Solar PV plant size S1-S5 ... 37 Figure 19: Optimal PV plant size S6-S8 ... 39 Figure 20: Optimal Storage Size S1-S5 ... 39 Figure 21: Optimal Storage Size S1-S5 ... 40 Figure 22: Storage profitability S1-S5 ... 41 Figure 23: Storage profitability S6-S8 ... 42 Figure 24: Cost of Lithium-ion battery packs in battery electric vehicles ... 44 Figure 25: Estimated installed battery capacity and commissions in power sector, 2014 ... 47 Figure 26: Worldwide forecast of battery storage capacity (MW) and annual revenue (USD) for utility scale applications ... 48 Figure 27: Annual US solar PV installations from 2000-2015 ... 50 Figure 28: US PV installation forecast 2010-2021 & US installation forecast by segment ... 51 Figure 29: Possible paths for electricity grid evolution ... 75 Figure 30: Ownership of German renewables in 2012 ... 78 Figure 31: Number of energy cooperatives in Germany 2001-2013 ... 79List of Tables
Table 1: Evolution of Chinese PV cell production ... 14 Table 2: Electricity price scenarios used in model simulations ... 37 Table 3: Applications for battery use. ... 48 Table 4: Installation targets of major markets and overall share of renewable generation. ... 52 Table 5: Characterised impact per kg of battery production ... 62 Table 6: Characterised data range for battery production per MJ capacity ... 63 Table 7: Typology of environment related risks ... 74
Introduction
In the second half of the 20th century scientists became increasingly aware of the effects that gases such as carbon dioxide and methane were having on the planet’s environment. Initially, concerns about the warming effects of gasses were countered by suggestions that human activity could have cooling effects on the environment through the use of aerosols. However, by the 1970’s scientific consensus had veered towards warming rather than cooling. In 1975, Wallace Broecker published a paper titled, Climate Change: Are we on the Brink of a Pronounced Global Warming? This paper is often credited with coining the term ‘global warming.’
Nowadays, one is more likely to hear of ‘climate change’ rather than ‘global warming’. Whereas ‘global warming’ refers simply to the earth’s rising temperature, ‘climate change’ is a more all-encompassing concept that refers to the earth’s warming and the side effects of that warming - melting glaciers, rising sea levels and increasing desertification for example.
The first international treaty to combat climate change was the United Nations Framework Convention on Climate Change (UNFCCC). This was negotiated at the Earth Summit in Rio de Janeiro in 1992 and came into force on the 21st of March 1994. Its objective was to stabilize the greenhouse gas concentrations in the atmosphere at a level that would, ‘prevent dangerous anthropogenic interference with the climate system.’1 This treaty was extended upon in the Kyoto Protocol by committing states to reduce greenhouse gas emissions on the premise that 1) global warming exists and 2) it has been caused by man made carbon dioxide emissions.
1UNITED NATIONS. (1992) United Nations Framework Convention on Climate Change [Online] Available
Figure 1: CO2 Concentration in atmosphere2 Figure 1 clearly shows the effect that man has had on the level of carbon dioxide in the atmosphere. For the past 650,000 years CO2 had never been higher than approximately 300 parts per million. At the time of writing the current level of CO2 in the atmosphere stands at approximately 403 parts per million.3
The latest agreement within the framework of the UNFCCC is the Paris Agreement, which was drafted in late 2015 at the 21st Conference of Parties in Paris. The Paris Agreement is yet to enter into force, but as with previous UNFCCC agreements there are concerns regarding the lack of binding targets as well as an effective enforcement mechanism. The impact that this agreement will have on future carbon emissions remains to be seen.
Such is the concern over climate change that the Global Risks Report 2016 published by the World Economic Forum rates, ‘failure of climate change mitigation and adaptation’ as the greatest risk in terms of impact.4 Climate change is linked to risks of food and water crises, profound social instability, extreme weather events, biodiversity loss and ecosystem collapse, and large-scale involuntary migration. The threats posed by the failure to mitigate the effects of climate change are severe.
Recognizing the need to provide energy, without adding to the concentrations of greenhouse gasses within the earth’s atmosphere, there has been a surge in renewable energy technology during the 21st century. However, the most accessible forms of renewable energy – solar and wind have major problems regarding their reliability and stability. In other words, the failure of the sun to shine and the wind to blow 24 hours a day means that the proliferation of clean energy sources has been hindered. The intermittent nature of renewable energy is a problem that must be solved if their development is to continue. The following quote by the distinguished Czech-Canadian scientist Vaclav Smil:
‘If electric utilities had an inexpensive way to store massive amounts of excess power generated by wind and solar when demand is low, which could later be tapped to meet peak demand, then the new renewables would expand much more quickly. Unfortunately, decades of development have provided only one good, large-scale solution: pumping water up to an elevated reservoir so it can flow back through a turbine to generate electricity. Not many localities have the elevation change or space to make this work, and the process
2 GLOBAL CLIMATE. (2015). Global Climate Change: Evidence and causes. [Online] Available from: http://globalclimate.ucr.edu/resources.html 3 NASA. (2015). Global Climate Change: Vital signs of the planet. [Online] Available from: http://climate.nasa.gov 4 LEVITT, T. (2016) Climate Change Fails to top List of Threats for Business Leaders at Davos. The Guardian. [Online] Available from: http://www.theguardian.com/sustainablebusiness/2016/jan/20/climate-change-threats-business-leaders-davos-survey It is interesting to note that climate change was not considered to be a high concern to 1,400 CEOs from around the world. A list provided by PricewaterhouseCoopers (PwC) showed that overregulation was their greatest concern (79%), followed by geopolitical uncertainty (74%). Climate change was mentioned as a threat to business by only 50% of CEO’s. Both the PwC survey and a separate survey of 13,000 business leaders carried out by the World Economic Forum (WEF) showed a relative absence of concern over climate change and environmental risk.
entails net energy loss.’5
The ability to store electrical energy in a safe and economically viable manner would serve to combat the limitations that arise due to the intermittent nature of renewable energy sources. Thus, electrical storage technology could likely be a significant factor in the development of renewable energy systems and consequently a factor in climate change mitigation.
Smart grids, too, have the potential to combat the limitations of renewables. Through the use of integrated communications as well as sensing and measuring technology, system reliability can be optimized. Distributed power flow control is a noteworthy example. In this case, smart wires control the flow of power within existing transmission lines and as a result more renewable energy is supported on the grid. Arpa-E, a branch of the Department of Energy in the United States says the following on the subject: ‘Smart wires could support greater use of renewable energy by providing more consistent control over how that energy is routed within the grid on a real-time basis. This would lessen the concerns surrounding the grid's inability to effectively store intermittent energy from renewables for later use.’6
Although of critical importance in the future of energy systems, this investigation will focus on battery storage technology rather than smart grids, with regards to their ability to utilize intermittent energy from renewables.
At present, one of the greatest challenges facing the development of solar power is the effect that it has on the daily demand for utility electric. Figure 2 below shows the net supply and demand of power on California’s electric grid during a 24-hour period in 2012-13.
5 SMIL, V. (2014) The Long Slow Rise of Solar and Wind. Scientific American. 6ARPA-E. (2011) Distributed Power Flow Control. [Online] Available from: http://arpa-e.energy.gov/?q=slick-sheet-project/distributed-power-flow-control
Figure 2: The Duck curve7
The above figure is commonly referred to as ‘the duck curve’ on account of the fact that year on year the graph represents the shape of a duck’s head and body. As the amount of installed solar has increased, the demand on the grid has fallen. Before 2012 energy demand was said to resemble a camel with two humps. As one can see from the graph there were peaks in both the morning and in the early evening. This energy was mostly supplied by utility operated power plants. However, increasingly this energy has been substituted by local solar power, which by meeting local demand greatly affects the demand for energy from the grid during the day. The orange camel is transforming into a green duck.
The graph has become almost a symbolic picture of utility complaints. Utility companies regard the growth of distributed solar as a major technical problem, rather than an economic one. Of particular concern for utility companies is one part of the graph – the ramp up period in the late afternoon. This is the time period in which the energy produced from solar is decreasing while energy demand increases. According to John Farrell of Clean Technica, in traditional grid operating models, accommodating this ramp-up in energy requires, ‘lots of stand by power from expensive to operate, rapid-response power plants.’8 As a result, there have been various suggestions attempting to ‘flatten the duck’. They are listed below: ▪ Target energy efficiency measures for the “ramp up” period ▪ Orient solar panels to the west to catch more late evening sun ▪ Substitute some solar thermal with storage for solar PV ▪ Allow the grid operator more demand management via electric water heating [already done extensively by rural cooperatives in Minnesota] ▪ Require large new air conditioners to have two hours of thermal storage accessible to the utility ▪ Retire inflexible generating plants (coal and nuclear) that need to run constantly in off-peak periods ▪ Concentrate utility demand charges on the ramp up period ▪ Deploy electricity storage into targeted areas, including electric vehicle-to-grid ▪ Implement aggressive demand response programs (subscribing more businesses and homes into programs to shed their energy demand at key periods) ▪ Use inter-regional power transactions ▪ Selectively curtail a small portion of solar power generation In light of this it can be suggested that the technical challenges of the ‘duck problem’ are manageable, in the most part with existing technology. Battery storage linked to PV systems would also be able to contribute to a solution. Excess supply stored in the day
7 FARRELL, J. Clean Technica [Online] Available from: http://cleantechnica.com/2014/07/21/utilities-cry- fowl-over-duck-chart-and-distributed-solar-powercrying-fowl-or-crying-wolf-open-season-on-the-utilitys-solar-duck-chart/ 8 ibid.
would be able to play a part in the ramp-up period as energy demand increases in the evening as people return home from work.
It is likely that economic problems exist for utilities, and the question of to what extent their business model may be outdated is an interesting one. As more solar comes onto the grid, utility owned gas plants which meet peak load will be out bid. Furthermore, in the near future solar production will be sufficient to cut into the “baseload” power, usually provided by coal power plants, which are only economically viable operating 24 hours a day. Thus the electricity grid is undoubtedly changing. The 20th century system of inflexible and centralised power plants with long distance transmission lines is transforming, in some cases, to distributed renewable energy. The duck graph highlights the limitations of using a 20th century grid model for a 21st century system. To utility companies the duck graph serves as evidence of the technical problems caused by the continued development or renewable energy sources. However, as we have seen it is the energy demand that is displaced by solar that represents the real problem for utilities. If an increasing number of customers seek more control over their energy consumption by moving to solar, the market share of utilities is likely to decrease. Analysis from PWC notes that the gains in renewable/distributed power systems have, ‘altered the business equation sufficiently that the customer is rapidly becoming the dominant force.’9 It is clear that the industry is undergoing a huge change as firms have traditionally led it with virtual monopolies over customers. Hence the problem facing utility companies is more economic in nature than technical. Furthermore, an abundance of renewable power changes the profitability of baseload and peaking power plants. As Farrell writes: “Economically, an abundance of low-cost renewable energy will change the profitability of baseload and peaking power plants. Baseload power plants will suffer from a drop in wholesale electricity prices, as has happened in Germany. Fast-response power plant operators will also struggle, because while peak energy prices may remain high, more solar energy on the grid will shorten periods of peak energy demand for these power plants.”10
Although somewhat inflexible, like coal and nuclear, renewable energy has no fuel costs and little operation costs. Therefore, in theory it should be the first power a utility company would want to use on the grid. Furthermore, though it has been suggested that ‘baseload is not compatible with a renewable energy future,’11 it is clear that quick and flexible response to electricity supply will become increasingly important in a renewable energy future. As a result, energy storage technologies may provide an important solution. It should further be noted that even if there were improvement to the grid with the use of smart grid technology, energy storage would still reduce its capacity requirements.
9PWC. (2015). 2015 utilities trends. [Online] Accessed on 4/4/2015 from: http://www.strategyand.pwc.com/perspectives/2015-utilities-trends 10 FARRELL, J. (2014) Energy Storage: The Next Charge for Distributed Energy. The Institute for local Self-Reliance p.6. 11 HOPE, M. (2013). The Energiewende and energy prices: Public support and Germany’s long term vision. The Carbon Brief. [Online] Accessed on 3/3/2015 from: http://tinyurl.commk6qnp2
Energy storage and renewables are a powerful combination that will ultimately allow for a more thorough adoption of renewable energy, something that is critical in efforts to mitigate climate change and accelerate the energy transition to sustainable sources. It is likely, although not certain, that the combination also has the added bonus of greater local control of the energy system. Thus, the 21st century dynamic offers us the possibility of a dramatically different energy future to that of the previous century: Millions of widely dispersed renewable energy plants and storage systems tied into a smart grid. The era of large and distant centralised power plants could be consigned to the past. The 21st century grid could be a democratized network of independently owned and widely dispersed renewable energy generation, with economic benefits of electricity generation dispersed as widely as the ownership.
Dr. Norbert Rottgen, the German Federal Minister for the environment, believes that the time is approaching when countries will have to make a decision on the future of their energy system:
‘It is economically nonsensical to pursue two strategies at the same time, for both a centralised and decentralized energy supply system, since both strategies would involve enormous investment requirements. I am convinced that the investment in renewable energies is the more economically promising project. But we will have to make up our minds. We cant go down both paths at the same time.’12 The role of electrical energy storage systems, their impact, and the extent to which they are able to accelerate the transition to decentralized energy systems, is the focus of this paper.
12 FARRELL, J. (2011). Democratizing the Electricity System. The New Rules Project. p. 27.
Objective
Renewable technologies have gained economic competitiveness in the recent past. This is mostly true in the case of solar energy as a result of falling PV cell costs. Despite renewable energy’s increasing competitiveness it still possesses problems that hinder widespread deployment. One major obstacle is the intermittent nature of renewable energy.
This paper seeks to understand the role that battery storage technology is able to play in the dissemination of renewable energy sources and a 21st century grid system. This is principally achieved by counteracting the key disadvantage of intermittency. In order for this to be carried out, both the technical and economic aspects of electrical energy storage are to be investigated. In addition, this paper aims to show what impact the conclusions drawn from the investigation will have. The paper shows the impact of battery storage technology through several different perspectives and ultimately asks what the impact of battery storage technology will be on centralised energy systems.
This project is carried out from the perspective of Internationalisation. To internationalise is commonly defined as to put under international control or to make international in character. In economic terms Internationalisation is the process of increasing involvement of enterprises in international markets, and the spread of economic activities across national boundaries.13
Internationalization is evident through the increasing levels of investment in renewable energy. In order to understand the role of battery storage technology, it is necessary to understand the current trends in renewable energy finance. Renewable energy has undergone sizable changes in the recent past and before investigating the technical aspects of energy storage technologies, it is important to understand what key developments there have been in the recent past. This is done in an effort to contextualize the issue of battery storage, and to understand how it has become such a critical issue for the continued development of renewable energy sources. Consequently, a minor objective of the paper is to understand recent trends in the development of renewable energy sources.
Once the recent trends have been understood chapter one will focus on the technical aspects of battery storage technology. The various battery storage technologies that currently exist will be compared and the various different applications for these technologies will be investigated.
Chapter two investigates battery storage technology specifically and will have an economic rather than technical focus. The current status and the economic viability of the technology are understood, and its future hypothesized. This part of the paper also seeks to understand the obstacles that battery storage technology faces.
13 GEREFFI et al. (2001). Introduction, Globalisation, Value Chains and Development. Institute of Development Studies. [Online] Accessed on 3/3/2015 from: https://www.ids.ac.uk/files/dmfile/gereffietal323.pdf
Chapter three aims to assess the impact of battery storage technology. This is to be achieved by evaluating its impact from several different perspectives: Internationalization – how will the conclusions drawn from parts one and two affect states and the large energy corporations? Environmental – what is the environmental cost of energy storage solutions? Public – To what extent is the public accepting of energy storage and the consequences of its integration in the energy system? Finally, the conclusion will sum up the findings of the paper, offer avenues for further research and suggest limitations of the paper.
Methodology
The methodology of the paper will begin with the collection of relevant information. Fundamentally, this investigation is one into the future of energy systems and the role that energy storage technology will play in their future. Thus although the paper is principally concerned with battery storage technology, it is also important to understand the problems that renewable energy faces. Firstly, an explorative investigation into problems faced by renewable energy is important. These issues have been discussed in the introduction and serve as the foundation for investigation into storage technology.
‘Trends in energy finance’ will show recent developments in the price of solar PV panels and the impact that it has had on the adoption of renewable technology.
Documents, peer-reviewed papers and data that relates to storage technology energy will be collected and investigated in order to have a complete understanding of the technology and its applications. This serves as Chapter one and technical in its approach.
To effectively carry out part two of the investigation, which focuses on the economics of battery storage technology several steps are necessary. Firstly, the economics are investigated at a micro level, in an effort to understand whether or not investment in residential battery systems is economically viable. Other parts of the chapter seek to understand the price development of lithium-ion technology and its impact on various associated markets.
The final part of the investigation will use a wide range of documents in order to assess the impact of battery storage from different perspectives. Documents from the European Commission, will have relevance while scientific papers will be necessary in understanding the impact that batteries have on the environment.
Trends in Energy Finance
Since 2004 China has greatly increased investment in the various parts of the solar manufacturing value chain: poly-silicon feedstock, wafers, cells and modules. In 2008 Chinese firms began reaping large benefits from economies of scale in the production of purified silicon. According to Fischer, until that point soaring global prices due to an oligopolistic market structure had hampered the expansion of the sector in China.14 By June of 2008 the country had over 700 PV manufacturing companies,15 and by this time China had become the largest PV manufacturer in the world with 98% of its product shipped overseas.16
By 2009 the Chinese government had recognized solar manufacturing as a strategic industry. Attempts were made to speed up the growth of the industry, ‘principally through a combination of low-cost debt and subsidy.’17 In the following year four of the top 10 solar PV manufacturers in the world were Chinese.18
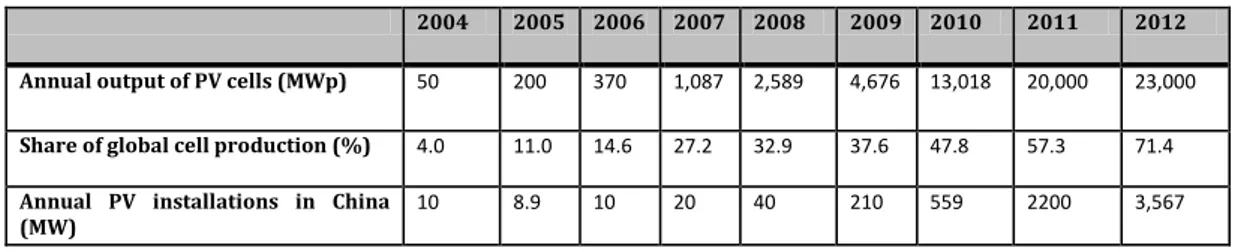
During the financial crisis during 2008-09 the pace of PV installations in Europe slowed. In response, China stimulated domestic demand for their manufactured solar products. As the table below shows, Chinese annual solar installation increased over 100 times during the period from 2007 to 2012. What is noticeable from the data is how the annual installations in China are much lower than the annual output of the country. As Puttaswamy and Sahil Ali note, ‘Chinese solar manufacturing policy was driven by its export potential rather than concerns about supporting domestic deployment, which were satisfied by default.’19 Table 1: Evolution of Chinese PV cell production20
14 PEGELS. A. (Ed.). (2014). Green Industrial Policy in Emerging Countries. [Online] Accessed on 3/3/2015 from: https://books.google.co.in/books?id=C4n8AgAAQBAJ&pg=PA77&lpg=PA77&dq=evolution+of+china%25+2 7s+solar+PV+manufacturing+industry&source=bl&ots=l5o1-LSY2O&hl=en&sa=X&ei=NpAFVLeXNs248gWR7ILQCg#v=onepage&q=evolutio%2C%202014.&f=false 15 PAN, J., MA, H. and ZHANG, Y. (2011). Green Economy and Green Jobs in China. WorldWatch Institute. [Online] Accessed on 3/3/2015 from: http://www.worldwatch.org/system/files/185%20Green%20China.pdf 16 SEMI. China Market Growth Fuelled by Government Spending During Industry Downturn [Online] Accessed on 3/3/2015 from: http://www.semi.org/en/MarketInfo/ctr_027596 17 PUTTASWAMY, N and SAHIL ALI, M. (2015). How Did China Become the Largest Solar PV Manufacturing Country? Step. p.2. 18 PAN, J., MA, H. and ZHANG, Y. (2011) Green Economy and Green Jobs in China. WorldWatch Institute. [Online] Accessed on 3/3/2015 from: http://www.worldwatch.org/system/files/185%20Green%20China.pdf 19 PUTTASWAMY, N and SAHIL ALI, M. (2015). How Did China Become the Largest Solar PV Manufacturing Country? Step. p.2. 20 ibid.
CSTEP-Note-2015-02 © CSTEP www.cstep.in 2
The Decade of Chinese March
Globally increasing demand for solar gear and a domestic thrust on solar manufacturing have propelled China to the top position in terms of Solar Photovoltaic (PV) manufacturing countries. Since 2004, China’s production march on all fronts of the solar manufacturing value chain began- poly-silicon feedstock, wafers, cells and modules. By 2008, the growth of solar industry became formidable as the Chinese firms started reaping economies of scale in the production of purified silicon. By then, China had become the largest PV manufacturer in the world, with 98% of its product shipped overseas (1).
In 2009, the government identified solar manufacturing as a strategic industry and attempted to accelerate its growth principally through a combination of low cost debt and subsidy. By 2010, China accounted for about half of the global production of solar gear, and four out of the global top 10 solar PV cell manufacturers were Chinese (2)(3).
China’s own domestic market for PV installations gathered steam much later. Towards the end of 2007, China’s cumulative installation was only about 100 MW, representing only 1% of the total global PV installations(4). So when the financial crisis of 2008-09 struck Europe and slowed down the pace of PV installations, the Chinese government stimulated their domestic demand for solar gear. As Table 1 shows, Chinese annual solar installation grew by over 100 times between 2007 and 2012 to 3.6 GW. However, this was still not comparable with the annual output of PV cells from China (~20 GW). Chinese solar manufacturing policy therefore was driven by its export potential rather than concerns about supporting domestic deployment, which were satisfied by default.
Table 1: Annual Output of PV Cells and Share of Global Cell Production,(5)(6)
2004 2005 2006 2007 2008 2009 2010 2011 2012
Annual output of PV cells (MWp) 50 200 370 1,087 2,589 4,676 13,018 20,000 23,000
Share of global cell production (%) 4.0 11.0 14.6 27.2 32.9 37.6 47.8 57.3 71.4
Annual PV installations in China
(MW) 10 8.9 10 20 40 210 559 2200 3,567
Global Glut in Solar Gear Market
During the financial crisis, China strengthened its grip on the export markets. It also contributed to the global glut in the supply of solar gear, which led to further decline prices. The price decline cannot be attributed to productivity gains alone, but also in large part to the supply-demand mismatch.
By 2011, wafer prices had dropped to about 70%, solar cells by about 60%, and module prices halved(7). As the global production in 2010 reached 20.5 GW (or 160,000 metric tons), the prices of components had fallen from $4.5/Watt in year 2000 to $1.7/Watt in 2010(8). Production of solar cells from China alone was around 10 GW, accounting for 50% of the total global production, and more than 90% of solar cells were exported (5) (9).
As Table 1 shows, during the time of the financial crisis China was improving its position in the export markets. In 2004 the country produced 50 MWp of PV cells, a fifth of which were installed domestically. This output only represented 4% of the total global cell production at that time. Over the following 8 years the output of PV increased year-on-year. In 2012 the total output had reached 23,000 MWp and the share of the global cell production had risen to 71.4%. Since 2004 the prices of PV cells have fallen significantly. That said, there is an element of debate as to why this has been the case. Regarding the total cost of production, the material input constitutes a high percentage. A report by the International Trade Centre found 75% of a Chinese solar PV manufacturer’s total cost of production was spent on material inputs.21 Although this study did not examine a wide range of manufacturers, their findings would suggest that if the necessary materials were to decrease in price, then it would affect the price of solar PV cells.
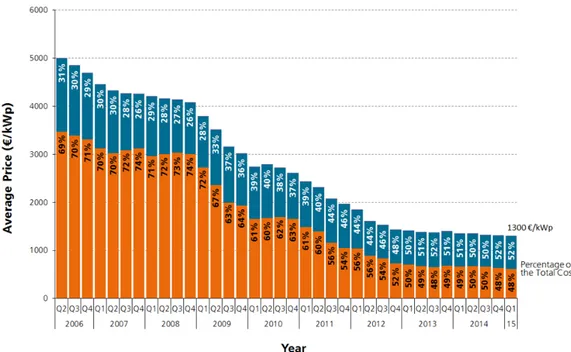
In 2010 the global production of solar PV cells was 20.5 GW and the prices of components had fallen from $4.5/Watt in 2000, down to $1.7/Watt.22 Figure 3 below shows the development in recent years of the price of imported and domestic polysilicon in china. This is significant, as polysilicon is the first step in the silicon photovoltaic value chain. (Figure 4). Figure 3: Evolution of polysilicon prices23
21 International Trade Centre. (2015). Services in global value chains: Solar panel manufacturing in China p.vii. 22 ibid. 23 FU, R., JAMES, T., WOODHOUSE, M. (2015). Economic Measurements of Polysilicon for the Photovoltaic Industry: Market Competition and Manufacturing Competitiveness. IEEE Journal of Photovoltaics. Vol.5.No.2. p.516.
Jack Ellis MOI Figure 4: Silicon photovoltaic value chain It cannot be ignored that as 75% of the company’s total production costs are input costs, the strong decline in prices after 2010 is likely to have significantly affected the price of the solar PV cells produced. IRENA, the International Renewable Energy Agency, calculated that polysilicon prices accounted for 45% of the reduction of solar PV modules from Q4 2010 to Q4 2012, while other material costs accounted for 19%.24 Therefore, in 2008, when the first Chinese firms had mastered the technologies needed for the large-scale production of purified silicon, the Chinese solar PV industry grew rapidly. Although China was already the largest PV manufacturer in the world in 2008, it was after this technological breakthrough that investment in the production of purified silicon rose sharply.25 The increased production contributed to a ‘glut’ in supply that led to further declines in prices. Puttaswamy and Sahil Ali note that the decline in prices cannot be attributed to productivity gains alone, but rather to a supply-demand mismatch.26
The financial crisis did not prove to be damaging to manufacturing. In fact, it is suggested by Pegels that many installers, particularly in Europe and the USA, actually became more interested in the cheaper products from china. She cites the European anticipation of further adjustments to feed-in-tariffs (FITs) as a reason.27 Estimates vary, but at end of 2012, the worldwide annual solar PV installed capacity had reached about 31-36 GW, while global production capacity was at least 60 GW, of which China alone constituted 40-55 GW.2829
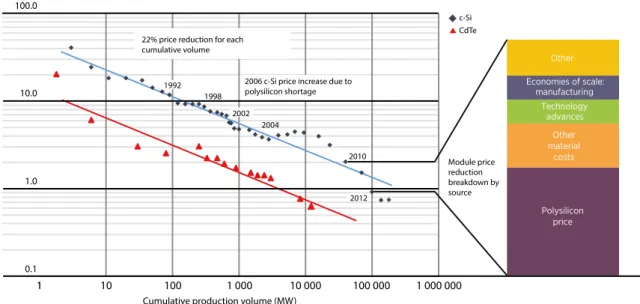
IRENA notes that in 2012, all-time-low prices of solar PV modules “overshot” the expected learning curve which was the result of there being ‘significant overcapacity in module manufacturing and cut-throat competition.’30 Figure 5 shows how far below the learning curve the prices of PV modules have been since 2012, with a learning rate of 18-22%.
24 IRENA. (2015). Renewable Power Generation Costs in 2014. p 82. 25 PUTTASWAMY, N and SAHIL ALI, M. (2015). How Did China Become the Largest Solar PV Manufacturing Country? Step. 26 ibid. 27 PEGELS, A. Green Industrial Policy in Emerging Countries. [Online] Accessed on 4/3/2015 from: https://books.google.co.in/books?id=C4n8AgAAQBAJ&pg=PA77&lpg=PA77&dq=evolution+of+china%25+2 7s+solar+PV+manufacturing+industry&source=bl&ots=l5o1-LSY2O&hl=en&sa=X&ei=NpAFVLeXNs248gWR7ILQCg#v=onepage&q=evolutio%2C%202014.&f=false 28PUTTASWAMY, N and SAHIL ALI, M. (2015). How Did China Become the Largest Solar PV Manufacturing Country? Step. p.2. 29 EUROPEAN COMISSION. Memo : EU imposes provisional anti-dumping duties on Chinese solar panels [Online] Accessed on 4/4/2015 from: http://europa.eu/rapid/press-release_MEMO-13-497_en.htm 30 IRENA. (2015). Renewable Power Generation Costs in 2014. p 82. 3
Also…
• Capital equipment
• Raw materials
• Intermediate products
Figure 5: Global average module price31
It should be mentioned that both the United States and the European Union have applied anti-dumping measures against Chinese manufacturers. Consequently, profits for Chinese firms moved from 30% to less than 10%.32 In 2012 the EU commission imposed an anti-dumping duty to be set at an average of 47%.33 Chinese exporters also had to accept quantitative restrictions on imports. Puttaswamy and Sahil Ali believe that that the oversupply and the ensuing price war are also factors that have contributed to China’s emergence as a solar manufacturing giant, as even when solar panels have continued to fall the solar manufacturers did not suffer losses. Conversely in Europe, the EU Commission calculated that between 2009 - July 2012, about 40 EU producers declared insolvency, 6 stopped production, 2 quit the solar business and 4 were taken over by Chinese investors.34
In addition to supply-demand asymmetries, China has become the world’s dominant manufacturer of solar panels due to economies of scale. China is traditionally seen as having absolute advantage in labour costs in the manufacturing industry, when compared with industrial economies.35 However, Chandler notes the following: ‘While China does indeed have a small advantage in labour costs… that has relatively little impact on prices because solar-panel manufacturing is highly automated. The lower cost of labour in China provides an advantage of 7 cents per watt, relative to a factory in the
31 ibid. 32 PEGELS, A. Green Industrial Policy in Emerging Countries. [Online] Accessed on 4/3/2015 from: https://books.google.co.in/books?id=C4n8AgAAQBAJ&pg=PA77&lpg=PA77&dq=evolution+of+china%25+2 7s+solar+PV+manufacturing+industry&source=bl&ots=l5o1-LSY2O&hl=en&sa=X&ei=NpAFVLeXNs248gWR7ILQCg#v=onepage&q=evolutio%2C%202014.&f=false 33EUROPEAN COMISSION. Memo : EU imposes provisional anti-dumping duties on Chinese solar panels [Online] Accessed on 4/4/2015 from: http://europa.eu/rapid/press-release_MEMO-13-497_en.htm 34 ibid. 35 PEGELS, A. Green Industrial Policy in Emerging Countries. [Online] Accessed on 4/3/2015 from: https://books.google.co.in/books?id=C4n8AgAAQBAJ&pg=PA77&lpg=PA77&dq=evolution+of+china%25+2 7s+solar+PV+manufacturing+industry&source=bl&ots=l5o1-LSY2O&hl=en&sa=X&ei=NpAFVLeXNs248gWR7ILQCg#v=onepage&q=evolutio%2C%202014.&f=false accounting for almost half of the reduction, was
a decline in polysilicon prices (45%), followed by other material costs (19%), greater economies of scale in module manufacturing (11%) and technology advancements (10%), while all other factors contributed a total of 16% (GTM Research, 2014).
With prices of solar PV modules at all-time lows, prices in 2012 significantly overshot the expected learning curve (Figure 5.4). This was the result of significant overcapacity in module manufacturing and cut-throat competition that saw many module transactions occur at cash-cost, or in some cases even lower, as financially stressed manufacturers tried to maintain cash flows. In 2013, despite record solar PV installations of around 39 GW, global PV manufacturing capacity, including c-Si and thin-film, exceeded 63 GW (Photon Consulting, 2014). An additional 10 GW of new module production capacity may have been added in 2014 (GTM Research, 2014). The competitive pressures in the solar PV module manufacturing industry are therefore likely to remain intense, although – unlike in recent years – profitability for the major manufacturers has improved and is now on a more sustainable footing. The rapid decline in c-Si PV module prices due to manufacturing overcapacity has reduced the price
advantage of thin-film PV module manufacturers. This has led to considerable consolidation in the thin-film industry, which should put the remaining manufacturers on a more secure financial footing. However, it remains to be seen whether the specific technological advantages – such as better performance in low-light conditions or hot climates – are sufficient for thin-film modules to substantially increase their share of new installations from current levels.
Despite the pause in reductions in average module selling prices in 2014, current prices are still significantly below the learning curve. They are also now so low that continued cost reductions, based on learning rates of 18% to 22%, will not yield large absolute cost reductions, as in the past. This means – in most countries – that BoS costs, and in particular the soft costs, will provide the largest opportunity for future cost reductions in absolute terms and represent the next great challenge for the solar PV industry.
B
ALANCE OF SYSTEM COSTSBoS costs include all the cost components required for a solar PV system, excluding the module costs and includes the hardware costs (e.g. inverters, electrical cabling, racking, etc.) and the soft costs
1 10 100 1 000 10 000 100 000 1 000 000 100.0 10.0 1.0 0.1 1
Cumulative production volume (MW)
%22
doubling of cumulative volume %22
doubling of cumulative volume
2010 2004 1998 Polysilicon price Other material costs Technology advances Economies of scale: manufacturing Other Module price reduction breakdown by source
Global average module price (2014 USD/W)
22% price reduction for each cumulative volume
c-Si CdTe
2006 c-Si price increase due to polysilicon shortage 1992
2002
2012
Sources: Based on data from EPIA and the Photovoltaic Technology Platform, 2011; GlobalData, 2014; GTM Research, 2014; Liebreich, 2011; pvXchange, 2014 and IRENA analysis.
United States, but that amount is countered by other country-specific factors, such as higher inflation.’36
Rather it is the fact that a typical Chinese PV factory is four times larger than those in the US. It is this that makes a critical difference as economies can be found in other ways, such as by negotiating better contracts with clients and more effective use of equipment. Of further consideration is the efficiency of silicon PV modules. Not only are they the most efficient technology, but they have also enjoyed the greatest rise in efficiency from 15% in 2003, to 21% in 2012.37 With solar PV modules, as their efficiency increases less surface area is required to make a module of a certain wattage, thus the price per kWh is reduced. Efficiency improvements reduce the Levelized Cost of Energy (LCOE) of solar PV. Analysis by Lazard found that the LCOE of rooftop solar PV was expected to decline in the coming years. This is expected to be a result of more efficient installation techniques, lower costs of capital and improved supply chains.38 During the period 2010-2014 the global average for utility-scale solar PV is estimated to have declined by around half. Moving from $0.32/kWh to 0.16/kWh.39
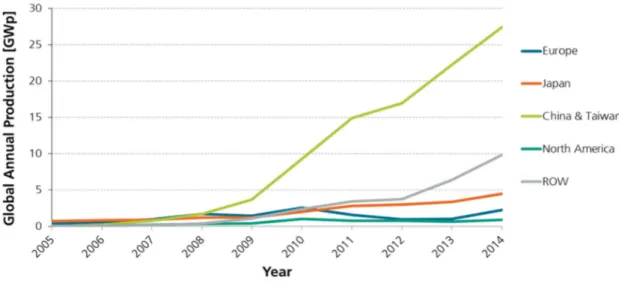
The combination of the various factors outlined above has increased Chinese production of solar PV technology and has made the technology itself increasingly economically attractive. Swanson’s Law is the observation that the price of PV modules tends to decrease 20% for every doubling of cumulative shipped volume. The method used is more commonly referred to as a learning curve. Figure 6 shows the Swanson effect over an extended period of time. Figure 7 shows the development of global PV production. Figure 6: Evolution PV price ($/Watt)40
36MIT NEWS. (2013). Solar-cell manufacturing costs: innovation could level the field. [Online] Accessed on 5/3/2015 from: http://news.mit.edu/2013/solar-cell-manufacturing-costs-0905 37 IRENA. (2015). Renewable Power Generation Costs in 2014. p 83. 38 LAZARD. (2015). Lazard Levelized Cost of Energy Analysis 9.0 – Key findings. p.1. 39 IRENA. (2015). Renewable Power Generation Costs in 2014. p 94. 40 ECONOMIST. (2012). Pricing Sunshine. [Online] Accessed on 5/3/2015 from: http://www.economist.com/blogs/graphicdetail/2012/12/daily-chart-19
0 5000 10000 15000 20000 25000 30000 35000 40000 2000 2001 2002 2003 2004 2005 2006 2007 2008 2009 2010 2011 2012 2013 2014 El ec tr ic it y O u tp u t ( G W h )
Major Economies
Australia France Germany Japan
Spain United Kingdom United States
Figure 7: Global Annual PV Production41
As evident from figure 6 the price of silicon PV cells has fallen from $76.67 in the late 1970’s to just $0.74 in 2013. According to energytrend.com at the time of writing the average current cost of a Chinese Multi-Si Cell stands at $0.32. This dramatic fall in prices is responsible for solar PV installations becoming increasingly economically viable. Figures 8 and 9 show the increasing amount of electricity from solar PV installations.
41 WARMUTH, W. (2016). Photovoltaics Report. Fraunhofer Institute for Solar Energy Systems ISE. [Online] Available from https://www.ise.fraunhofer.de/de/downloads/pdf-files/aktuelles/photovoltaics-report-in-englischer-sprache.pdf
Figure 8: Electricity Output (GWh) from Solar PV Installations in Major Economies42
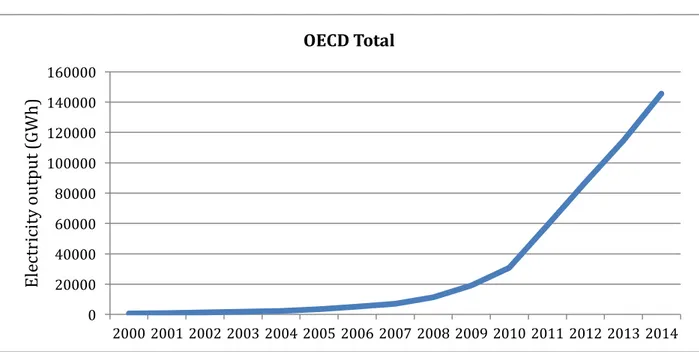
Figure 9: Electricity Output (GWh) from Solar PV installations in OECD countries43
Both figures 8 and 9 show that electricity output has risen dramatically in many countries over the past seven to eight years. When figure 9 is compared with figure 7, it is evident that increased global annual production has resulted in increased electricity output from solar PV installations. Although this is a fairly straightforward conclusion, it may be noted that figure 9 shows an accelerated level of electricity output since 2010. Furthermore, figure 8 shows that while Germany’s increasing electricity output from solar PV has slowed slightly, the country remains significantly ahead of other major economies. The UK, Spain, France and Australia enjoy very modest growth of electricity output whereas the United States and Japan have experienced accelerated levels of growth in recent years. Due to Germany’s slow down, both the United States and Japan appear on course to overtake it. The reason for Germany’s position is due to its Energiewende. This is the German word for transition of the country to an energy mix dominated by renewable sources of energy that has been in place since the German Renewable Energy Act of 2000.
It is likely that these levels of growth will continue as in 2015 renewables continued to break records. According to Bloomberg New Energy Finance, new investment in clean energy reached $329Bn in 2015, breaking the previous record of $318Bn set in 2011. 2015 also set a new record in the amount of capacity added – 121GW.44
These figures can be regarded as very positive, especially when one considers how the price of oil, coal and gas have evolved since mid-2014.45 Despite this, the figures mask the truth about European investment in clean energy. In 2015 European investment
42 INTERNATIONAL ENERGY AGENCY. [Online] Accessed on 8/3/2015 from: http://wds.iea.org/WDS/Common/Login/login.aspx 43 ibid. 44 BLOOMBERG NEW ENERGY FINANCE. (2016) Clean Energy Investment: Q4 2015. 45 Brent oil traded at $114 in June 2014 and at the time of writing stands at below $40. 0 20000 40000 60000 80000 100000 120000 140000 160000 2000 2001 2002 2003 2004 2005 2006 2007 2008 2009 2010 2011 2012 2013 2014
El
ec
tr
ic
it
y
ou
tp
ut
(G
W
h)
OECD Total
only accounted for $72Bn of the total $329Bn, its lowest investment in clean energy since 2006. As investment from the Americas has remained relatively consistent in the past six years, (fluctuating in a range of $66Bn-$85Bn), Europe has been supplanted by Asia, and in particular China, as the major driving force for renewables. Chinese spending on renewable energy infrastructure reached $111Bn in 2015, a 17% increase from the previous year and almost as much as the United States and Europe combined. Perhaps the most significant trend in renewable energy finance is the fact that the world is now adding more capacity for renewable sources than for coal, oil and gas combined. This was first realized in 2013 when the 143GW of renewable capacity was added and 141GW of capacity from fossil fuel sources. Bloomberg New Energy Finance stated in its New Energy Outlook 2015 publication the following: ‘By 2040, the world’s power-generating capacity mix will have transformed: from today’s system composed of two-thirds fossil fuels to one with 56% from zero-emission energy sources. Renewables will command just under 60% of the 9,786GW of new generating capacity installed over the next 25 years, and two-thirds of the $12.2 trillion of investment.’46 In light of the evidence presented in this section, it is clear that a seismic shift towards renewable energy is already underway. Let us now turn our attention to battery storage technologies and their applications.
46 Bloomberg New Energy Finance. (2015). New Energy Outlook 2015.
Chapter 1: Technical Aspects of Battery Storage Technologies
As stated, chapter one aims to provide a comprehensive overview of the different types of battery storage. It further aims to show various technical applications of battery storage technology in combination with renewable energy. This is in order to show the services that it is able to perform on the electricity system.
As noted in a 2015 report by the International Renewable Energy Agency (IRENA), ‘Energy storage consists of a suite of technologies at various stages of development.’47 On the opposite ends of the spectrum are pumped hydropower and battery storage. The former represents 99% of the storage in use and is economically and technically proven throughout the world.48 The latter on the other hand, is new market development. Despite the limited current deployment of battery storage, it is critical for the purpose of this investigation that its various technical aspects are understood.
Battery Storage Technologies
The invention of the battery is accredited to Alessandro Volta, an Italian physicist and chemist who in 1799 invented the first operational battery. His voltaic pile, which consisted of coins of copper and zinc separated by cardboard soaked in saltwater, was not rechargeable. It wasn’t until 60 years later that the French physicist Gaston Planté invented the world’s first rechargeable battery. 49 The type of battery invented was a lead-acid battery and even though the concept is over 150 years old the battery is still known for its cost effectiveness today. In this section lead-acid, lithium-ion as well as other battery types will be investigated.Lead-acid
According to IRENA, lead-acid batteries are already extensively deployed to support renewable development.50 An example of this is that fact that between 1995-2009 Morocco deployed approximately 50,000 solar home systems coupled to batteries in order to provide rural electrification, while in Bangladesh there are 3.5 million solar home systems, each coupled to a battery. Typically, they are found in transport vehicles. Pros • Easy and cheap to produce • Mature technology (150 years of development) • High surge to weigh ratio (making them suitable for vehicles) • Easy to recycle
47 IRENA. (2015). Battery storage for renewables: Market Status and Technology Outlook 48 ibid. 49 EUROPEAN COMMISSION. DG ENER Working Paper: The future role and challenges of Energy Storage. 50 IRENA. (2015). Battery storage for renewables: Market Status and Technology Outlook. P.41.
Cons • large and heavy • Short lifespan • Environmental concerns (Lead is a highly toxic element) • Corrosion (chemical reactions) In addition to the cons outlined, many lead-acid batteries can suffer from low Depth of Discharge, (the amount of the battery’s capacity that has been utilized and expressed as a percentage of the battery’s full energy capacity). This can be lower than 20%.51 The batteries can also have low cycle numbers (<500) and a limited lifetime of 3-4 years. Their energy density is 50Wh/kg.
Research by Garcia has shown that more recent versions of the technology can achieve 2,800 cycles at a Depth of Discharge of 50%, insuring a service life of up to 17 years for industrial systems.52 Of final consideration is that ambient temperature may affect battery performance. This is due to the fact that high temperatures can cause internal reactions to occur, thus many batteries can lose capacity in hotter climates. Conversely, in very cold climates reactions may be slow and could even stop altogether. Lead-acid consequently, is a battery technology that ‘may require integrated temperature management in the battery installation for optimal performance and safety.’53
Oberhofer, writing on behalf of the Global Energy Network Institute (GENI), expresses the belief that lead-acid battery technology has reached an end point in terms of its development. He writes, ‘It is clear that no significant improvements can be made in capacity, density or weight. Therefore, resources on future development should concentrate on other battery technologies with higher potentials.’54 Although their cost effectiveness has made them an important part of many technology systems, Oberhofer notes that the batteries are unlikely to make an impact on grid storage, He writes:
‘These batteries are not capable of storing huge amount of energy compared to other systems like a Pumped Storage Hydroelectricity plant (PSH), while staying cost effective as the energy density is just too low. It is possible to integrate battery banks for few smaller decentralized systems (like photovoltaic [PV] systems on rooftops); but, it cant be used as a definite solution, just for the simple reason that the amount of resources are not available for the required capacity scale.’55
Despite this criticism it is important to note that ‘Advanced lead-acid’ batteries also exist. The “Ultrabattery”, developed by the Commonwealth Scientific and Industrial Research Organization of Australia, uses an ultracapacitor that enables the battery to operate longer and more effectively in partial state of charge applications than
51 ibid. 52 GARCIA, R.A. (2013). Off-Grid Commercial Micro-grid System Provides Energy Storage for Resort in India. Trojan Battery Company. Intersolar Europe, Munich. 53 IRENA. (2015). Battery storage for renewables: Market Status and Technology Outlook. p.7. 54 OBERHOFER, A. (2012). Energy Storage Technologies & Their Role in Renewable Regeneration. Global Energy Network Institute. p.12. 55 ibid.
traditional lead acid batteries.56 This battery has been tested for hybrid vehicles but has also been proposed and demonstrated for power sector applications such as frequency response and smoothing.57 Investigation into the applications of battery storage will follow shortly.
Lithium-ion
Due to the fact that Lithium is the lightest metal lithium-ion batteries have a high energy density. In addition, they also possess a high power density (the rate at which energy changes) when compared to other batteries. The combination of these two characteristics allows them to take up a minimum of physical space while providing high levels of power (kW) and energy (kWh). Furthermore, their performance, both in terms of energy and power, continues to improve. This is one reason why they are so popular in consumer electronic and power sector applications.58 Pros • Highly efficient (typically 80-90%) • High power (typically 3.7V compared to 2.0V for lead acid) • High energy density • Low energy loss
• Materials available in large amounts (lithium, available in seawater and obtainable through technical methods and graphite) Cons • Expensive • Cells can become damaged with complete discharges • Deteriorate if unused • Safety concerns The combination of high power and energy density make lithium-ion batteries an ideal technology for frequency regulation and other applications that require a relatively short discharge and high power performance. According to IRENA, one of the greatest obstacles facing the technology is safety: Lithium is highly reactive element and is combustible. This combined with the high energy density of the cells mean that they can overheat and catch fire.59 Although safety is an obstacle to be overcome, their costs too hinder the application of the technology. Part two will show the development in prices. This will be of importance because as Oberhofer notes, ‘lithium-ion batteries have an incredibly huge potential.’60
56 IRENA. (2015). Battery storage for renewables: Market Status and Technology Outlook. p.42. 57 ibid. 58 ibid.p.43 59 ibid.p.43. This can lead to a situation known as thermal runaway when neighbouring cells also overheat. This leads to leaks, smoke, gas venting and/or the cell pack coming alight. 60 OBERHOFER, A. (2012). Energy Storage Technologies & Their Role in Renewable Regeneration. Global Energy Network Institute. p.14.
Currently there are various companies that are seeking to realize this potential. They include: • IBM – The Battery 500 Project • Tesla – Powerwall and cars (Roadster, Model S, X and 3) • Panesonic – Energy logic system • Sonnen – SonnenBatterie • Redback Technologies – Ouija Board • Arpa-E61
Flow Batteries
Flow batteries are similar to other types except that the electrolytes can be exchanged. This means that as the battery is discharged the fluids are replaced with loaded ones. This makes them less affected by overcharge or discharge and means that they can be used without a significant degradation of performance. It is relatively easy to add capacity to them, as their power is a function of the number of cells that are stacked.62 They enjoy a long life span but their major limitation is regarding their energy density, which at around 35 Wh/Kg is of a similar level to lead-acid batteries. Although worth mentioning, flow batteries will not be explored within this paper.
Sodium/Molten Salt
Sodium batteries are a further technology under development, but they are already operational in some countries. NGK of Japan has made sodium batteries for grid storage for a number of years and approximately 250MW of the batteries have been installed within the country.63 The technology possesses several advantages: They have a high energy density (240 Wh/kg), a long life span of 10-15 years and a high efficiency rating. The batteries contain no rare elements and are fully recyclable
Their major limitation however, is that they typically need to be operated at temperatures approaching 350oC in order for the sodium to be liquid. This makes them difficult and expensive to operate but most of all dangerous as liquid sodium reacts easily with water in the atmosphere.64
61 Arpa-E is technically a branch of the US Department of Energy. It was founded in 2009 under Obamas economic recovery plan to fund early stage research into the generation and storage of energy. Projects are said to rely on materials ‘beyond current lithium-ion batteries.’ GUARDIAN [Online] Accessed on 4/3/2015 from: http://www.theguardian.com/environment/2016/mar/03/us-agency-says-has-beaten-elon-musk-gates-to-holy-grail-battery-storage 62 IRENA. (2015). Battery storage for renewables: Market Status and Technology Outlook. p.44. 63 GREENTECHMEDIA. (2011). Is Sodium the Future Formula for Energy Storage? [Online] Accessed on 4/3/2015 from: http://www.greentechmedia.com/articles/read/is-sodium-the-future-formula-for-energy-storage 64 OBERHOFER, A. (2012). Energy Storage Technologies & Their Role in Renewable Regeneration. Global Energy Network Institute. p.16.
Summary table of key factors
Source: IRENA.Applications of battery storage technology
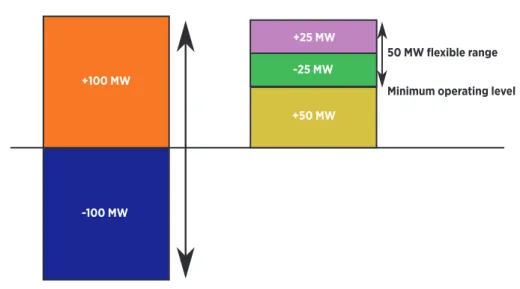
It is unquestionable that battery storage in the power sector can be deployed in a variety of ways and over multiple time periods. A 2013 report by EPRI and DOE describe 14 services under 5 umbrella groups that can be provided by energy storage.65 Below is a summary of the groups: Figure 10: Services provided by energy storage66
Within this section, four application areas will be discussed that are most directly related to solar PV power integration. As shown in figure 7 in ‘Trends in Energy Finance’, the electricity output from solar PV installations has risen sharply since 2010 and is forecasted to increase in the future. Through this approach the services that are
65 IRENA. (2015). Battery storage for renewables: Market Status and Technology Outlook. p.11. 66 ibid.
Lead Acid Advanced Lead Lithium-ion Sodium - Sulphur Flow
Power Range (MW) 1 - 50 1 - 50 <100 5 - 100 1 - 100
Storage Duration 2 - 4h 1min - 8h 1min - 8h 1min - 8h 1 - 5h
Energy Density (Wh/kg) 30-40 50 110 - 160 240 35 Cycles 1,000 - 5,000 4,500 - 10,000 500-1000+ 2,500 - 4,500 >10,000 Operating life (years) 3 - 15 5 - 15 5 - 15 5 - 15 15 - 20 Price per kWh ($) 50-140 140+ 240 - 2,200 400 N/A Efficiency % 70 - 90 90 - 94 85 - 98 80 - 90 65 - 85
27
highlighted in red above will be focused upon. Specifically, and in line with the objective of this investigation, the applications compensate for the variable nature of renewable energy. It is also important to note that a single battery installation is able to serve multiple uses. As noted by IRENA, ‘a combination of value streams may benefit the economics of an installation.’67
Battery Storage – Islands and off-grid applications
Many islands and off-grid areas use diesel generators as sources of power. The location is usually remote and the lack of infrastructure means that diesel imports are often costly. In addition to being expensive, this type of electrification has high levels of emissions and has problems regarding security of supply. Despite these issues, diesel has traditionally been used as the ‘most accessible and cost effective solution.’68
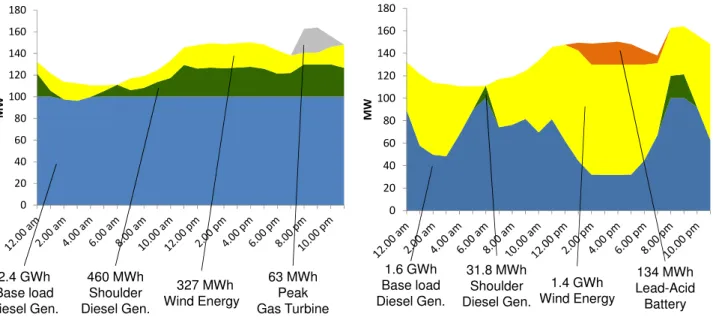
Many islands have a lack of flexible sources and as a result would benefit from the application of battery storage, as it would help to reliably integrate significant amounts of renewable energy from solar or wind and thereby reduce the reliance on diesel or gas generation. Figures 11 and 12 below show the increased integration of renewable energy when combining utility scale wind, diesel powered electricity generation and lead-acid batteries. Figure 11 (left): no energy storage Figure 12 (right): with lead-acid battery storage.69 The two figures demonstrate the ability of battery storage to increase the penetration of renewable energy and decrease both diesel and peak gas use. In figure 11, renewable
67 ibid. 68 ibid. p.12.
69 BALZA, L. et al. (2014), Potential for Energy Storage in Combination with Renewable Energy in Latin America and the Caribbean, Inter America Development bank
tons daily. The figure below shows how wind power and conventional generation are used for covering the system’s daily load.
Figure 4.4: Impact of Optimizing RE in a Small Island Country
0 20 40 60 80 100 120 140 160 180 MW 327 MWh Wind Energy 2.4 GWh Base load Diesel Gen. 460 MWh Shoulder Diesel Gen. 63 MWh Peak Gas Turbine Source: Own calculations
In the figure above, utility scale wind power is displacing some peak generation, but is constrained by the inability to exceed 15 percent of demand at any given time. Therefore, there are significant unrealized benefits in this scenario.
When assuming a capital cost for solar PV of US$1,700 per kW and limiting the amount of wind power capacity to a maximum of 10MW, the model determines that the optimal amount of solar PV capacity that should be integrated in the electric grid is 29.5MW. Figure 4.5 below shows how solar PV, wind power, and conventional generation are used for supply electricity throughout the day.
Figure 4.6: Impact of Optimizing RE with ES in a Small Island Country
0 20 40 60 80 100 120 140 160 180 MW 1.4 GWh Wind Energy 134 MWh Lead-Acid Battery 1.6 GWh Base load Diesel Gen. 31.8 MWh Shoulder Diesel Gen.
Source: Own calculations
In the figure above, ES increases the amount of RE used daily by 1GWh and reduces carbon dioxide emissions by 1,423 tons daily. The figure shows that by adding ES, all of the expensive peak generation is displaced by lower-cost RE and ES. In addition, a sizable amount of shoulder and base load capacity is replaced by lower-cost RE; however, as the figure shows, at a certain point it becomes too expensive to pay for more ES to back up RE replacing shoulder and base load capacity. For that reason, the model does not determine that lower-cost RE should replace all conventional generation.
In the RE with ES scenario that constrains the amount of wind power capacity to 10MW and uses aggressive assumptions for solar PV, the model determines that given the availability of ES, the optimal amount of solar PV capacity that should be integrated in the electric grid is 49.5MW (in addition to 10MW of wind power capacity). The model also determines that the electric grid should integrate a 5.4MWh lead-acid battery ES
energy from wind contributes to the peak demand. Its penetration however, is restricted by ‘the inability to exceed 15% of demand at any given time.’70 Balza et al. assume this to be the maximum renewable penetration without storage and consequently believe there to be significant unrealized benefits to the scenario. Their model determines that the electricity grid should integrate a 75.6MWh lead-acid battery system. Figure 12 shows the impact that combining renewable energy with battery storage would have on the daily load profile of the island. (The island under consideration is Barbados).
The use of battery storage was able to increase the amount of renewable energy used daily by 1GWh and reduces carbon dioxide emissions by 1,423 tones daily.71 This would mean that emissions of over half a million tones of CO2 would be avoided every year through the incorporation of a 75.6MWh battery system. The expensive peak generation would be displaced by lower cost renewable energy and storage, while the base load would also be replaced. It is important to note that there is a point at which it becomes too expensive for more storage to replace shoulder and base load capacity. As Belza et al. write, ‘for that reason, the model does not determine that lower cost renewable energy should replace all generation.’72 In summary the scenario encompasses all of the services highlighted in red in figure 10. It is an economically viable option for achieving much greater utilization of renewable energy by displacing diesel and gas generation.
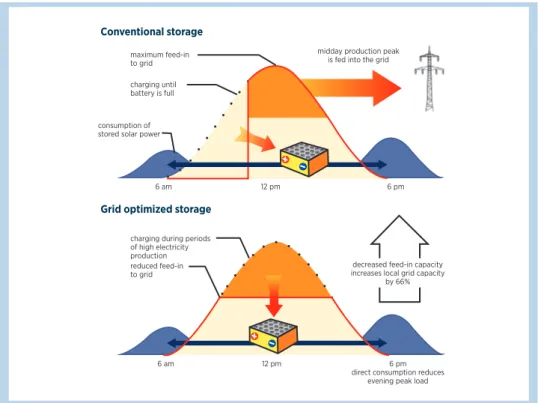
Household solar PV
Battery storage at a household level represents perhaps one the most interesting avenues of investigation. This is principally because it allows for a far greater level of self-consumption of electricity produced by solar PV. Battery storage has the ability to align the electricity demand of the user with solar production. It also has the added benefit of relieving local grid capacity constraints.73